Zip Codes with the Highest Percentage of Population with a Degree in Liberal Arts and History in Arlington Heights, IL
RELATED REPORTS & OPTIONS
Liberal Arts and History
Arlington Heights
Compare Zip Codes
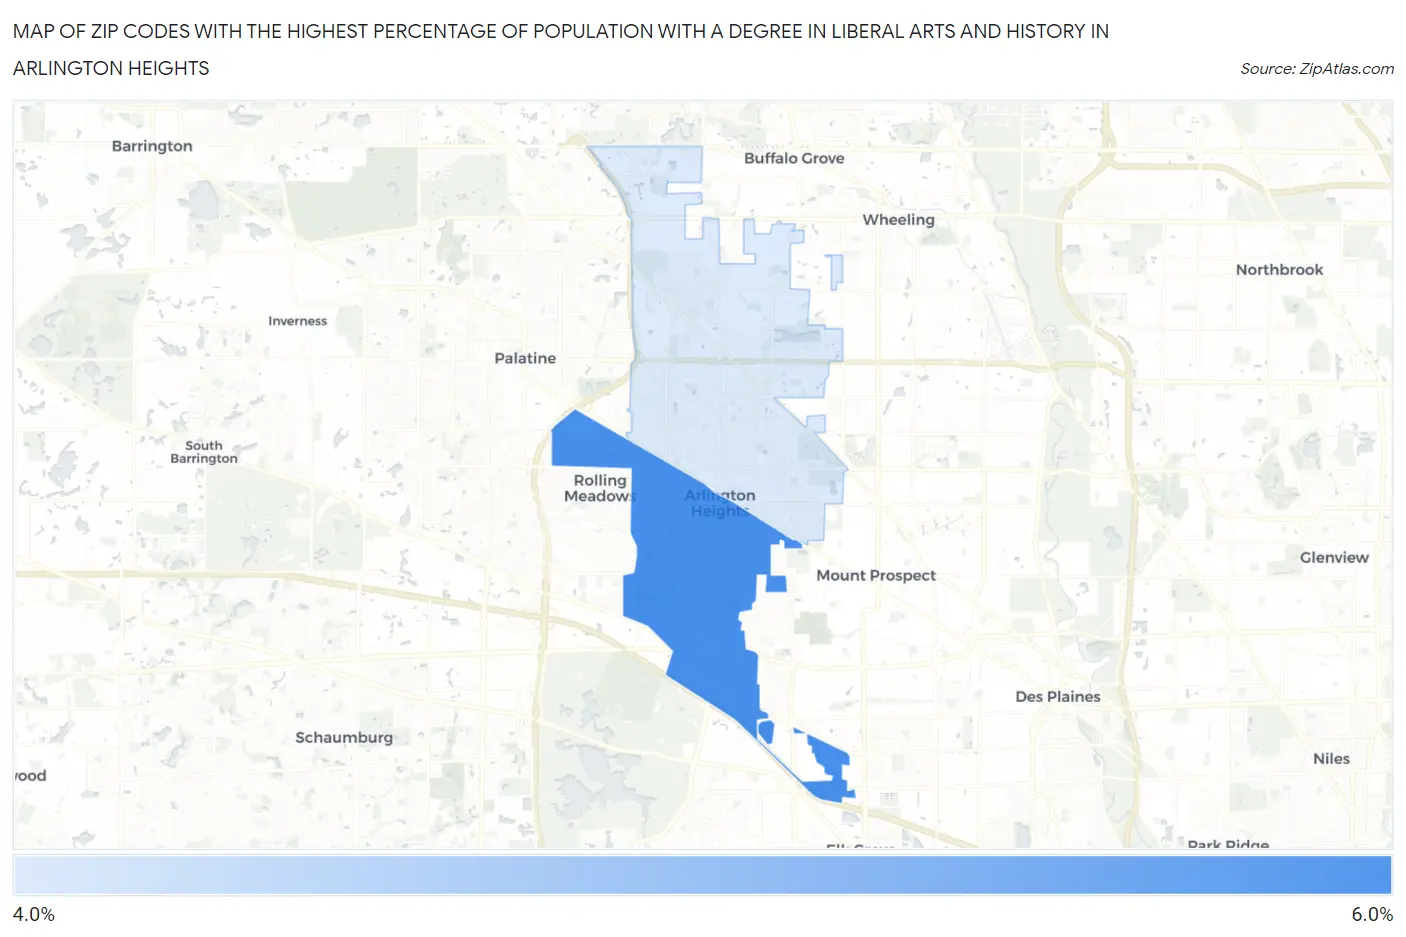
Map of Zip Codes with the Highest Percentage of Population with a Degree in Liberal Arts and History in Arlington Heights
4.5%
5.7%
Zip Codes with the Highest Percentage of Population with a Degree in Liberal Arts and History in Arlington Heights, IL
| Zip Code | % Graduates | vs State | vs National | |
| 1. | 60005 | 5.7% | 4.7%(+1.03)#349 | 4.9%(+0.870)#9,184 |
| 2. | 60004 | 4.5% | 4.7%(-0.231)#503 | 4.9%(-0.390)#13,020 |
1
Common Questions
What are the Top Zip Codes with the Highest Percentage of Population with a Degree in Liberal Arts and History in Arlington Heights, IL?
Top Zip Codes with the Highest Percentage of Population with a Degree in Liberal Arts and History in Arlington Heights, IL are:
What zip code has the Highest Percentage of Population with a Degree in Liberal Arts and History in Arlington Heights, IL?
60005 has the Highest Percentage of Population with a Degree in Liberal Arts and History in Arlington Heights, IL with 5.7%.
What is the Percentage of Population with a Degree in Liberal Arts and History in Arlington Heights, IL?
Percentage of Population with a Degree in Liberal Arts and History in Arlington Heights is 4.7%.
What is the Percentage of Population with a Degree in Liberal Arts and History in Illinois?
Percentage of Population with a Degree in Liberal Arts and History in Illinois is 4.7%.
What is the Percentage of Population with a Degree in Liberal Arts and History in the United States?
Percentage of Population with a Degree in Liberal Arts and History in the United States is 4.9%.