Malta, IL Map & Demographics
Malta Map
Malta Overview
$30,948
PER CAPITA INCOME
$103,500
AVG FAMILY INCOME
$82,212
AVG HOUSEHOLD INCOME
42.5%
WAGE / INCOME GAP [ % ]
57.5¢/ $1
WAGE / INCOME GAP [ $ ]
0.39
INEQUALITY / GINI INDEX
1,535
TOTAL POPULATION
790
MALE POPULATION
745
FEMALE POPULATION
106.04
MALES / 100 FEMALES
94.30
FEMALES / 100 MALES
33.7
MEDIAN AGE
3.5
AVG FAMILY SIZE
2.9
AVG HOUSEHOLD SIZE
793
LABOR FORCE [ PEOPLE ]
71.2%
PERCENT IN LABOR FORCE
2.9%
UNEMPLOYMENT RATE
Malta Zip Codes
Malta Area Codes
Income in Malta
Income Overview in Malta
Per Capita Income in Malta is $30,948, while median incomes of families and households are $103,500 and $82,212 respectively.
| Characteristic | Number | Measure |
| Per Capita Income | 1,535 | $30,948 |
| Median Family Income | 346 | $103,500 |
| Mean Family Income | 346 | $112,896 |
| Median Household Income | 525 | $82,212 |
| Mean Household Income | 525 | $92,848 |
| Income Deficit | 346 | $0 |
| Wage / Income Gap (%) | 1,535 | 42.53% |
| Wage / Income Gap ($) | 1,535 | 57.47¢ per $1 |
| Gini / Inequality Index | 1,535 | 0.39 |
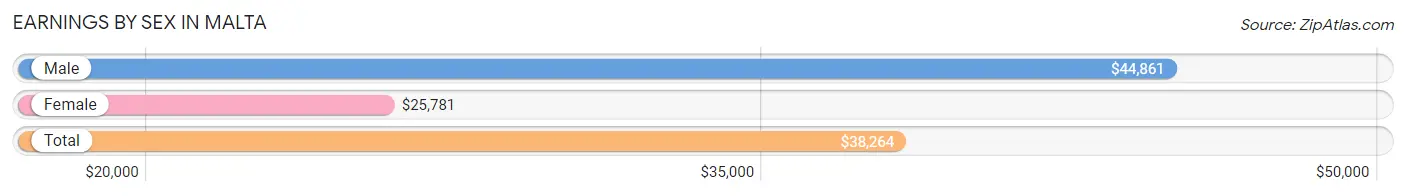
Earnings by Sex in Malta
Average Earnings in Malta are $38,264, $44,861 for men and $25,781 for women, a difference of 42.5%.
| Sex | Number | Average Earnings |
| Male | 480 (56.9%) | $44,861 |
| Female | 363 (43.1%) | $25,781 |
| Total | 843 (100.0%) | $38,264 |
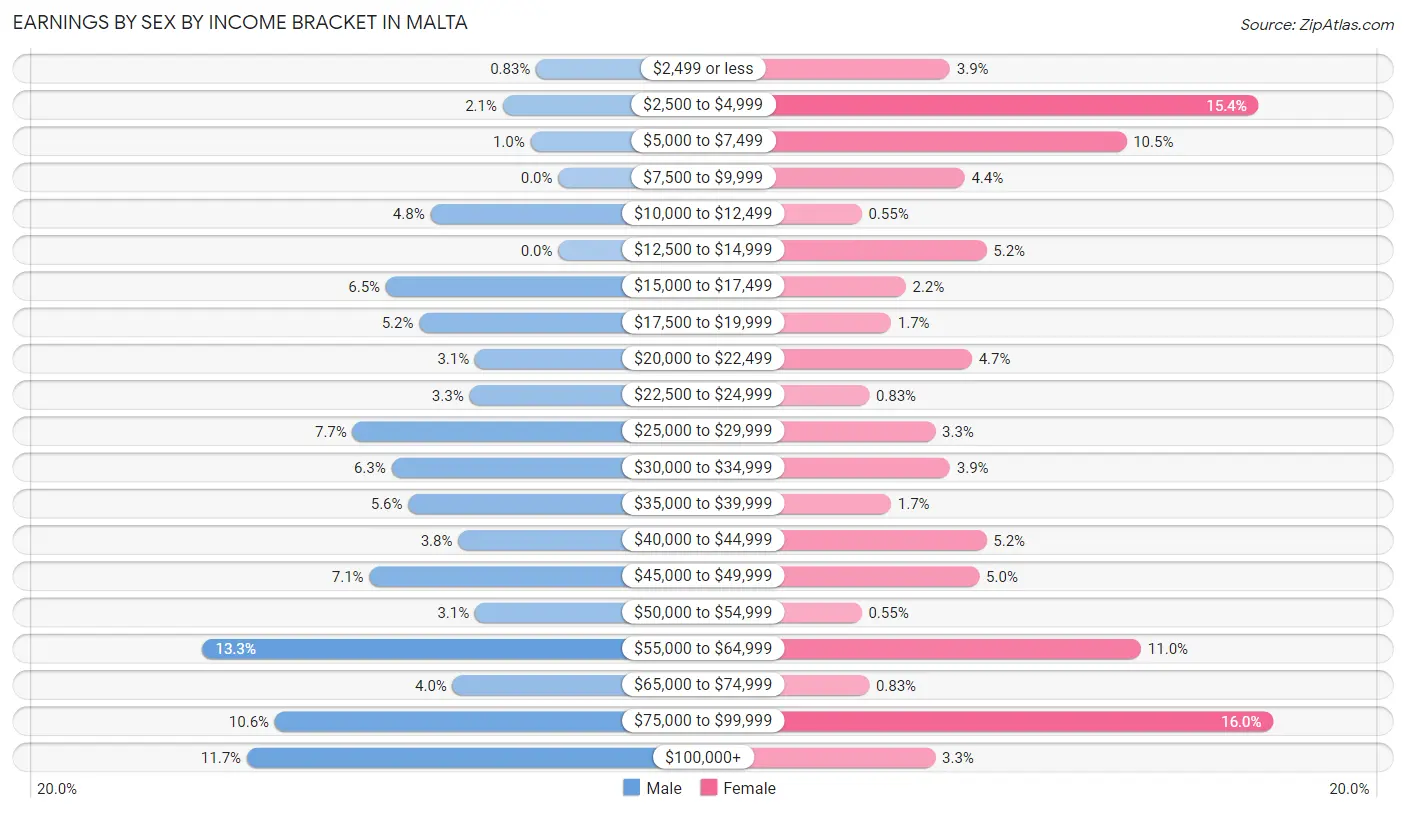
Earnings by Sex by Income Bracket in Malta
The most common earnings brackets in Malta are $55,000 to $64,999 for men (64 | 13.3%) and $75,000 to $99,999 for women (58 | 16.0%).
| Income | Male | Female |
| $2,499 or less | 4 (0.8%) | 14 (3.9%) |
| $2,500 to $4,999 | 10 (2.1%) | 56 (15.4%) |
| $5,000 to $7,499 | 5 (1.0%) | 38 (10.5%) |
| $7,500 to $9,999 | 0 (0.0%) | 16 (4.4%) |
| $10,000 to $12,499 | 23 (4.8%) | 2 (0.5%) |
| $12,500 to $14,999 | 0 (0.0%) | 19 (5.2%) |
| $15,000 to $17,499 | 31 (6.5%) | 8 (2.2%) |
| $17,500 to $19,999 | 25 (5.2%) | 6 (1.7%) |
| $20,000 to $22,499 | 15 (3.1%) | 17 (4.7%) |
| $22,500 to $24,999 | 16 (3.3%) | 3 (0.8%) |
| $25,000 to $29,999 | 37 (7.7%) | 12 (3.3%) |
| $30,000 to $34,999 | 30 (6.2%) | 14 (3.9%) |
| $35,000 to $39,999 | 27 (5.6%) | 6 (1.7%) |
| $40,000 to $44,999 | 18 (3.7%) | 19 (5.2%) |
| $45,000 to $49,999 | 34 (7.1%) | 18 (5.0%) |
| $50,000 to $54,999 | 15 (3.1%) | 2 (0.5%) |
| $55,000 to $64,999 | 64 (13.3%) | 40 (11.0%) |
| $65,000 to $74,999 | 19 (4.0%) | 3 (0.8%) |
| $75,000 to $99,999 | 51 (10.6%) | 58 (16.0%) |
| $100,000+ | 56 (11.7%) | 12 (3.3%) |
| Total | 480 (100.0%) | 363 (100.0%) |
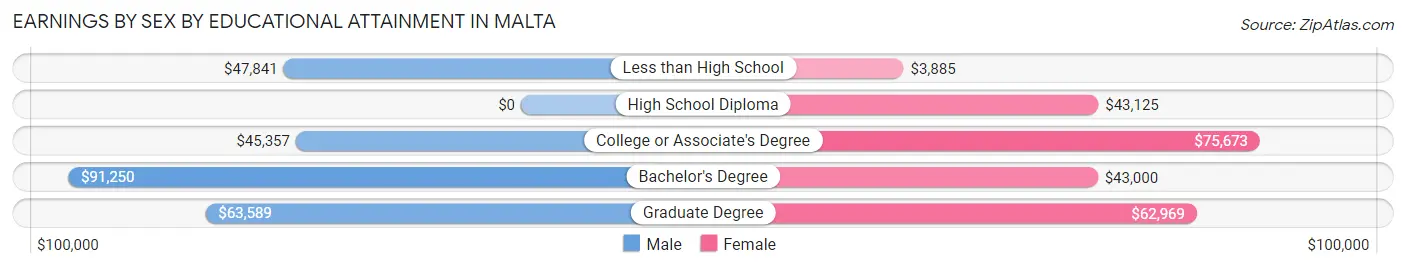
Earnings by Sex by Educational Attainment in Malta
Average earnings in Malta are $49,464 for men and $42,614 for women, a difference of 13.9%. Men with an educational attainment of bachelor's degree enjoy the highest average annual earnings of $91,250, while those with college or associate's degree education earn the least with $45,357. Women with an educational attainment of college or associate's degree earn the most with the average annual earnings of $75,673, while those with less than high school education have the smallest earnings of $3,885.
| Educational Attainment | Male Income | Female Income |
| Less than High School | $47,841 | $3,885 |
| High School Diploma | - | - |
| College or Associate's Degree | $45,357 | $75,673 |
| Bachelor's Degree | $91,250 | $43,000 |
| Graduate Degree | $63,589 | $62,969 |
| Total | $49,464 | $42,614 |
Family Income in Malta
Family Income Brackets in Malta
According to the Malta family income data, there are 132 families falling into the $100,000 to $149,999 income range, which is the most common income bracket and makes up 38.2% of all families.
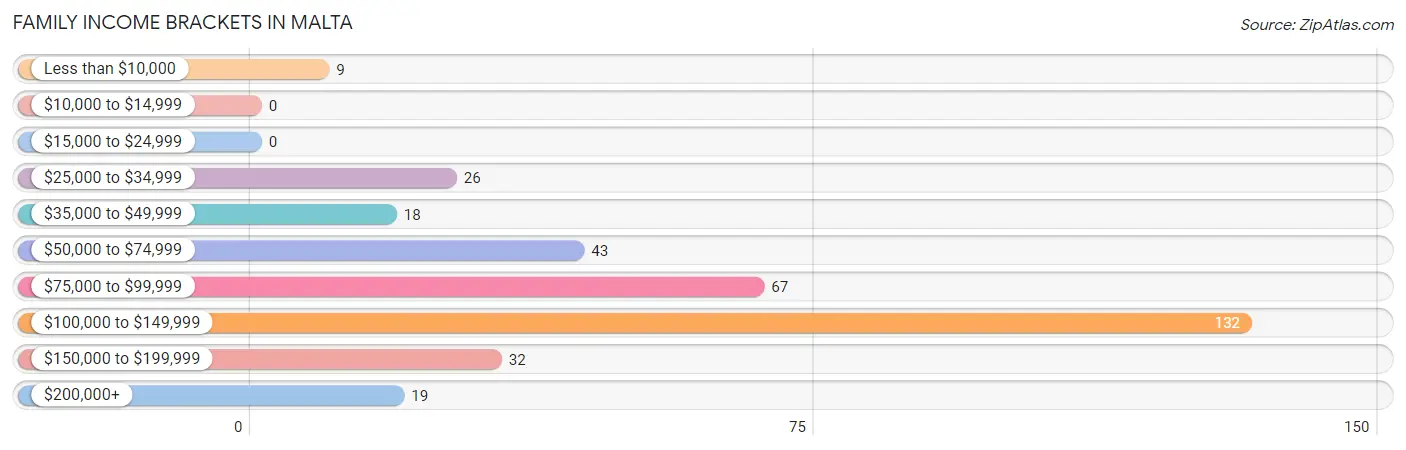
| Income Bracket | # Families | % Families |
| Less than $10,000 | 9 | 2.6% |
| $10,000 to $14,999 | 0 | 0.0% |
| $15,000 to $24,999 | 0 | 0.0% |
| $25,000 to $34,999 | 26 | 7.5% |
| $35,000 to $49,999 | 18 | 5.2% |
| $50,000 to $74,999 | 43 | 12.4% |
| $75,000 to $99,999 | 67 | 19.4% |
| $100,000 to $149,999 | 132 | 38.2% |
| $150,000 to $199,999 | 32 | 9.2% |
| $200,000+ | 19 | 5.5% |
Family Income by Famaliy Size in Malta
5-person families (44 | 12.7%) account for the highest median family income in Malta with $144,500 per family, while 2-person families (120 | 34.7%) have the highest median income of $53,500 per family member.
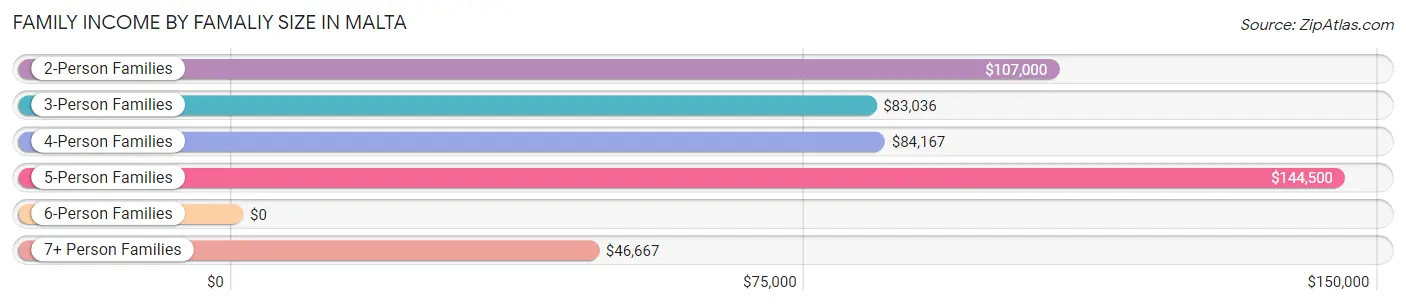
| Income Bracket | # Families | Median Income |
| 2-Person Families | 120 (34.7%) | $107,000 |
| 3-Person Families | 61 (17.6%) | $83,036 |
| 4-Person Families | 102 (29.5%) | $84,167 |
| 5-Person Families | 44 (12.7%) | $144,500 |
| 6-Person Families | 3 (0.9%) | $0 |
| 7+ Person Families | 16 (4.6%) | $46,667 |
| Total | 346 (100.0%) | $103,500 |
Family Income by Number of Earners in Malta
The median family income in Malta is $103,500, with families comprising 3+ earners (42) having the highest median family income of $144,375, while families with 1 earner (116) have the lowest median family income of $60,833, accounting for 12.1% and 33.5% of families, respectively.
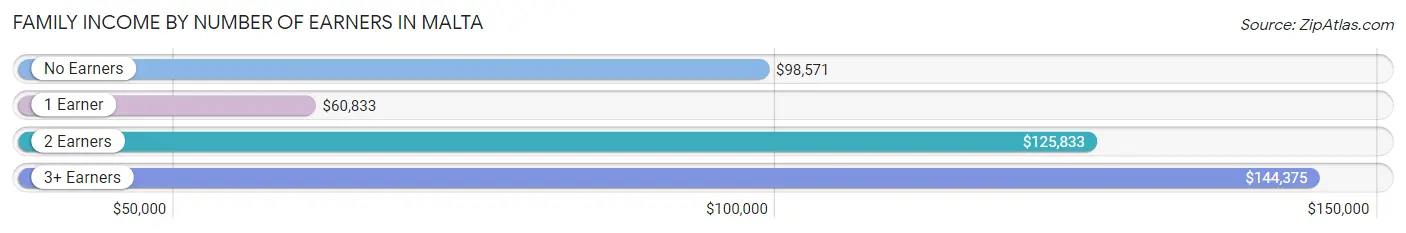
| Number of Earners | # Families | Median Income |
| No Earners | 12 (3.5%) | $98,571 |
| 1 Earner | 116 (33.5%) | $60,833 |
| 2 Earners | 176 (50.9%) | $125,833 |
| 3+ Earners | 42 (12.1%) | $144,375 |
| Total | 346 (100.0%) | $103,500 |
Household Income in Malta
Household Income Brackets in Malta
With 163 households falling in the category, the $100,000 to $149,999 income range is the most frequent in Malta, accounting for 31.0% of all households. In contrast, only 5 households (0.9%) fall into the less than $10,000 income bracket, making it the least populous group.
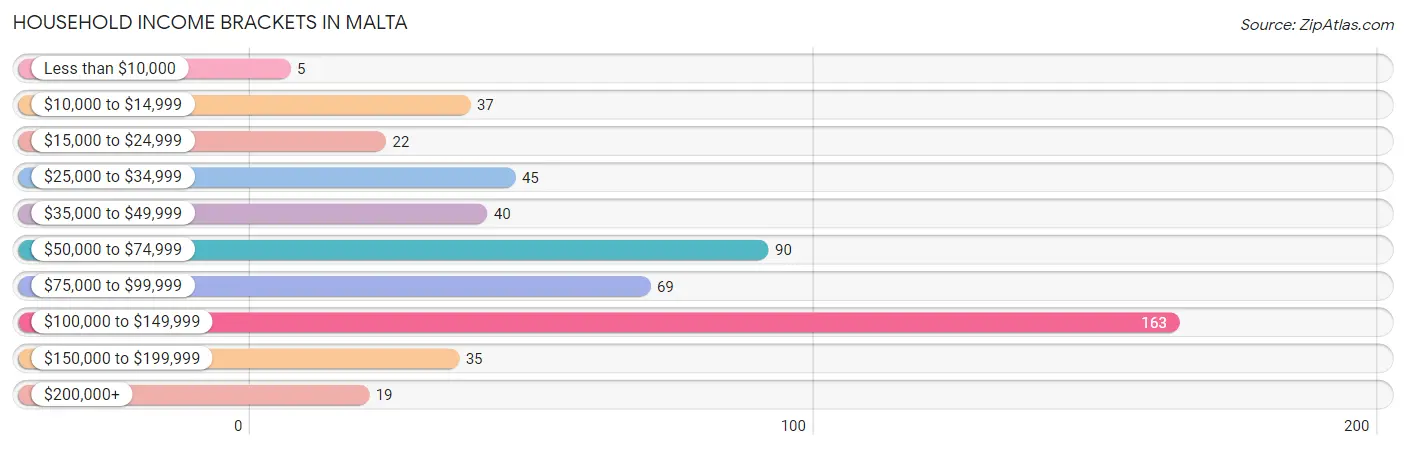
| Income Bracket | # Households | % Households |
| Less than $10,000 | 5 | 1.0% |
| $10,000 to $14,999 | 37 | 7.0% |
| $15,000 to $24,999 | 22 | 4.2% |
| $25,000 to $34,999 | 45 | 8.6% |
| $35,000 to $49,999 | 40 | 7.6% |
| $50,000 to $74,999 | 90 | 17.1% |
| $75,000 to $99,999 | 69 | 13.1% |
| $100,000 to $149,999 | 163 | 31.0% |
| $150,000 to $199,999 | 35 | 6.7% |
| $200,000+ | 19 | 3.6% |
Household Income by Householder Age in Malta
The median household income in Malta is $82,212, with the highest median household income of $98,516 found in the 45 to 64 years age bracket for the primary householder. A total of 205 households (39.1%) fall into this category. Meanwhile, the 15 to 24 years age bracket for the primary householder has the lowest median household income of $50,208, with 35 households (6.7%) in this group.
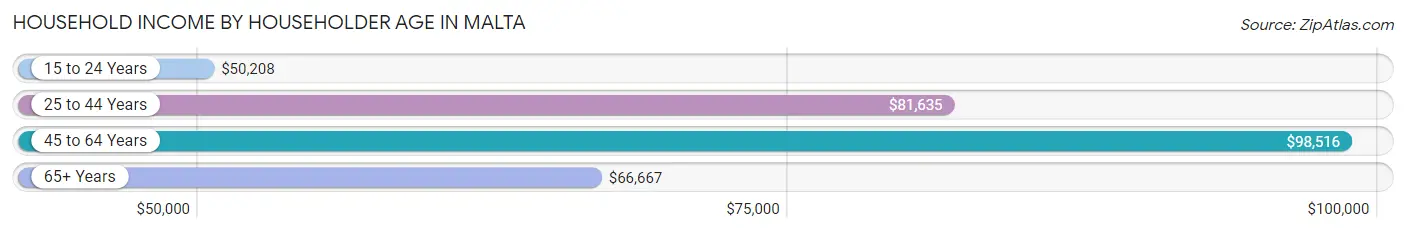
| Income Bracket | # Households | Median Income |
| 15 to 24 Years | 35 (6.7%) | $50,208 |
| 25 to 44 Years | 199 (37.9%) | $81,635 |
| 45 to 64 Years | 205 (39.1%) | $98,516 |
| 65+ Years | 86 (16.4%) | $66,667 |
| Total | 525 (100.0%) | $82,212 |
Poverty in Malta
Income Below Poverty by Sex and Age in Malta
With 15.3% poverty level for males and 21.9% for females among the residents of Malta, under 5 year old males and 16 and 17 year old females are the most vulnerable to poverty, with 41 males (50.0%) and 4 females (50.0%) in their respective age groups living below the poverty level.
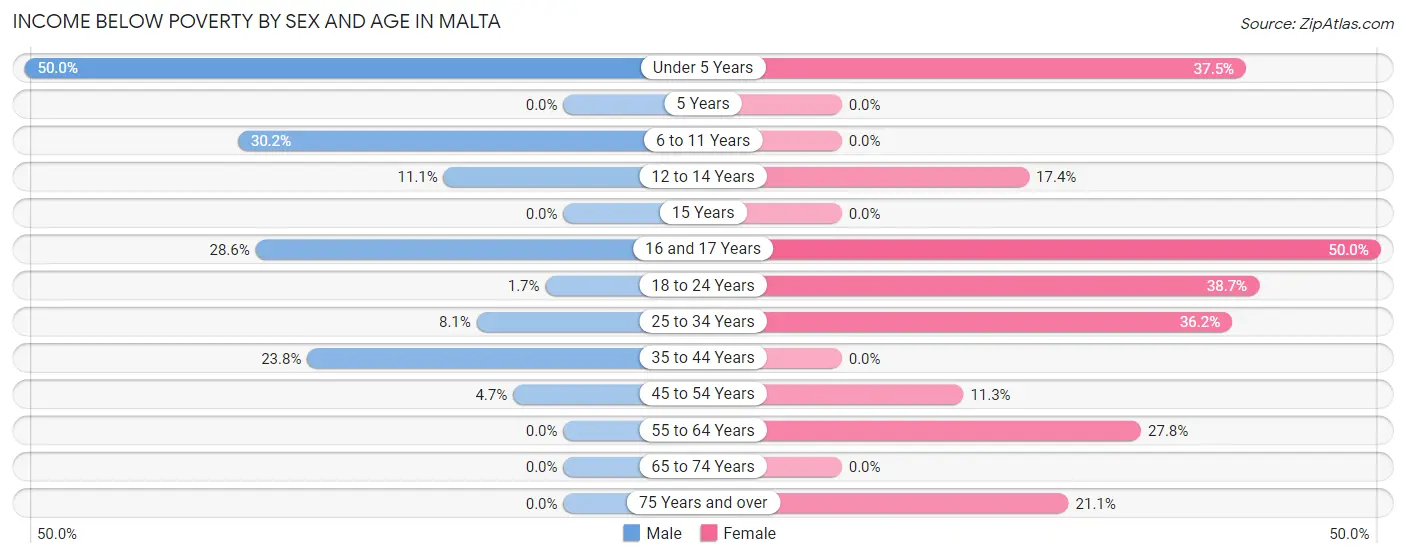
| Age Bracket | Male | Female |
| Under 5 Years | 41 (50.0%) | 36 (37.5%) |
| 5 Years | 0 (0.0%) | 0 (0.0%) |
| 6 to 11 Years | 29 (30.2%) | 0 (0.0%) |
| 12 to 14 Years | 4 (11.1%) | 4 (17.4%) |
| 15 Years | 0 (0.0%) | 0 (0.0%) |
| 16 and 17 Years | 4 (28.6%) | 4 (50.0%) |
| 18 to 24 Years | 1 (1.7%) | 36 (38.7%) |
| 25 to 34 Years | 7 (8.1%) | 42 (36.2%) |
| 35 to 44 Years | 29 (23.8%) | 0 (0.0%) |
| 45 to 54 Years | 5 (4.7%) | 7 (11.3%) |
| 55 to 64 Years | 0 (0.0%) | 30 (27.8%) |
| 65 to 74 Years | 0 (0.0%) | 0 (0.0%) |
| 75 Years and over | 0 (0.0%) | 4 (21.0%) |
| Total | 120 (15.3%) | 163 (21.9%) |
Income Above Poverty by Sex and Age in Malta
According to the poverty statistics in Malta, males aged 5 years and females aged 5 years are the age groups that are most secure financially, with 100.0% of males and 100.0% of females in these age groups living above the poverty line.
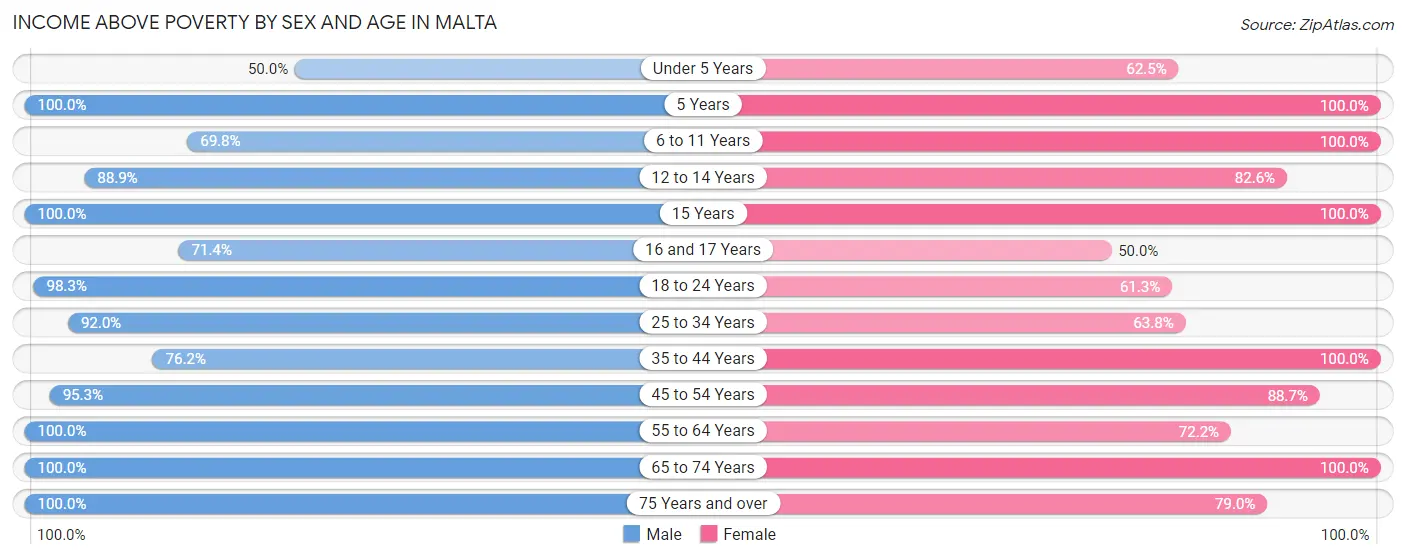
| Age Bracket | Male | Female |
| Under 5 Years | 41 (50.0%) | 60 (62.5%) |
| 5 Years | 5 (100.0%) | 4 (100.0%) |
| 6 to 11 Years | 67 (69.8%) | 43 (100.0%) |
| 12 to 14 Years | 32 (88.9%) | 19 (82.6%) |
| 15 Years | 12 (100.0%) | 16 (100.0%) |
| 16 and 17 Years | 10 (71.4%) | 4 (50.0%) |
| 18 to 24 Years | 59 (98.3%) | 57 (61.3%) |
| 25 to 34 Years | 80 (91.9%) | 74 (63.8%) |
| 35 to 44 Years | 93 (76.2%) | 97 (100.0%) |
| 45 to 54 Years | 102 (95.3%) | 55 (88.7%) |
| 55 to 64 Years | 61 (100.0%) | 78 (72.2%) |
| 65 to 74 Years | 59 (100.0%) | 60 (100.0%) |
| 75 Years and over | 41 (100.0%) | 15 (78.9%) |
| Total | 662 (84.7%) | 582 (78.1%) |
Income Below Poverty Among Married-Couple Families in Malta
The poverty statistics for married-couple families in Malta show that 1.8% or 5 of the total 286 families live below the poverty line. Families with 5 or more children have the highest poverty rate of 41.7%, comprising of 5 families. On the other hand, families with no children have the lowest poverty rate of 0.0%, which includes 0 families.
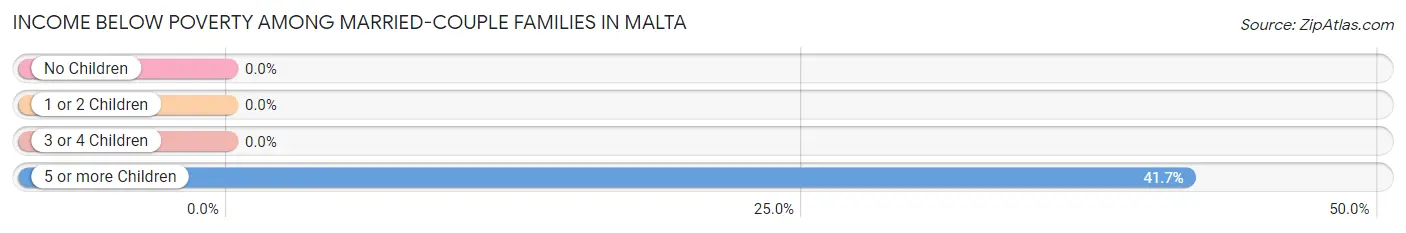
| Children | Above Poverty | Below Poverty |
| No Children | 139 (100.0%) | 0 (0.0%) |
| 1 or 2 Children | 114 (100.0%) | 0 (0.0%) |
| 3 or 4 Children | 21 (100.0%) | 0 (0.0%) |
| 5 or more Children | 7 (58.3%) | 5 (41.7%) |
| Total | 281 (98.3%) | 5 (1.8%) |
Income Below Poverty Among Single-Parent Households in Malta
According to the poverty data in Malta, 68.4% or 26 single-father households and 40.9% or 9 single-mother households are living below the poverty line. Among single-father households, those with 3 or 4 children have the highest poverty rate, with 26 households (83.9%) experiencing poverty. Likewise, among single-mother households, those with 1 or 2 children have the highest poverty rate, with 9 households (81.8%) falling below the poverty line.
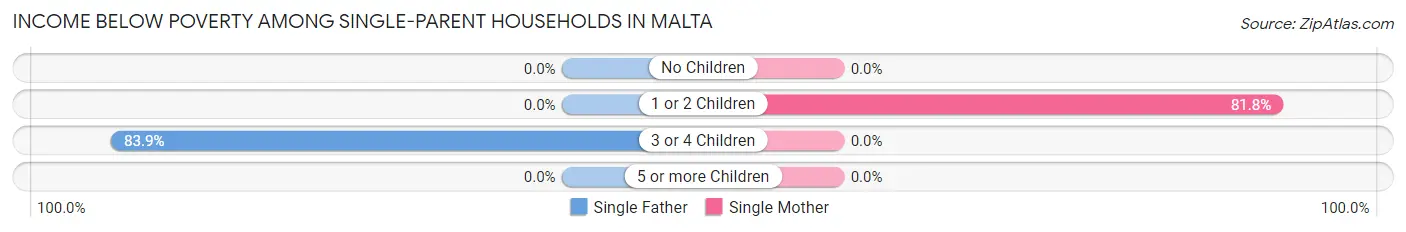
| Children | Single Father | Single Mother |
| No Children | 0 (0.0%) | 0 (0.0%) |
| 1 or 2 Children | 0 (0.0%) | 9 (81.8%) |
| 3 or 4 Children | 26 (83.9%) | 0 (0.0%) |
| 5 or more Children | 0 (0.0%) | 0 (0.0%) |
| Total | 26 (68.4%) | 9 (40.9%) |
Income Below Poverty Among Married-Couple vs Single-Parent Households in Malta
The poverty data for Malta shows that 5 of the married-couple family households (1.8%) and 35 of the single-parent households (58.3%) are living below the poverty level. Within the married-couple family households, those with 5 or more children have the highest poverty rate, with 5 households (41.7%) falling below the poverty line. Among the single-parent households, those with 3 or 4 children have the highest poverty rate, with 26 household (83.9%) living below poverty.
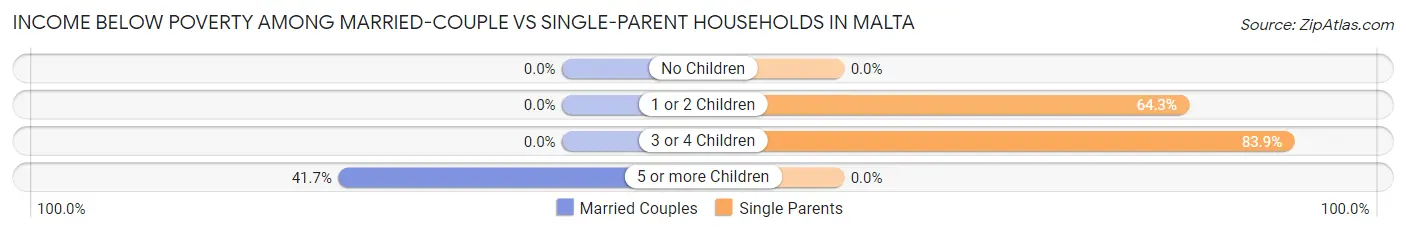
| Children | Married-Couple Families | Single-Parent Households |
| No Children | 0 (0.0%) | 0 (0.0%) |
| 1 or 2 Children | 0 (0.0%) | 9 (64.3%) |
| 3 or 4 Children | 0 (0.0%) | 26 (83.9%) |
| 5 or more Children | 5 (41.7%) | 0 (0.0%) |
| Total | 5 (1.8%) | 35 (58.3%) |
Race in Malta
The most populous races in Malta are White / Caucasian (1,219 | 79.4%), Hispanic or Latino (225 | 14.7%), and Some other Race (174 | 11.3%).
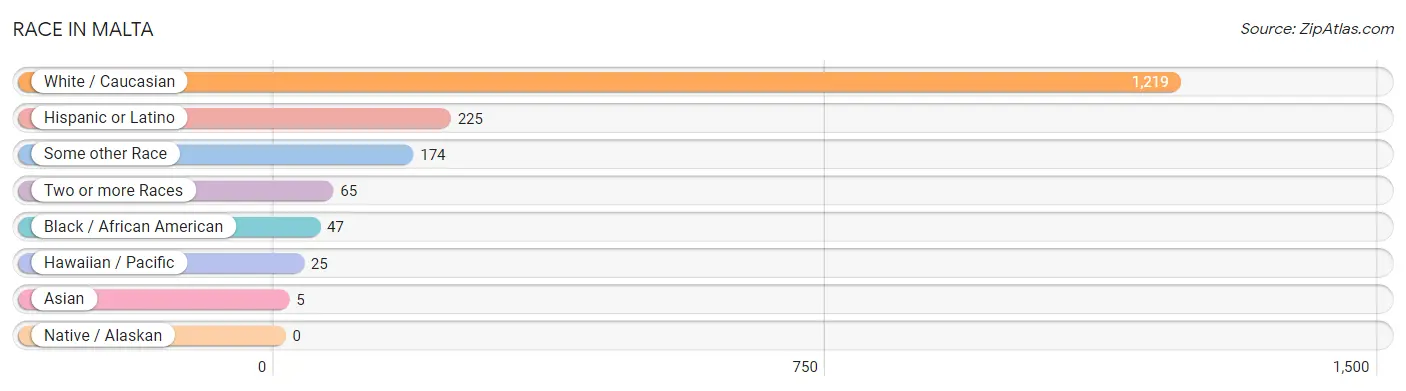
| Race | # Population | % Population |
| Asian | 5 | 0.3% |
| Black / African American | 47 | 3.1% |
| Hawaiian / Pacific | 25 | 1.6% |
| Hispanic or Latino | 225 | 14.7% |
| Native / Alaskan | 0 | 0.0% |
| White / Caucasian | 1,219 | 79.4% |
| Two or more Races | 65 | 4.2% |
| Some other Race | 174 | 11.3% |
| Total | 1,535 | 100.0% |
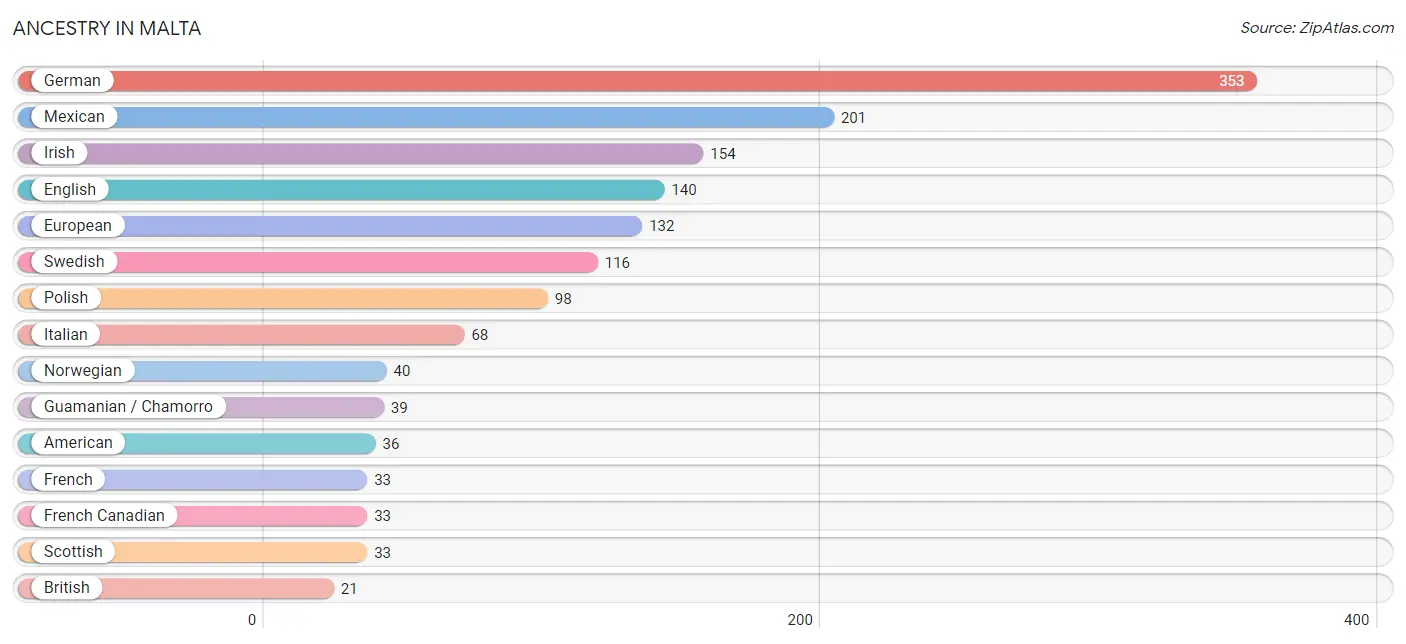
Ancestry in Malta
The most populous ancestries reported in Malta are German (353 | 23.0%), Mexican (201 | 13.1%), Irish (154 | 10.0%), English (140 | 9.1%), and European (132 | 8.6%), together accounting for 63.8% of all Malta residents.
| Ancestry | # Population | % Population |
| American | 36 | 2.4% |
| Belgian | 4 | 0.3% |
| British | 21 | 1.4% |
| Central American | 8 | 0.5% |
| Cherokee | 3 | 0.2% |
| Costa Rican | 2 | 0.1% |
| Czech | 9 | 0.6% |
| Czechoslovakian | 2 | 0.1% |
| Danish | 12 | 0.8% |
| Dutch | 15 | 1.0% |
| Eastern European | 5 | 0.3% |
| English | 140 | 9.1% |
| European | 132 | 8.6% |
| French | 33 | 2.1% |
| French Canadian | 33 | 2.1% |
| German | 353 | 23.0% |
| Guamanian / Chamorro | 39 | 2.5% |
| Irish | 154 | 10.0% |
| Italian | 68 | 4.4% |
| Korean | 5 | 0.3% |
| Mexican | 201 | 13.1% |
| Northern European | 9 | 0.6% |
| Norwegian | 40 | 2.6% |
| Panamanian | 2 | 0.1% |
| Polish | 98 | 6.4% |
| Puerto Rican | 16 | 1.0% |
| Salvadoran | 4 | 0.3% |
| Scandinavian | 7 | 0.5% |
| Scotch-Irish | 5 | 0.3% |
| Scottish | 33 | 2.1% |
| Serbian | 3 | 0.2% |
| South African | 3 | 0.2% |
| Subsaharan African | 3 | 0.2% |
| Swedish | 116 | 7.6% |
| Swiss | 11 | 0.7% | View All 35 Rows |
Immigrants in Malta
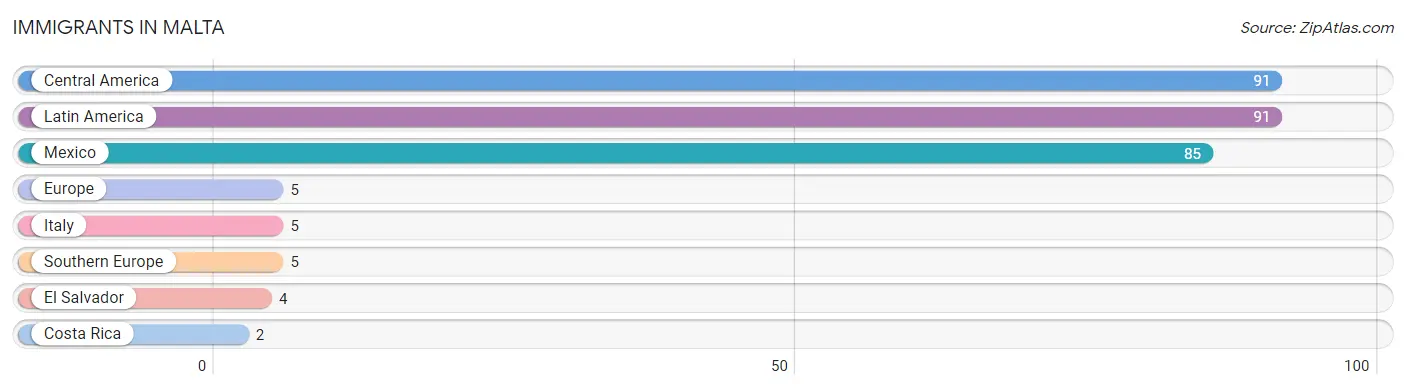
The most numerous immigrant groups reported in Malta came from Central America (91 | 5.9%), Latin America (91 | 5.9%), Mexico (85 | 5.5%), Europe (5 | 0.3%), and Italy (5 | 0.3%), together accounting for 18.1% of all Malta residents.
| Immigration Origin | # Population | % Population |
| Central America | 91 | 5.9% |
| Costa Rica | 2 | 0.1% |
| El Salvador | 4 | 0.3% |
| Europe | 5 | 0.3% |
| Italy | 5 | 0.3% |
| Latin America | 91 | 5.9% |
| Mexico | 85 | 5.5% |
| Southern Europe | 5 | 0.3% | View All 8 Rows |
Sex and Age in Malta
Sex and Age in Malta
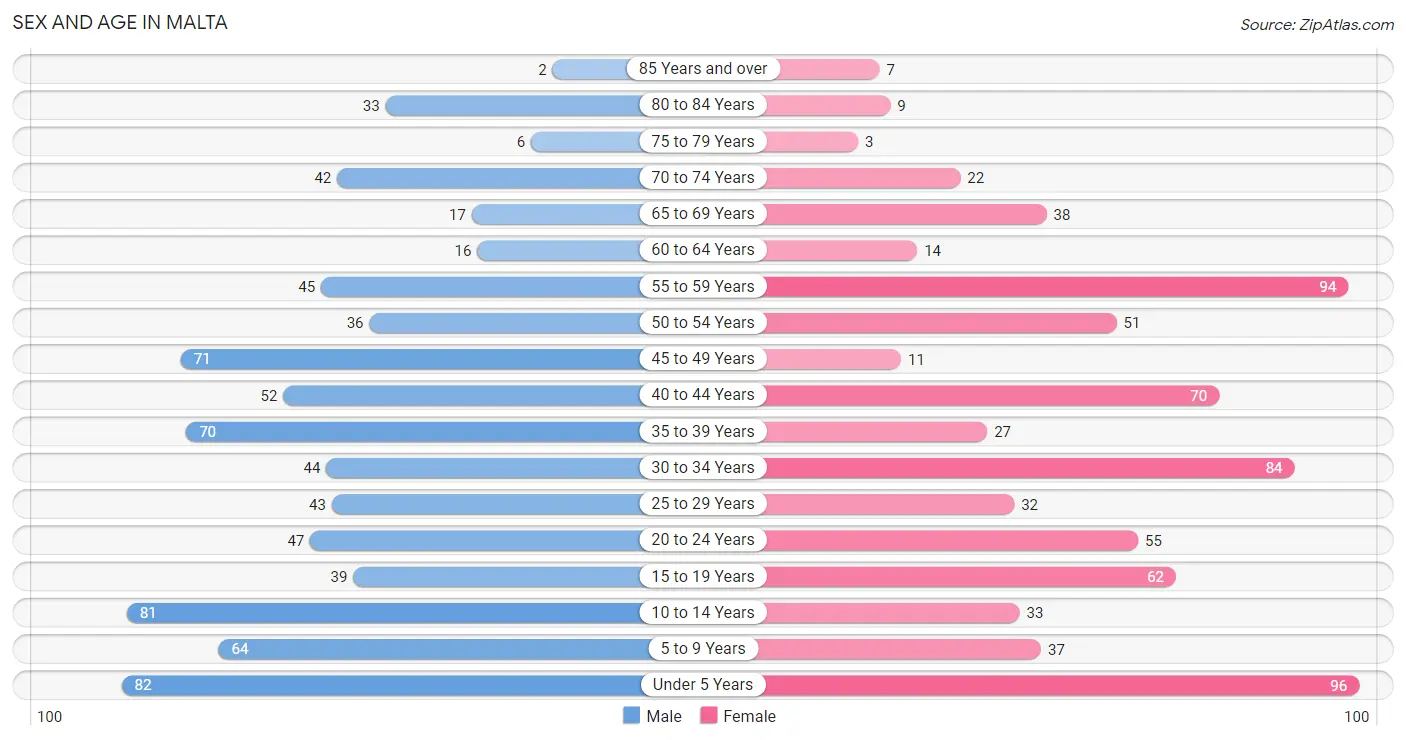
The most populous age groups in Malta are Under 5 Years (82 | 10.4%) for men and Under 5 Years (96 | 12.9%) for women.
| Age Bracket | Male | Female |
| Under 5 Years | 82 (10.4%) | 96 (12.9%) |
| 5 to 9 Years | 64 (8.1%) | 37 (5.0%) |
| 10 to 14 Years | 81 (10.2%) | 33 (4.4%) |
| 15 to 19 Years | 39 (4.9%) | 62 (8.3%) |
| 20 to 24 Years | 47 (5.9%) | 55 (7.4%) |
| 25 to 29 Years | 43 (5.4%) | 32 (4.3%) |
| 30 to 34 Years | 44 (5.6%) | 84 (11.3%) |
| 35 to 39 Years | 70 (8.9%) | 27 (3.6%) |
| 40 to 44 Years | 52 (6.6%) | 70 (9.4%) |
| 45 to 49 Years | 71 (9.0%) | 11 (1.5%) |
| 50 to 54 Years | 36 (4.6%) | 51 (6.9%) |
| 55 to 59 Years | 45 (5.7%) | 94 (12.6%) |
| 60 to 64 Years | 16 (2.0%) | 14 (1.9%) |
| 65 to 69 Years | 17 (2.1%) | 38 (5.1%) |
| 70 to 74 Years | 42 (5.3%) | 22 (2.9%) |
| 75 to 79 Years | 6 (0.8%) | 3 (0.4%) |
| 80 to 84 Years | 33 (4.2%) | 9 (1.2%) |
| 85 Years and over | 2 (0.3%) | 7 (0.9%) |
| Total | 790 (100.0%) | 745 (100.0%) |
Families and Households in Malta
Median Family Size in Malta
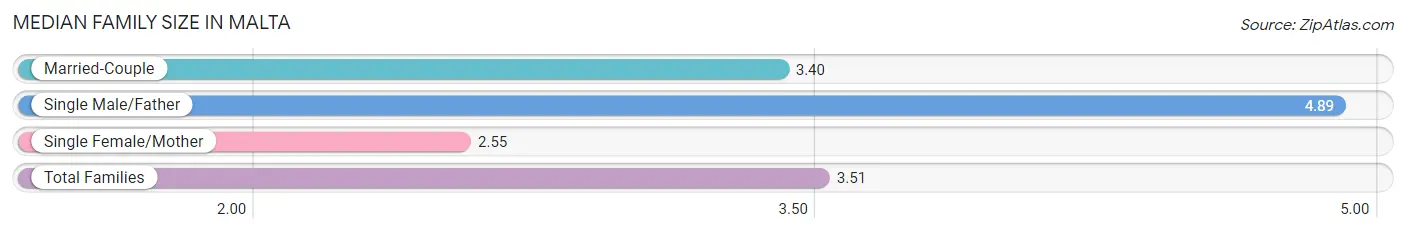
The median family size in Malta is 3.51 persons per family, with single male/father families (38 | 11.0%) accounting for the largest median family size of 4.89 persons per family. On the other hand, single female/mother families (22 | 6.4%) represent the smallest median family size with 2.55 persons per family.
| Family Type | # Families | Family Size |
| Married-Couple | 286 (82.7%) | 3.40 |
| Single Male/Father | 38 (11.0%) | 4.89 |
| Single Female/Mother | 22 (6.4%) | 2.55 |
| Total Families | 346 (100.0%) | 3.51 |
Median Household Size in Malta
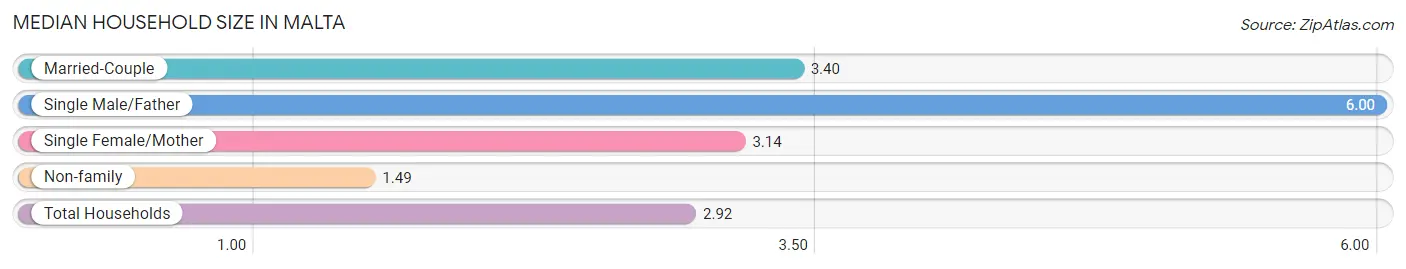
The median household size in Malta is 2.92 persons per household, with single male/father households (38 | 7.2%) accounting for the largest median household size of 6 persons per household. non-family households (179 | 34.1%) represent the smallest median household size with 1.49 persons per household.
| Household Type | # Households | Household Size |
| Married-Couple | 286 (54.5%) | 3.40 |
| Single Male/Father | 38 (7.2%) | 6.00 |
| Single Female/Mother | 22 (4.2%) | 3.14 |
| Non-family | 179 (34.1%) | 1.49 |
| Total Households | 525 (100.0%) | 2.92 |
Household Size by Marriage Status in Malta
Out of a total of 525 households in Malta, 346 (65.9%) are family households, while 179 (34.1%) are nonfamily households. The most numerous type of family households are 2-person households, comprising 114, and the most common type of nonfamily households are 1-person households, comprising 124.
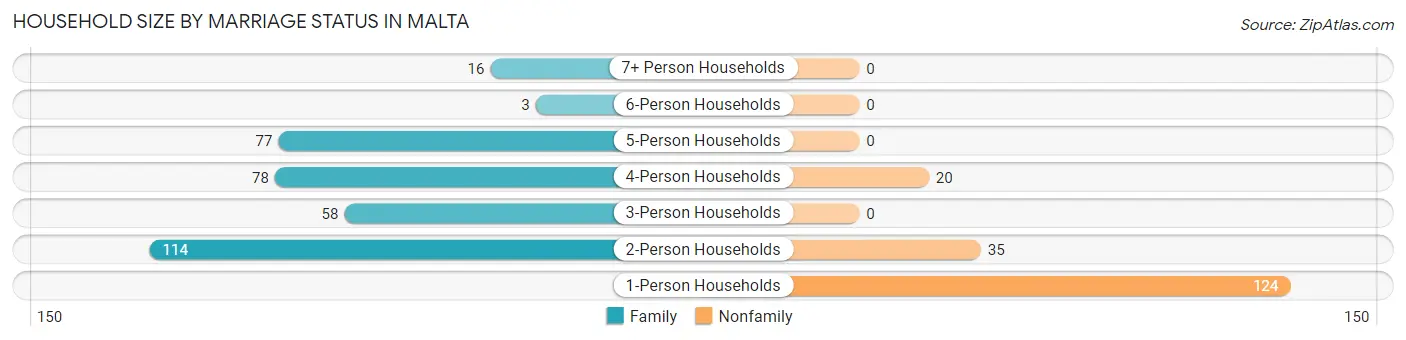
| Household Size | Family Households | Nonfamily Households |
| 1-Person Households | - | 124 (23.6%) |
| 2-Person Households | 114 (21.7%) | 35 (6.7%) |
| 3-Person Households | 58 (11.1%) | 0 (0.0%) |
| 4-Person Households | 78 (14.9%) | 20 (3.8%) |
| 5-Person Households | 77 (14.7%) | 0 (0.0%) |
| 6-Person Households | 3 (0.6%) | 0 (0.0%) |
| 7+ Person Households | 16 (3.0%) | 0 (0.0%) |
| Total | 346 (65.9%) | 179 (34.1%) |
Female Fertility in Malta
Fertility by Age in Malta
Average fertility rate in Malta is 96.0 births per 1,000 women. Women in the age bracket of 20 to 34 years have the highest fertility rate with 181.0 births per 1,000 women. Women in the age bracket of 20 to 34 years acount for 91.2% of all women with births.
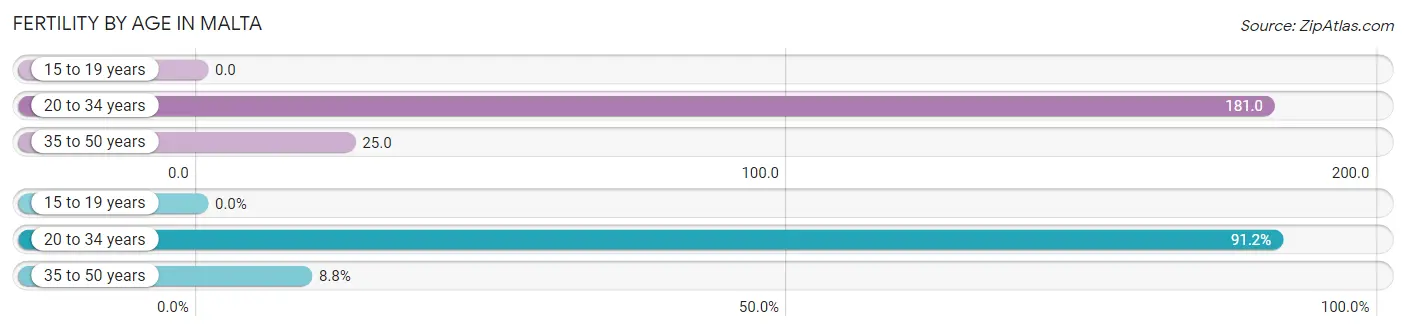
| Age Bracket | Women with Births | Births / 1,000 Women |
| 15 to 19 years | 0 (0.0%) | 0.0 |
| 20 to 34 years | 31 (91.2%) | 181.0 |
| 35 to 50 years | 3 (8.8%) | 25.0 |
| Total | 34 (100.0%) | 96.0 |
Fertility by Age by Marriage Status in Malta
58.8% of women with births (34) in Malta are married. The highest percentage of unmarried women with births falls into 20 to 34 years age bracket with 45.2% of them unmarried at the time of birth, while the lowest percentage of unmarried women with births belong to 35 to 50 years age bracket with 0.0% of them unmarried.
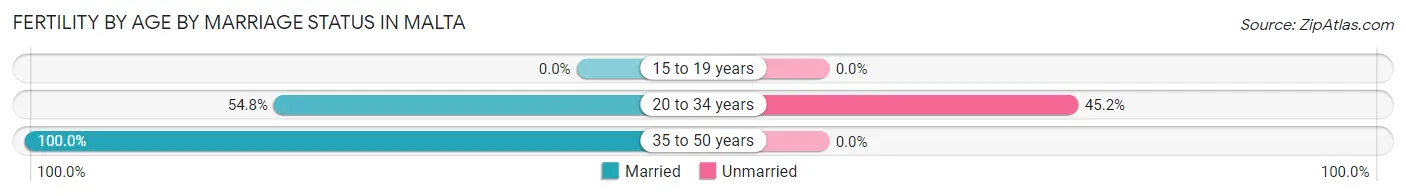
| Age Bracket | Married | Unmarried |
| 15 to 19 years | 0 (0.0%) | 0 (0.0%) |
| 20 to 34 years | 17 (54.8%) | 14 (45.2%) |
| 35 to 50 years | 3 (100.0%) | 0 (0.0%) |
| Total | 20 (58.8%) | 14 (41.2%) |
Fertility by Education in Malta
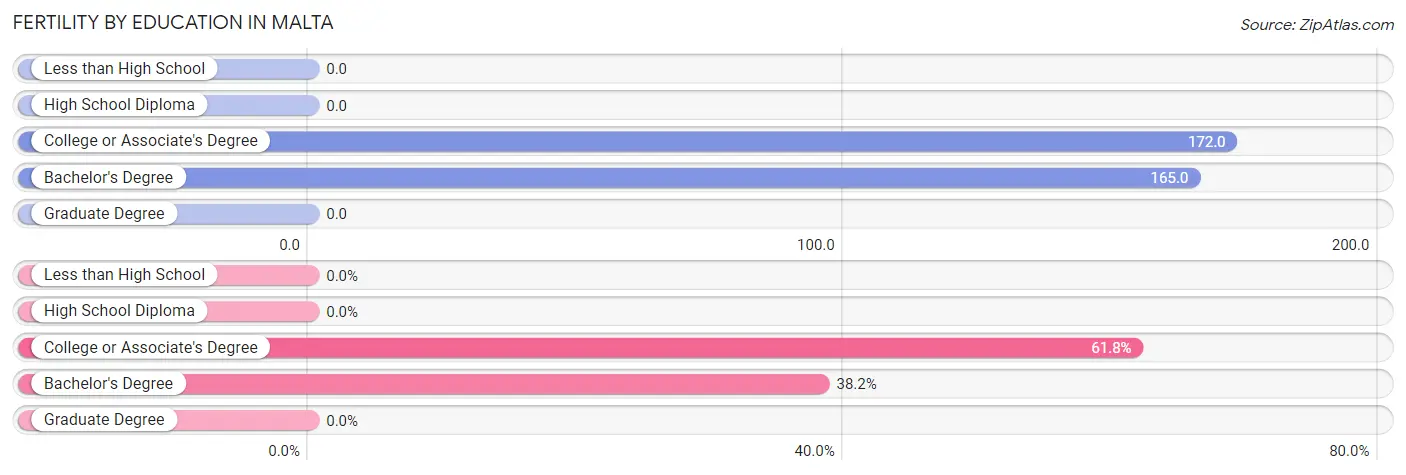
| Educational Attainment | Women with Births | Births / 1,000 Women |
| Less than High School | 0 (0.0%) | 0.0 |
| High School Diploma | 0 (0.0%) | 0.0 |
| College or Associate's Degree | 21 (61.8%) | 172.0 |
| Bachelor's Degree | 13 (38.2%) | 165.0 |
| Graduate Degree | 0 (0.0%) | 0.0 |
| Total | 34 (100.0%) | 96.0 |
Fertility by Education by Marriage Status in Malta
41.2% of women with births in Malta are unmarried. Women with the educational attainment of bachelor's degree are most likely to be married with 100.0% of them married at childbirth, while women with the educational attainment of college or associate's degree are least likely to be married with 66.7% of them unmarried at childbirth.
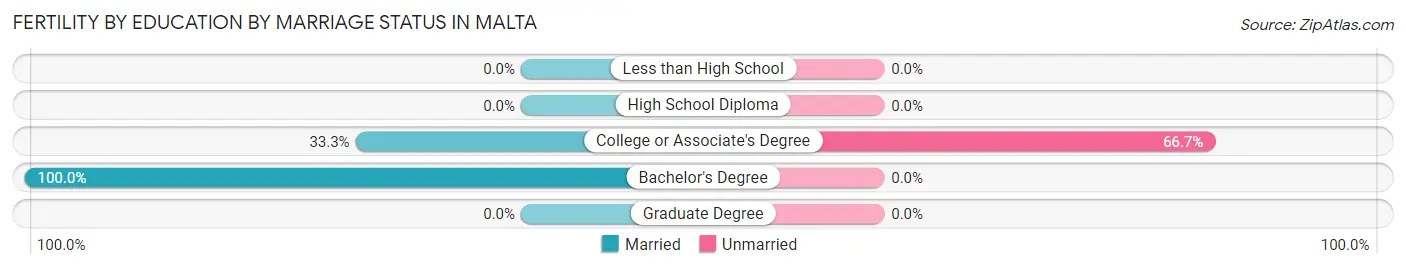
| Educational Attainment | Married | Unmarried |
| Less than High School | 0 (0.0%) | 0 (0.0%) |
| High School Diploma | 0 (0.0%) | 0 (0.0%) |
| College or Associate's Degree | 7 (33.3%) | 14 (66.7%) |
| Bachelor's Degree | 13 (100.0%) | 0 (0.0%) |
| Graduate Degree | 0 (0.0%) | 0 (0.0%) |
| Total | 20 (58.8%) | 14 (41.2%) |
Employment Characteristics in Malta
Employment by Class of Employer in Malta
Among the 753 employed individuals in Malta, private company employees (546 | 72.5%), local government employees (71 | 9.4%), and state government employees (59 | 7.8%) make up the most common classes of employment.
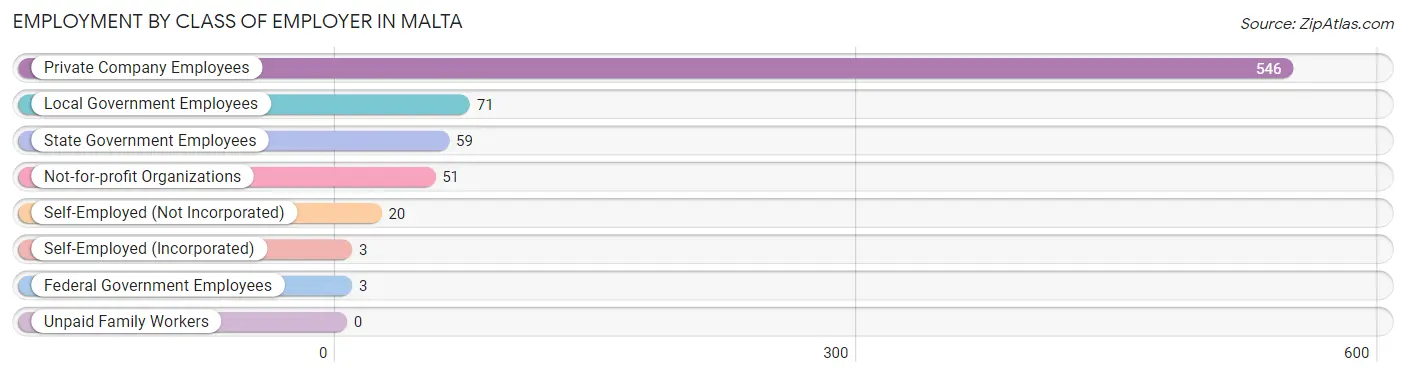
| Employer Class | # Employees | % Employees |
| Private Company Employees | 546 | 72.5% |
| Self-Employed (Incorporated) | 3 | 0.4% |
| Self-Employed (Not Incorporated) | 20 | 2.7% |
| Not-for-profit Organizations | 51 | 6.8% |
| Local Government Employees | 71 | 9.4% |
| State Government Employees | 59 | 7.8% |
| Federal Government Employees | 3 | 0.4% |
| Unpaid Family Workers | 0 | 0.0% |
| Total | 753 | 100.0% |
Employment Status by Age in Malta
According to the labor force statistics for Malta, out of the total population over 16 years of age (1,114), 71.2% or 793 individuals are in the labor force, with 2.9% or 23 of them unemployed. The age group with the highest labor force participation rate is 20 to 24 years, with 96.1% or 98 individuals in the labor force. Within the labor force, the 45 to 54 years age range has the highest percentage of unemployed individuals, with 6.5% or 10 of them being unemployed.
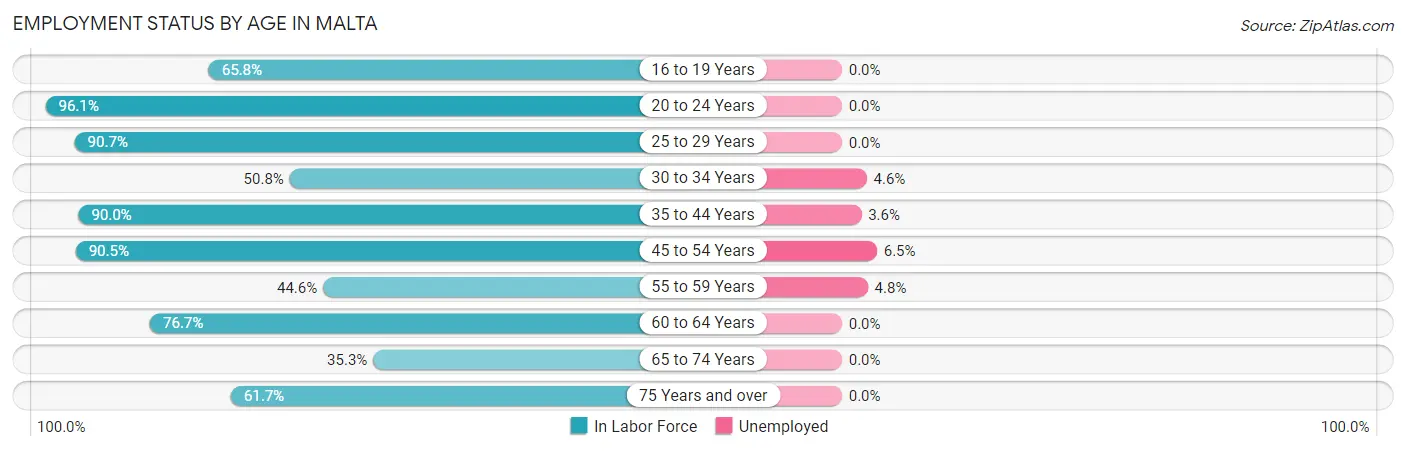
| Age Bracket | In Labor Force | Unemployed |
| 16 to 19 Years | 48 (65.8%) | 0 (0.0%) |
| 20 to 24 Years | 98 (96.1%) | 0 (0.0%) |
| 25 to 29 Years | 68 (90.7%) | 0 (0.0%) |
| 30 to 34 Years | 65 (50.8%) | 3 (4.6%) |
| 35 to 44 Years | 197 (90.0%) | 7 (3.6%) |
| 45 to 54 Years | 153 (90.5%) | 10 (6.5%) |
| 55 to 59 Years | 62 (44.6%) | 3 (4.8%) |
| 60 to 64 Years | 23 (76.7%) | 0 (0.0%) |
| 65 to 74 Years | 42 (35.3%) | 0 (0.0%) |
| 75 Years and over | 37 (61.7%) | 0 (0.0%) |
| Total | 793 (71.2%) | 23 (2.9%) |
Employment Status by Educational Attainment in Malta
According to labor force statistics for Malta, 74.7% of individuals (568) out of the total population between 25 and 64 years of age (760) are in the labor force, with 4.0% or 23 of them being unemployed. The group with the highest labor force participation rate are those with the educational attainment of bachelor's degree or higher, with 88.3% or 181 individuals in the labor force. Within the labor force, individuals with high school diploma education have the highest percentage of unemployment, with 12.7% or 20 of them being unemployed.
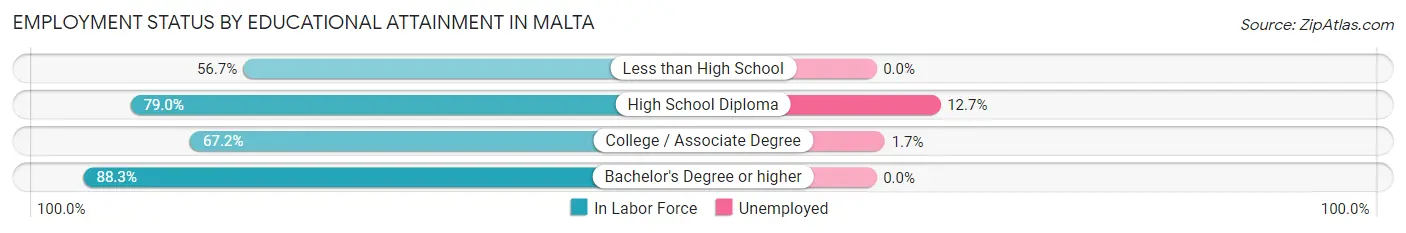
| Educational Attainment | In Labor Force | Unemployed |
| Less than High School | 51 (56.7%) | 0 (0.0%) |
| High School Diploma | 158 (79.0%) | 25 (12.7%) |
| College / Associate Degree | 178 (67.2%) | 5 (1.7%) |
| Bachelor's Degree or higher | 181 (88.3%) | 0 (0.0%) |
| Total | 568 (74.7%) | 30 (4.0%) |
Employment Occupations by Sex in Malta
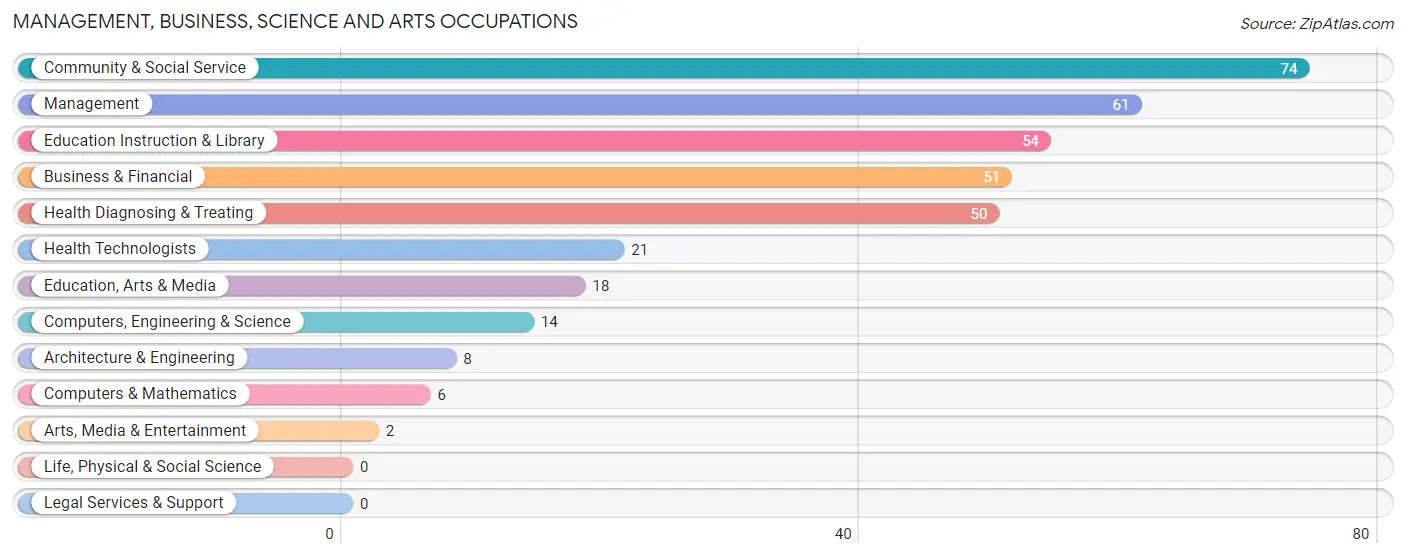
Management, Business, Science and Arts Occupations
The most common Management, Business, Science and Arts occupations in Malta are Community & Social Service (74 | 9.6%), Management (61 | 7.9%), Education Instruction & Library (54 | 7.0%), Business & Financial (51 | 6.6%), and Health Diagnosing & Treating (50 | 6.5%).
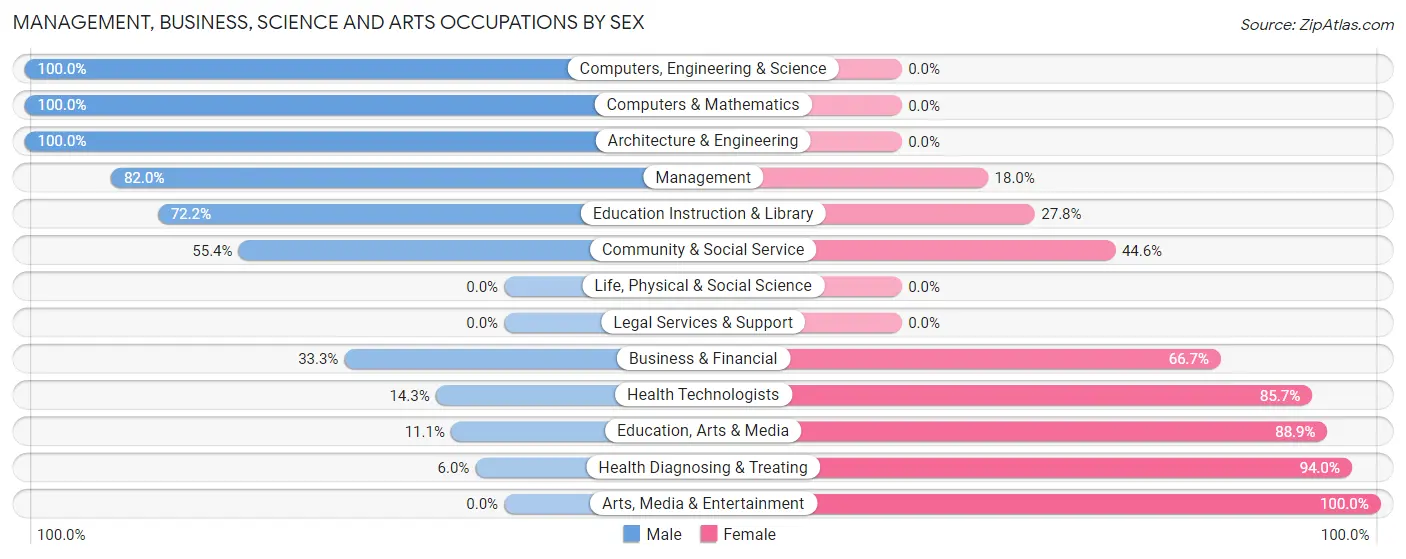
Management, Business, Science and Arts Occupations by Sex
Within the Management, Business, Science and Arts occupations in Malta, the most male-oriented occupations are Computers, Engineering & Science (100.0%), Computers & Mathematics (100.0%), and Architecture & Engineering (100.0%), while the most female-oriented occupations are Arts, Media & Entertainment (100.0%), Health Diagnosing & Treating (94.0%), and Education, Arts & Media (88.9%).
| Occupation | Male | Female |
| Management | 50 (82.0%) | 11 (18.0%) |
| Business & Financial | 17 (33.3%) | 34 (66.7%) |
| Computers, Engineering & Science | 14 (100.0%) | 0 (0.0%) |
| Computers & Mathematics | 6 (100.0%) | 0 (0.0%) |
| Architecture & Engineering | 8 (100.0%) | 0 (0.0%) |
| Life, Physical & Social Science | 0 (0.0%) | 0 (0.0%) |
| Community & Social Service | 41 (55.4%) | 33 (44.6%) |
| Education, Arts & Media | 2 (11.1%) | 16 (88.9%) |
| Legal Services & Support | 0 (0.0%) | 0 (0.0%) |
| Education Instruction & Library | 39 (72.2%) | 15 (27.8%) |
| Arts, Media & Entertainment | 0 (0.0%) | 2 (100.0%) |
| Health Diagnosing & Treating | 3 (6.0%) | 47 (94.0%) |
| Health Technologists | 3 (14.3%) | 18 (85.7%) |
| Total (Category) | 125 (50.0%) | 125 (50.0%) |
| Total (Overall) | 474 (61.6%) | 296 (38.4%) |
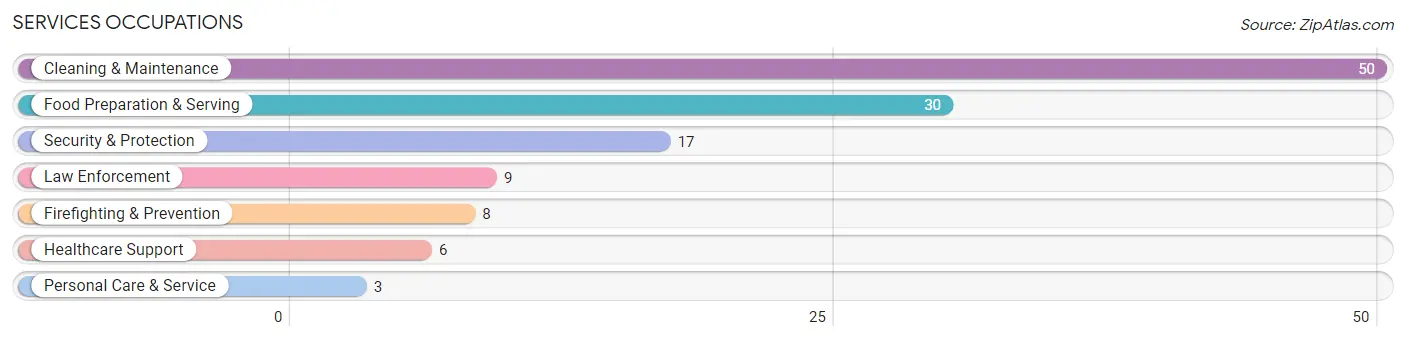
Services Occupations
The most common Services occupations in Malta are Cleaning & Maintenance (50 | 6.5%), Food Preparation & Serving (30 | 3.9%), Security & Protection (17 | 2.2%), Law Enforcement (9 | 1.2%), and Firefighting & Prevention (8 | 1.0%).
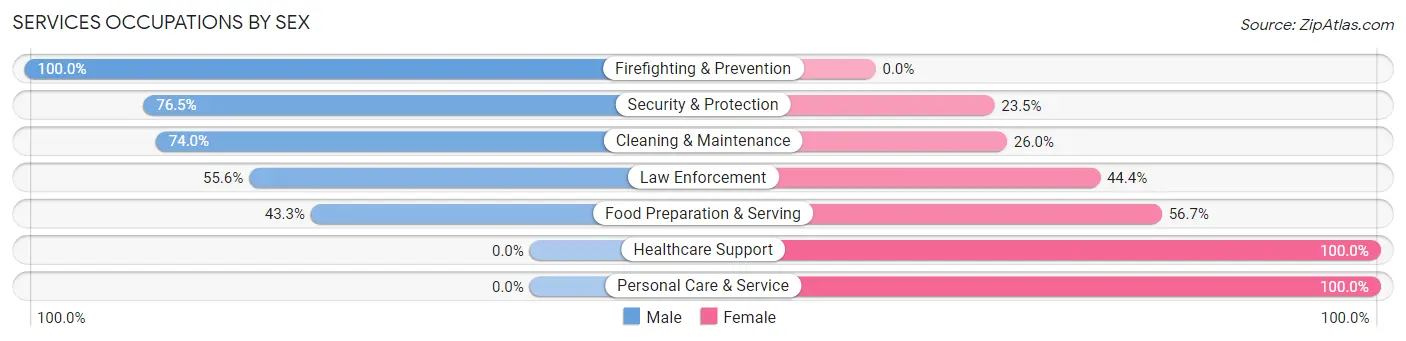
Services Occupations by Sex
Within the Services occupations in Malta, the most male-oriented occupations are Firefighting & Prevention (100.0%), Security & Protection (76.5%), and Cleaning & Maintenance (74.0%), while the most female-oriented occupations are Healthcare Support (100.0%), Personal Care & Service (100.0%), and Food Preparation & Serving (56.7%).
| Occupation | Male | Female |
| Healthcare Support | 0 (0.0%) | 6 (100.0%) |
| Security & Protection | 13 (76.5%) | 4 (23.5%) |
| Firefighting & Prevention | 8 (100.0%) | 0 (0.0%) |
| Law Enforcement | 5 (55.6%) | 4 (44.4%) |
| Food Preparation & Serving | 13 (43.3%) | 17 (56.7%) |
| Cleaning & Maintenance | 37 (74.0%) | 13 (26.0%) |
| Personal Care & Service | 0 (0.0%) | 3 (100.0%) |
| Total (Category) | 63 (59.4%) | 43 (40.6%) |
| Total (Overall) | 474 (61.6%) | 296 (38.4%) |
Sales and Office Occupations
The most common Sales and Office occupations in Malta are Sales & Related (101 | 13.1%), and Office & Administration (82 | 10.6%).
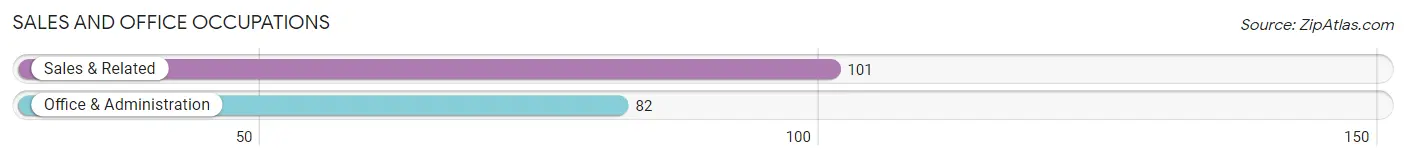
Sales and Office Occupations by Sex

| Occupation | Male | Female |
| Sales & Related | 74 (73.3%) | 27 (26.7%) |
| Office & Administration | 16 (19.5%) | 66 (80.5%) |
| Total (Category) | 90 (49.2%) | 93 (50.8%) |
| Total (Overall) | 474 (61.6%) | 296 (38.4%) |
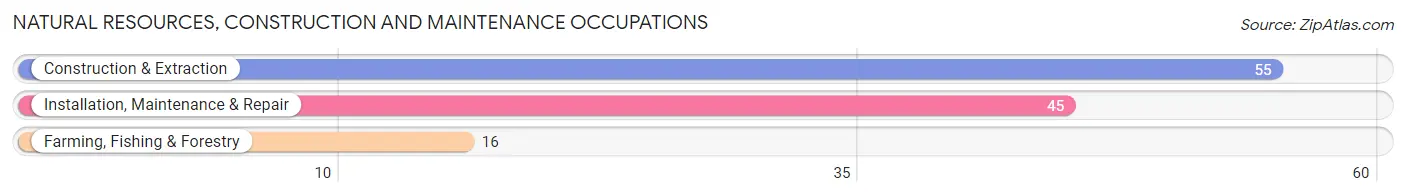
Natural Resources, Construction and Maintenance Occupations
The most common Natural Resources, Construction and Maintenance occupations in Malta are Construction & Extraction (55 | 7.1%), Installation, Maintenance & Repair (45 | 5.8%), and Farming, Fishing & Forestry (16 | 2.1%).
Natural Resources, Construction and Maintenance Occupations by Sex
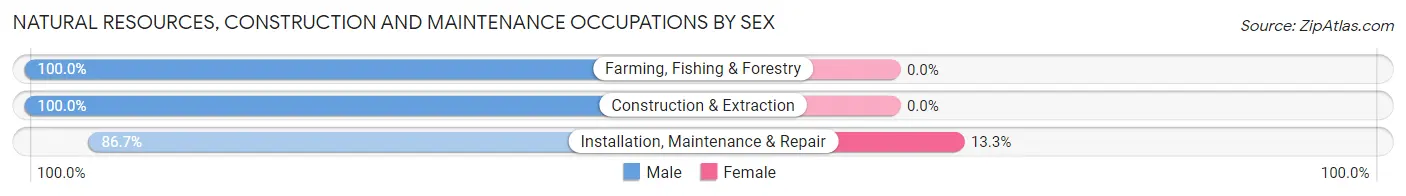
| Occupation | Male | Female |
| Farming, Fishing & Forestry | 16 (100.0%) | 0 (0.0%) |
| Construction & Extraction | 55 (100.0%) | 0 (0.0%) |
| Installation, Maintenance & Repair | 39 (86.7%) | 6 (13.3%) |
| Total (Category) | 110 (94.8%) | 6 (5.2%) |
| Total (Overall) | 474 (61.6%) | 296 (38.4%) |
Production, Transportation and Moving Occupations
The most common Production, Transportation and Moving occupations in Malta are Production (53 | 6.9%), Transportation (38 | 4.9%), and Material Moving (24 | 3.1%).
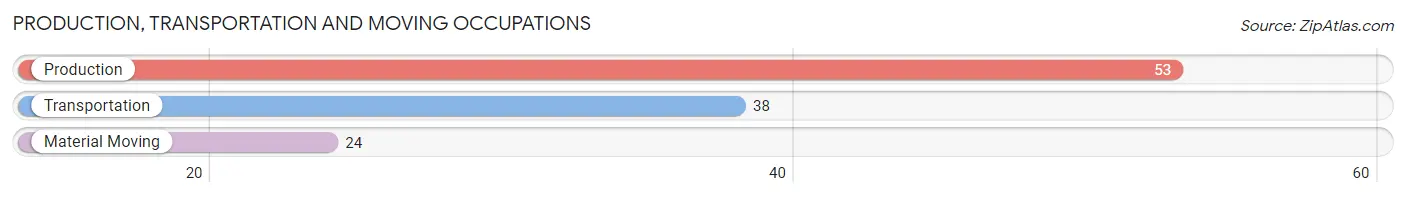
Production, Transportation and Moving Occupations by Sex
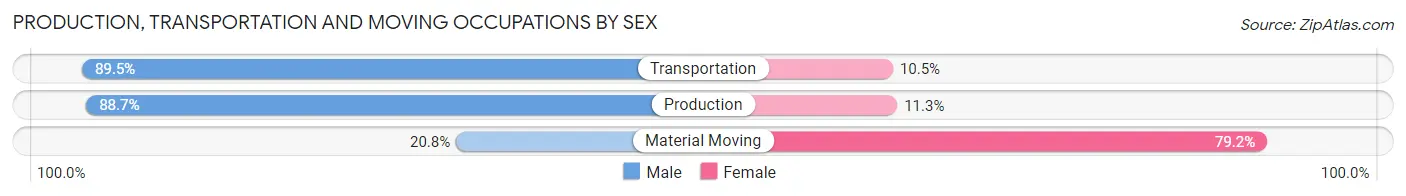
| Occupation | Male | Female |
| Production | 47 (88.7%) | 6 (11.3%) |
| Transportation | 34 (89.5%) | 4 (10.5%) |
| Material Moving | 5 (20.8%) | 19 (79.2%) |
| Total (Category) | 86 (74.8%) | 29 (25.2%) |
| Total (Overall) | 474 (61.6%) | 296 (38.4%) |
Employment Industries by Sex in Malta
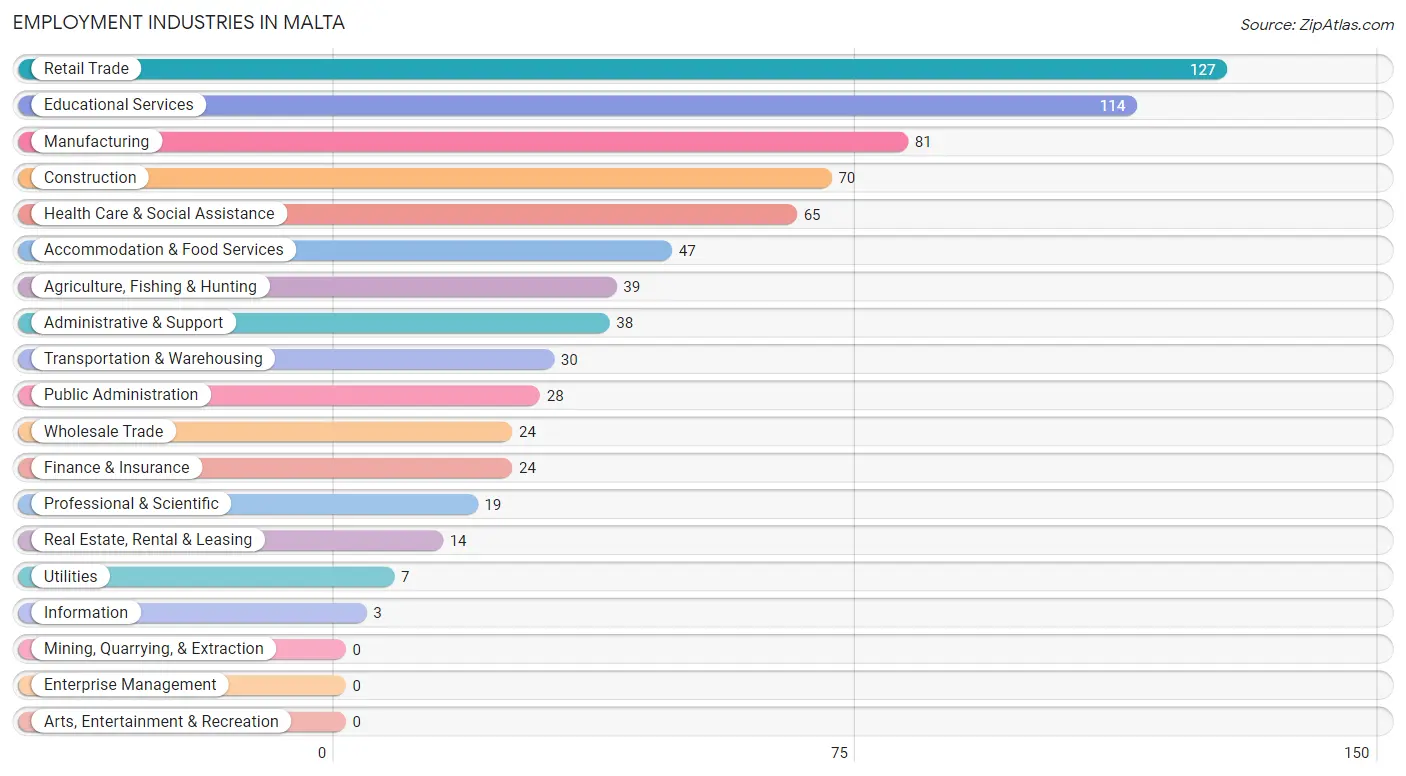
Employment Industries in Malta
The major employment industries in Malta include Retail Trade (127 | 16.5%), Educational Services (114 | 14.8%), Manufacturing (81 | 10.5%), Construction (70 | 9.1%), and Health Care & Social Assistance (65 | 8.4%).
Employment Industries by Sex in Malta
The Malta industries that see more men than women are Construction (100.0%), Wholesale Trade (100.0%), and Manufacturing (88.9%), whereas the industries that tend to have a higher number of women are Utilities (100.0%), Information (100.0%), and Professional & Scientific (84.2%).
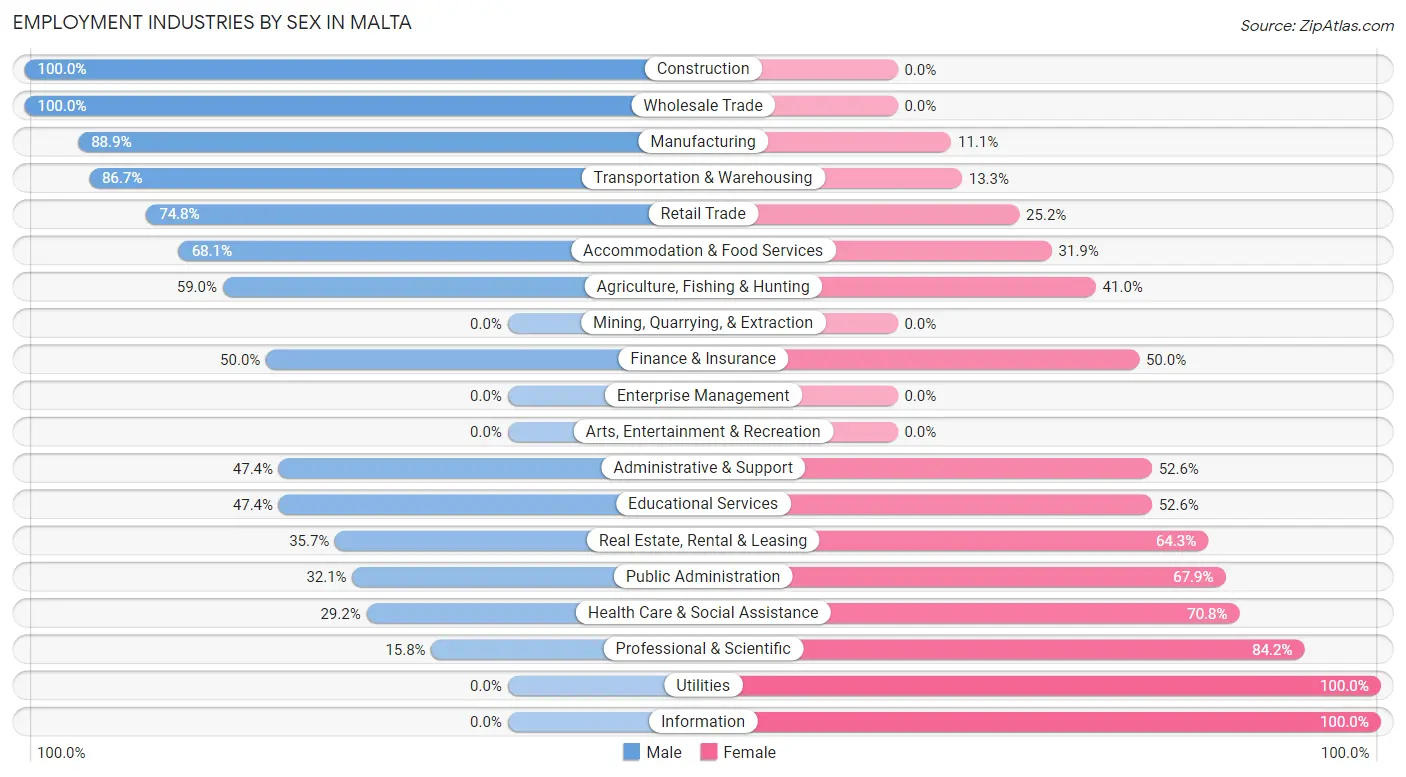
| Industry | Male | Female |
| Agriculture, Fishing & Hunting | 23 (59.0%) | 16 (41.0%) |
| Mining, Quarrying, & Extraction | 0 (0.0%) | 0 (0.0%) |
| Construction | 70 (100.0%) | 0 (0.0%) |
| Manufacturing | 72 (88.9%) | 9 (11.1%) |
| Wholesale Trade | 24 (100.0%) | 0 (0.0%) |
| Retail Trade | 95 (74.8%) | 32 (25.2%) |
| Transportation & Warehousing | 26 (86.7%) | 4 (13.3%) |
| Utilities | 0 (0.0%) | 7 (100.0%) |
| Information | 0 (0.0%) | 3 (100.0%) |
| Finance & Insurance | 12 (50.0%) | 12 (50.0%) |
| Real Estate, Rental & Leasing | 5 (35.7%) | 9 (64.3%) |
| Professional & Scientific | 3 (15.8%) | 16 (84.2%) |
| Enterprise Management | 0 (0.0%) | 0 (0.0%) |
| Administrative & Support | 18 (47.4%) | 20 (52.6%) |
| Educational Services | 54 (47.4%) | 60 (52.6%) |
| Health Care & Social Assistance | 19 (29.2%) | 46 (70.8%) |
| Arts, Entertainment & Recreation | 0 (0.0%) | 0 (0.0%) |
| Accommodation & Food Services | 32 (68.1%) | 15 (31.9%) |
| Public Administration | 9 (32.1%) | 19 (67.9%) |
| Total | 474 (61.6%) | 296 (38.4%) |
Education in Malta
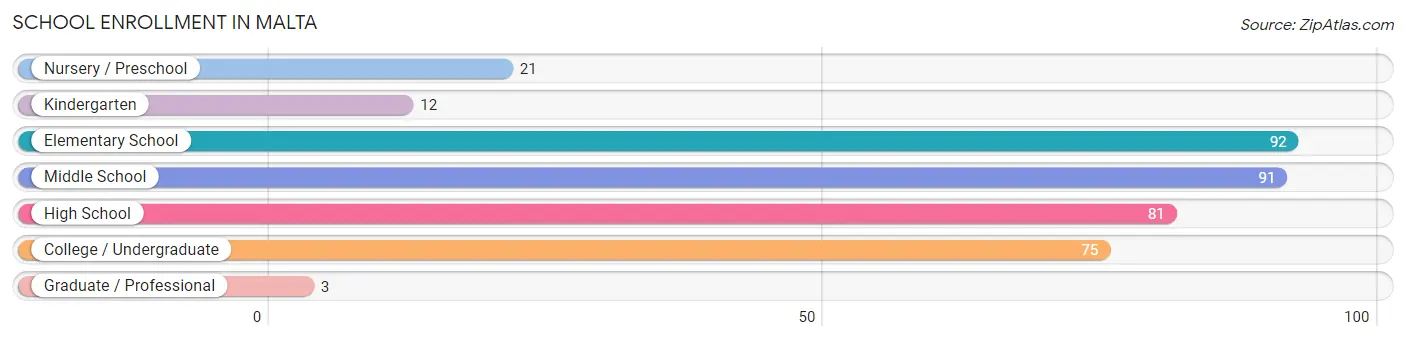
School Enrollment in Malta
The most common levels of schooling among the 375 students in Malta are elementary school (92 | 24.5%), middle school (91 | 24.3%), and high school (81 | 21.6%).
| School Level | # Students | % Students |
| Nursery / Preschool | 21 | 5.6% |
| Kindergarten | 12 | 3.2% |
| Elementary School | 92 | 24.5% |
| Middle School | 91 | 24.3% |
| High School | 81 | 21.6% |
| College / Undergraduate | 75 | 20.0% |
| Graduate / Professional | 3 | 0.8% |
| Total | 375 | 100.0% |
School Enrollment by Age by Funding Source in Malta
Out of a total of 375 students who are enrolled in schools in Malta, 94 (25.1%) attend a private institution, while the remaining 281 (74.9%) are enrolled in public schools. The age group of 15 to 17 year olds has the highest likelihood of being enrolled in private schools, with 22 (44.0% in the age bracket) enrolled. Conversely, the age group of 3 to 4 year olds has the lowest likelihood of being enrolled in a private school, with 17 (100.0% in the age bracket) attending a public institution.
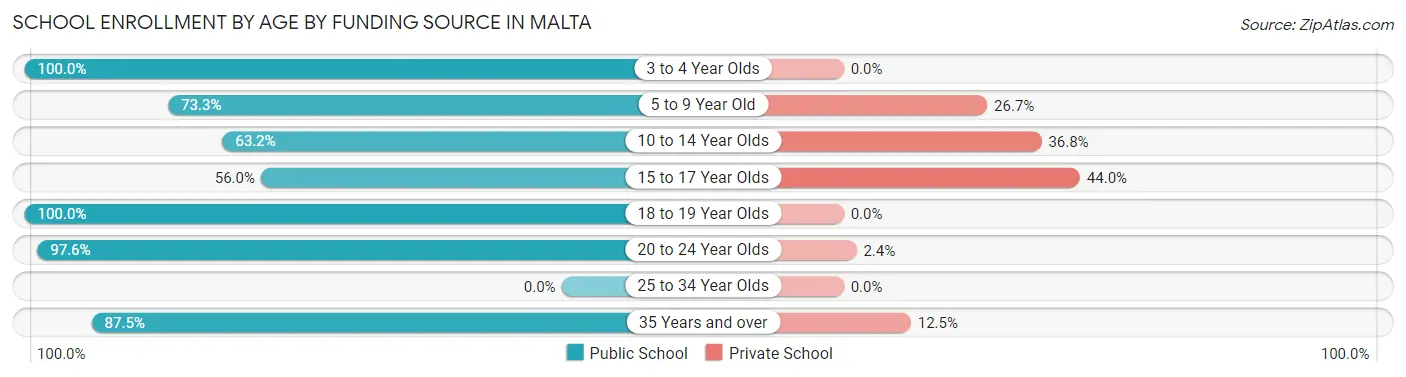
| Age Bracket | Public School | Private School |
| 3 to 4 Year Olds | 17 (100.0%) | 0 (0.0%) |
| 5 to 9 Year Old | 74 (73.3%) | 27 (26.7%) |
| 10 to 14 Year Olds | 72 (63.2%) | 42 (36.8%) |
| 15 to 17 Year Olds | 28 (56.0%) | 22 (44.0%) |
| 18 to 19 Year Olds | 35 (100.0%) | 0 (0.0%) |
| 20 to 24 Year Olds | 41 (97.6%) | 1 (2.4%) |
| 25 to 34 Year Olds | 0 (0.0%) | 0 (0.0%) |
| 35 Years and over | 14 (87.5%) | 2 (12.5%) |
| Total | 281 (74.9%) | 94 (25.1%) |
Educational Attainment by Field of Study in Malta
Liberal arts & history (61 | 23.6%), education (36 | 14.0%), bio, nature & agricultural (26 | 10.1%), visual & performing arts (23 | 8.9%), and arts & humanities (20 | 7.7%) are the most common fields of study among 258 individuals in Malta who have obtained a bachelor's degree or higher.
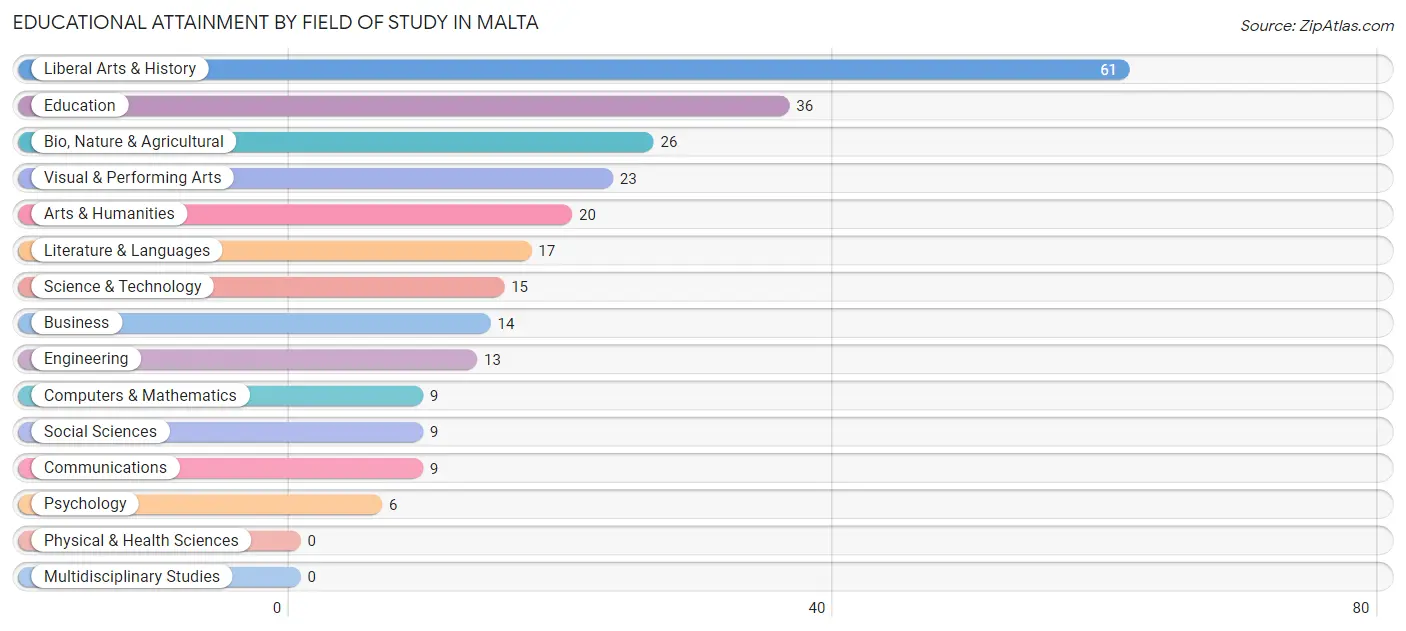
| Field of Study | # Graduates | % Graduates |
| Computers & Mathematics | 9 | 3.5% |
| Bio, Nature & Agricultural | 26 | 10.1% |
| Physical & Health Sciences | 0 | 0.0% |
| Psychology | 6 | 2.3% |
| Social Sciences | 9 | 3.5% |
| Engineering | 13 | 5.0% |
| Multidisciplinary Studies | 0 | 0.0% |
| Science & Technology | 15 | 5.8% |
| Business | 14 | 5.4% |
| Education | 36 | 14.0% |
| Literature & Languages | 17 | 6.6% |
| Liberal Arts & History | 61 | 23.6% |
| Visual & Performing Arts | 23 | 8.9% |
| Communications | 9 | 3.5% |
| Arts & Humanities | 20 | 7.7% |
| Total | 258 | 100.0% |
Transportation & Commute in Malta
Vehicle Availability by Sex in Malta
The most prevalent vehicle ownership categories in Malta are males with 2 vehicles (212, accounting for 46.2%) and females with 2 vehicles (154, making up 72.1%).
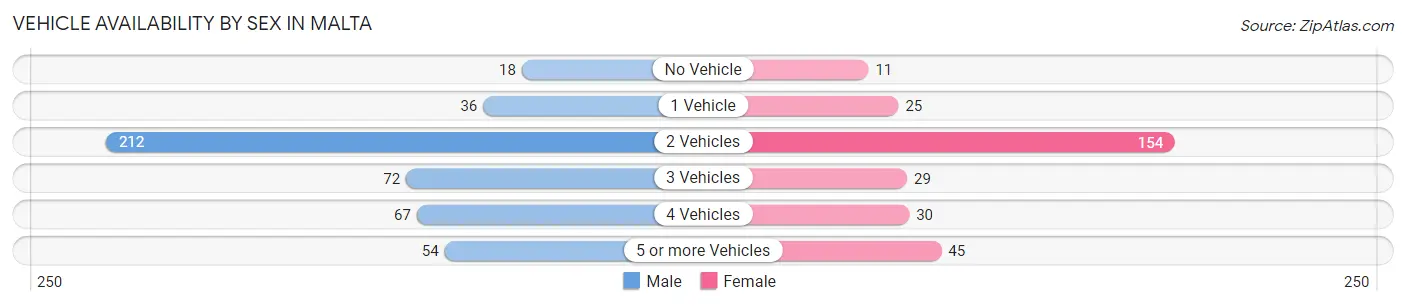
| Vehicles Available | Male | Female |
| No Vehicle | 18 (3.9%) | 11 (3.7%) |
| 1 Vehicle | 36 (7.8%) | 25 (8.5%) |
| 2 Vehicles | 212 (46.2%) | 154 (52.4%) |
| 3 Vehicles | 72 (15.7%) | 29 (9.9%) |
| 4 Vehicles | 67 (14.6%) | 30 (10.2%) |
| 5 or more Vehicles | 54 (11.8%) | 45 (15.3%) |
| Total | 459 (100.0%) | 294 (100.0%) |
Commute Time in Malta
The most frequently occuring commute durations in Malta are 15 to 19 minutes (162 commuters, 23.9%), 20 to 24 minutes (137 commuters, 20.2%), and 45 to 59 minutes (101 commuters, 14.9%).
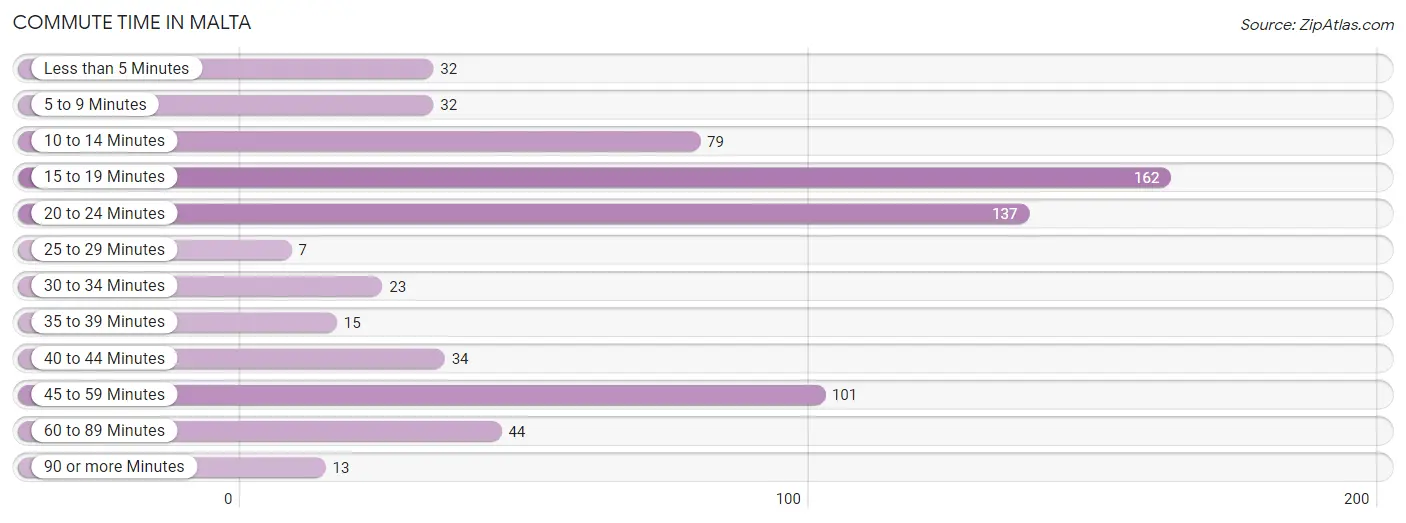
| Commute Time | # Commuters | % Commuters |
| Less than 5 Minutes | 32 | 4.7% |
| 5 to 9 Minutes | 32 | 4.7% |
| 10 to 14 Minutes | 79 | 11.6% |
| 15 to 19 Minutes | 162 | 23.9% |
| 20 to 24 Minutes | 137 | 20.2% |
| 25 to 29 Minutes | 7 | 1.0% |
| 30 to 34 Minutes | 23 | 3.4% |
| 35 to 39 Minutes | 15 | 2.2% |
| 40 to 44 Minutes | 34 | 5.0% |
| 45 to 59 Minutes | 101 | 14.9% |
| 60 to 89 Minutes | 44 | 6.5% |
| 90 or more Minutes | 13 | 1.9% |
Commute Time by Sex in Malta
The most common commute times in Malta are 15 to 19 minutes (84 commuters, 19.1%) for males and 15 to 19 minutes (78 commuters, 32.6%) for females.
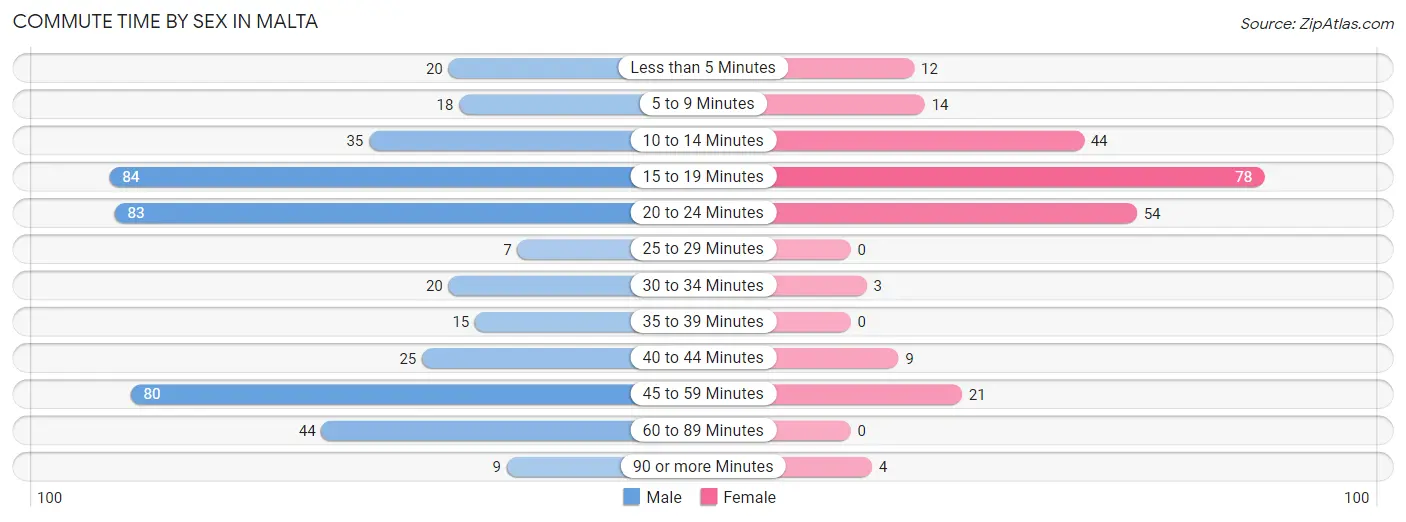
| Commute Time | Male | Female |
| Less than 5 Minutes | 20 (4.5%) | 12 (5.0%) |
| 5 to 9 Minutes | 18 (4.1%) | 14 (5.9%) |
| 10 to 14 Minutes | 35 (8.0%) | 44 (18.4%) |
| 15 to 19 Minutes | 84 (19.1%) | 78 (32.6%) |
| 20 to 24 Minutes | 83 (18.9%) | 54 (22.6%) |
| 25 to 29 Minutes | 7 (1.6%) | 0 (0.0%) |
| 30 to 34 Minutes | 20 (4.5%) | 3 (1.3%) |
| 35 to 39 Minutes | 15 (3.4%) | 0 (0.0%) |
| 40 to 44 Minutes | 25 (5.7%) | 9 (3.8%) |
| 45 to 59 Minutes | 80 (18.2%) | 21 (8.8%) |
| 60 to 89 Minutes | 44 (10.0%) | 0 (0.0%) |
| 90 or more Minutes | 9 (2.1%) | 4 (1.7%) |
Time of Departure to Work by Sex in Malta
The most frequent times of departure to work in Malta are 6:30 AM to 6:59 AM (89, 20.2%) for males and 6:30 AM to 6:59 AM (48, 20.1%) for females.
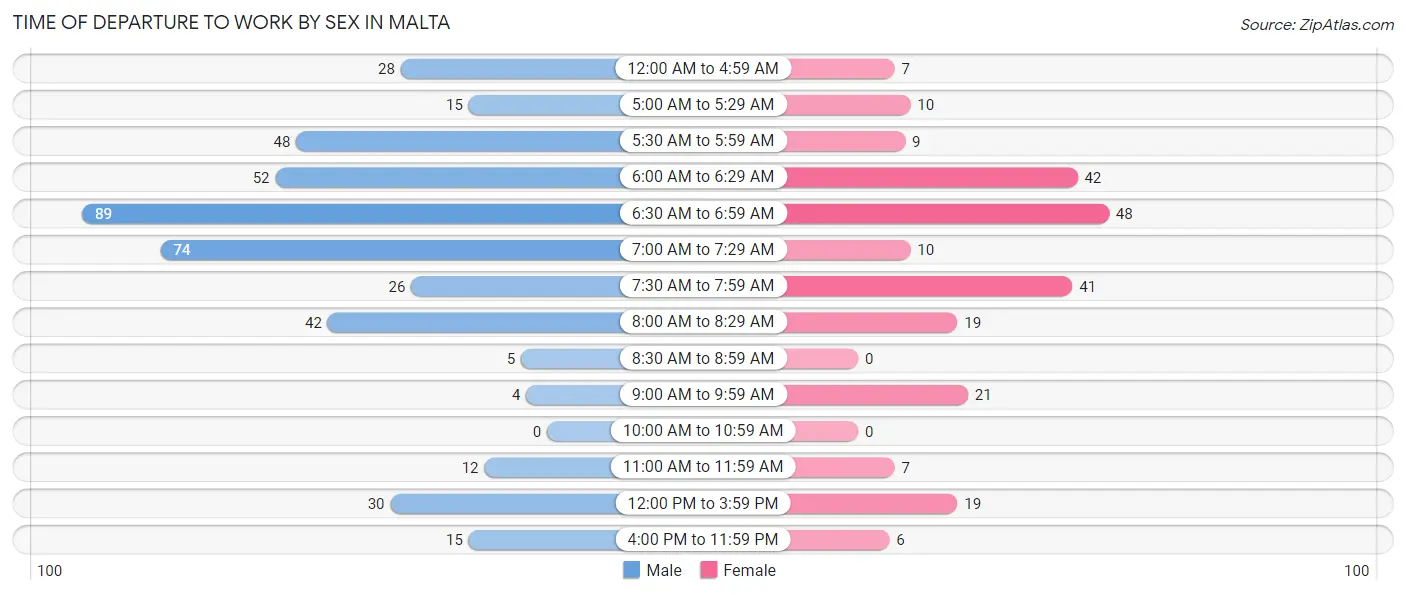
| Time of Departure | Male | Female |
| 12:00 AM to 4:59 AM | 28 (6.4%) | 7 (2.9%) |
| 5:00 AM to 5:29 AM | 15 (3.4%) | 10 (4.2%) |
| 5:30 AM to 5:59 AM | 48 (10.9%) | 9 (3.8%) |
| 6:00 AM to 6:29 AM | 52 (11.8%) | 42 (17.6%) |
| 6:30 AM to 6:59 AM | 89 (20.2%) | 48 (20.1%) |
| 7:00 AM to 7:29 AM | 74 (16.8%) | 10 (4.2%) |
| 7:30 AM to 7:59 AM | 26 (5.9%) | 41 (17.2%) |
| 8:00 AM to 8:29 AM | 42 (9.6%) | 19 (8.0%) |
| 8:30 AM to 8:59 AM | 5 (1.1%) | 0 (0.0%) |
| 9:00 AM to 9:59 AM | 4 (0.9%) | 21 (8.8%) |
| 10:00 AM to 10:59 AM | 0 (0.0%) | 0 (0.0%) |
| 11:00 AM to 11:59 AM | 12 (2.7%) | 7 (2.9%) |
| 12:00 PM to 3:59 PM | 30 (6.8%) | 19 (8.0%) |
| 4:00 PM to 11:59 PM | 15 (3.4%) | 6 (2.5%) |
| Total | 440 (100.0%) | 239 (100.0%) |
Housing Occupancy in Malta
Occupancy by Ownership in Malta
Of the total 525 dwellings in Malta, owner-occupied units account for 343 (65.3%), while renter-occupied units make up 182 (34.7%).
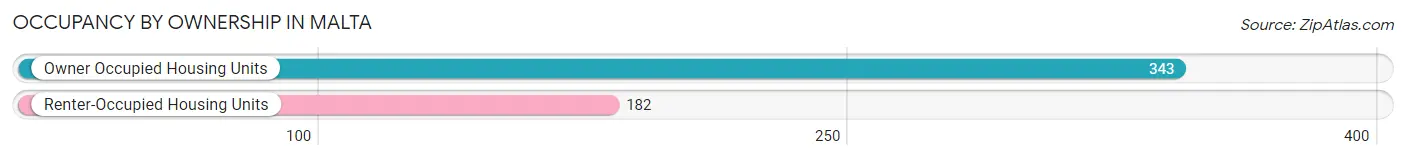
| Occupancy | # Housing Units | % Housing Units |
| Owner Occupied Housing Units | 343 | 65.3% |
| Renter-Occupied Housing Units | 182 | 34.7% |
| Total Occupied Housing Units | 525 | 100.0% |
Occupancy by Household Size in Malta
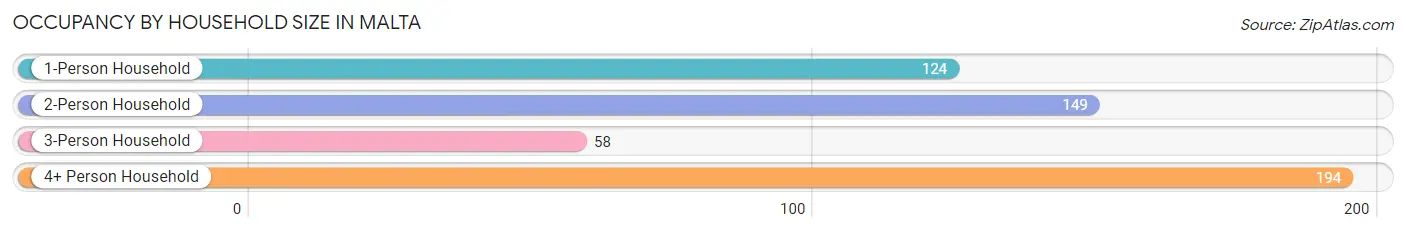
| Household Size | # Housing Units | % Housing Units |
| 1-Person Household | 124 | 23.6% |
| 2-Person Household | 149 | 28.4% |
| 3-Person Household | 58 | 11.1% |
| 4+ Person Household | 194 | 36.9% |
| Total Housing Units | 525 | 100.0% |
Occupancy by Ownership by Household Size in Malta
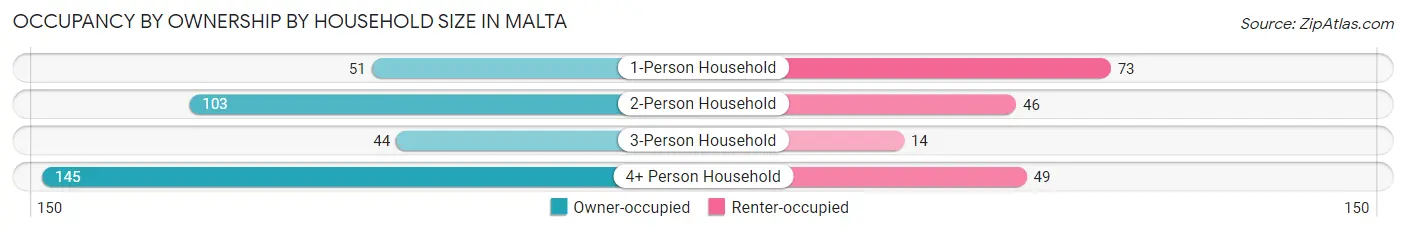
| Household Size | Owner-occupied | Renter-occupied |
| 1-Person Household | 51 (41.1%) | 73 (58.9%) |
| 2-Person Household | 103 (69.1%) | 46 (30.9%) |
| 3-Person Household | 44 (75.9%) | 14 (24.1%) |
| 4+ Person Household | 145 (74.7%) | 49 (25.3%) |
| Total Housing Units | 343 (65.3%) | 182 (34.7%) |
Occupancy by Educational Attainment in Malta
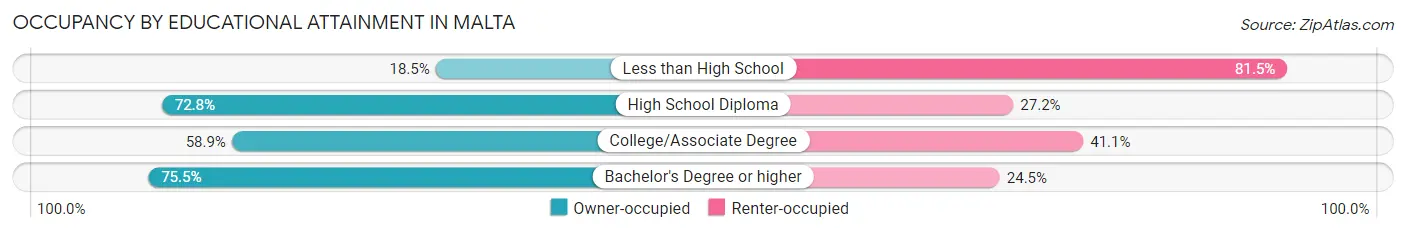
| Household Size | Owner-occupied | Renter-occupied |
| Less than High School | 5 (18.5%) | 22 (81.5%) |
| High School Diploma | 99 (72.8%) | 37 (27.2%) |
| College/Associate Degree | 122 (58.9%) | 85 (41.1%) |
| Bachelor's Degree or higher | 117 (75.5%) | 38 (24.5%) |
Occupancy by Age of Householder in Malta
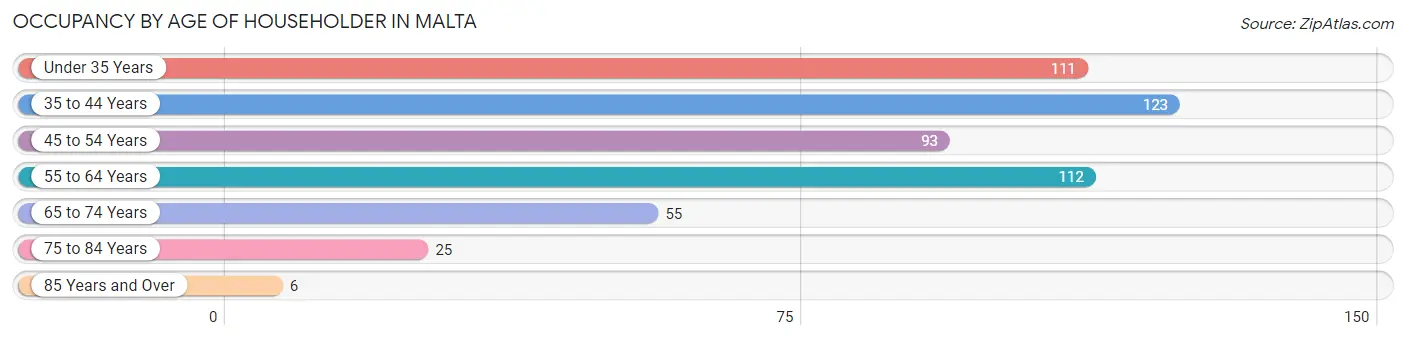
| Age Bracket | # Households | % Households |
| Under 35 Years | 111 | 21.1% |
| 35 to 44 Years | 123 | 23.4% |
| 45 to 54 Years | 93 | 17.7% |
| 55 to 64 Years | 112 | 21.3% |
| 65 to 74 Years | 55 | 10.5% |
| 75 to 84 Years | 25 | 4.8% |
| 85 Years and Over | 6 | 1.1% |
| Total | 525 | 100.0% |
Housing Finances in Malta
Median Income by Occupancy in Malta
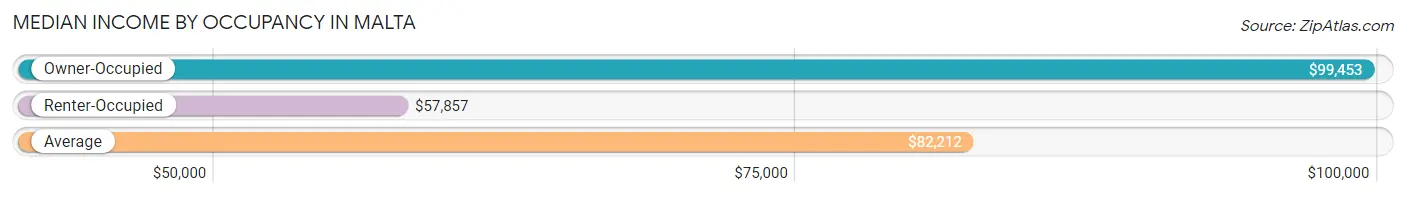
| Occupancy Type | # Households | Median Income |
| Owner-Occupied | 343 (65.3%) | $99,453 |
| Renter-Occupied | 182 (34.7%) | $57,857 |
| Average | 525 (100.0%) | $82,212 |
Occupancy by Householder Income Bracket in Malta
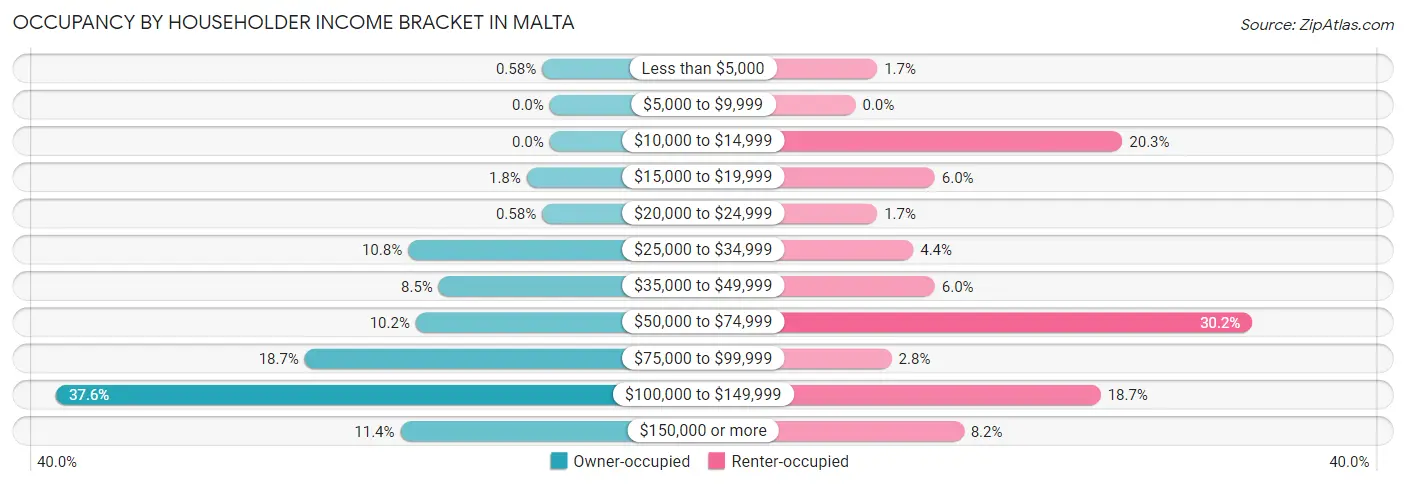
| Income Bracket | Owner-occupied | Renter-occupied |
| Less than $5,000 | 2 (0.6%) | 3 (1.7%) |
| $5,000 to $9,999 | 0 (0.0%) | 0 (0.0%) |
| $10,000 to $14,999 | 0 (0.0%) | 37 (20.3%) |
| $15,000 to $19,999 | 6 (1.8%) | 11 (6.0%) |
| $20,000 to $24,999 | 2 (0.6%) | 3 (1.7%) |
| $25,000 to $34,999 | 37 (10.8%) | 8 (4.4%) |
| $35,000 to $49,999 | 29 (8.5%) | 11 (6.0%) |
| $50,000 to $74,999 | 35 (10.2%) | 55 (30.2%) |
| $75,000 to $99,999 | 64 (18.7%) | 5 (2.8%) |
| $100,000 to $149,999 | 129 (37.6%) | 34 (18.7%) |
| $150,000 or more | 39 (11.4%) | 15 (8.2%) |
| Total | 343 (100.0%) | 182 (100.0%) |
Monthly Housing Cost Tiers in Malta
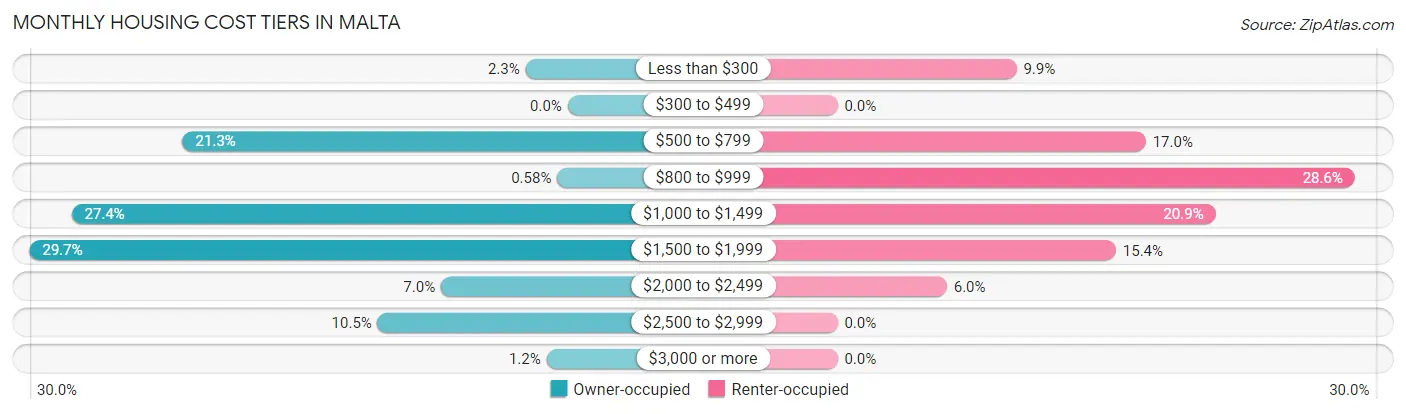
| Monthly Cost | Owner-occupied | Renter-occupied |
| Less than $300 | 8 (2.3%) | 18 (9.9%) |
| $300 to $499 | 0 (0.0%) | 0 (0.0%) |
| $500 to $799 | 73 (21.3%) | 31 (17.0%) |
| $800 to $999 | 2 (0.6%) | 52 (28.6%) |
| $1,000 to $1,499 | 94 (27.4%) | 38 (20.9%) |
| $1,500 to $1,999 | 102 (29.7%) | 28 (15.4%) |
| $2,000 to $2,499 | 24 (7.0%) | 11 (6.0%) |
| $2,500 to $2,999 | 36 (10.5%) | 0 (0.0%) |
| $3,000 or more | 4 (1.2%) | 0 (0.0%) |
| Total | 343 (100.0%) | 182 (100.0%) |
Physical Housing Characteristics in Malta
Housing Structures in Malta
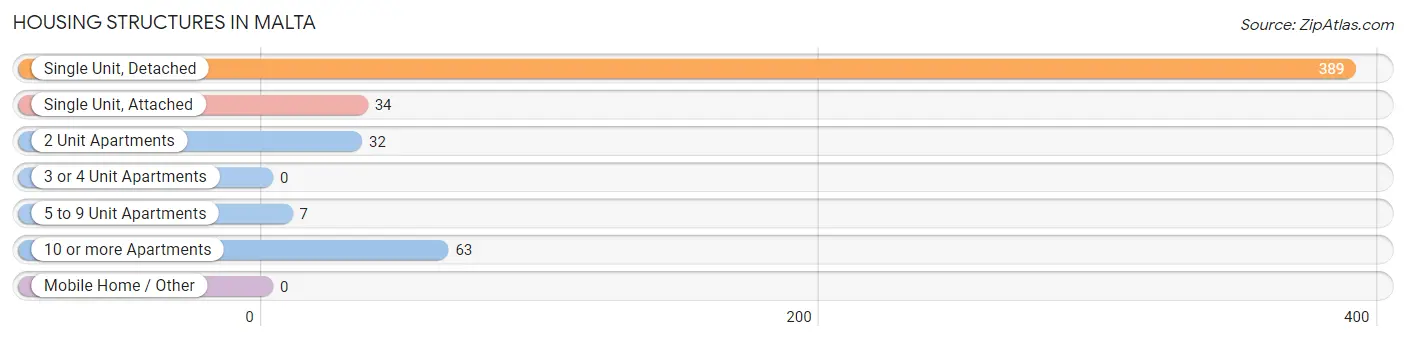
| Structure Type | # Housing Units | % Housing Units |
| Single Unit, Detached | 389 | 74.1% |
| Single Unit, Attached | 34 | 6.5% |
| 2 Unit Apartments | 32 | 6.1% |
| 3 or 4 Unit Apartments | 0 | 0.0% |
| 5 to 9 Unit Apartments | 7 | 1.3% |
| 10 or more Apartments | 63 | 12.0% |
| Mobile Home / Other | 0 | 0.0% |
| Total | 525 | 100.0% |
Housing Structures by Occupancy in Malta
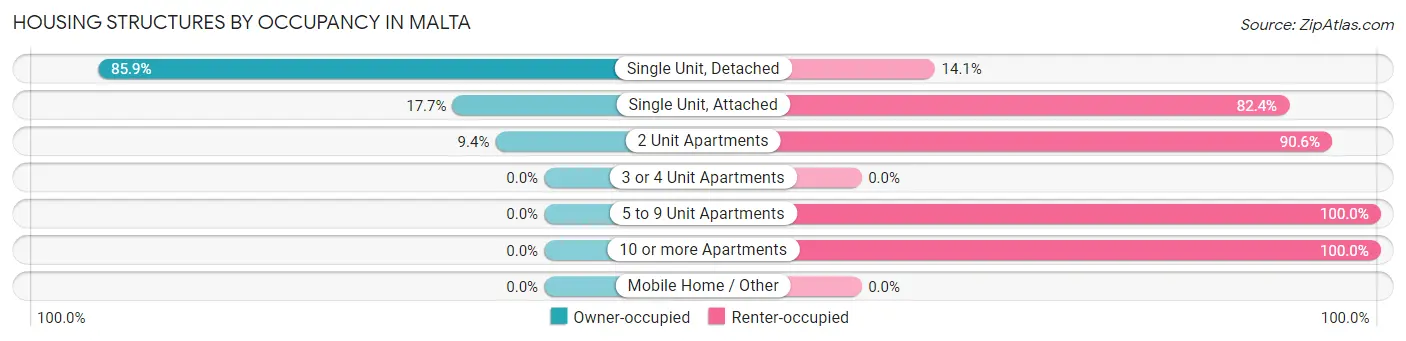
| Structure Type | Owner-occupied | Renter-occupied |
| Single Unit, Detached | 334 (85.9%) | 55 (14.1%) |
| Single Unit, Attached | 6 (17.6%) | 28 (82.4%) |
| 2 Unit Apartments | 3 (9.4%) | 29 (90.6%) |
| 3 or 4 Unit Apartments | 0 (0.0%) | 0 (0.0%) |
| 5 to 9 Unit Apartments | 0 (0.0%) | 7 (100.0%) |
| 10 or more Apartments | 0 (0.0%) | 63 (100.0%) |
| Mobile Home / Other | 0 (0.0%) | 0 (0.0%) |
| Total | 343 (65.3%) | 182 (34.7%) |
Housing Structures by Number of Rooms in Malta
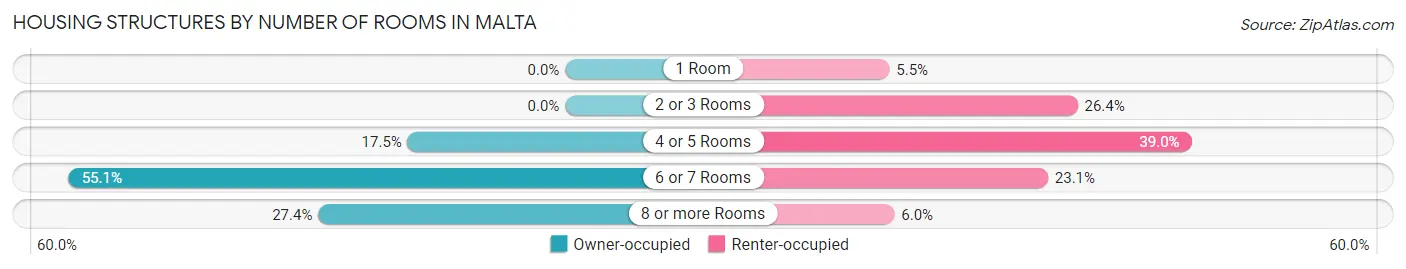
| Number of Rooms | Owner-occupied | Renter-occupied |
| 1 Room | 0 (0.0%) | 10 (5.5%) |
| 2 or 3 Rooms | 0 (0.0%) | 48 (26.4%) |
| 4 or 5 Rooms | 60 (17.5%) | 71 (39.0%) |
| 6 or 7 Rooms | 189 (55.1%) | 42 (23.1%) |
| 8 or more Rooms | 94 (27.4%) | 11 (6.0%) |
| Total | 343 (100.0%) | 182 (100.0%) |
Housing Structure by Heating Type in Malta
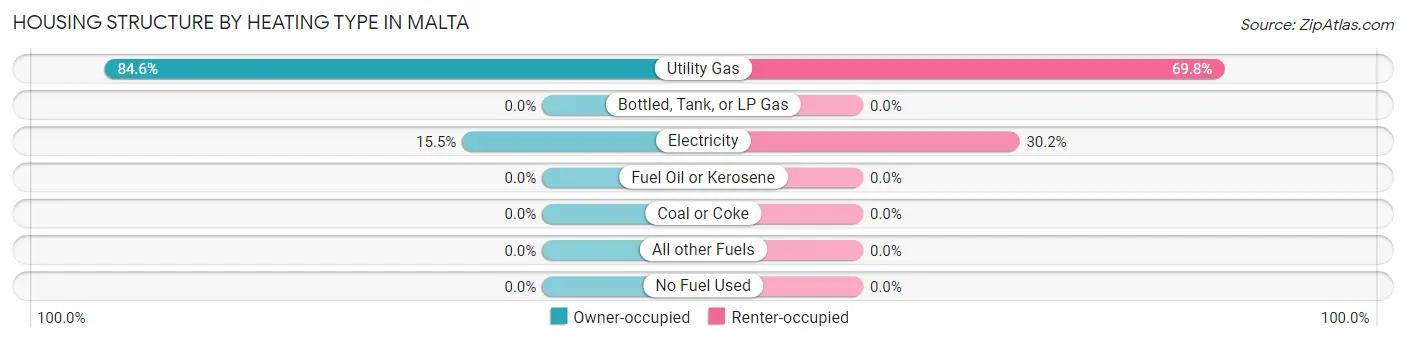
| Heating Type | Owner-occupied | Renter-occupied |
| Utility Gas | 290 (84.6%) | 127 (69.8%) |
| Bottled, Tank, or LP Gas | 0 (0.0%) | 0 (0.0%) |
| Electricity | 53 (15.4%) | 55 (30.2%) |
| Fuel Oil or Kerosene | 0 (0.0%) | 0 (0.0%) |
| Coal or Coke | 0 (0.0%) | 0 (0.0%) |
| All other Fuels | 0 (0.0%) | 0 (0.0%) |
| No Fuel Used | 0 (0.0%) | 0 (0.0%) |
| Total | 343 (100.0%) | 182 (100.0%) |
Household Vehicle Usage in Malta
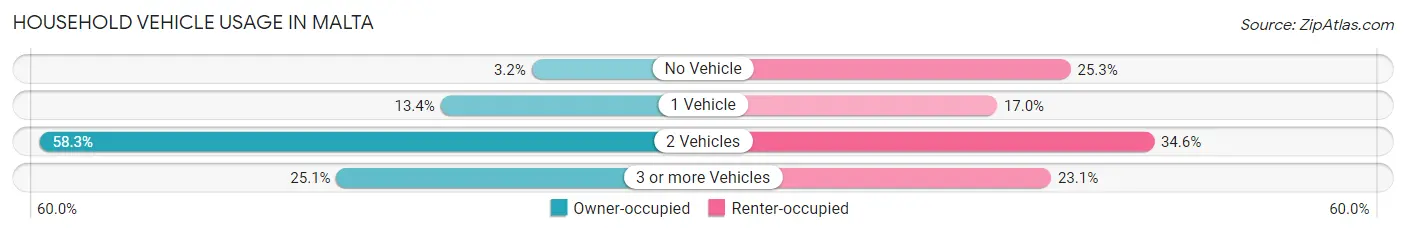
| Vehicles per Household | Owner-occupied | Renter-occupied |
| No Vehicle | 11 (3.2%) | 46 (25.3%) |
| 1 Vehicle | 46 (13.4%) | 31 (17.0%) |
| 2 Vehicles | 200 (58.3%) | 63 (34.6%) |
| 3 or more Vehicles | 86 (25.1%) | 42 (23.1%) |
| Total | 343 (100.0%) | 182 (100.0%) |
Real Estate & Mortgages in Malta
Real Estate and Mortgage Overview in Malta
| Characteristic | Without Mortgage | With Mortgage |
| Housing Units | 74 | 269 |
| Median Property Value | $144,800 | $179,000 |
| Median Household Income | $29,485 | $36 |
| Monthly Housing Costs | $748 | $4 |
| Real Estate Taxes | $4,649 | $0 |
Property Value by Mortgage Status in Malta
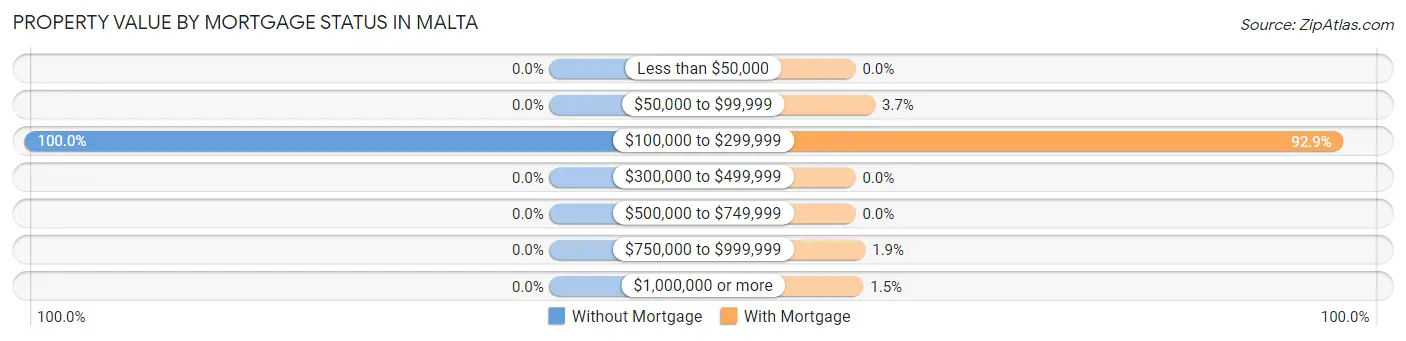
| Property Value | Without Mortgage | With Mortgage |
| Less than $50,000 | 0 (0.0%) | 0 (0.0%) |
| $50,000 to $99,999 | 0 (0.0%) | 10 (3.7%) |
| $100,000 to $299,999 | 74 (100.0%) | 250 (92.9%) |
| $300,000 to $499,999 | 0 (0.0%) | 0 (0.0%) |
| $500,000 to $749,999 | 0 (0.0%) | 0 (0.0%) |
| $750,000 to $999,999 | 0 (0.0%) | 5 (1.9%) |
| $1,000,000 or more | 0 (0.0%) | 4 (1.5%) |
| Total | 74 (100.0%) | 269 (100.0%) |
Household Income by Mortgage Status in Malta
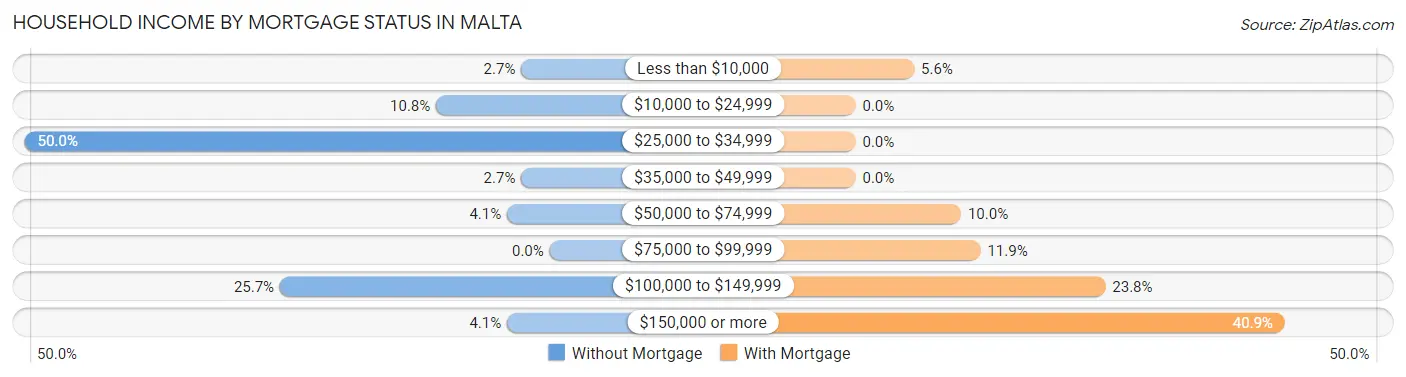
| Household Income | Without Mortgage | With Mortgage |
| Less than $10,000 | 2 (2.7%) | 15 (5.6%) |
| $10,000 to $24,999 | 8 (10.8%) | 0 (0.0%) |
| $25,000 to $34,999 | 37 (50.0%) | 0 (0.0%) |
| $35,000 to $49,999 | 2 (2.7%) | 0 (0.0%) |
| $50,000 to $74,999 | 3 (4.1%) | 27 (10.0%) |
| $75,000 to $99,999 | 0 (0.0%) | 32 (11.9%) |
| $100,000 to $149,999 | 19 (25.7%) | 64 (23.8%) |
| $150,000 or more | 3 (4.1%) | 110 (40.9%) |
| Total | 74 (100.0%) | 269 (100.0%) |
Property Value to Household Income Ratio in Malta
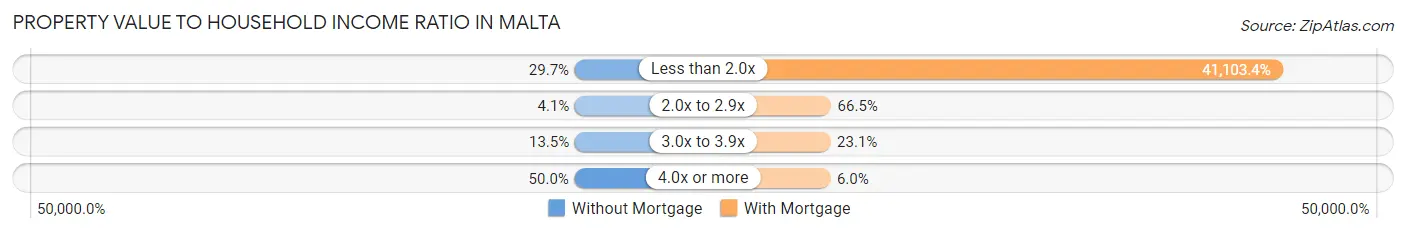
| Value-to-Income Ratio | Without Mortgage | With Mortgage |
| Less than 2.0x | 22 (29.7%) | 110,568 (41,103.4%) |
| 2.0x to 2.9x | 3 (4.1%) | 179 (66.5%) |
| 3.0x to 3.9x | 10 (13.5%) | 62 (23.1%) |
| 4.0x or more | 37 (50.0%) | 16 (5.9%) |
| Total | 74 (100.0%) | 269 (100.0%) |
Real Estate Taxes by Mortgage Status in Malta
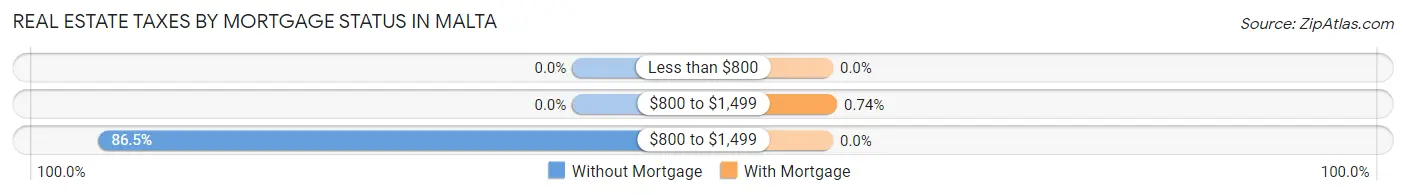
| Property Taxes | Without Mortgage | With Mortgage |
| Less than $800 | 0 (0.0%) | 0 (0.0%) |
| $800 to $1,499 | 0 (0.0%) | 2 (0.7%) |
| $800 to $1,499 | 64 (86.5%) | 0 (0.0%) |
| Total | 74 (100.0%) | 269 (100.0%) |
Health & Disability in Malta
Health Insurance Coverage by Age in Malta
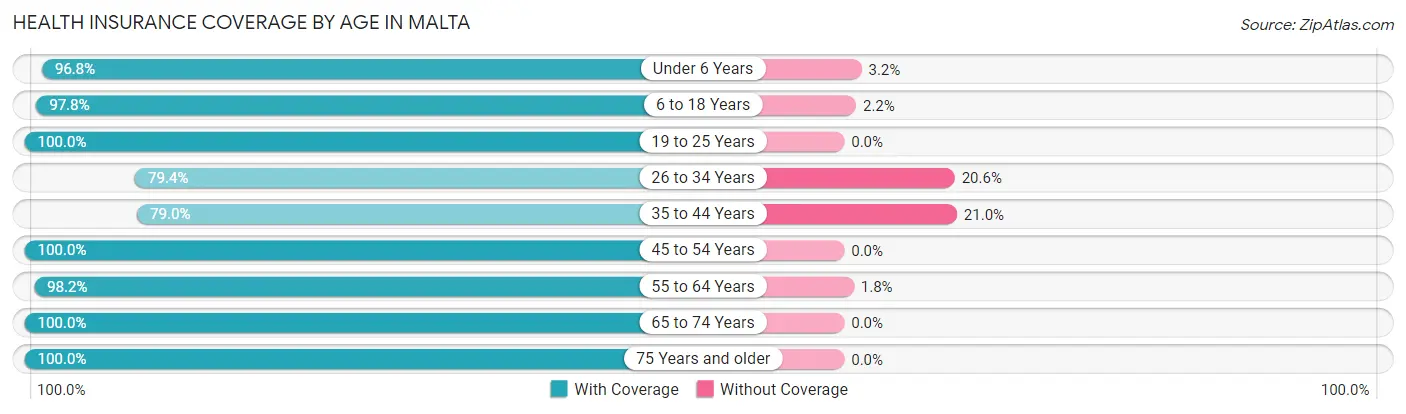
| Age Bracket | With Coverage | Without Coverage |
| Under 6 Years | 181 (96.8%) | 6 (3.2%) |
| 6 to 18 Years | 268 (97.8%) | 6 (2.2%) |
| 19 to 25 Years | 139 (100.0%) | 0 (0.0%) |
| 26 to 34 Years | 158 (79.4%) | 41 (20.6%) |
| 35 to 44 Years | 173 (79.0%) | 46 (21.0%) |
| 45 to 54 Years | 169 (100.0%) | 0 (0.0%) |
| 55 to 64 Years | 166 (98.2%) | 3 (1.8%) |
| 65 to 74 Years | 119 (100.0%) | 0 (0.0%) |
| 75 Years and older | 60 (100.0%) | 0 (0.0%) |
| Total | 1,433 (93.4%) | 102 (6.6%) |
Health Insurance Coverage by Citizenship Status in Malta
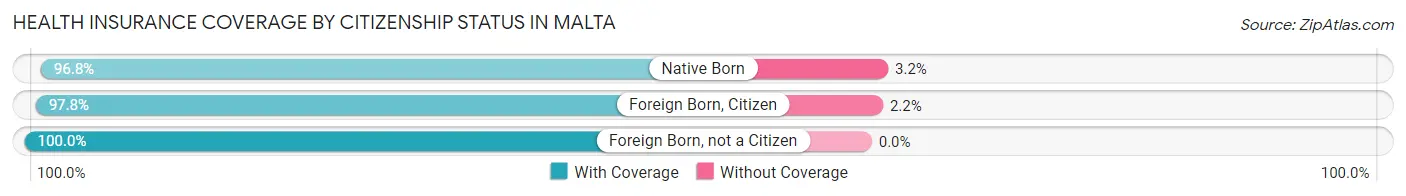
| Citizenship Status | With Coverage | Without Coverage |
| Native Born | 181 (96.8%) | 6 (3.2%) |
| Foreign Born, Citizen | 268 (97.8%) | 6 (2.2%) |
| Foreign Born, not a Citizen | 139 (100.0%) | 0 (0.0%) |
Health Insurance Coverage by Household Income in Malta
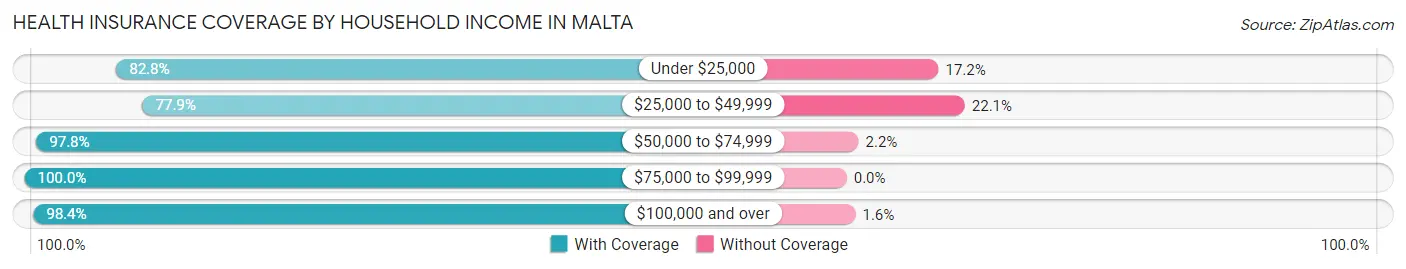
| Household Income | With Coverage | Without Coverage |
| Under $25,000 | 53 (82.8%) | 11 (17.2%) |
| $25,000 to $49,999 | 264 (77.9%) | 75 (22.1%) |
| $50,000 to $74,999 | 177 (97.8%) | 4 (2.2%) |
| $75,000 to $99,999 | 220 (100.0%) | 0 (0.0%) |
| $100,000 and over | 719 (98.4%) | 12 (1.6%) |
Public vs Private Health Insurance Coverage by Age in Malta
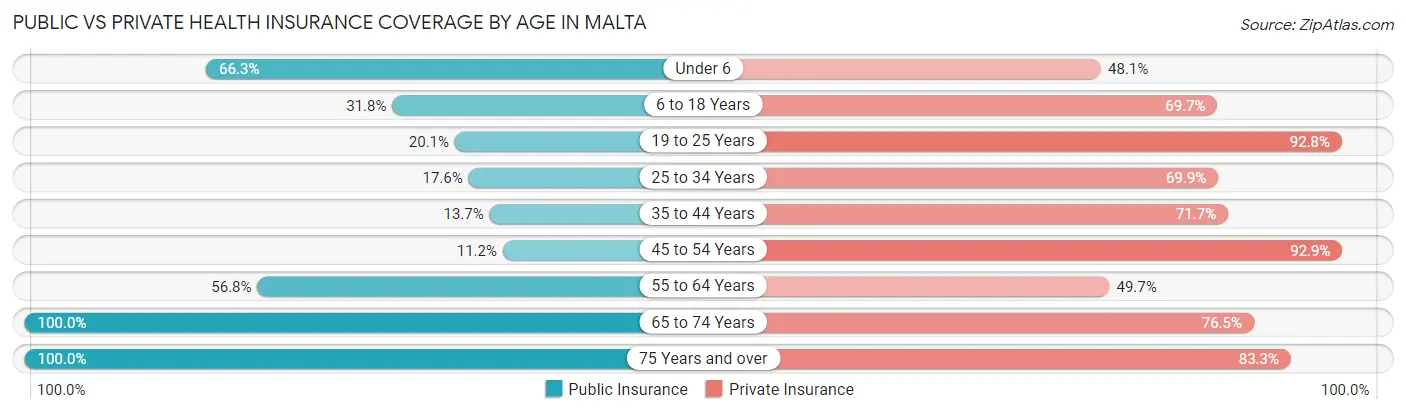
| Age Bracket | Public Insurance | Private Insurance |
| Under 6 | 124 (66.3%) | 90 (48.1%) |
| 6 to 18 Years | 87 (31.8%) | 191 (69.7%) |
| 19 to 25 Years | 28 (20.1%) | 129 (92.8%) |
| 25 to 34 Years | 35 (17.6%) | 139 (69.9%) |
| 35 to 44 Years | 30 (13.7%) | 157 (71.7%) |
| 45 to 54 Years | 19 (11.2%) | 157 (92.9%) |
| 55 to 64 Years | 96 (56.8%) | 84 (49.7%) |
| 65 to 74 Years | 119 (100.0%) | 91 (76.5%) |
| 75 Years and over | 60 (100.0%) | 50 (83.3%) |
| Total | 598 (39.0%) | 1,088 (70.9%) |
Disability Status by Sex by Age in Malta
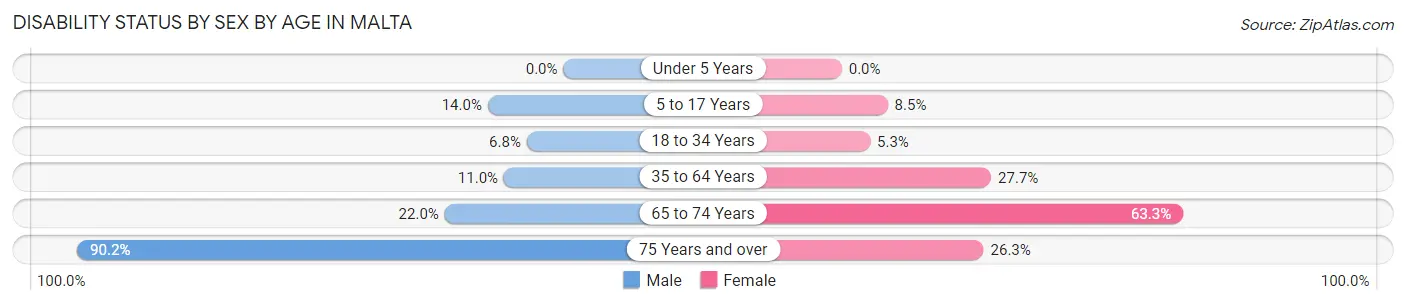
| Age Bracket | Male | Female |
| Under 5 Years | 0 (0.0%) | 0 (0.0%) |
| 5 to 17 Years | 24 (14.0%) | 8 (8.5%) |
| 18 to 34 Years | 10 (6.8%) | 11 (5.3%) |
| 35 to 64 Years | 32 (11.0%) | 74 (27.7%) |
| 65 to 74 Years | 13 (22.0%) | 38 (63.3%) |
| 75 Years and over | 37 (90.2%) | 5 (26.3%) |
Disability Class by Sex by Age in Malta
Disability Class: Hearing Difficulty
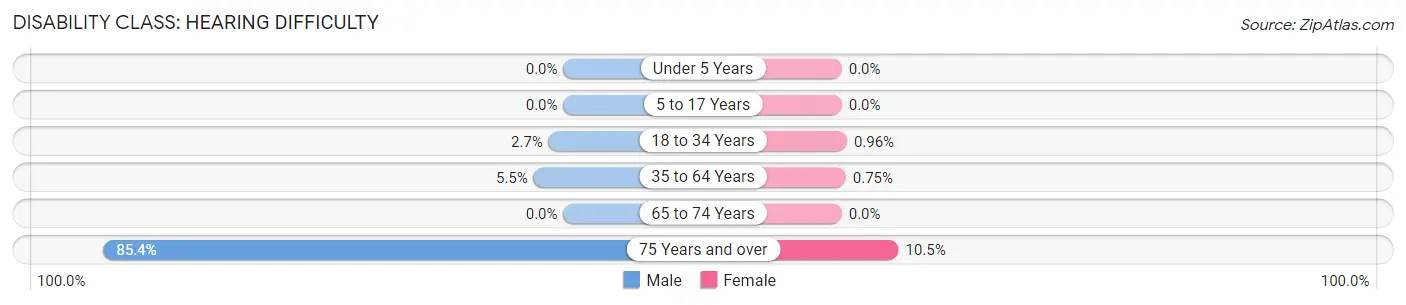
| Age Bracket | Male | Female |
| Under 5 Years | 0 (0.0%) | 0 (0.0%) |
| 5 to 17 Years | 0 (0.0%) | 0 (0.0%) |
| 18 to 34 Years | 4 (2.7%) | 2 (1.0%) |
| 35 to 64 Years | 16 (5.5%) | 2 (0.7%) |
| 65 to 74 Years | 0 (0.0%) | 0 (0.0%) |
| 75 Years and over | 35 (85.4%) | 2 (10.5%) |
Disability Class: Vision Difficulty
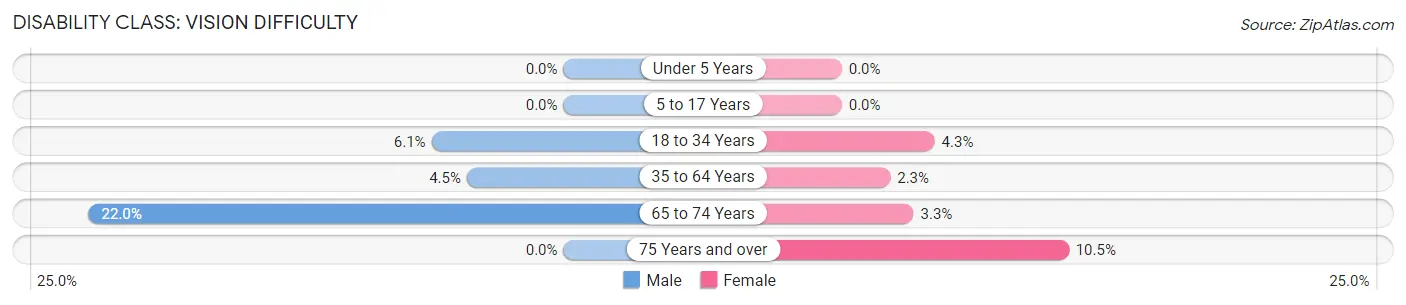
| Age Bracket | Male | Female |
| Under 5 Years | 0 (0.0%) | 0 (0.0%) |
| 5 to 17 Years | 0 (0.0%) | 0 (0.0%) |
| 18 to 34 Years | 9 (6.1%) | 9 (4.3%) |
| 35 to 64 Years | 13 (4.5%) | 6 (2.2%) |
| 65 to 74 Years | 13 (22.0%) | 2 (3.3%) |
| 75 Years and over | 0 (0.0%) | 2 (10.5%) |
Disability Class: Cognitive Difficulty
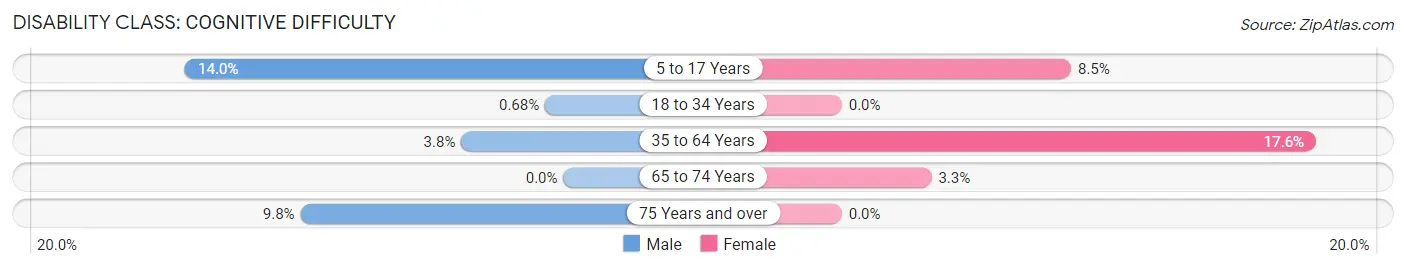
| Age Bracket | Male | Female |
| 5 to 17 Years | 24 (14.0%) | 8 (8.5%) |
| 18 to 34 Years | 1 (0.7%) | 0 (0.0%) |
| 35 to 64 Years | 11 (3.8%) | 47 (17.6%) |
| 65 to 74 Years | 0 (0.0%) | 2 (3.3%) |
| 75 Years and over | 4 (9.8%) | 0 (0.0%) |
Disability Class: Ambulatory Difficulty
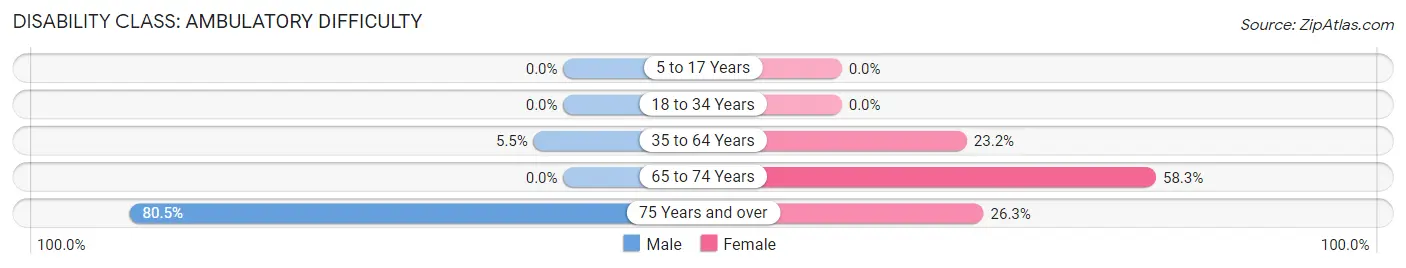
| Age Bracket | Male | Female |
| 5 to 17 Years | 0 (0.0%) | 0 (0.0%) |
| 18 to 34 Years | 0 (0.0%) | 0 (0.0%) |
| 35 to 64 Years | 16 (5.5%) | 62 (23.2%) |
| 65 to 74 Years | 0 (0.0%) | 35 (58.3%) |
| 75 Years and over | 33 (80.5%) | 5 (26.3%) |
Disability Class: Self-Care Difficulty
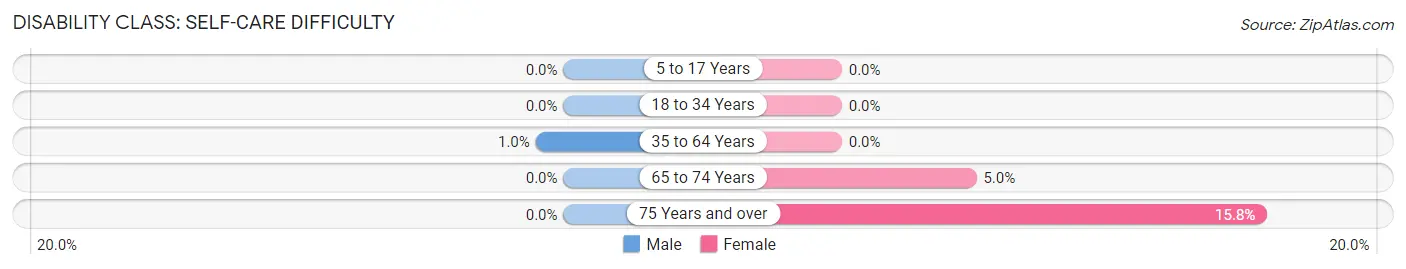
| Age Bracket | Male | Female |
| 5 to 17 Years | 0 (0.0%) | 0 (0.0%) |
| 18 to 34 Years | 0 (0.0%) | 0 (0.0%) |
| 35 to 64 Years | 3 (1.0%) | 0 (0.0%) |
| 65 to 74 Years | 0 (0.0%) | 3 (5.0%) |
| 75 Years and over | 0 (0.0%) | 3 (15.8%) |
Technology Access in Malta
Computing Device Access in Malta
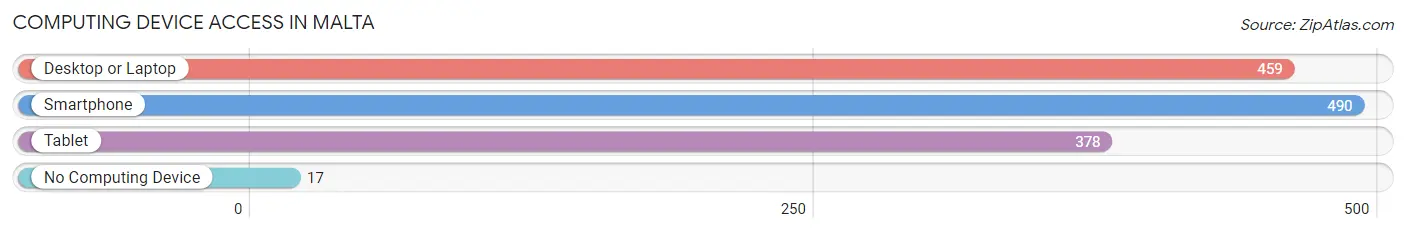
| Device Type | # Households | % Households |
| Desktop or Laptop | 459 | 87.4% |
| Smartphone | 490 | 93.3% |
| Tablet | 378 | 72.0% |
| No Computing Device | 17 | 3.2% |
| Total | 525 | 100.0% |
Internet Access in Malta
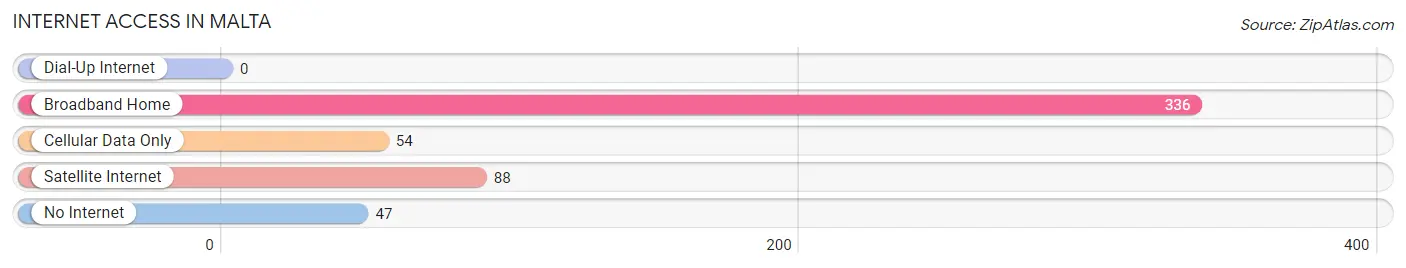
| Internet Type | # Households | % Households |
| Dial-Up Internet | 0 | 0.0% |
| Broadband Home | 336 | 64.0% |
| Cellular Data Only | 54 | 10.3% |
| Satellite Internet | 88 | 16.8% |
| No Internet | 47 | 8.9% |
| Total | 525 | 100.0% |
Malta Summary
Malta, Illinois is a small village located in DeKalb County, Illinois. It is situated about 60 miles west of Chicago and is part of the DeKalb-Sycamore Metropolitan Statistical Area. The village has a population of approximately 3,000 people and is known for its small-town charm and friendly atmosphere.
History
Malta was founded in 1837 by a group of settlers from New York. The village was named after the island of Malta, which was located in the Mediterranean Sea. The settlers were attracted to the area due to its fertile soil and abundant natural resources. The first settlers built a sawmill and gristmill, which provided the foundation for the village’s economy.
In 1845, the village was incorporated and the first post office was established. The village grew slowly but steadily over the next few decades, and by the turn of the century, it had become a thriving agricultural community. The village was also home to several small businesses, including a blacksmith shop, a general store, and a hotel.
Geography
Malta is located in the northern part of DeKalb County, Illinois. It is situated about 60 miles west of Chicago and is part of the DeKalb-Sycamore Metropolitan Statistical Area. The village is located on the banks of the Kishwaukee River and is surrounded by rolling hills and farmland. The village is also located near several state parks, including the Kishwaukee River State Park and the Shabbona Lake State Park.
Economy
Malta’s economy is largely based on agriculture. The village is home to several farms, which produce a variety of crops, including corn, soybeans, and wheat. The village is also home to several small businesses, including a grocery store, a hardware store, and a restaurant.
Demographics
As of the 2010 census, the population of Malta was 3,039. The racial makeup of the village was 97.3% White, 0.7% African American, 0.2% Native American, 0.3% Asian, 0.1% Pacific Islander, 0.7% from other races, and 0.9% from two or more races. Hispanic or Latino of any race were 2.2% of the population.
The median income for a household in the village was $50,972, and the median income for a family was $60,972. The per capita income for the village was $22,972. About 4.3% of families and 5.7% of the population were below the poverty line, including 6.3% of those under age 18 and 4.3% of those age 65 or over.
Malta is a small village with a rich history and a friendly atmosphere. The village is home to several small businesses and farms, and its economy is largely based on agriculture. The village has a diverse population and a median income that is slightly higher than the national average.
Common Questions
What is Per Capita Income in Malta?
Per Capita income in Malta is $30,948.
What is the Median Family Income in Malta?
Median Family Income in Malta is $103,500.
What is the Median Household income in Malta?
Median Household Income in Malta is $82,212.
What is Income or Wage Gap in Malta?
Income or Wage Gap in Malta is 42.5%.
Women in Malta earn 57.5 cents for every dollar earned by a man.
What is Inequality or Gini Index in Malta?
Inequality or Gini Index in Malta is 0.39.
What is the Total Population of Malta?
Total Population of Malta is 1,535.
What is the Total Male Population of Malta?
Total Male Population of Malta is 790.
What is the Total Female Population of Malta?
Total Female Population of Malta is 745.
What is the Ratio of Males per 100 Females in Malta?
There are 106.04 Males per 100 Females in Malta.
What is the Ratio of Females per 100 Males in Malta?
There are 94.30 Females per 100 Males in Malta.
What is the Median Population Age in Malta?
Median Population Age in Malta is 33.7 Years.
What is the Average Family Size in Malta
Average Family Size in Malta is 3.5 People.
What is the Average Household Size in Malta
Average Household Size in Malta is 2.9 People.
How Large is the Labor Force in Malta?
There are 793 People in the Labor Forcein in Malta.
What is the Percentage of People in the Labor Force in Malta?
71.2% of People are in the Labor Force in Malta.
What is the Unemployment Rate in Malta?
Unemployment Rate in Malta is 2.9%.