Zip Codes with the Highest Percentage of Population with a Degree in Liberal Arts and History in Downers Grove, IL
RELATED REPORTS & OPTIONS
Liberal Arts and History
Downers Grove
Compare Zip Codes
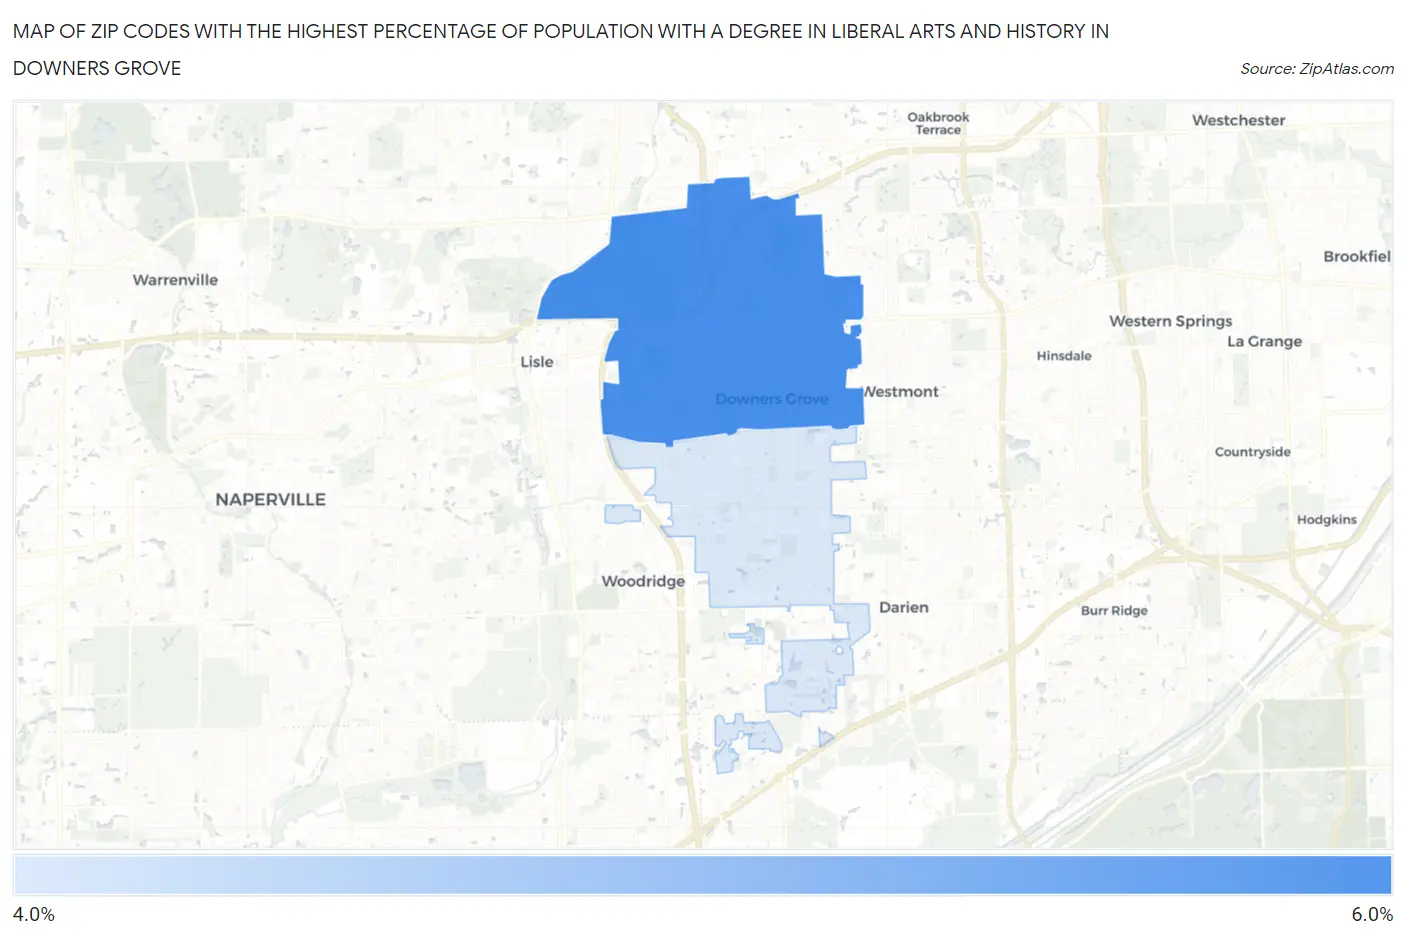
Map of Zip Codes with the Highest Percentage of Population with a Degree in Liberal Arts and History in Downers Grove
4.4%
5.1%
Zip Codes with the Highest Percentage of Population with a Degree in Liberal Arts and History in Downers Grove, IL
| Zip Code | % Graduates | vs State | vs National | |
| 1. | 60515 | 5.1% | 4.7%(+0.377)#430 | 4.9%(+0.218)#11,067 |
| 2. | 60516 | 4.4% | 4.7%(-0.275)#507 | 4.9%(-0.434)#13,163 |
1
Common Questions
What are the Top Zip Codes with the Highest Percentage of Population with a Degree in Liberal Arts and History in Downers Grove, IL?
Top Zip Codes with the Highest Percentage of Population with a Degree in Liberal Arts and History in Downers Grove, IL are:
What zip code has the Highest Percentage of Population with a Degree in Liberal Arts and History in Downers Grove, IL?
60515 has the Highest Percentage of Population with a Degree in Liberal Arts and History in Downers Grove, IL with 5.1%.
What is the Percentage of Population with a Degree in Liberal Arts and History in Downers Grove, IL?
Percentage of Population with a Degree in Liberal Arts and History in Downers Grove is 4.6%.
What is the Percentage of Population with a Degree in Liberal Arts and History in Illinois?
Percentage of Population with a Degree in Liberal Arts and History in Illinois is 4.7%.
What is the Percentage of Population with a Degree in Liberal Arts and History in the United States?
Percentage of Population with a Degree in Liberal Arts and History in the United States is 4.9%.