Zip Codes with the Highest Percentage of Population with a Degree in Liberal Arts and History in East Saint Louis, IL
RELATED REPORTS & OPTIONS
Liberal Arts and History
East Saint Louis
Compare Zip Codes
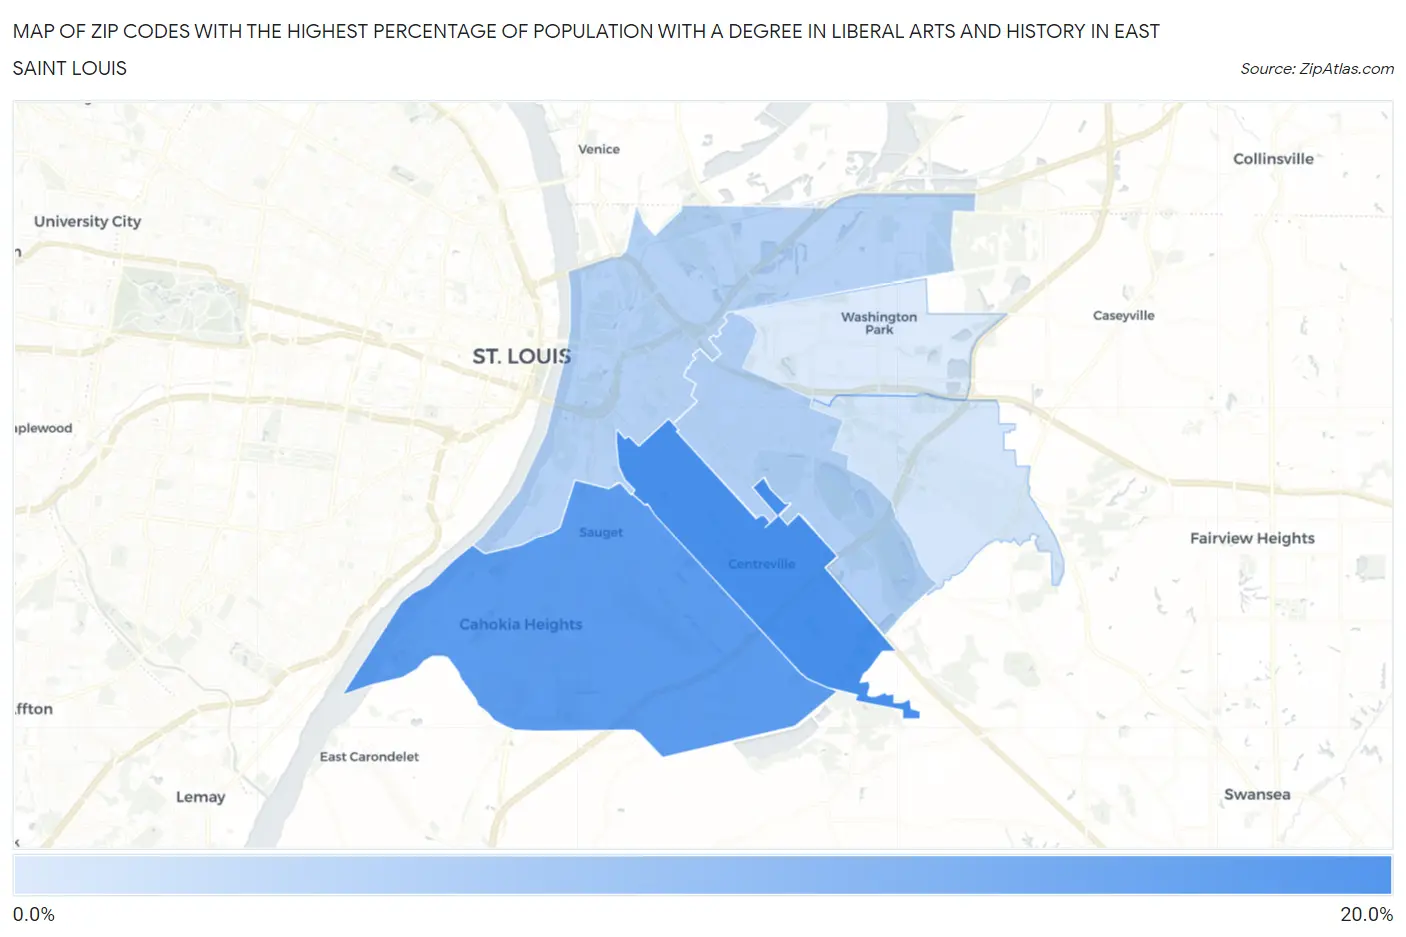
Map of Zip Codes with the Highest Percentage of Population with a Degree in Liberal Arts and History in East Saint Louis
6.3%
17.8%
Zip Codes with the Highest Percentage of Population with a Degree in Liberal Arts and History in East Saint Louis, IL
| Zip Code | % Graduates | vs State | vs National | |
| 1. | 62207 | 17.8% | 4.7%(+13.1)#29 | 4.9%(+12.9)#1,062 |
| 2. | 62206 | 16.3% | 4.7%(+11.6)#40 | 4.9%(+11.5)#1,216 |
| 3. | 62205 | 9.4% | 4.7%(+4.72)#131 | 4.9%(+4.56)#3,502 |
| 4. | 62201 | 9.1% | 4.7%(+4.44)#138 | 4.9%(+4.28)#3,714 |
| 5. | 62203 | 6.9% | 4.7%(+2.17)#242 | 4.9%(+2.01)#6,584 |
| 6. | 62204 | 6.3% | 4.7%(+1.57)#298 | 4.9%(+1.41)#7,842 |
1
Common Questions
What are the Top 5 Zip Codes with the Highest Percentage of Population with a Degree in Liberal Arts and History in East Saint Louis, IL?
Top 5 Zip Codes with the Highest Percentage of Population with a Degree in Liberal Arts and History in East Saint Louis, IL are:
What zip code has the Highest Percentage of Population with a Degree in Liberal Arts and History in East Saint Louis, IL?
62207 has the Highest Percentage of Population with a Degree in Liberal Arts and History in East Saint Louis, IL with 17.8%.
What is the Percentage of Population with a Degree in Liberal Arts and History in Illinois?
Percentage of Population with a Degree in Liberal Arts and History in Illinois is 4.7%.
What is the Percentage of Population with a Degree in Liberal Arts and History in the United States?
Percentage of Population with a Degree in Liberal Arts and History in the United States is 4.9%.