Zip Codes with the Highest Percentage of Population with a Degree in Liberal Arts and History in Hoffman Estates, IL
RELATED REPORTS & OPTIONS
Liberal Arts and History
Hoffman Estates
Compare Zip Codes
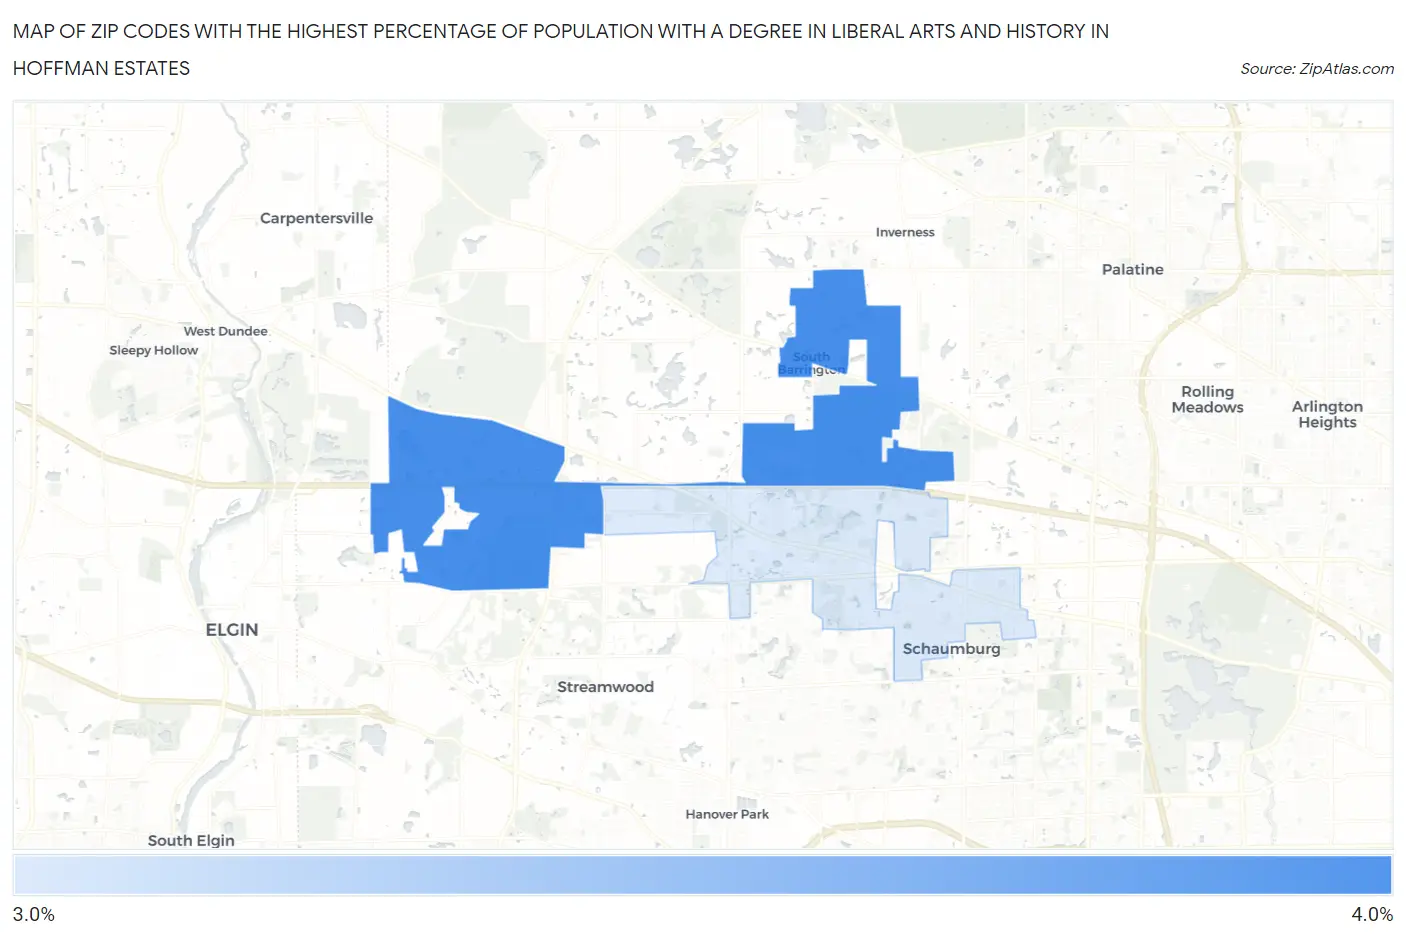
Map of Zip Codes with the Highest Percentage of Population with a Degree in Liberal Arts and History in Hoffman Estates
3.2%
3.9%
Zip Codes with the Highest Percentage of Population with a Degree in Liberal Arts and History in Hoffman Estates, IL
| Zip Code | % Graduates | vs State | vs National | |
| 1. | 60192 | 3.9% | 4.7%(-0.851)#602 | 4.9%(-1.01)#15,286 |
| 2. | 60169 | 3.2% | 4.7%(-1.51)#680 | 4.9%(-1.67)#17,636 |
1
Common Questions
What are the Top Zip Codes with the Highest Percentage of Population with a Degree in Liberal Arts and History in Hoffman Estates, IL?
Top Zip Codes with the Highest Percentage of Population with a Degree in Liberal Arts and History in Hoffman Estates, IL are:
What zip code has the Highest Percentage of Population with a Degree in Liberal Arts and History in Hoffman Estates, IL?
60192 has the Highest Percentage of Population with a Degree in Liberal Arts and History in Hoffman Estates, IL with 3.9%.
What is the Percentage of Population with a Degree in Liberal Arts and History in Hoffman Estates, IL?
Percentage of Population with a Degree in Liberal Arts and History in Hoffman Estates is 3.4%.
What is the Percentage of Population with a Degree in Liberal Arts and History in Illinois?
Percentage of Population with a Degree in Liberal Arts and History in Illinois is 4.7%.
What is the Percentage of Population with a Degree in Liberal Arts and History in the United States?
Percentage of Population with a Degree in Liberal Arts and History in the United States is 4.9%.