Zip Codes with the Highest Percentage of Population with a Degree in Liberal Arts and History in Elgin, IL
RELATED REPORTS & OPTIONS
Liberal Arts and History
Elgin
Compare Zip Codes
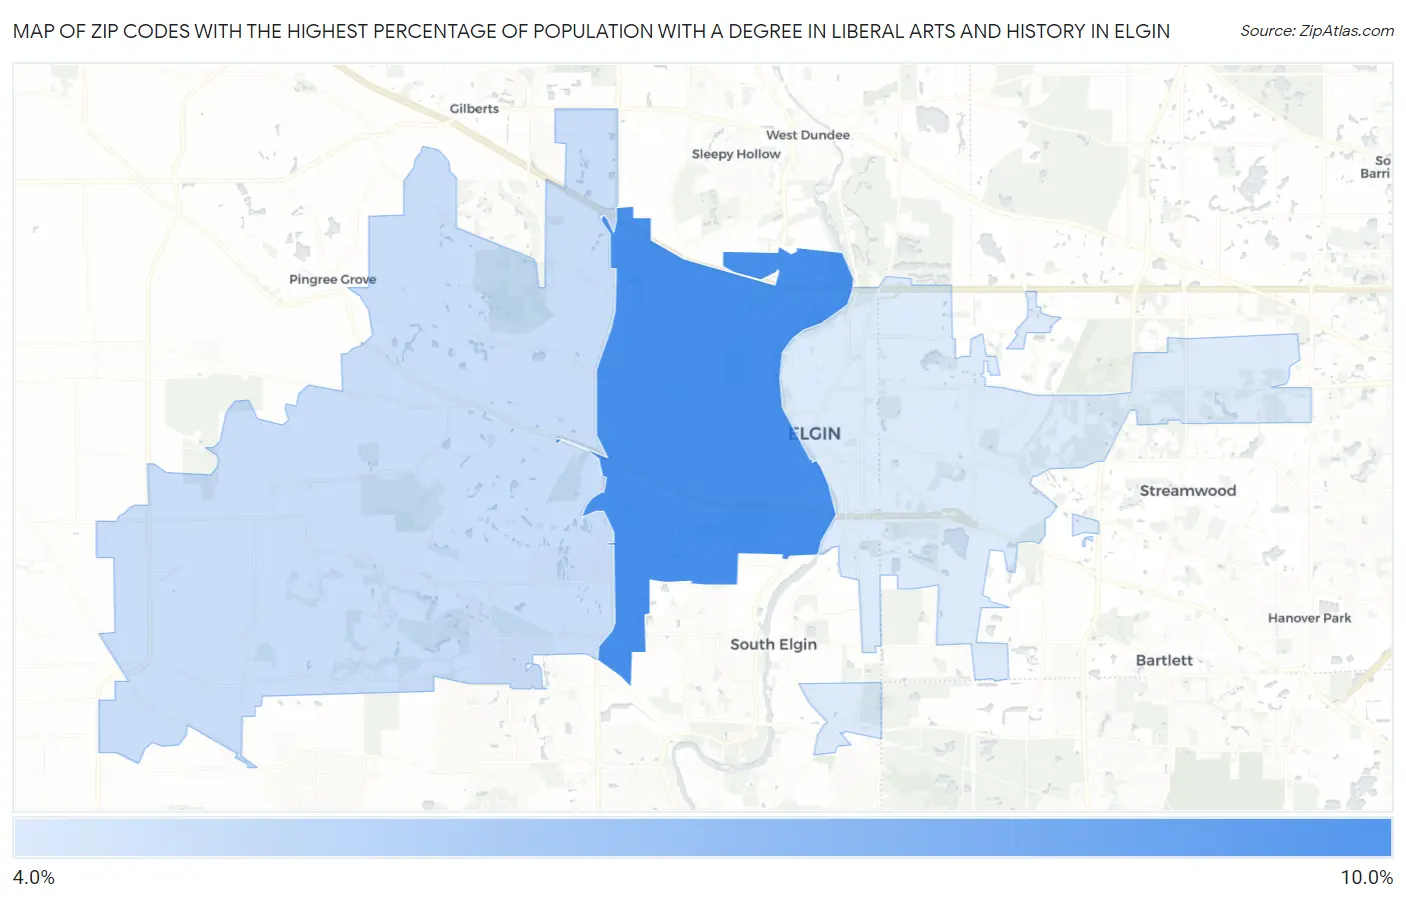
Map of Zip Codes with the Highest Percentage of Population with a Degree in Liberal Arts and History in Elgin
4.1%
8.6%
Zip Codes with the Highest Percentage of Population with a Degree in Liberal Arts and History in Elgin, IL
| Zip Code | % Graduates | vs State | vs National | |
| 1. | 60123 | 8.6% | 4.7%(+3.90)#154 | 4.9%(+3.75)#4,214 |
| 2. | 60124 | 4.8% | 4.7%(+0.056)#477 | 4.9%(-0.103)#12,069 |
| 3. | 60120 | 4.1% | 4.7%(-0.564)#555 | 4.9%(-0.723)#14,215 |
1
Common Questions
What are the Top Zip Codes with the Highest Percentage of Population with a Degree in Liberal Arts and History in Elgin, IL?
Top Zip Codes with the Highest Percentage of Population with a Degree in Liberal Arts and History in Elgin, IL are:
What zip code has the Highest Percentage of Population with a Degree in Liberal Arts and History in Elgin, IL?
60123 has the Highest Percentage of Population with a Degree in Liberal Arts and History in Elgin, IL with 8.6%.
What is the Percentage of Population with a Degree in Liberal Arts and History in Elgin, IL?
Percentage of Population with a Degree in Liberal Arts and History in Elgin is 6.5%.
What is the Percentage of Population with a Degree in Liberal Arts and History in Illinois?
Percentage of Population with a Degree in Liberal Arts and History in Illinois is 4.7%.
What is the Percentage of Population with a Degree in Liberal Arts and History in the United States?
Percentage of Population with a Degree in Liberal Arts and History in the United States is 4.9%.