Zip Codes with the Highest Percentage of Population with a Degree in Liberal Arts and History in Glenview, IL
RELATED REPORTS & OPTIONS
Liberal Arts and History
Glenview
Compare Zip Codes
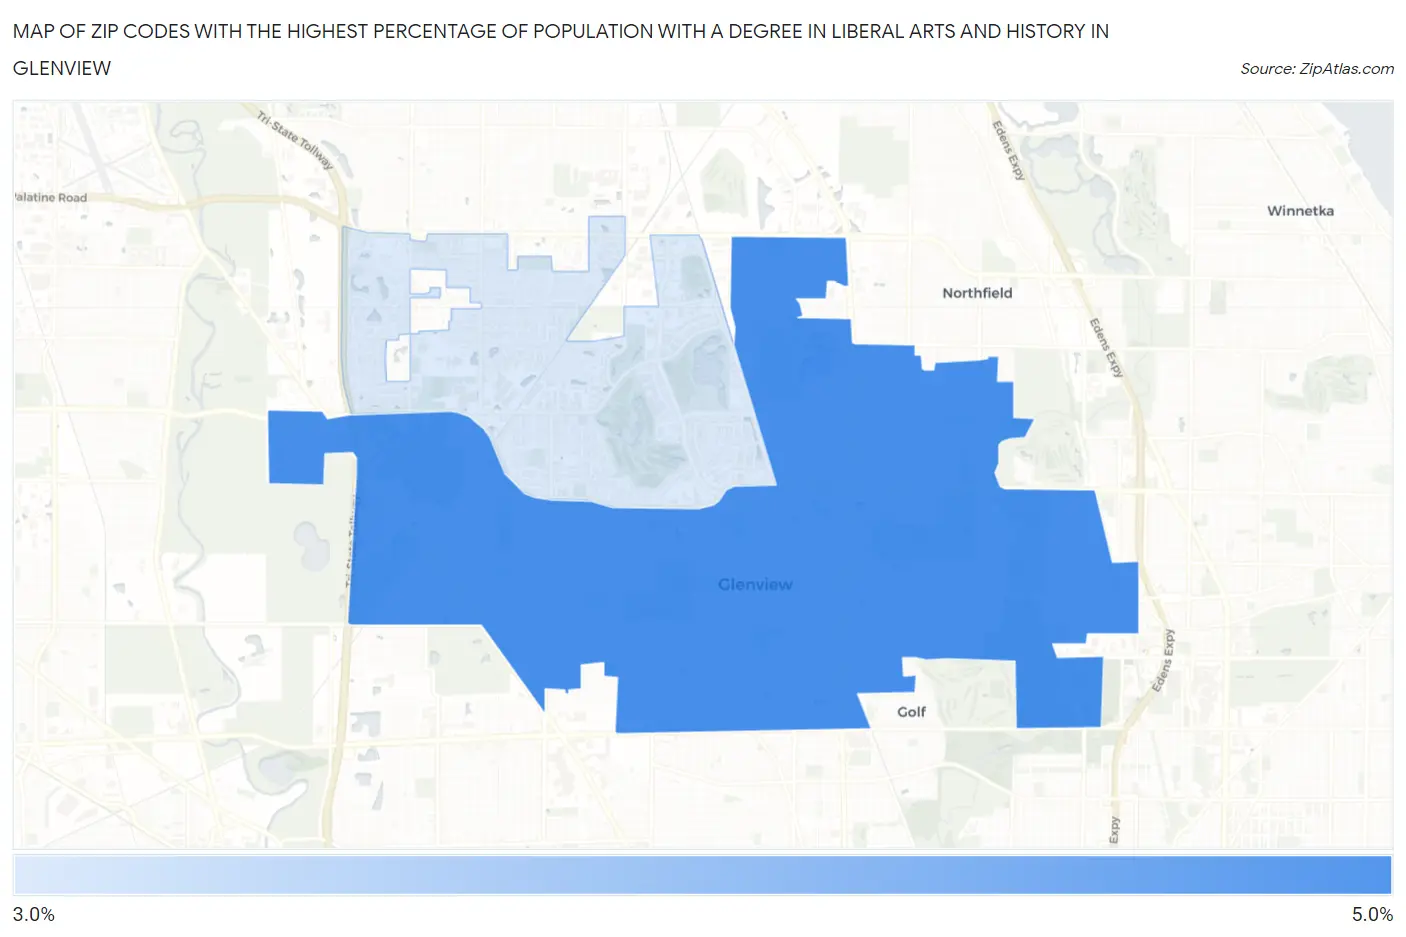
Map of Zip Codes with the Highest Percentage of Population with a Degree in Liberal Arts and History in Glenview
3.9%
4.8%
Zip Codes with the Highest Percentage of Population with a Degree in Liberal Arts and History in Glenview, IL
| Zip Code | % Graduates | vs State | vs National | |
| 1. | 60025 | 4.8% | 4.7%(+0.111)#460 | 4.9%(-0.048)#11,908 |
| 2. | 60026 | 3.9% | 4.7%(-0.806)#594 | 4.9%(-0.965)#15,148 |
1
Common Questions
What are the Top Zip Codes with the Highest Percentage of Population with a Degree in Liberal Arts and History in Glenview, IL?
Top Zip Codes with the Highest Percentage of Population with a Degree in Liberal Arts and History in Glenview, IL are:
What zip code has the Highest Percentage of Population with a Degree in Liberal Arts and History in Glenview, IL?
60025 has the Highest Percentage of Population with a Degree in Liberal Arts and History in Glenview, IL with 4.8%.
What is the Percentage of Population with a Degree in Liberal Arts and History in Glenview, IL?
Percentage of Population with a Degree in Liberal Arts and History in Glenview is 4.9%.
What is the Percentage of Population with a Degree in Liberal Arts and History in Illinois?
Percentage of Population with a Degree in Liberal Arts and History in Illinois is 4.7%.
What is the Percentage of Population with a Degree in Liberal Arts and History in the United States?
Percentage of Population with a Degree in Liberal Arts and History in the United States is 4.9%.