Zip Codes with the Highest Percentage of Population with a Degree in Liberal Arts and History in Urbana, IL
RELATED REPORTS & OPTIONS
Liberal Arts and History
Urbana
Compare Zip Codes
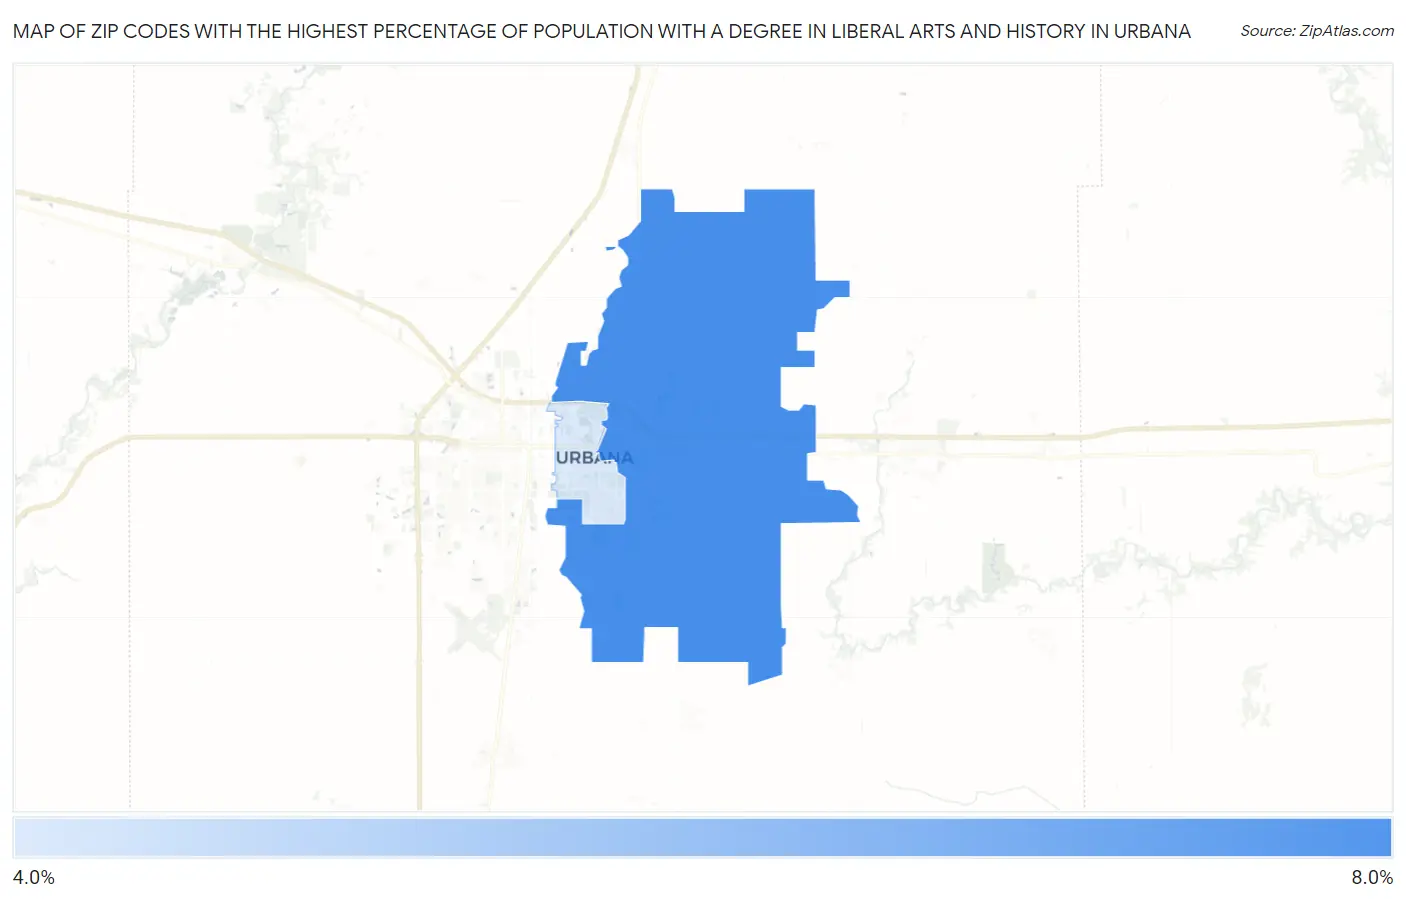
Map of Zip Codes with the Highest Percentage of Population with a Degree in Liberal Arts and History in Urbana
4.7%
7.5%
Zip Codes with the Highest Percentage of Population with a Degree in Liberal Arts and History in Urbana, IL
| Zip Code | % Graduates | vs State | vs National | |
| 1. | 61802 | 7.5% | 4.7%(+2.78)#209 | 4.9%(+2.62)#5,602 |
| 2. | 61801 | 4.7% | 4.7%(-0.061)#485 | 4.9%(-0.220)#12,475 |
1
Common Questions
What are the Top Zip Codes with the Highest Percentage of Population with a Degree in Liberal Arts and History in Urbana, IL?
Top Zip Codes with the Highest Percentage of Population with a Degree in Liberal Arts and History in Urbana, IL are:
What zip code has the Highest Percentage of Population with a Degree in Liberal Arts and History in Urbana, IL?
61802 has the Highest Percentage of Population with a Degree in Liberal Arts and History in Urbana, IL with 7.5%.
What is the Percentage of Population with a Degree in Liberal Arts and History in Urbana, IL?
Percentage of Population with a Degree in Liberal Arts and History in Urbana is 6.1%.
What is the Percentage of Population with a Degree in Liberal Arts and History in Illinois?
Percentage of Population with a Degree in Liberal Arts and History in Illinois is 4.7%.
What is the Percentage of Population with a Degree in Liberal Arts and History in the United States?
Percentage of Population with a Degree in Liberal Arts and History in the United States is 4.9%.