Zip Codes with the Highest Percentage of Population with a Degree in Liberal Arts and History in Belleville, IL
RELATED REPORTS & OPTIONS
Liberal Arts and History
Belleville
Compare Zip Codes
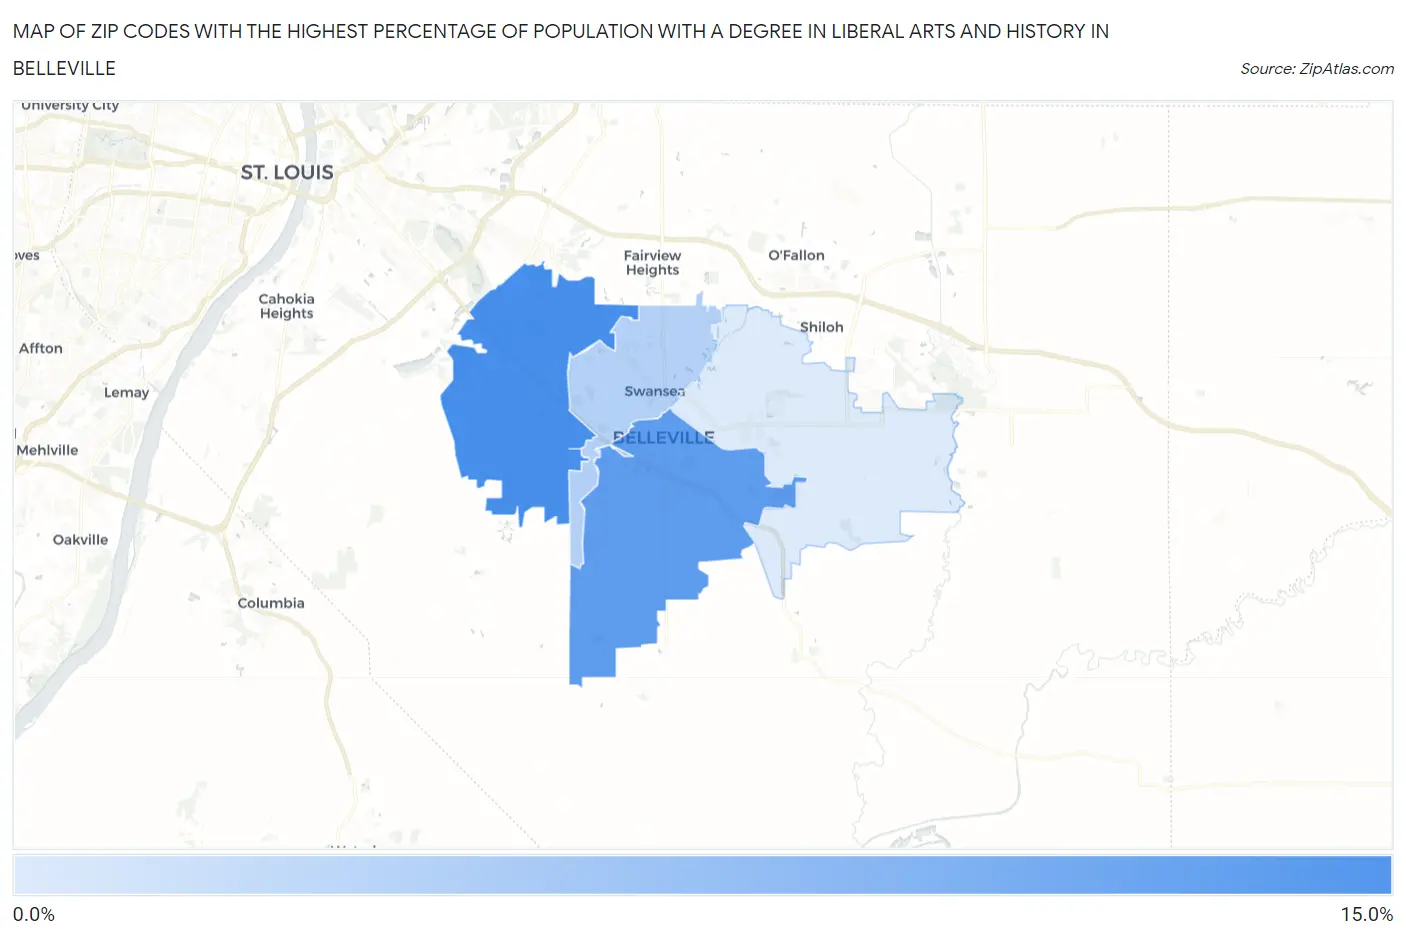
Map of Zip Codes with the Highest Percentage of Population with a Degree in Liberal Arts and History in Belleville
1.9%
10.6%
Zip Codes with the Highest Percentage of Population with a Degree in Liberal Arts and History in Belleville, IL
| Zip Code | % Graduates | vs State | vs National | |
| 1. | 62223 | 10.6% | 4.7%(+5.85)#101 | 4.9%(+5.69)#2,783 |
| 2. | 62220 | 9.2% | 4.7%(+4.52)#136 | 4.9%(+4.36)#3,657 |
| 3. | 62226 | 4.2% | 4.7%(-0.489)#543 | 4.9%(-0.648)#13,913 |
| 4. | 62221 | 1.9% | 4.7%(-2.81)#881 | 4.9%(-2.97)#21,619 |
1
Common Questions
What are the Top 3 Zip Codes with the Highest Percentage of Population with a Degree in Liberal Arts and History in Belleville, IL?
Top 3 Zip Codes with the Highest Percentage of Population with a Degree in Liberal Arts and History in Belleville, IL are:
What zip code has the Highest Percentage of Population with a Degree in Liberal Arts and History in Belleville, IL?
62223 has the Highest Percentage of Population with a Degree in Liberal Arts and History in Belleville, IL with 10.6%.
What is the Percentage of Population with a Degree in Liberal Arts and History in Belleville, IL?
Percentage of Population with a Degree in Liberal Arts and History in Belleville is 8.2%.
What is the Percentage of Population with a Degree in Liberal Arts and History in Illinois?
Percentage of Population with a Degree in Liberal Arts and History in Illinois is 4.7%.
What is the Percentage of Population with a Degree in Liberal Arts and History in the United States?
Percentage of Population with a Degree in Liberal Arts and History in the United States is 4.9%.