Zip Codes with the Highest Percentage of Population with a Degree in Liberal Arts and History in Palatine, IL
RELATED REPORTS & OPTIONS
Liberal Arts and History
Palatine
Compare Zip Codes
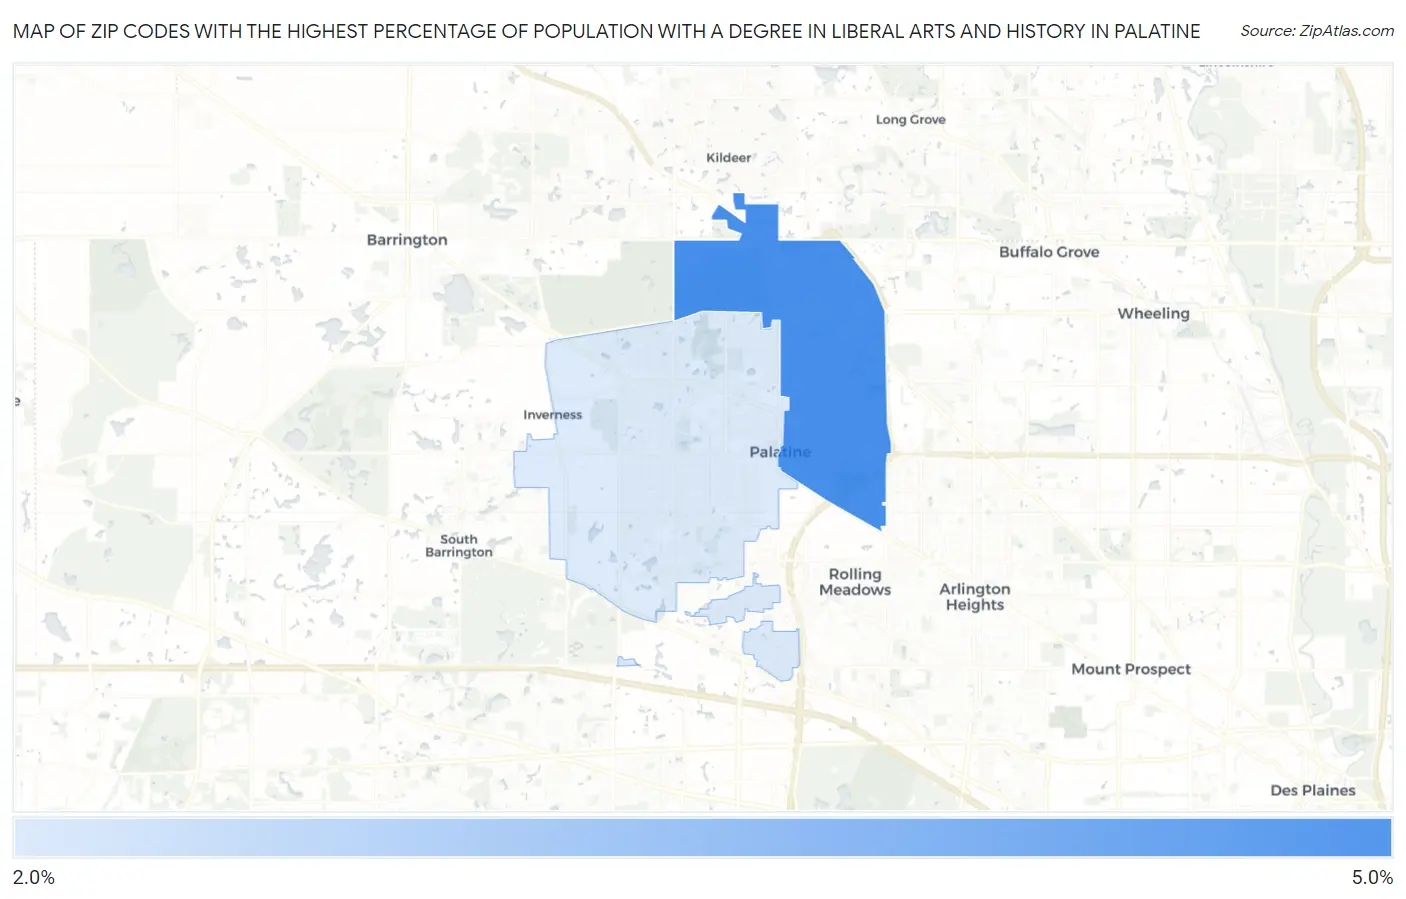
Map of Zip Codes with the Highest Percentage of Population with a Degree in Liberal Arts and History in Palatine
3.0%
4.9%
Zip Codes with the Highest Percentage of Population with a Degree in Liberal Arts and History in Palatine, IL
| Zip Code | % Graduates | vs State | vs National | |
| 1. | 60074 | 4.9% | 4.7%(+0.172)#452 | 4.9%(+0.013)#11,685 |
| 2. | 60067 | 3.0% | 4.7%(-1.74)#720 | 4.9%(-1.90)#18,451 |
1
Common Questions
What are the Top Zip Codes with the Highest Percentage of Population with a Degree in Liberal Arts and History in Palatine, IL?
Top Zip Codes with the Highest Percentage of Population with a Degree in Liberal Arts and History in Palatine, IL are:
What zip code has the Highest Percentage of Population with a Degree in Liberal Arts and History in Palatine, IL?
60074 has the Highest Percentage of Population with a Degree in Liberal Arts and History in Palatine, IL with 4.9%.
What is the Percentage of Population with a Degree in Liberal Arts and History in Palatine, IL?
Percentage of Population with a Degree in Liberal Arts and History in Palatine is 3.7%.
What is the Percentage of Population with a Degree in Liberal Arts and History in Illinois?
Percentage of Population with a Degree in Liberal Arts and History in Illinois is 4.7%.
What is the Percentage of Population with a Degree in Liberal Arts and History in the United States?
Percentage of Population with a Degree in Liberal Arts and History in the United States is 4.9%.