Zip Codes with the Highest Percentage of Population with a Degree in Liberal Arts and History in Plainfield, IL
RELATED REPORTS & OPTIONS
Liberal Arts and History
Plainfield
Compare Zip Codes
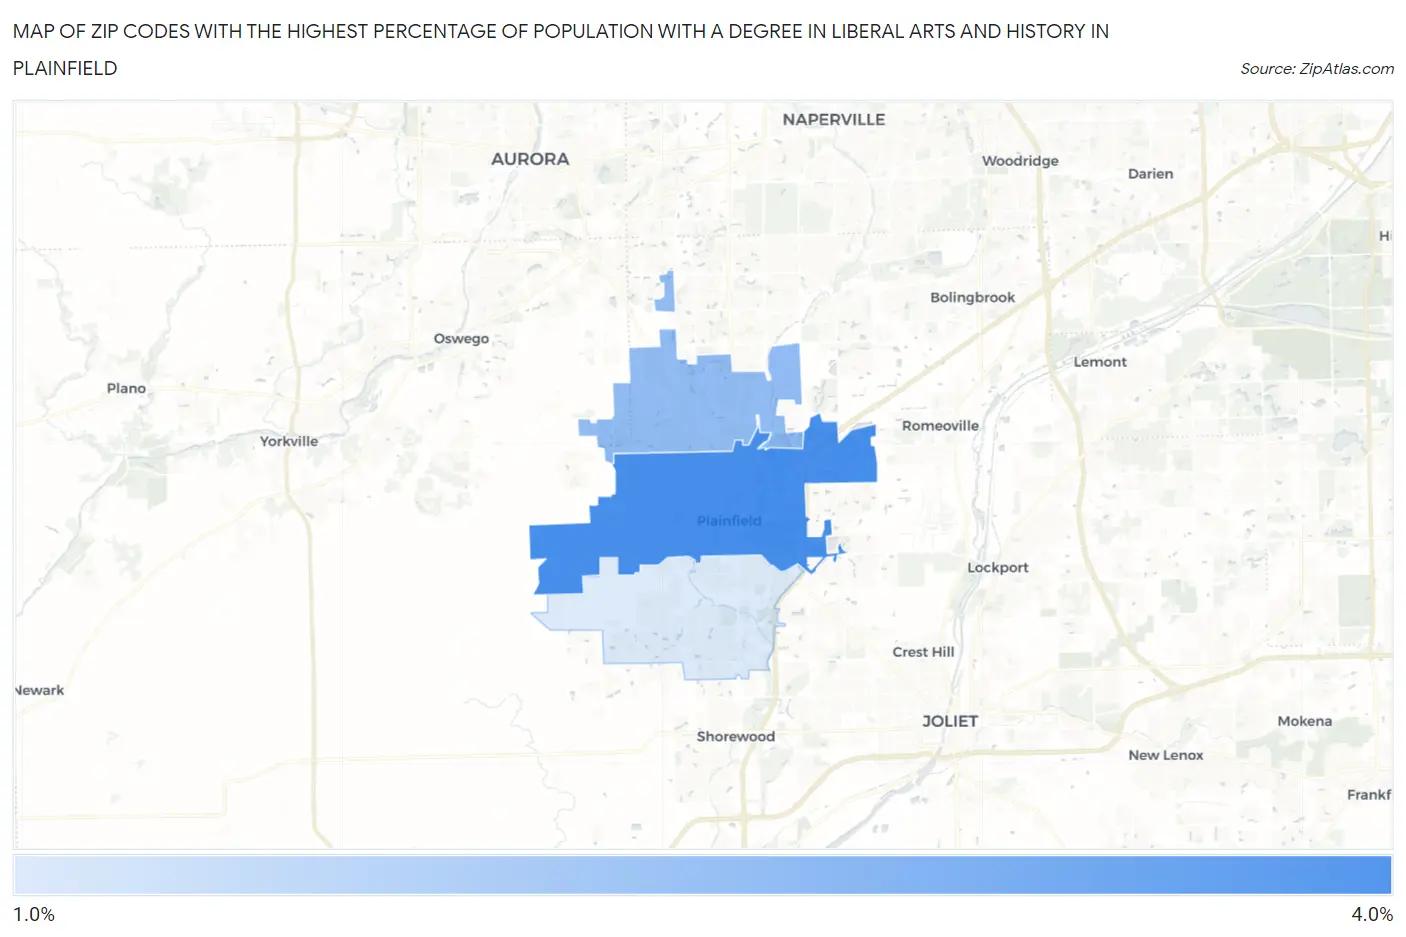
Map of Zip Codes with the Highest Percentage of Population with a Degree in Liberal Arts and History in Plainfield
1.0%
3.6%
Zip Codes with the Highest Percentage of Population with a Degree in Liberal Arts and History in Plainfield, IL
| Zip Code | % Graduates | vs State | vs National | |
| 1. | 60544 | 3.6% | 4.7%(-1.07)#627 | 4.9%(-1.23)#16,094 |
| 2. | 60585 | 2.3% | 4.7%(-2.40)#823 | 4.9%(-2.56)#20,512 |
| 3. | 60586 | 1.0% | 4.7%(-3.71)#973 | 4.9%(-3.86)#23,379 |
1
Common Questions
What are the Top Zip Codes with the Highest Percentage of Population with a Degree in Liberal Arts and History in Plainfield, IL?
Top Zip Codes with the Highest Percentage of Population with a Degree in Liberal Arts and History in Plainfield, IL are:
What zip code has the Highest Percentage of Population with a Degree in Liberal Arts and History in Plainfield, IL?
60544 has the Highest Percentage of Population with a Degree in Liberal Arts and History in Plainfield, IL with 3.6%.
What is the Percentage of Population with a Degree in Liberal Arts and History in Plainfield, IL?
Percentage of Population with a Degree in Liberal Arts and History in Plainfield is 2.6%.
What is the Percentage of Population with a Degree in Liberal Arts and History in Illinois?
Percentage of Population with a Degree in Liberal Arts and History in Illinois is 4.7%.
What is the Percentage of Population with a Degree in Liberal Arts and History in the United States?
Percentage of Population with a Degree in Liberal Arts and History in the United States is 4.9%.