Lawrenceville, IL Map & Demographics
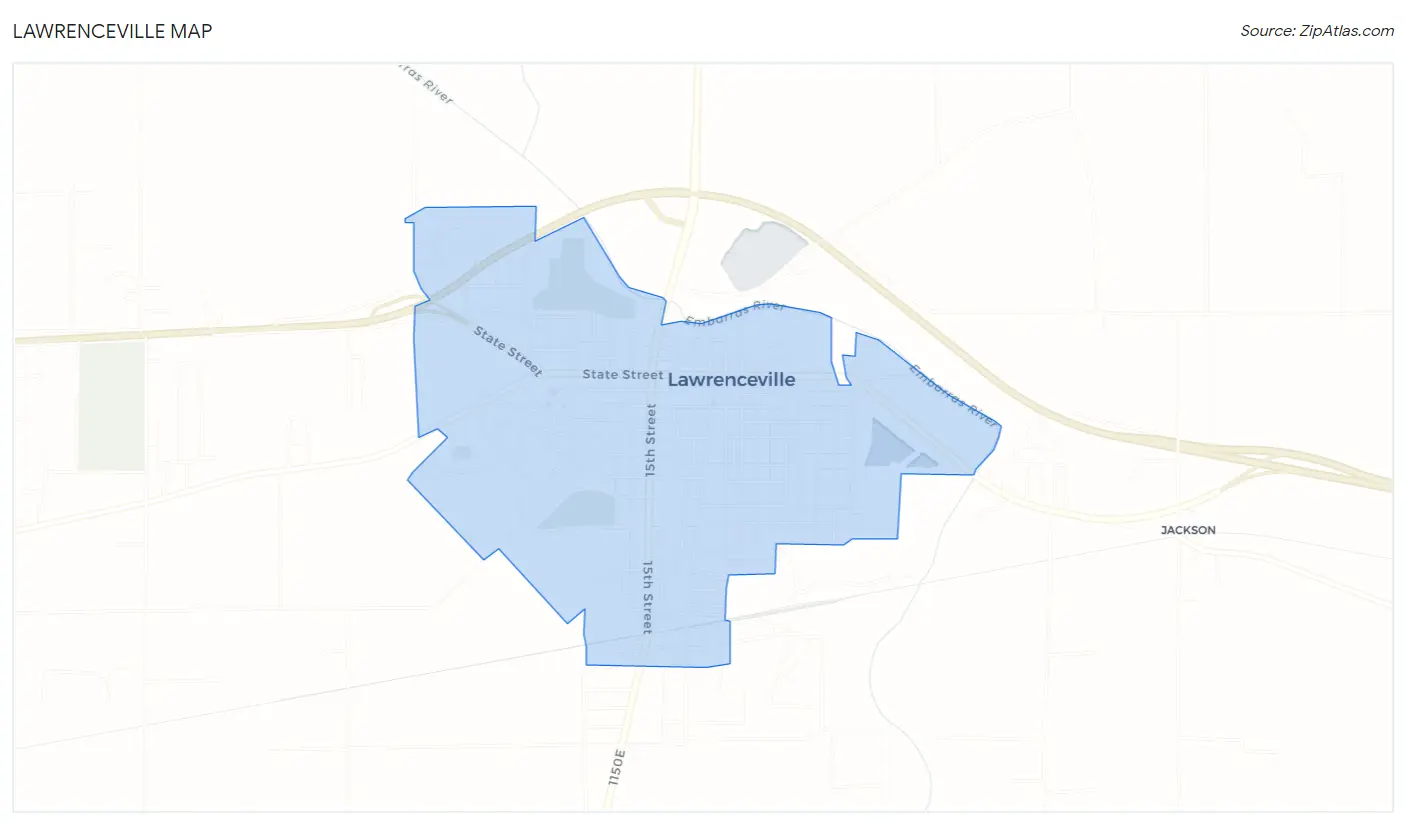
Lawrenceville Map
Lawrenceville Overview
$24,968
PER CAPITA INCOME
$50,000
AVG FAMILY INCOME
$42,213
AVG HOUSEHOLD INCOME
29.8%
WAGE / INCOME GAP [ % ]
70.2¢/ $1
WAGE / INCOME GAP [ $ ]
0.43
INEQUALITY / GINI INDEX
4,210
TOTAL POPULATION
2,230
MALE POPULATION
1,980
FEMALE POPULATION
112.63
MALES / 100 FEMALES
88.79
FEMALES / 100 MALES
37.5
MEDIAN AGE
3.4
AVG FAMILY SIZE
2.5
AVG HOUSEHOLD SIZE
1,759
LABOR FORCE [ PEOPLE ]
50.9%
PERCENT IN LABOR FORCE
6.9%
UNEMPLOYMENT RATE
Lawrenceville Zip Codes
Lawrenceville Area Codes
Income in Lawrenceville
Income Overview in Lawrenceville
Per Capita Income in Lawrenceville is $24,968, while median incomes of families and households are $50,000 and $42,213 respectively.
| Characteristic | Number | Measure |
| Per Capita Income | 4,210 | $24,968 |
| Median Family Income | 896 | $50,000 |
| Mean Family Income | 896 | $67,081 |
| Median Household Income | 1,662 | $42,213 |
| Mean Household Income | 1,662 | $57,506 |
| Income Deficit | 896 | $0 |
| Wage / Income Gap (%) | 4,210 | 29.79% |
| Wage / Income Gap ($) | 4,210 | 70.21¢ per $1 |
| Gini / Inequality Index | 4,210 | 0.43 |
Earnings by Sex in Lawrenceville
Average Earnings in Lawrenceville are $32,909, $35,237 for men and $24,740 for women, a difference of 29.8%.
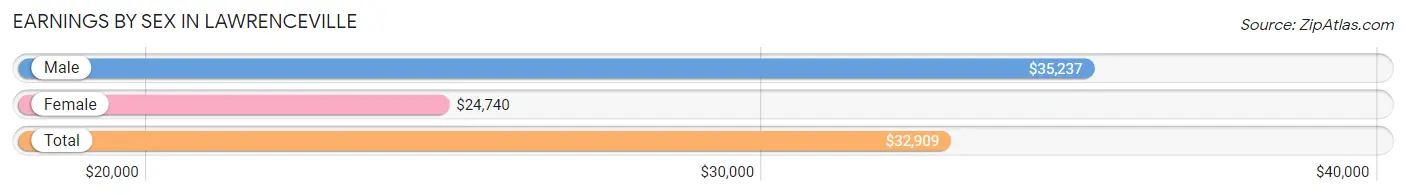
| Sex | Number | Average Earnings |
| Male | 1,214 (64.1%) | $35,237 |
| Female | 681 (35.9%) | $24,740 |
| Total | 1,895 (100.0%) | $32,909 |
Earnings by Sex by Income Bracket in Lawrenceville
The most common earnings brackets in Lawrenceville are $30,000 to $34,999 for men (179 | 14.7%) and $15,000 to $17,499 for women (100 | 14.7%).
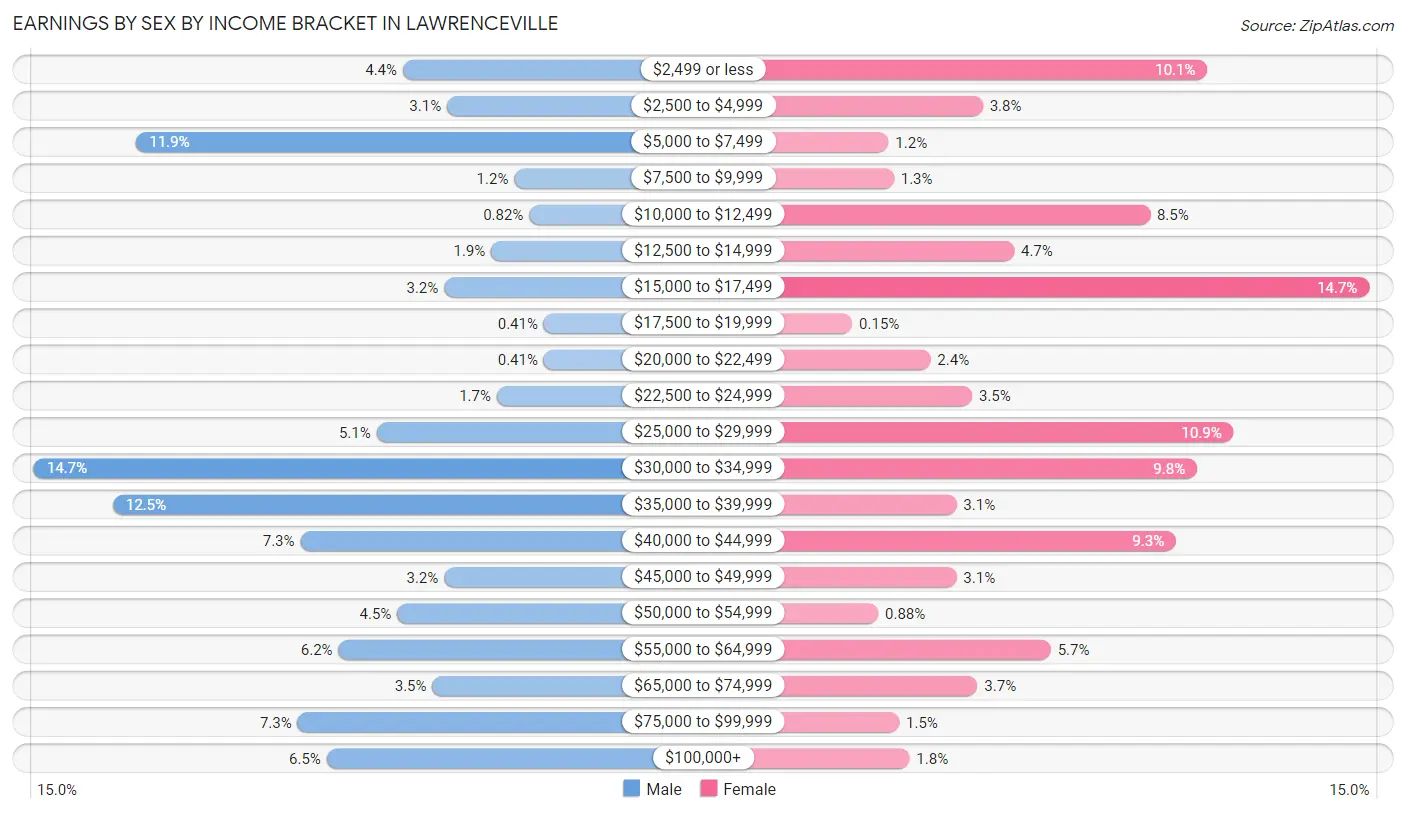
| Income | Male | Female |
| $2,499 or less | 53 (4.4%) | 69 (10.1%) |
| $2,500 to $4,999 | 38 (3.1%) | 26 (3.8%) |
| $5,000 to $7,499 | 144 (11.9%) | 8 (1.2%) |
| $7,500 to $9,999 | 15 (1.2%) | 9 (1.3%) |
| $10,000 to $12,499 | 10 (0.8%) | 58 (8.5%) |
| $12,500 to $14,999 | 23 (1.9%) | 32 (4.7%) |
| $15,000 to $17,499 | 39 (3.2%) | 100 (14.7%) |
| $17,500 to $19,999 | 5 (0.4%) | 1 (0.2%) |
| $20,000 to $22,499 | 5 (0.4%) | 16 (2.4%) |
| $22,500 to $24,999 | 21 (1.7%) | 24 (3.5%) |
| $25,000 to $29,999 | 62 (5.1%) | 74 (10.9%) |
| $30,000 to $34,999 | 179 (14.7%) | 67 (9.8%) |
| $35,000 to $39,999 | 152 (12.5%) | 21 (3.1%) |
| $40,000 to $44,999 | 88 (7.2%) | 63 (9.2%) |
| $45,000 to $49,999 | 39 (3.2%) | 21 (3.1%) |
| $50,000 to $54,999 | 55 (4.5%) | 6 (0.9%) |
| $55,000 to $64,999 | 75 (6.2%) | 39 (5.7%) |
| $65,000 to $74,999 | 43 (3.5%) | 25 (3.7%) |
| $75,000 to $99,999 | 89 (7.3%) | 10 (1.5%) |
| $100,000+ | 79 (6.5%) | 12 (1.8%) |
| Total | 1,214 (100.0%) | 681 (100.0%) |
Earnings by Sex by Educational Attainment in Lawrenceville
Average earnings in Lawrenceville are $36,268 for men and $29,821 for women, a difference of 17.8%. Men with an educational attainment of graduate degree enjoy the highest average annual earnings of $105,750, while those with high school diploma education earn the least with $35,447. Women with an educational attainment of graduate degree earn the most with the average annual earnings of $66,458, while those with high school diploma education have the smallest earnings of $25,179.
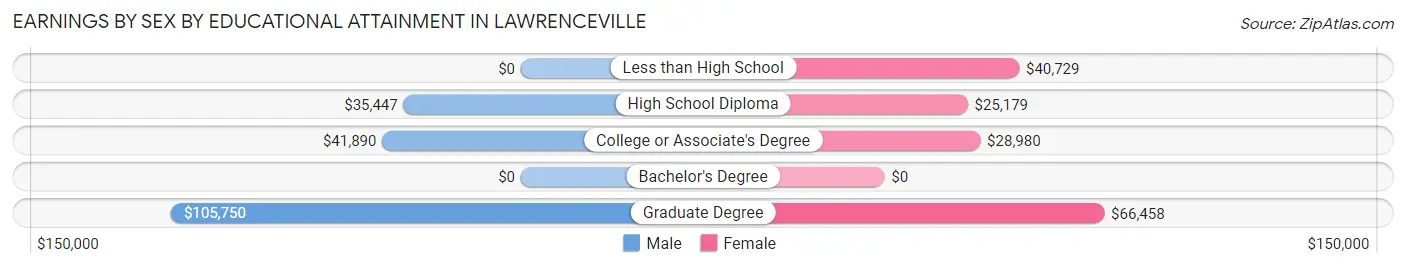
| Educational Attainment | Male Income | Female Income |
| Less than High School | - | - |
| High School Diploma | $35,447 | $25,179 |
| College or Associate's Degree | $41,890 | $28,980 |
| Bachelor's Degree | - | - |
| Graduate Degree | $105,750 | $66,458 |
| Total | $36,268 | $29,821 |
Family Income in Lawrenceville
Family Income Brackets in Lawrenceville
According to the Lawrenceville family income data, there are 222 families falling into the $35,000 to $49,999 income range, which is the most common income bracket and makes up 24.8% of all families. Conversely, the $10,000 to $14,999 income bracket is the least frequent group with only 3 families (0.3%) belonging to this category.
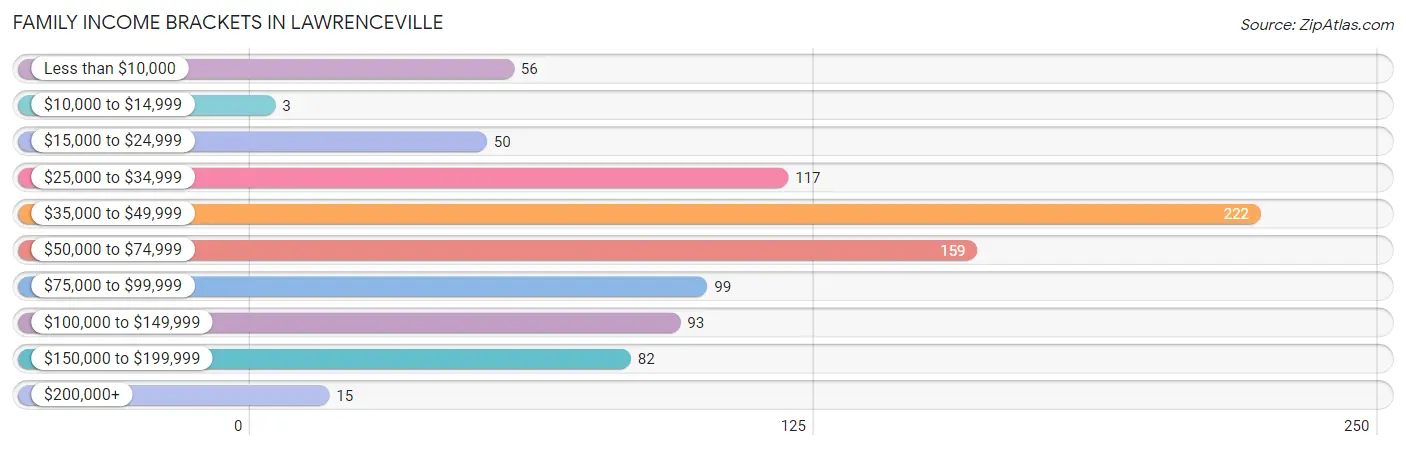
| Income Bracket | # Families | % Families |
| Less than $10,000 | 56 | 6.3% |
| $10,000 to $14,999 | 3 | 0.3% |
| $15,000 to $24,999 | 50 | 5.6% |
| $25,000 to $34,999 | 117 | 13.1% |
| $35,000 to $49,999 | 222 | 24.8% |
| $50,000 to $74,999 | 159 | 17.7% |
| $75,000 to $99,999 | 99 | 11.0% |
| $100,000 to $149,999 | 93 | 10.4% |
| $150,000 to $199,999 | 82 | 9.2% |
| $200,000+ | 15 | 1.7% |
Family Income by Famaliy Size in Lawrenceville
6-person families (45 | 5.0%) account for the highest median family income in Lawrenceville with $112,434 per family, while 2-person families (540 | 60.3%) have the highest median income of $23,452 per family member.
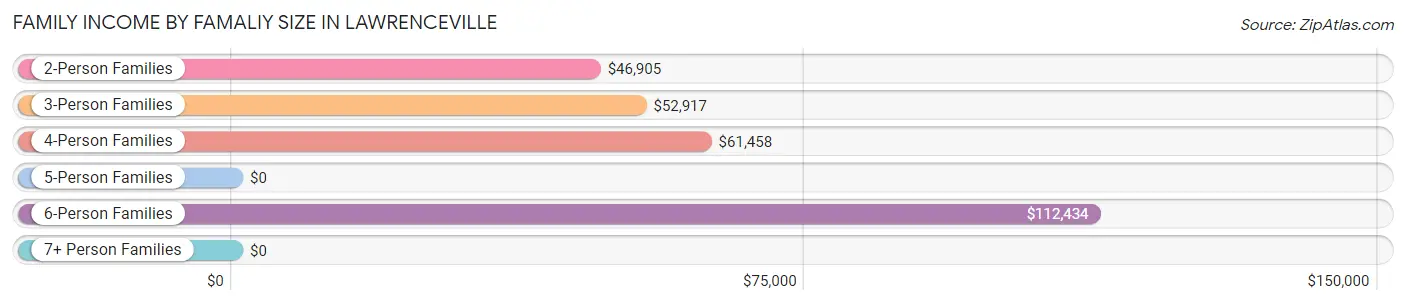
| Income Bracket | # Families | Median Income |
| 2-Person Families | 540 (60.3%) | $46,905 |
| 3-Person Families | 146 (16.3%) | $52,917 |
| 4-Person Families | 108 (12.0%) | $61,458 |
| 5-Person Families | 46 (5.1%) | $0 |
| 6-Person Families | 45 (5.0%) | $112,434 |
| 7+ Person Families | 11 (1.2%) | $0 |
| Total | 896 (100.0%) | $50,000 |
Family Income by Number of Earners in Lawrenceville
The median family income in Lawrenceville is $50,000, with families comprising 3+ earners (33) having the highest median family income of $131,875, while families with no earners (241) have the lowest median family income of $45,655, accounting for 3.7% and 26.9% of families, respectively.
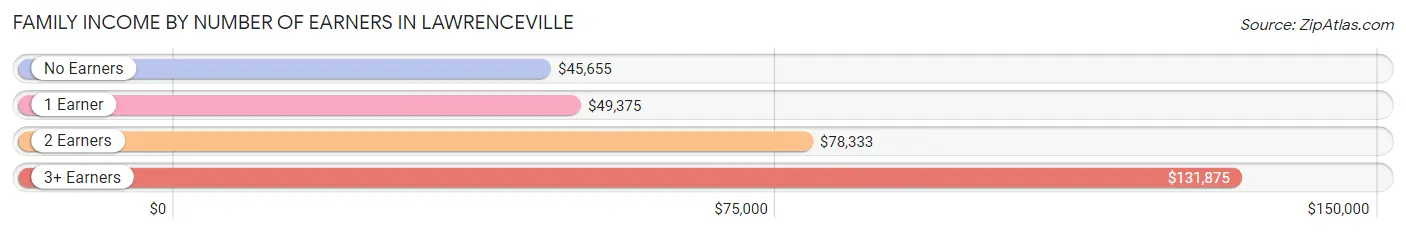
| Number of Earners | # Families | Median Income |
| No Earners | 241 (26.9%) | $45,655 |
| 1 Earner | 388 (43.3%) | $49,375 |
| 2 Earners | 234 (26.1%) | $78,333 |
| 3+ Earners | 33 (3.7%) | $131,875 |
| Total | 896 (100.0%) | $50,000 |
Household Income in Lawrenceville
Household Income Brackets in Lawrenceville
With 366 households falling in the category, the $35,000 to $49,999 income range is the most frequent in Lawrenceville, accounting for 22.0% of all households. In contrast, only 32 households (1.9%) fall into the $200,000+ income bracket, making it the least populous group.
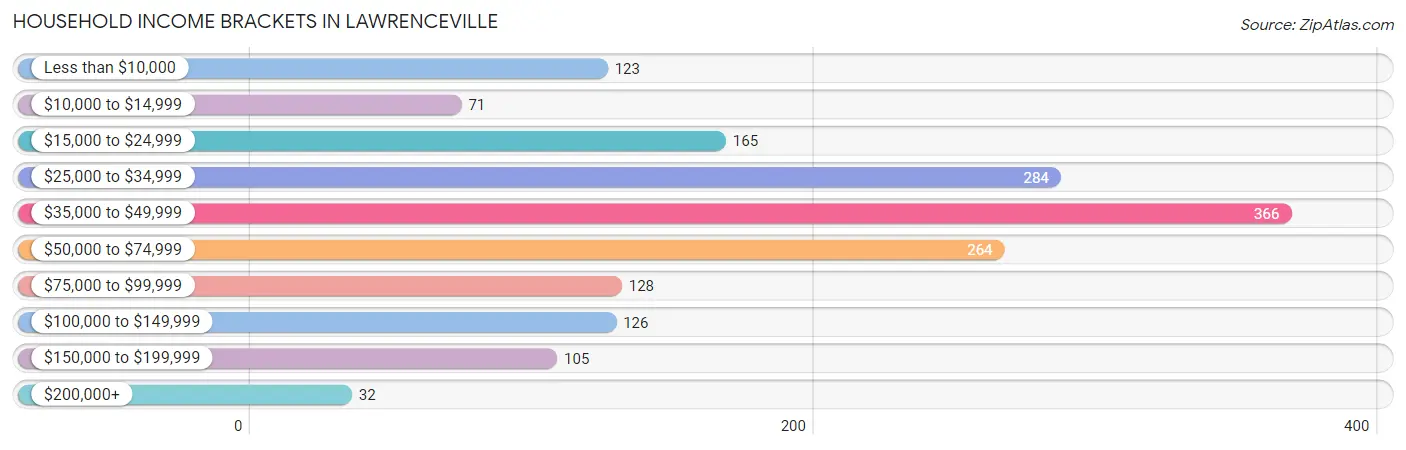
| Income Bracket | # Households | % Households |
| Less than $10,000 | 123 | 7.4% |
| $10,000 to $14,999 | 71 | 4.3% |
| $15,000 to $24,999 | 165 | 9.9% |
| $25,000 to $34,999 | 284 | 17.1% |
| $35,000 to $49,999 | 366 | 22.0% |
| $50,000 to $74,999 | 264 | 15.9% |
| $75,000 to $99,999 | 128 | 7.7% |
| $100,000 to $149,999 | 126 | 7.6% |
| $150,000 to $199,999 | 105 | 6.3% |
| $200,000+ | 32 | 1.9% |
Household Income by Householder Age in Lawrenceville
The median household income in Lawrenceville is $42,213, with the highest median household income of $50,972 found in the 25 to 44 years age bracket for the primary householder. A total of 485 households (29.2%) fall into this category. Meanwhile, the 15 to 24 years age bracket for the primary householder has the lowest median household income of $31,550, with 111 households (6.7%) in this group.
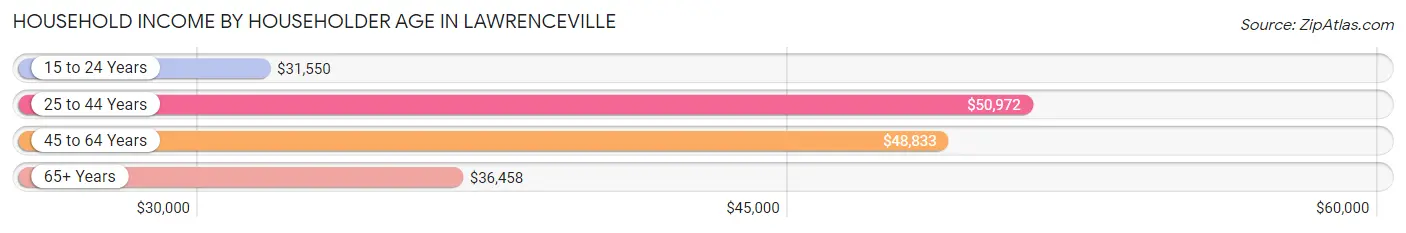
| Income Bracket | # Households | Median Income |
| 15 to 24 Years | 111 (6.7%) | $31,550 |
| 25 to 44 Years | 485 (29.2%) | $50,972 |
| 45 to 64 Years | 508 (30.6%) | $48,833 |
| 65+ Years | 558 (33.6%) | $36,458 |
| Total | 1,662 (100.0%) | $42,213 |
Poverty in Lawrenceville
Income Below Poverty by Sex and Age in Lawrenceville
With 11.4% poverty level for males and 19.5% for females among the residents of Lawrenceville, 12 to 14 year old males and 18 to 24 year old females are the most vulnerable to poverty, with 36 males (43.4%) and 74 females (39.0%) in their respective age groups living below the poverty level.
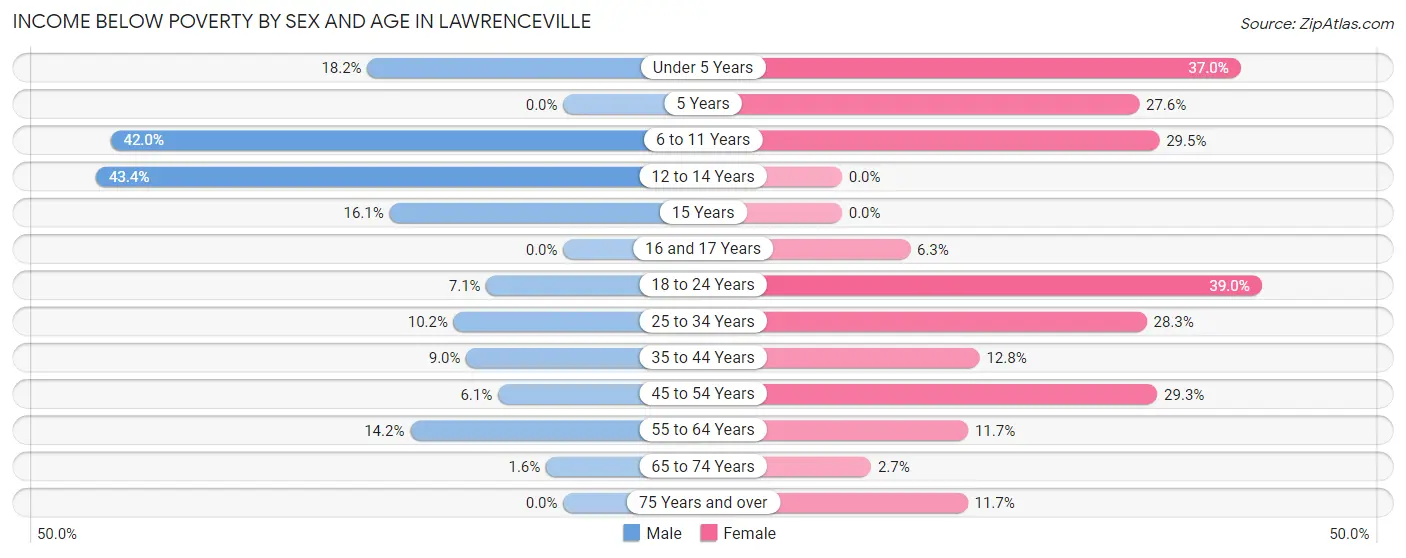
| Age Bracket | Male | Female |
| Under 5 Years | 18 (18.2%) | 57 (37.0%) |
| 5 Years | 0 (0.0%) | 8 (27.6%) |
| 6 to 11 Years | 50 (42.0%) | 33 (29.5%) |
| 12 to 14 Years | 36 (43.4%) | 0 (0.0%) |
| 15 Years | 5 (16.1%) | 0 (0.0%) |
| 16 and 17 Years | 0 (0.0%) | 5 (6.3%) |
| 18 to 24 Years | 13 (7.1%) | 74 (39.0%) |
| 25 to 34 Years | 53 (10.2%) | 56 (28.3%) |
| 35 to 44 Years | 28 (9.0%) | 34 (12.8%) |
| 45 to 54 Years | 14 (6.1%) | 48 (29.3%) |
| 55 to 64 Years | 27 (14.2%) | 26 (11.7%) |
| 65 to 74 Years | 3 (1.6%) | 6 (2.7%) |
| 75 Years and over | 0 (0.0%) | 21 (11.7%) |
| Total | 247 (11.4%) | 368 (19.5%) |
Income Above Poverty by Sex and Age in Lawrenceville
According to the poverty statistics in Lawrenceville, males aged 5 years and females aged 12 to 14 years are the age groups that are most secure financially, with 100.0% of males and 100.0% of females in these age groups living above the poverty line.
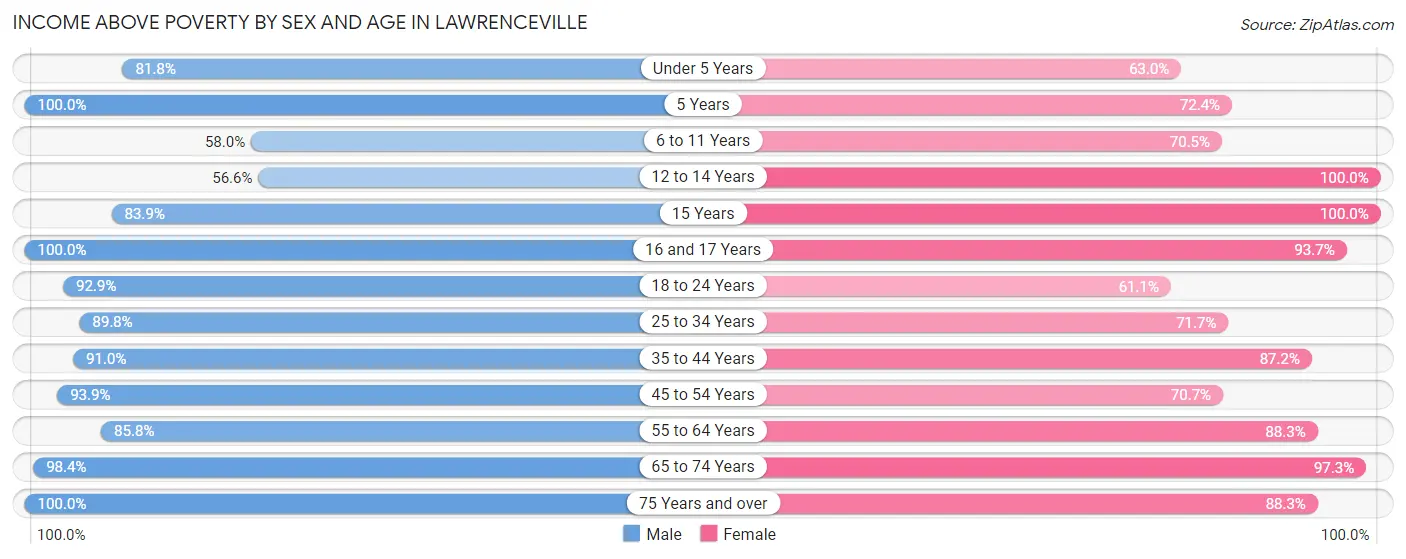
| Age Bracket | Male | Female |
| Under 5 Years | 81 (81.8%) | 97 (63.0%) |
| 5 Years | 4 (100.0%) | 21 (72.4%) |
| 6 to 11 Years | 69 (58.0%) | 79 (70.5%) |
| 12 to 14 Years | 47 (56.6%) | 43 (100.0%) |
| 15 Years | 26 (83.9%) | 30 (100.0%) |
| 16 and 17 Years | 38 (100.0%) | 74 (93.7%) |
| 18 to 24 Years | 169 (92.9%) | 116 (61.1%) |
| 25 to 34 Years | 468 (89.8%) | 142 (71.7%) |
| 35 to 44 Years | 283 (91.0%) | 232 (87.2%) |
| 45 to 54 Years | 217 (93.9%) | 116 (70.7%) |
| 55 to 64 Years | 163 (85.8%) | 196 (88.3%) |
| 65 to 74 Years | 184 (98.4%) | 215 (97.3%) |
| 75 Years and over | 170 (100.0%) | 159 (88.3%) |
| Total | 1,919 (88.6%) | 1,520 (80.5%) |
Income Below Poverty Among Married-Couple Families in Lawrenceville
The poverty statistics for married-couple families in Lawrenceville show that 1.5% or 9 of the total 608 families live below the poverty line. Families with 1 or 2 children have the highest poverty rate of 7.4%, comprising of 9 families. On the other hand, families with no children have the lowest poverty rate of 0.0%, which includes 0 families.
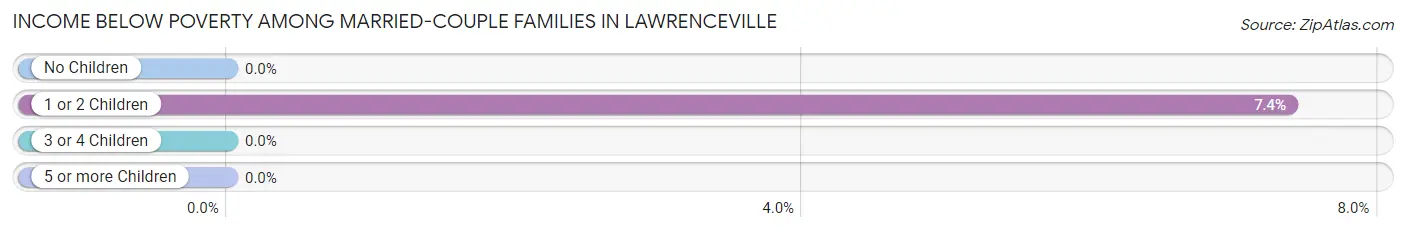
| Children | Above Poverty | Below Poverty |
| No Children | 424 (100.0%) | 0 (0.0%) |
| 1 or 2 Children | 113 (92.6%) | 9 (7.4%) |
| 3 or 4 Children | 60 (100.0%) | 0 (0.0%) |
| 5 or more Children | 2 (100.0%) | 0 (0.0%) |
| Total | 599 (98.5%) | 9 (1.5%) |
Income Below Poverty Among Single-Parent Households in Lawrenceville
According to the poverty data in Lawrenceville, 13.9% or 11 single-father households and 32.5% or 68 single-mother households are living below the poverty line. Among single-father households, those with 1 or 2 children have the highest poverty rate, with 11 households (19.3%) experiencing poverty. Likewise, among single-mother households, those with 5 or more children have the highest poverty rate, with 4 households (100.0%) falling below the poverty line.
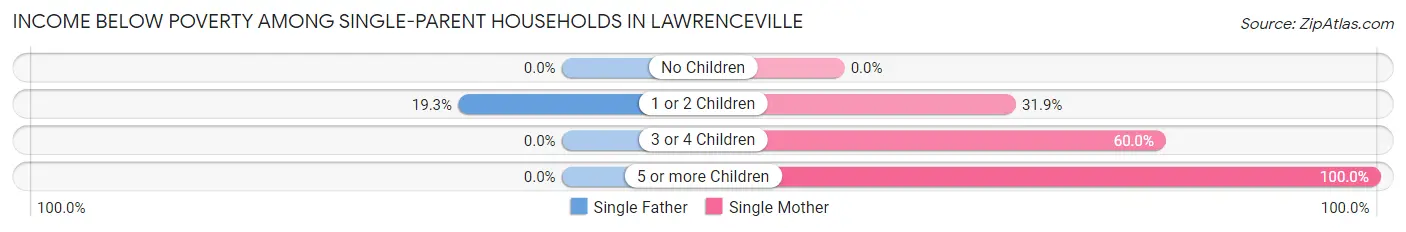
| Children | Single Father | Single Mother |
| No Children | 0 (0.0%) | 0 (0.0%) |
| 1 or 2 Children | 11 (19.3%) | 46 (31.9%) |
| 3 or 4 Children | 0 (0.0%) | 18 (60.0%) |
| 5 or more Children | 0 (0.0%) | 4 (100.0%) |
| Total | 11 (13.9%) | 68 (32.5%) |
Income Below Poverty Among Married-Couple vs Single-Parent Households in Lawrenceville
The poverty data for Lawrenceville shows that 9 of the married-couple family households (1.5%) and 79 of the single-parent households (27.4%) are living below the poverty level. Within the married-couple family households, those with 1 or 2 children have the highest poverty rate, with 9 households (7.4%) falling below the poverty line. Among the single-parent households, those with 5 or more children have the highest poverty rate, with 4 household (100.0%) living below poverty.
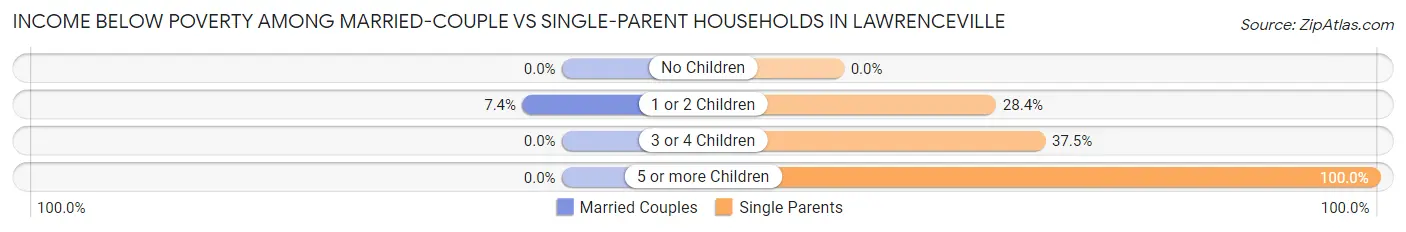
| Children | Married-Couple Families | Single-Parent Households |
| No Children | 0 (0.0%) | 0 (0.0%) |
| 1 or 2 Children | 9 (7.4%) | 57 (28.4%) |
| 3 or 4 Children | 0 (0.0%) | 18 (37.5%) |
| 5 or more Children | 0 (0.0%) | 4 (100.0%) |
| Total | 9 (1.5%) | 79 (27.4%) |
Race in Lawrenceville
The most populous races in Lawrenceville are White / Caucasian (3,577 | 85.0%), Two or more Races (345 | 8.2%), and Black / African American (202 | 4.8%).
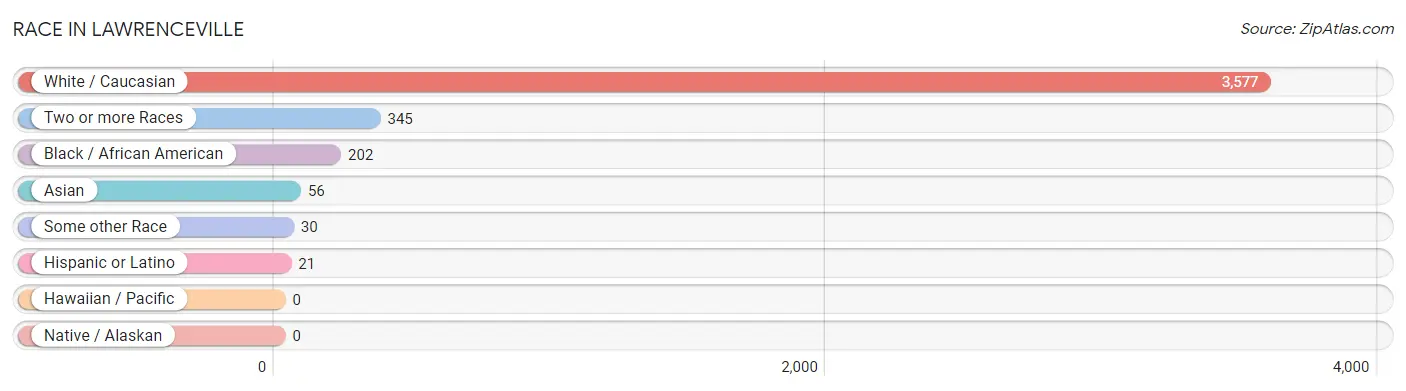
| Race | # Population | % Population |
| Asian | 56 | 1.3% |
| Black / African American | 202 | 4.8% |
| Hawaiian / Pacific | 0 | 0.0% |
| Hispanic or Latino | 21 | 0.5% |
| Native / Alaskan | 0 | 0.0% |
| White / Caucasian | 3,577 | 85.0% |
| Two or more Races | 345 | 8.2% |
| Some other Race | 30 | 0.7% |
| Total | 4,210 | 100.0% |
Ancestry in Lawrenceville
The most populous ancestries reported in Lawrenceville are German (768 | 18.2%), English (478 | 11.4%), American (407 | 9.7%), Irish (324 | 7.7%), and Cherokee (307 | 7.3%), together accounting for 54.2% of all Lawrenceville residents.
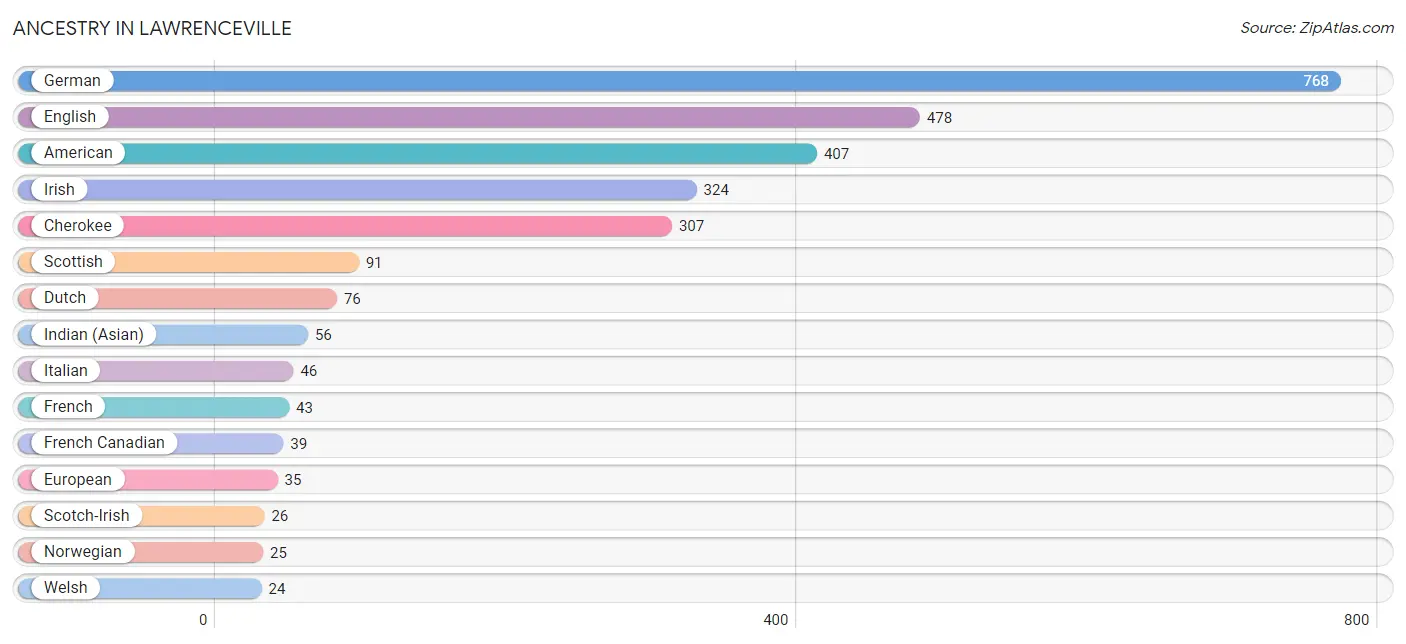
| Ancestry | # Population | % Population |
| American | 407 | 9.7% |
| Belgian | 12 | 0.3% |
| British | 6 | 0.1% |
| Canadian | 12 | 0.3% |
| Cherokee | 307 | 7.3% |
| Czech | 6 | 0.1% |
| Dutch | 76 | 1.8% |
| English | 478 | 11.4% |
| European | 35 | 0.8% |
| French | 43 | 1.0% |
| French Canadian | 39 | 0.9% |
| German | 768 | 18.2% |
| Indian (Asian) | 56 | 1.3% |
| Irish | 324 | 7.7% |
| Italian | 46 | 1.1% |
| Mexican | 21 | 0.5% |
| Norwegian | 25 | 0.6% |
| Polish | 10 | 0.2% |
| Russian | 16 | 0.4% |
| Scotch-Irish | 26 | 0.6% |
| Scottish | 91 | 2.2% |
| Swedish | 18 | 0.4% |
| Welsh | 24 | 0.6% | View All 23 Rows |
Immigrants in Lawrenceville
The most numerous immigrant groups reported in Lawrenceville came from Asia (56 | 1.3%), China (56 | 1.3%), and Eastern Asia (56 | 1.3%), together accounting for 4.0% of all Lawrenceville residents.
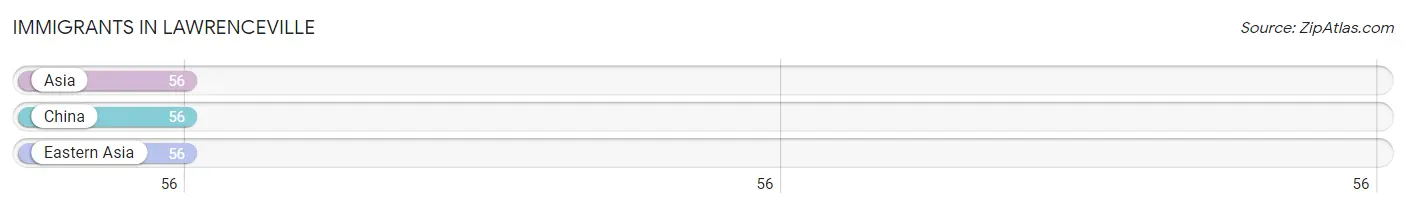
| Immigration Origin | # Population | % Population |
| Asia | 56 | 1.3% |
| China | 56 | 1.3% |
| Eastern Asia | 56 | 1.3% | View All 3 Rows |
Sex and Age in Lawrenceville
Sex and Age in Lawrenceville
The most populous age groups in Lawrenceville are 30 to 34 Years (306 | 13.7%) for men and Under 5 Years (168 | 8.5%) for women.
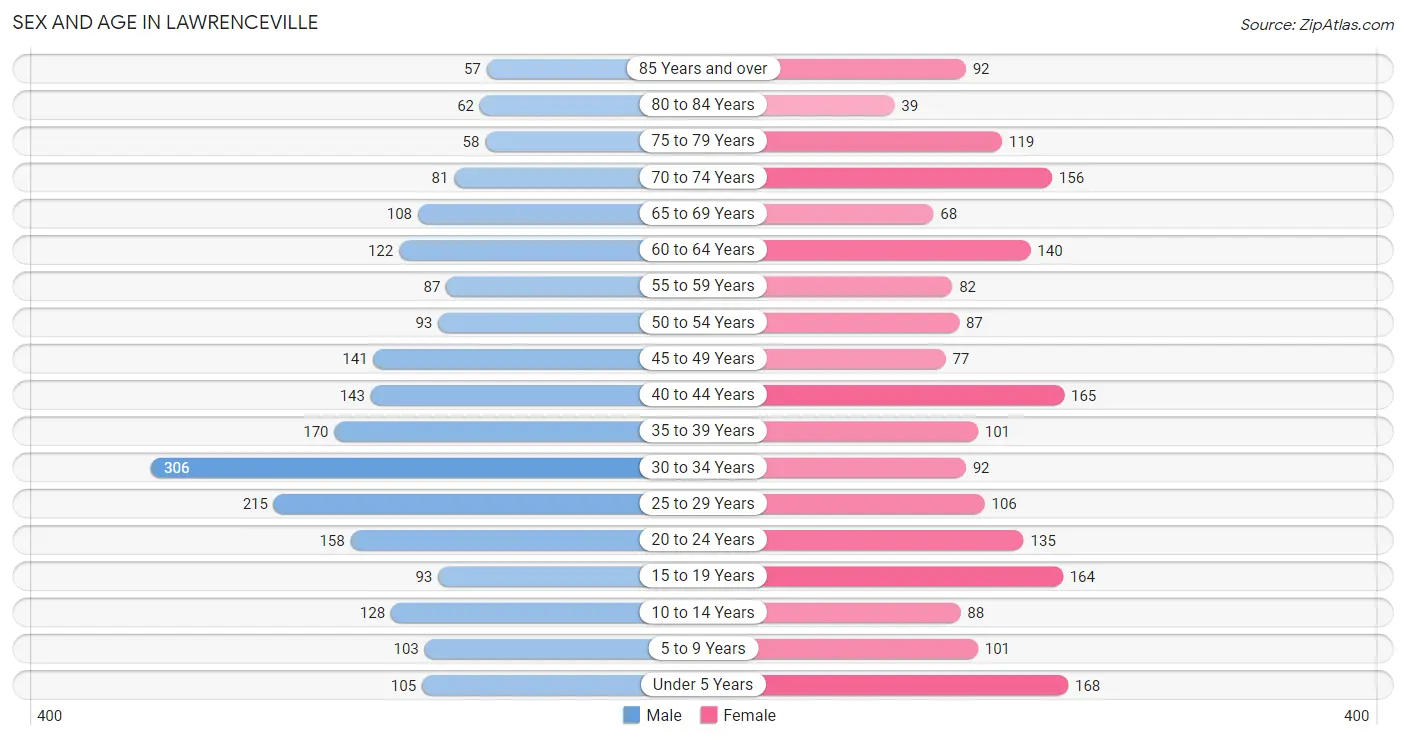
| Age Bracket | Male | Female |
| Under 5 Years | 105 (4.7%) | 168 (8.5%) |
| 5 to 9 Years | 103 (4.6%) | 101 (5.1%) |
| 10 to 14 Years | 128 (5.7%) | 88 (4.4%) |
| 15 to 19 Years | 93 (4.2%) | 164 (8.3%) |
| 20 to 24 Years | 158 (7.1%) | 135 (6.8%) |
| 25 to 29 Years | 215 (9.6%) | 106 (5.3%) |
| 30 to 34 Years | 306 (13.7%) | 92 (4.6%) |
| 35 to 39 Years | 170 (7.6%) | 101 (5.1%) |
| 40 to 44 Years | 143 (6.4%) | 165 (8.3%) |
| 45 to 49 Years | 141 (6.3%) | 77 (3.9%) |
| 50 to 54 Years | 93 (4.2%) | 87 (4.4%) |
| 55 to 59 Years | 87 (3.9%) | 82 (4.1%) |
| 60 to 64 Years | 122 (5.5%) | 140 (7.1%) |
| 65 to 69 Years | 108 (4.8%) | 68 (3.4%) |
| 70 to 74 Years | 81 (3.6%) | 156 (7.9%) |
| 75 to 79 Years | 58 (2.6%) | 119 (6.0%) |
| 80 to 84 Years | 62 (2.8%) | 39 (2.0%) |
| 85 Years and over | 57 (2.6%) | 92 (4.6%) |
| Total | 2,230 (100.0%) | 1,980 (100.0%) |
Families and Households in Lawrenceville
Median Family Size in Lawrenceville
The median family size in Lawrenceville is 3.39 persons per family, with married-couple families (608 | 67.9%) accounting for the largest median family size of 3.54 persons per family. On the other hand, single male/father families (79 | 8.8%) represent the smallest median family size with 2.62 persons per family.
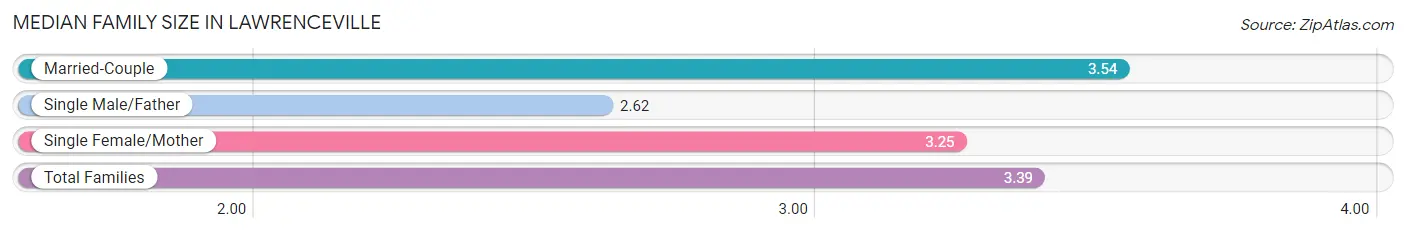
| Family Type | # Families | Family Size |
| Married-Couple | 608 (67.9%) | 3.54 |
| Single Male/Father | 79 (8.8%) | 2.62 |
| Single Female/Mother | 209 (23.3%) | 3.25 |
| Total Families | 896 (100.0%) | 3.39 |
Median Household Size in Lawrenceville
The median household size in Lawrenceville is 2.47 persons per household, with single female/mother households (209 | 12.6%) accounting for the largest median household size of 3.67 persons per household. non-family households (766 | 46.1%) represent the smallest median household size with 1.19 persons per household.
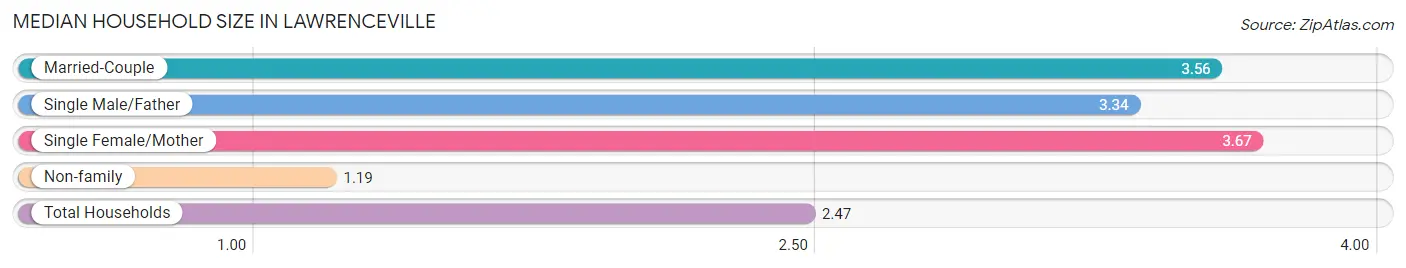
| Household Type | # Households | Household Size |
| Married-Couple | 608 (36.6%) | 3.56 |
| Single Male/Father | 79 (4.8%) | 3.34 |
| Single Female/Mother | 209 (12.6%) | 3.67 |
| Non-family | 766 (46.1%) | 1.19 |
| Total Households | 1,662 (100.0%) | 2.47 |
Household Size by Marriage Status in Lawrenceville
Out of a total of 1,662 households in Lawrenceville, 896 (53.9%) are family households, while 766 (46.1%) are nonfamily households. The most numerous type of family households are 2-person households, comprising 465, and the most common type of nonfamily households are 1-person households, comprising 649.
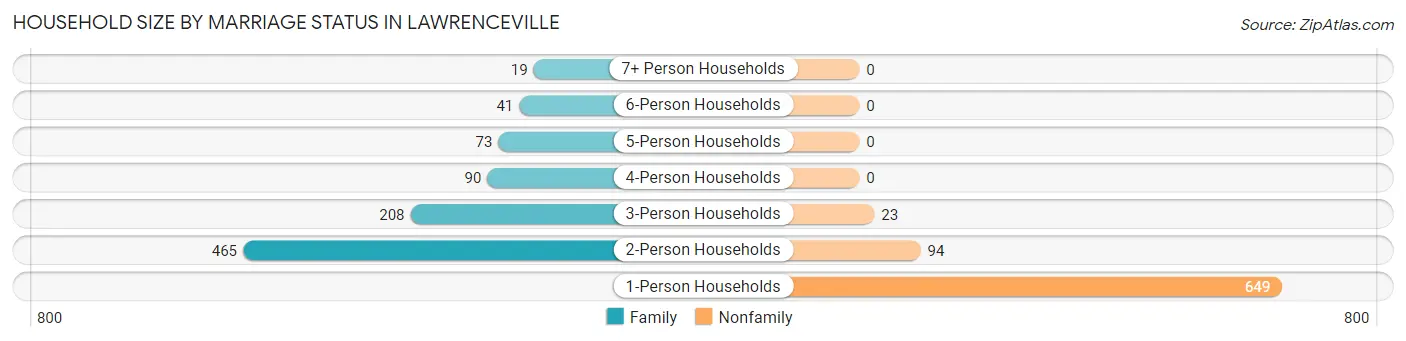
| Household Size | Family Households | Nonfamily Households |
| 1-Person Households | - | 649 (39.1%) |
| 2-Person Households | 465 (28.0%) | 94 (5.7%) |
| 3-Person Households | 208 (12.5%) | 23 (1.4%) |
| 4-Person Households | 90 (5.4%) | 0 (0.0%) |
| 5-Person Households | 73 (4.4%) | 0 (0.0%) |
| 6-Person Households | 41 (2.5%) | 0 (0.0%) |
| 7+ Person Households | 19 (1.1%) | 0 (0.0%) |
| Total | 896 (53.9%) | 766 (46.1%) |
Female Fertility in Lawrenceville
Fertility by Age in Lawrenceville
Average fertility rate in Lawrenceville is 83.0 births per 1,000 women. Women in the age bracket of 20 to 34 years have the highest fertility rate with 186.0 births per 1,000 women. Women in the age bracket of 20 to 34 years acount for 88.6% of all women with births.
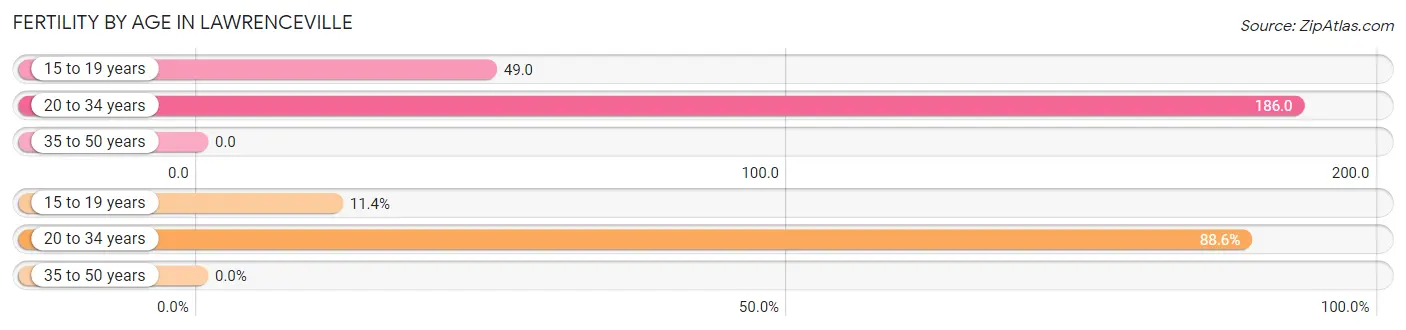
| Age Bracket | Women with Births | Births / 1,000 Women |
| 15 to 19 years | 8 (11.4%) | 49.0 |
| 20 to 34 years | 62 (88.6%) | 186.0 |
| 35 to 50 years | 0 (0.0%) | 0.0 |
| Total | 70 (100.0%) | 83.0 |
Fertility by Age by Marriage Status in Lawrenceville
10.0% of women with births (70) in Lawrenceville are married. The highest percentage of unmarried women with births falls into 15 to 19 years age bracket with 100.0% of them unmarried at the time of birth, while the lowest percentage of unmarried women with births belong to 20 to 34 years age bracket with 88.7% of them unmarried.
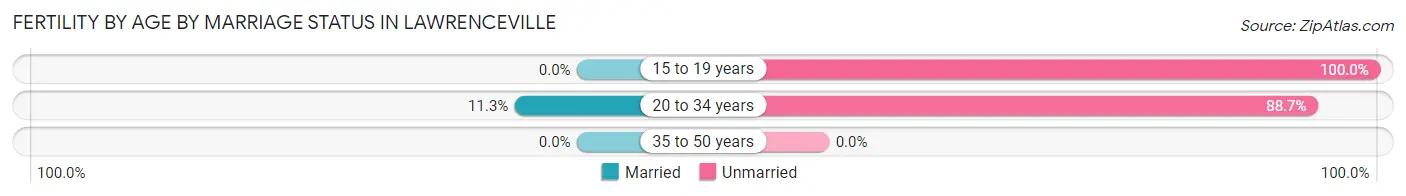
| Age Bracket | Married | Unmarried |
| 15 to 19 years | 0 (0.0%) | 8 (100.0%) |
| 20 to 34 years | 7 (11.3%) | 55 (88.7%) |
| 35 to 50 years | 0 (0.0%) | 0 (0.0%) |
| Total | 7 (10.0%) | 63 (90.0%) |
Fertility by Education in Lawrenceville
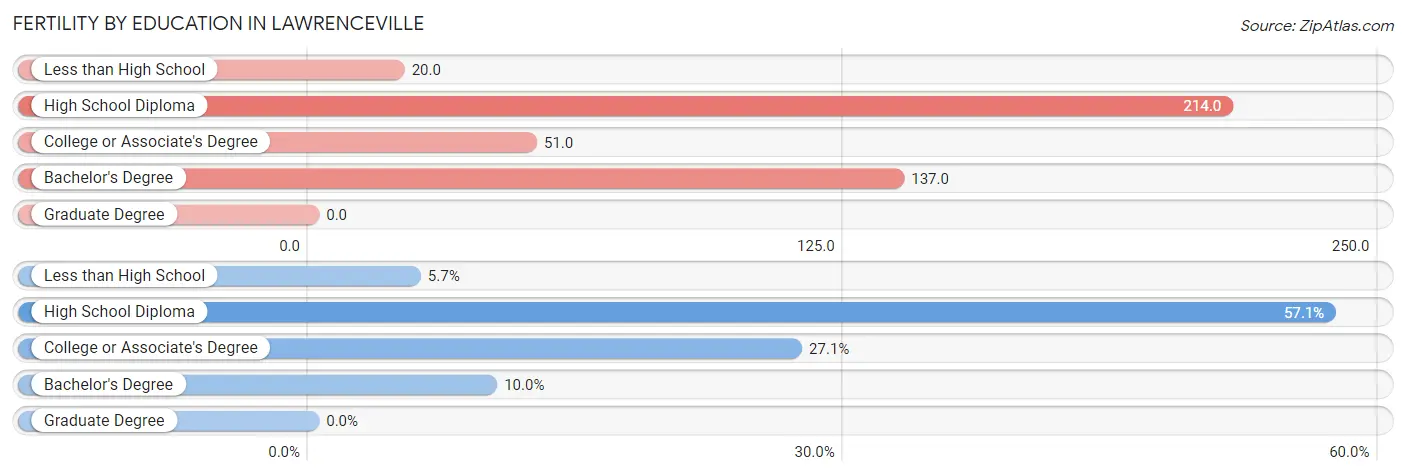
| Educational Attainment | Women with Births | Births / 1,000 Women |
| Less than High School | 4 (5.7%) | 20.0 |
| High School Diploma | 40 (57.1%) | 214.0 |
| College or Associate's Degree | 19 (27.1%) | 51.0 |
| Bachelor's Degree | 7 (10.0%) | 137.0 |
| Graduate Degree | 0 (0.0%) | 0.0 |
| Total | 70 (100.0%) | 83.0 |
Fertility by Education by Marriage Status in Lawrenceville
90.0% of women with births in Lawrenceville are unmarried. Women with the educational attainment of bachelor's degree are most likely to be married with 100.0% of them married at childbirth, while women with the educational attainment of less than high school are least likely to be married with 100.0% of them unmarried at childbirth.
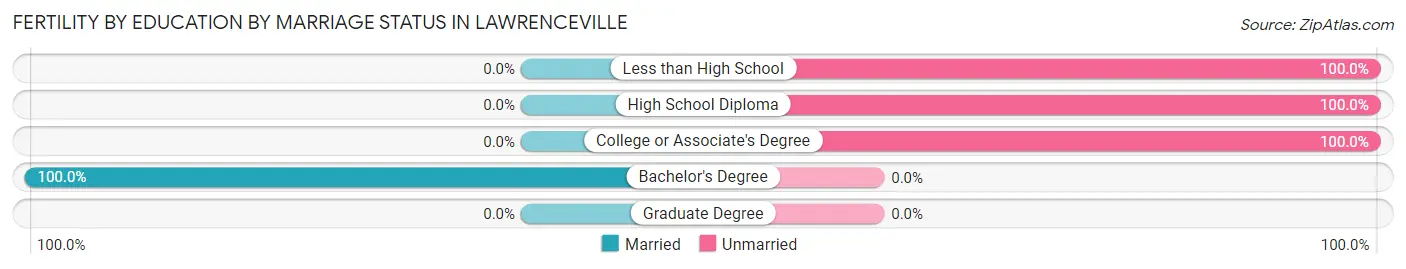
| Educational Attainment | Married | Unmarried |
| Less than High School | 0 (0.0%) | 4 (100.0%) |
| High School Diploma | 0 (0.0%) | 40 (100.0%) |
| College or Associate's Degree | 0 (0.0%) | 19 (100.0%) |
| Bachelor's Degree | 7 (100.0%) | 0 (0.0%) |
| Graduate Degree | 0 (0.0%) | 0 (0.0%) |
| Total | 7 (10.0%) | 63 (90.0%) |
Employment Characteristics in Lawrenceville
Employment by Class of Employer in Lawrenceville
Among the 1,637 employed individuals in Lawrenceville, private company employees (1,287 | 78.6%), local government employees (106 | 6.5%), and not-for-profit organizations (101 | 6.2%) make up the most common classes of employment.
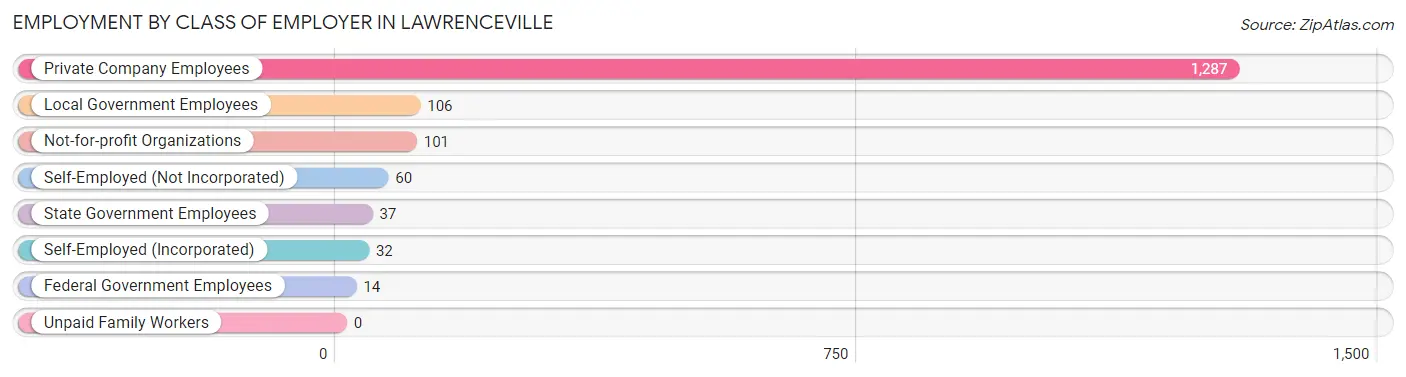
| Employer Class | # Employees | % Employees |
| Private Company Employees | 1,287 | 78.6% |
| Self-Employed (Incorporated) | 32 | 1.9% |
| Self-Employed (Not Incorporated) | 60 | 3.7% |
| Not-for-profit Organizations | 101 | 6.2% |
| Local Government Employees | 106 | 6.5% |
| State Government Employees | 37 | 2.3% |
| Federal Government Employees | 14 | 0.9% |
| Unpaid Family Workers | 0 | 0.0% |
| Total | 1,637 | 100.0% |
Employment Status by Age in Lawrenceville
According to the labor force statistics for Lawrenceville, out of the total population over 16 years of age (3,456), 50.9% or 1,759 individuals are in the labor force, with 6.9% or 121 of them unemployed. The age group with the highest labor force participation rate is 25 to 29 years, with 84.4% or 271 individuals in the labor force. Within the labor force, the 16 to 19 years age range has the highest percentage of unemployed individuals, with 27.1% or 13 of them being unemployed.
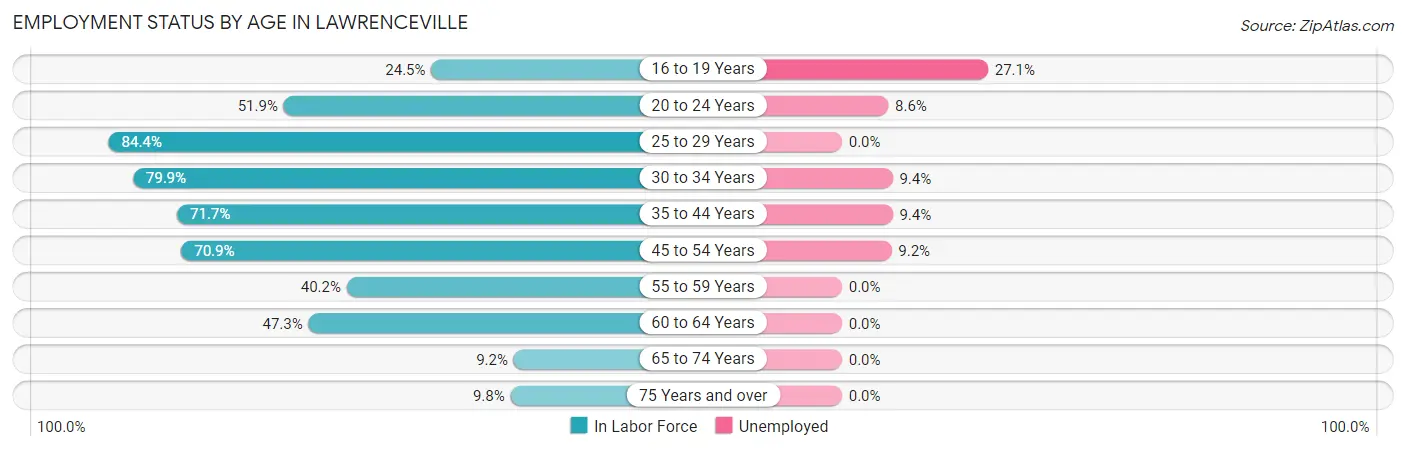
| Age Bracket | In Labor Force | Unemployed |
| 16 to 19 Years | 48 (24.5%) | 13 (27.1%) |
| 20 to 24 Years | 152 (51.9%) | 13 (8.6%) |
| 25 to 29 Years | 271 (84.4%) | 0 (0.0%) |
| 30 to 34 Years | 318 (79.9%) | 30 (9.4%) |
| 35 to 44 Years | 415 (71.7%) | 39 (9.4%) |
| 45 to 54 Years | 282 (70.9%) | 26 (9.2%) |
| 55 to 59 Years | 68 (40.2%) | 0 (0.0%) |
| 60 to 64 Years | 124 (47.3%) | 0 (0.0%) |
| 65 to 74 Years | 38 (9.2%) | 0 (0.0%) |
| 75 Years and over | 42 (9.8%) | 0 (0.0%) |
| Total | 1,759 (50.9%) | 121 (6.9%) |
Employment Status by Educational Attainment in Lawrenceville
According to labor force statistics for Lawrenceville, 69.5% of individuals (1,478) out of the total population between 25 and 64 years of age (2,127) are in the labor force, with 6.4% or 95 of them being unemployed. The group with the highest labor force participation rate are those with the educational attainment of bachelor's degree or higher, with 93.0% or 253 individuals in the labor force. Within the labor force, individuals with college / associate degree education have the highest percentage of unemployment, with 8.6% or 55 of them being unemployed.
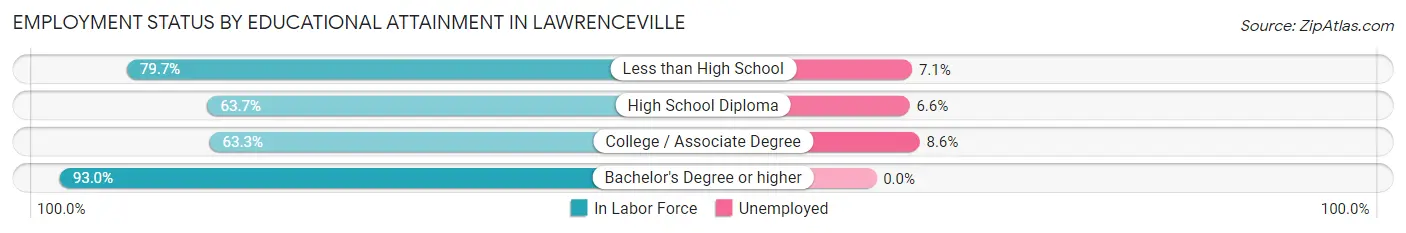
| Educational Attainment | In Labor Force | Unemployed |
| Less than High School | 239 (79.7%) | 21 (7.1%) |
| High School Diploma | 349 (63.7%) | 36 (6.6%) |
| College / Associate Degree | 637 (63.3%) | 87 (8.6%) |
| Bachelor's Degree or higher | 253 (93.0%) | 0 (0.0%) |
| Total | 1,478 (69.5%) | 136 (6.4%) |
Employment Occupations by Sex in Lawrenceville
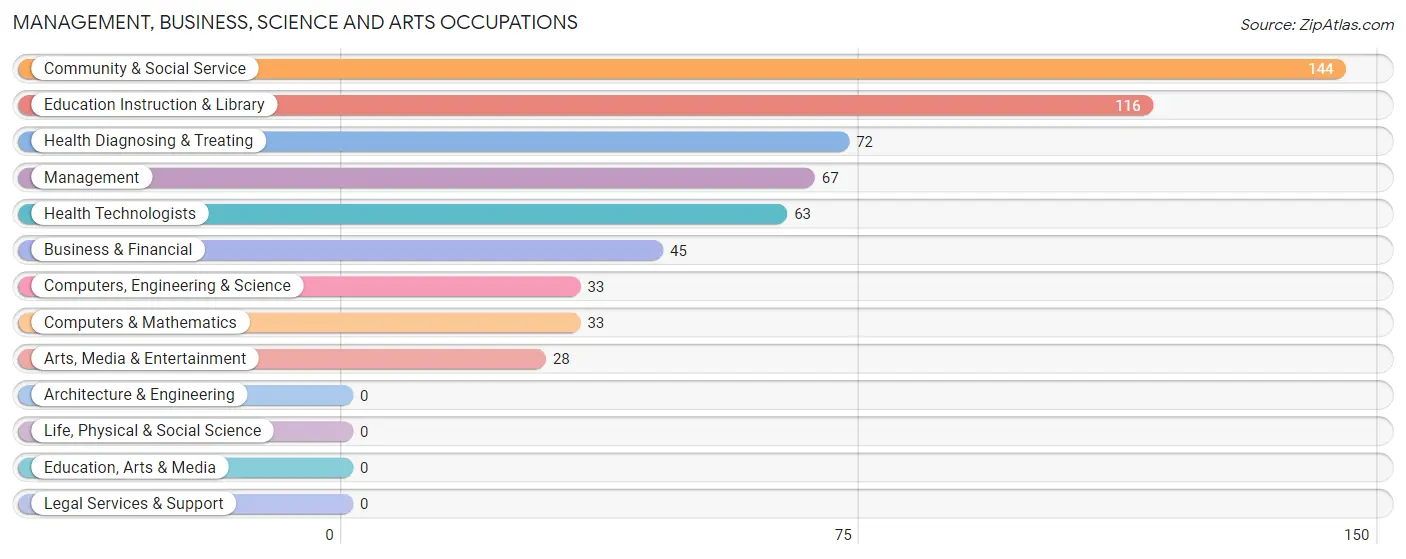
Management, Business, Science and Arts Occupations
The most common Management, Business, Science and Arts occupations in Lawrenceville are Community & Social Service (144 | 8.8%), Education Instruction & Library (116 | 7.1%), Health Diagnosing & Treating (72 | 4.4%), Management (67 | 4.1%), and Health Technologists (63 | 3.8%).
Management, Business, Science and Arts Occupations by Sex
Within the Management, Business, Science and Arts occupations in Lawrenceville, the most male-oriented occupations are Computers, Engineering & Science (100.0%), Computers & Mathematics (100.0%), and Management (95.5%), while the most female-oriented occupations are Health Diagnosing & Treating (87.5%), Health Technologists (85.7%), and Education Instruction & Library (50.9%).
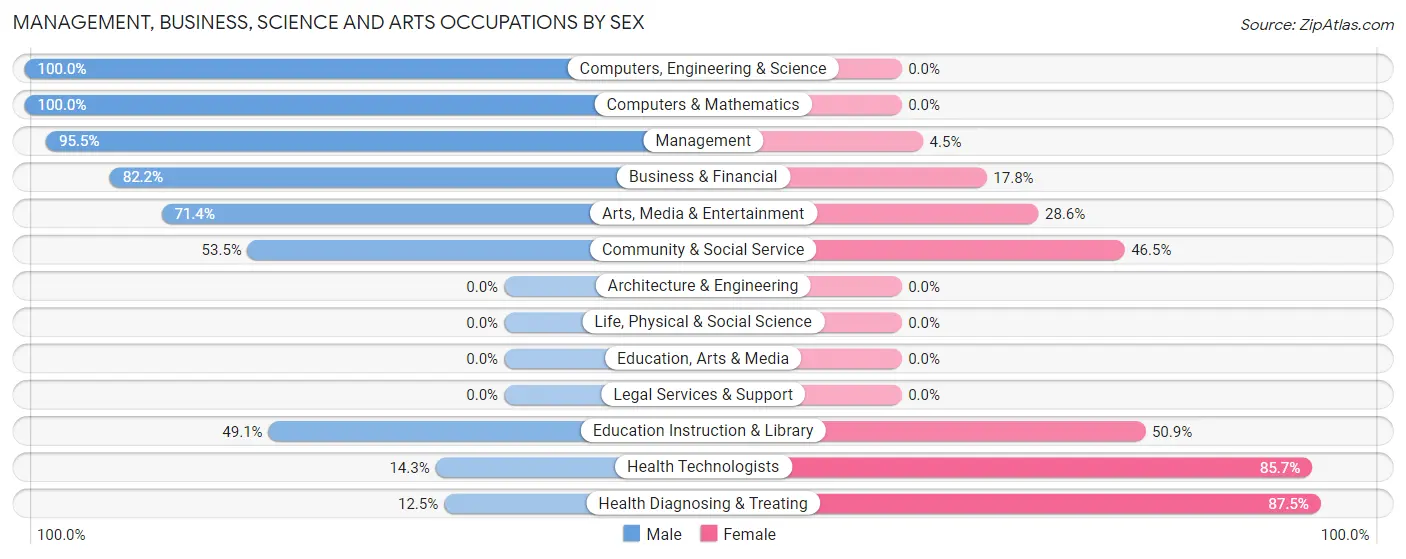
| Occupation | Male | Female |
| Management | 64 (95.5%) | 3 (4.5%) |
| Business & Financial | 37 (82.2%) | 8 (17.8%) |
| Computers, Engineering & Science | 33 (100.0%) | 0 (0.0%) |
| Computers & Mathematics | 33 (100.0%) | 0 (0.0%) |
| Architecture & Engineering | 0 (0.0%) | 0 (0.0%) |
| Life, Physical & Social Science | 0 (0.0%) | 0 (0.0%) |
| Community & Social Service | 77 (53.5%) | 67 (46.5%) |
| Education, Arts & Media | 0 (0.0%) | 0 (0.0%) |
| Legal Services & Support | 0 (0.0%) | 0 (0.0%) |
| Education Instruction & Library | 57 (49.1%) | 59 (50.9%) |
| Arts, Media & Entertainment | 20 (71.4%) | 8 (28.6%) |
| Health Diagnosing & Treating | 9 (12.5%) | 63 (87.5%) |
| Health Technologists | 9 (14.3%) | 54 (85.7%) |
| Total (Category) | 220 (60.9%) | 141 (39.1%) |
| Total (Overall) | 1,050 (64.1%) | 587 (35.9%) |
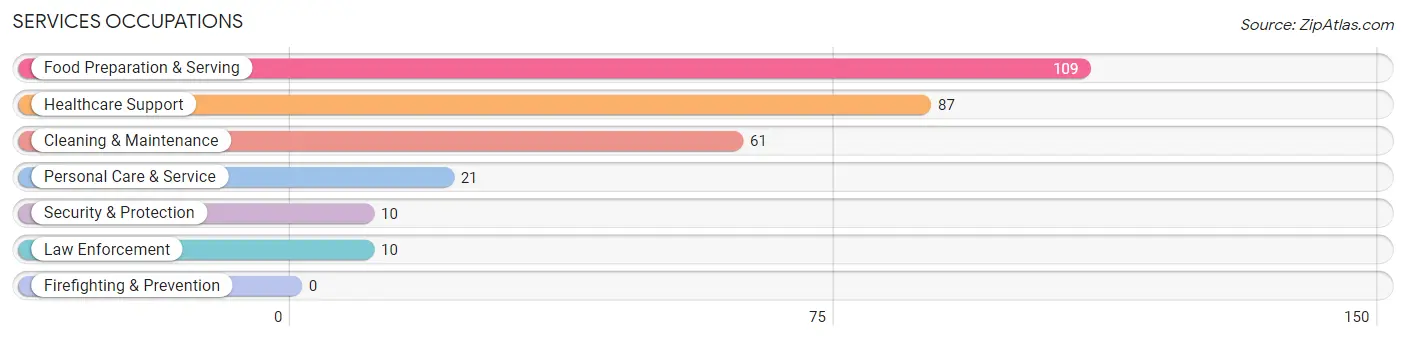
Services Occupations
The most common Services occupations in Lawrenceville are Food Preparation & Serving (109 | 6.7%), Healthcare Support (87 | 5.3%), Cleaning & Maintenance (61 | 3.7%), Personal Care & Service (21 | 1.3%), and Security & Protection (10 | 0.6%).
Services Occupations by Sex
Within the Services occupations in Lawrenceville, the most male-oriented occupations are Security & Protection (100.0%), Law Enforcement (100.0%), and Food Preparation & Serving (53.2%), while the most female-oriented occupations are Healthcare Support (100.0%), Personal Care & Service (100.0%), and Cleaning & Maintenance (75.4%).
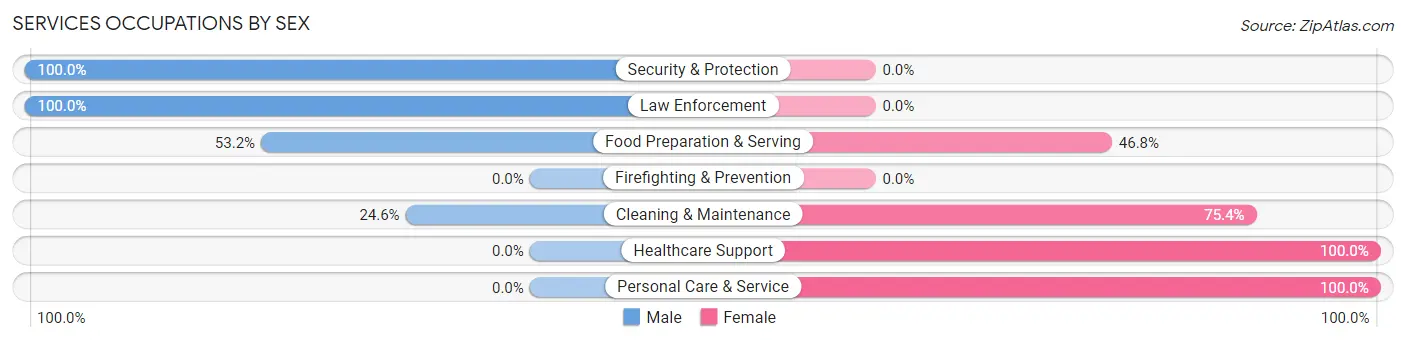
| Occupation | Male | Female |
| Healthcare Support | 0 (0.0%) | 87 (100.0%) |
| Security & Protection | 10 (100.0%) | 0 (0.0%) |
| Firefighting & Prevention | 0 (0.0%) | 0 (0.0%) |
| Law Enforcement | 10 (100.0%) | 0 (0.0%) |
| Food Preparation & Serving | 58 (53.2%) | 51 (46.8%) |
| Cleaning & Maintenance | 15 (24.6%) | 46 (75.4%) |
| Personal Care & Service | 0 (0.0%) | 21 (100.0%) |
| Total (Category) | 83 (28.8%) | 205 (71.2%) |
| Total (Overall) | 1,050 (64.1%) | 587 (35.9%) |
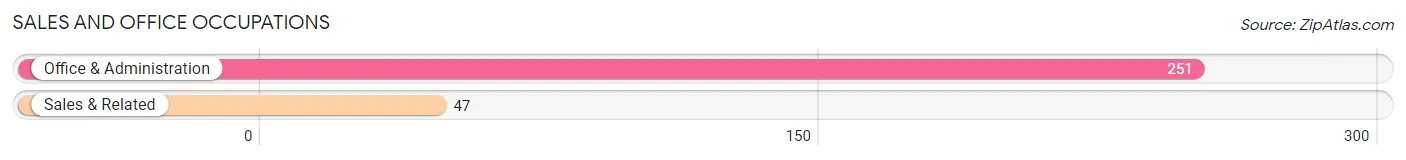
Sales and Office Occupations
The most common Sales and Office occupations in Lawrenceville are Office & Administration (251 | 15.3%), and Sales & Related (47 | 2.9%).
Sales and Office Occupations by Sex
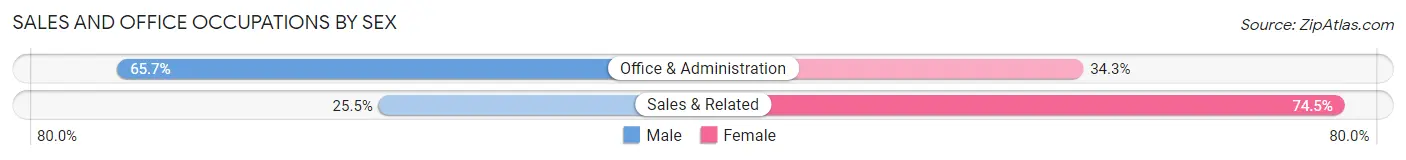
| Occupation | Male | Female |
| Sales & Related | 12 (25.5%) | 35 (74.5%) |
| Office & Administration | 165 (65.7%) | 86 (34.3%) |
| Total (Category) | 177 (59.4%) | 121 (40.6%) |
| Total (Overall) | 1,050 (64.1%) | 587 (35.9%) |
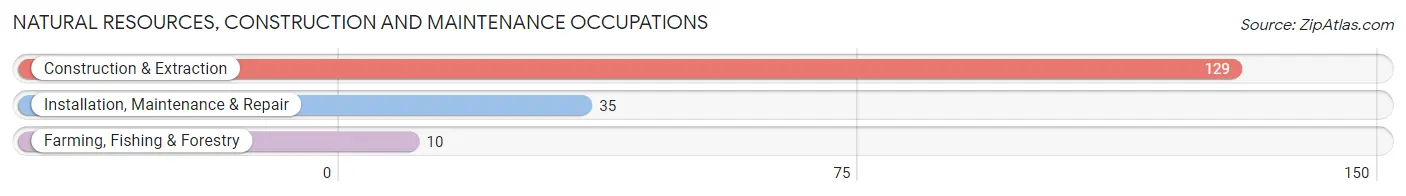
Natural Resources, Construction and Maintenance Occupations
The most common Natural Resources, Construction and Maintenance occupations in Lawrenceville are Construction & Extraction (129 | 7.9%), Installation, Maintenance & Repair (35 | 2.1%), and Farming, Fishing & Forestry (10 | 0.6%).
Natural Resources, Construction and Maintenance Occupations by Sex
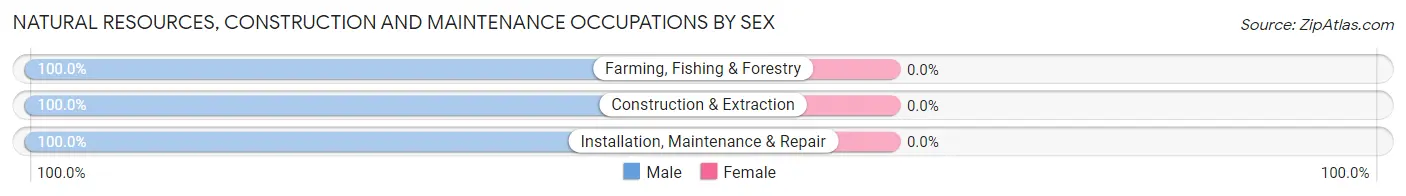
| Occupation | Male | Female |
| Farming, Fishing & Forestry | 10 (100.0%) | 0 (0.0%) |
| Construction & Extraction | 129 (100.0%) | 0 (0.0%) |
| Installation, Maintenance & Repair | 35 (100.0%) | 0 (0.0%) |
| Total (Category) | 174 (100.0%) | 0 (0.0%) |
| Total (Overall) | 1,050 (64.1%) | 587 (35.9%) |
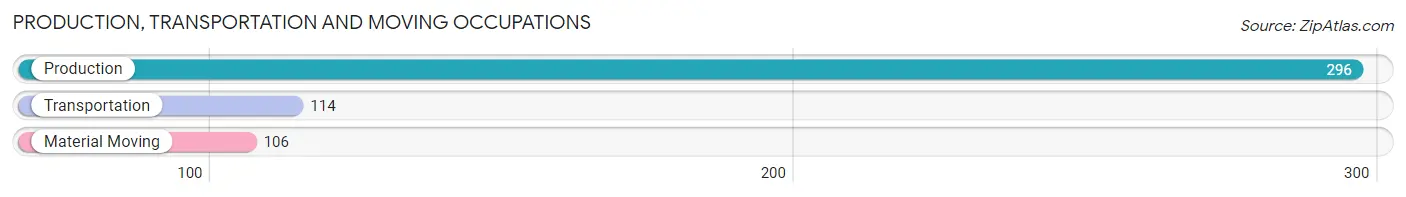
Production, Transportation and Moving Occupations
The most common Production, Transportation and Moving occupations in Lawrenceville are Production (296 | 18.1%), Transportation (114 | 7.0%), and Material Moving (106 | 6.5%).
Production, Transportation and Moving Occupations by Sex
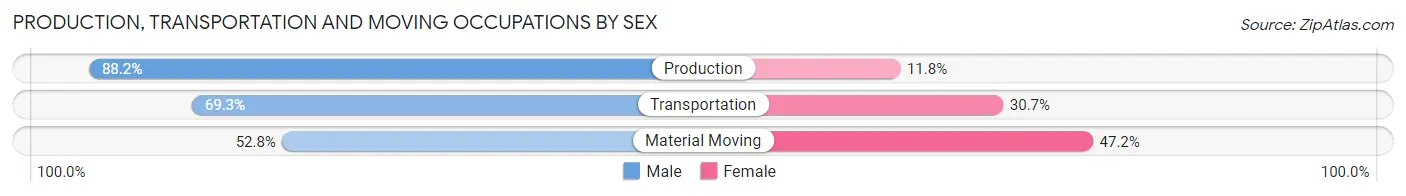
| Occupation | Male | Female |
| Production | 261 (88.2%) | 35 (11.8%) |
| Transportation | 79 (69.3%) | 35 (30.7%) |
| Material Moving | 56 (52.8%) | 50 (47.2%) |
| Total (Category) | 396 (76.7%) | 120 (23.3%) |
| Total (Overall) | 1,050 (64.1%) | 587 (35.9%) |
Employment Industries by Sex in Lawrenceville
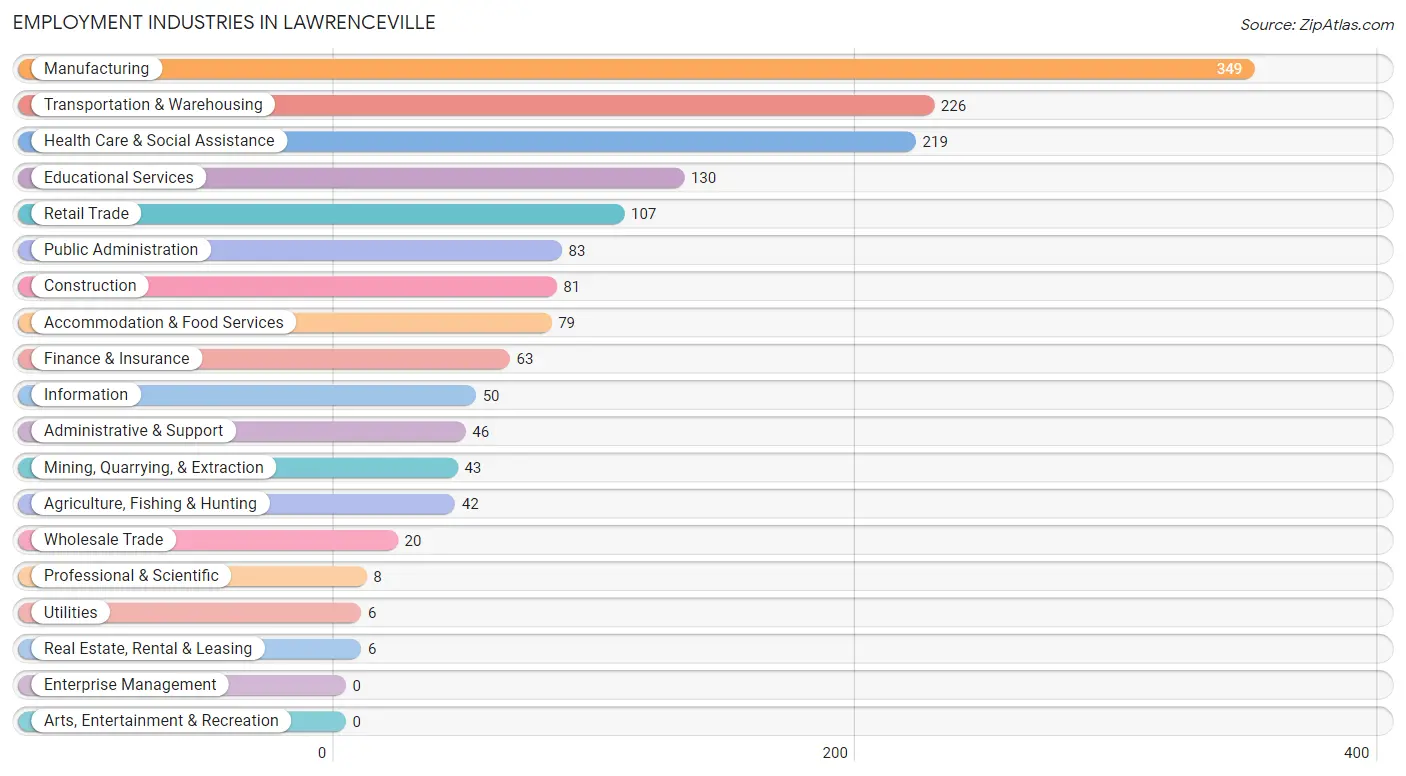
Employment Industries in Lawrenceville
The major employment industries in Lawrenceville include Manufacturing (349 | 21.3%), Transportation & Warehousing (226 | 13.8%), Health Care & Social Assistance (219 | 13.4%), Educational Services (130 | 7.9%), and Retail Trade (107 | 6.5%).
Employment Industries by Sex in Lawrenceville
The Lawrenceville industries that see more men than women are Agriculture, Fishing & Hunting (100.0%), Mining, Quarrying, & Extraction (100.0%), and Construction (100.0%), whereas the industries that tend to have a higher number of women are Administrative & Support (100.0%), Finance & Insurance (92.1%), and Health Care & Social Assistance (79.0%).
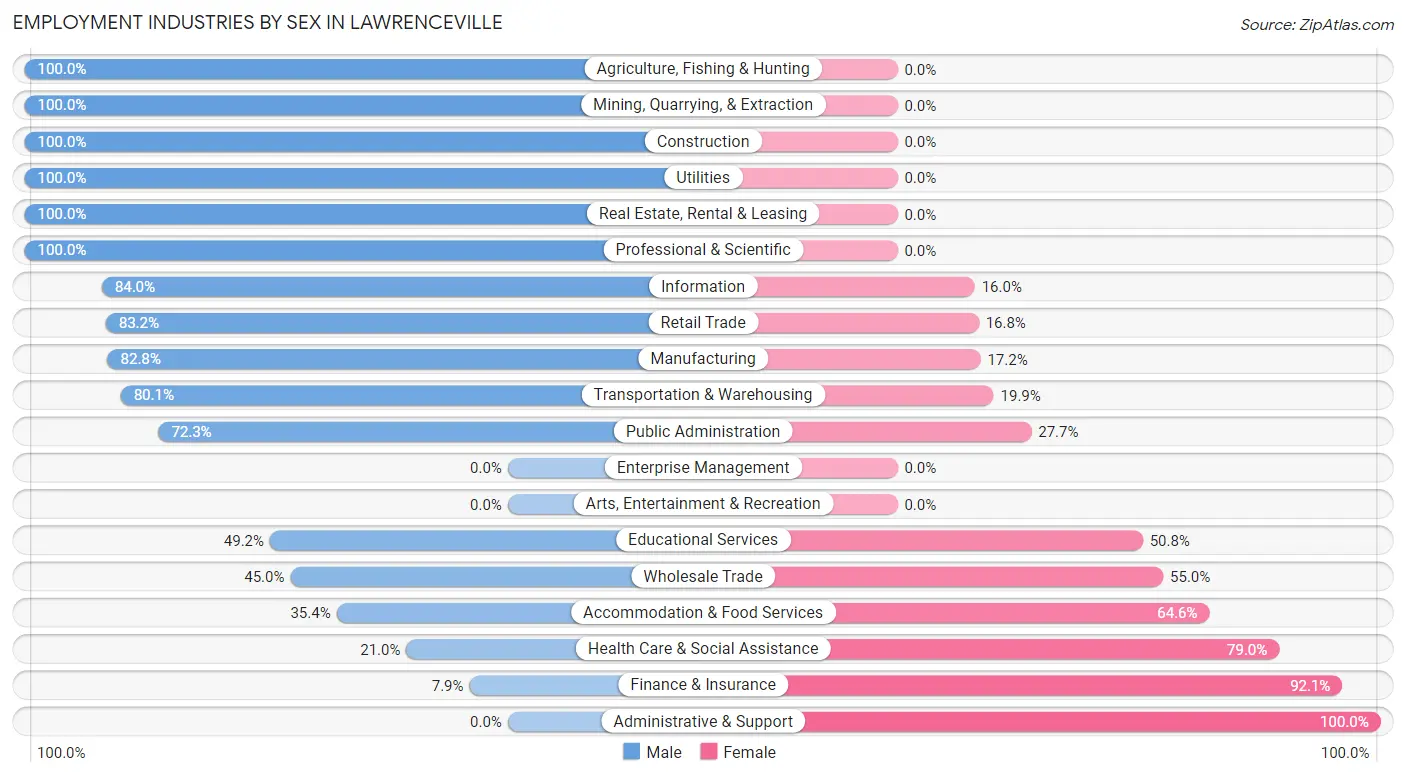
| Industry | Male | Female |
| Agriculture, Fishing & Hunting | 42 (100.0%) | 0 (0.0%) |
| Mining, Quarrying, & Extraction | 43 (100.0%) | 0 (0.0%) |
| Construction | 81 (100.0%) | 0 (0.0%) |
| Manufacturing | 289 (82.8%) | 60 (17.2%) |
| Wholesale Trade | 9 (45.0%) | 11 (55.0%) |
| Retail Trade | 89 (83.2%) | 18 (16.8%) |
| Transportation & Warehousing | 181 (80.1%) | 45 (19.9%) |
| Utilities | 6 (100.0%) | 0 (0.0%) |
| Information | 42 (84.0%) | 8 (16.0%) |
| Finance & Insurance | 5 (7.9%) | 58 (92.1%) |
| Real Estate, Rental & Leasing | 6 (100.0%) | 0 (0.0%) |
| Professional & Scientific | 8 (100.0%) | 0 (0.0%) |
| Enterprise Management | 0 (0.0%) | 0 (0.0%) |
| Administrative & Support | 0 (0.0%) | 46 (100.0%) |
| Educational Services | 64 (49.2%) | 66 (50.8%) |
| Health Care & Social Assistance | 46 (21.0%) | 173 (79.0%) |
| Arts, Entertainment & Recreation | 0 (0.0%) | 0 (0.0%) |
| Accommodation & Food Services | 28 (35.4%) | 51 (64.6%) |
| Public Administration | 60 (72.3%) | 23 (27.7%) |
| Total | 1,050 (64.1%) | 587 (35.9%) |
Education in Lawrenceville
School Enrollment in Lawrenceville
The most common levels of schooling among the 876 students in Lawrenceville are high school (226 | 25.8%), college / undergraduate (196 | 22.4%), and elementary school (171 | 19.5%).
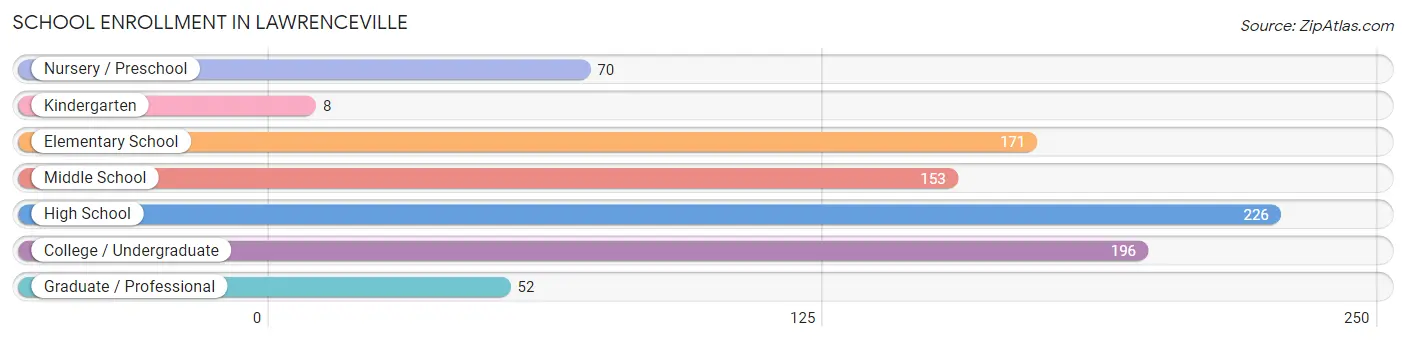
| School Level | # Students | % Students |
| Nursery / Preschool | 70 | 8.0% |
| Kindergarten | 8 | 0.9% |
| Elementary School | 171 | 19.5% |
| Middle School | 153 | 17.5% |
| High School | 226 | 25.8% |
| College / Undergraduate | 196 | 22.4% |
| Graduate / Professional | 52 | 5.9% |
| Total | 876 | 100.0% |
School Enrollment by Age by Funding Source in Lawrenceville
Out of a total of 876 students who are enrolled in schools in Lawrenceville, 155 (17.7%) attend a private institution, while the remaining 721 (82.3%) are enrolled in public schools. The age group of 35 years and over has the highest likelihood of being enrolled in private schools, with 116 (57.1% in the age bracket) enrolled. Conversely, the age group of 5 to 9 year old has the lowest likelihood of being enrolled in a private school, with 161 (100.0% in the age bracket) attending a public institution.
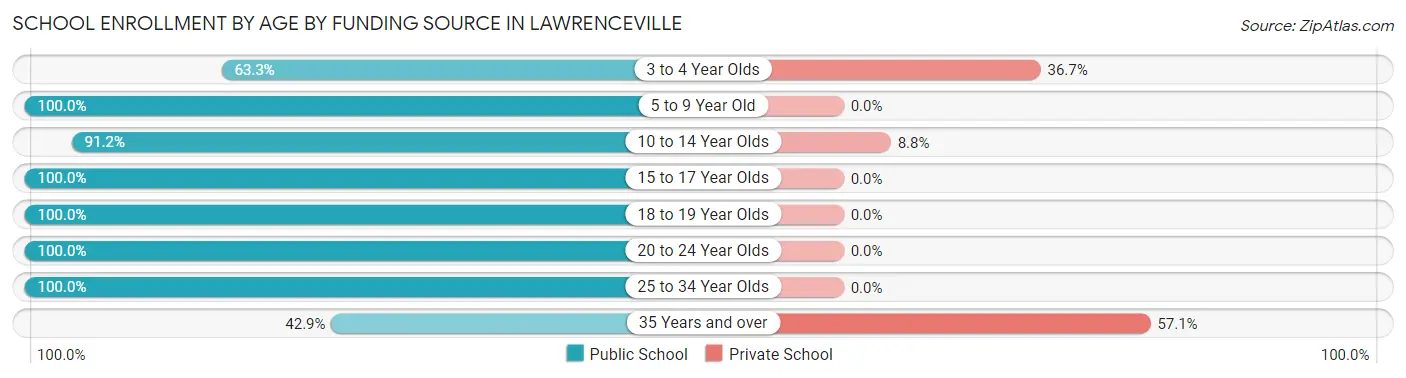
| Age Bracket | Public School | Private School |
| 3 to 4 Year Olds | 38 (63.3%) | 22 (36.7%) |
| 5 to 9 Year Old | 161 (100.0%) | 0 (0.0%) |
| 10 to 14 Year Olds | 177 (91.2%) | 17 (8.8%) |
| 15 to 17 Year Olds | 172 (100.0%) | 0 (0.0%) |
| 18 to 19 Year Olds | 39 (100.0%) | 0 (0.0%) |
| 20 to 24 Year Olds | 23 (100.0%) | 0 (0.0%) |
| 25 to 34 Year Olds | 24 (100.0%) | 0 (0.0%) |
| 35 Years and over | 87 (42.9%) | 116 (57.1%) |
| Total | 721 (82.3%) | 155 (17.7%) |
Educational Attainment by Field of Study in Lawrenceville
Education (210 | 41.3%), social sciences (75 | 14.7%), arts & humanities (67 | 13.2%), business (45 | 8.8%), and science & technology (41 | 8.1%) are the most common fields of study among 509 individuals in Lawrenceville who have obtained a bachelor's degree or higher.
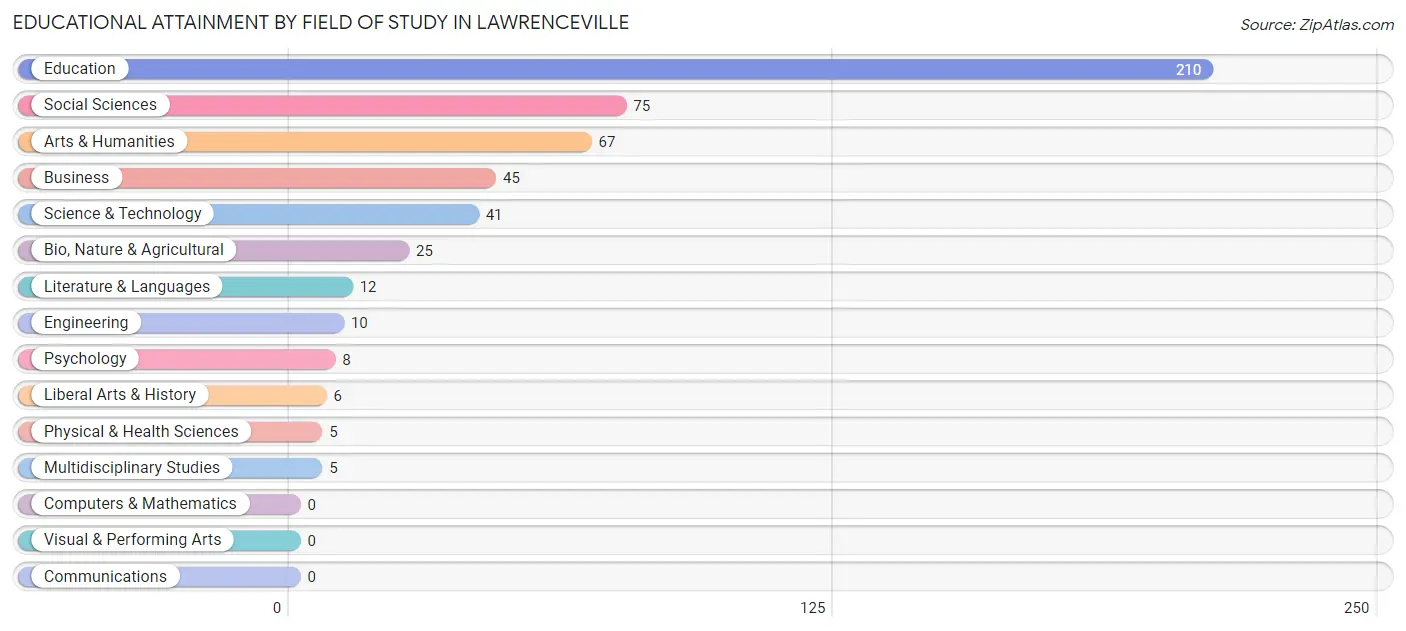
| Field of Study | # Graduates | % Graduates |
| Computers & Mathematics | 0 | 0.0% |
| Bio, Nature & Agricultural | 25 | 4.9% |
| Physical & Health Sciences | 5 | 1.0% |
| Psychology | 8 | 1.6% |
| Social Sciences | 75 | 14.7% |
| Engineering | 10 | 2.0% |
| Multidisciplinary Studies | 5 | 1.0% |
| Science & Technology | 41 | 8.1% |
| Business | 45 | 8.8% |
| Education | 210 | 41.3% |
| Literature & Languages | 12 | 2.4% |
| Liberal Arts & History | 6 | 1.2% |
| Visual & Performing Arts | 0 | 0.0% |
| Communications | 0 | 0.0% |
| Arts & Humanities | 67 | 13.2% |
| Total | 509 | 100.0% |
Transportation & Commute in Lawrenceville
Vehicle Availability by Sex in Lawrenceville
The most prevalent vehicle ownership categories in Lawrenceville are males with 4 vehicles (384, accounting for 36.6%) and females with 4 vehicles (49, making up 65.4%).
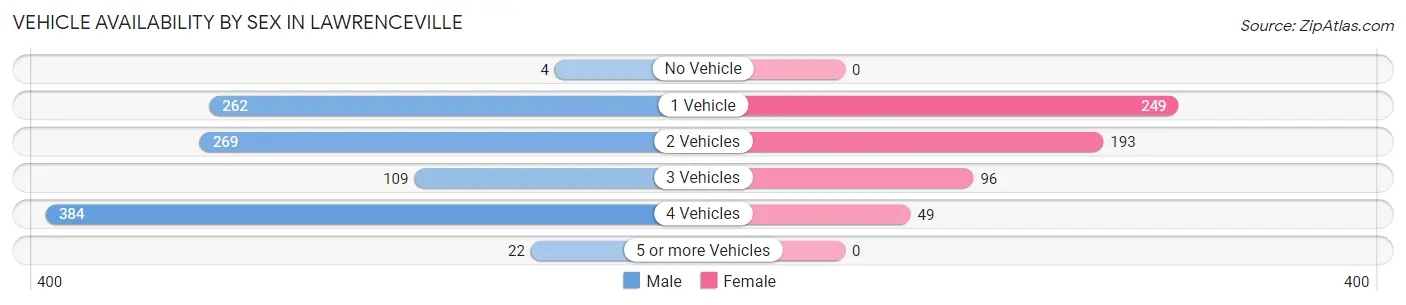
| Vehicles Available | Male | Female |
| No Vehicle | 4 (0.4%) | 0 (0.0%) |
| 1 Vehicle | 262 (24.9%) | 249 (42.4%) |
| 2 Vehicles | 269 (25.6%) | 193 (32.9%) |
| 3 Vehicles | 109 (10.4%) | 96 (16.4%) |
| 4 Vehicles | 384 (36.6%) | 49 (8.4%) |
| 5 or more Vehicles | 22 (2.1%) | 0 (0.0%) |
| Total | 1,050 (100.0%) | 587 (100.0%) |
Commute Time in Lawrenceville
The most frequently occuring commute durations in Lawrenceville are 10 to 14 minutes (310 commuters, 20.5%), 5 to 9 minutes (280 commuters, 18.5%), and 60 to 89 minutes (206 commuters, 13.6%).
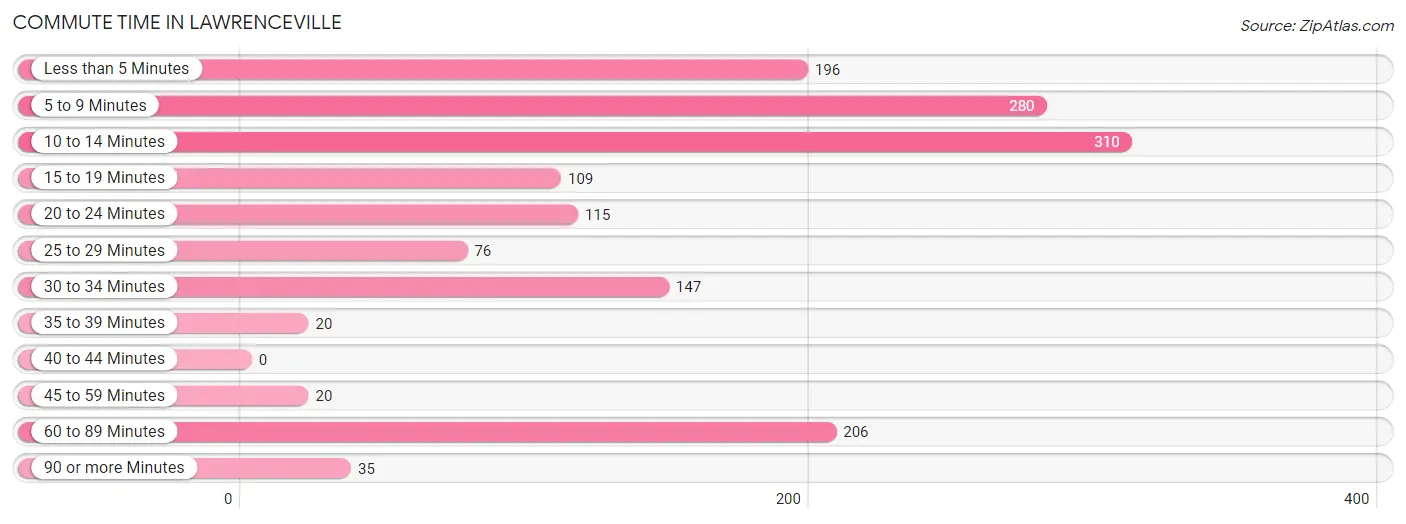
| Commute Time | # Commuters | % Commuters |
| Less than 5 Minutes | 196 | 13.0% |
| 5 to 9 Minutes | 280 | 18.5% |
| 10 to 14 Minutes | 310 | 20.5% |
| 15 to 19 Minutes | 109 | 7.2% |
| 20 to 24 Minutes | 115 | 7.6% |
| 25 to 29 Minutes | 76 | 5.0% |
| 30 to 34 Minutes | 147 | 9.7% |
| 35 to 39 Minutes | 20 | 1.3% |
| 40 to 44 Minutes | 0 | 0.0% |
| 45 to 59 Minutes | 20 | 1.3% |
| 60 to 89 Minutes | 206 | 13.6% |
| 90 or more Minutes | 35 | 2.3% |
Commute Time by Sex in Lawrenceville
The most common commute times in Lawrenceville are 10 to 14 minutes (246 commuters, 25.4%) for males and 5 to 9 minutes (130 commuters, 23.8%) for females.
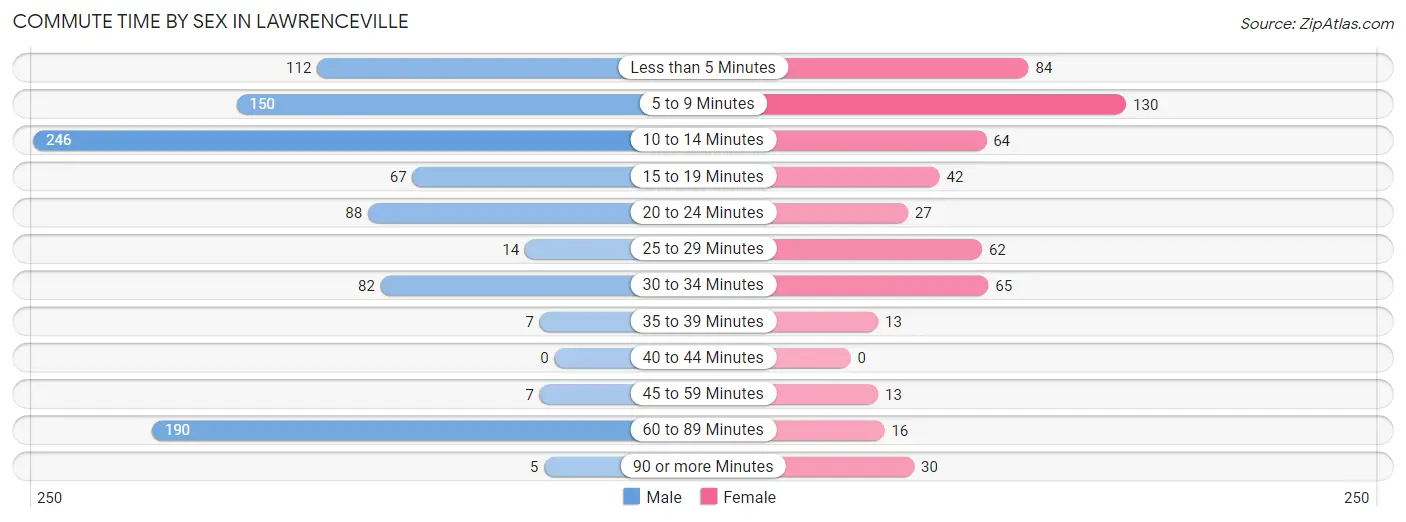
| Commute Time | Male | Female |
| Less than 5 Minutes | 112 (11.6%) | 84 (15.4%) |
| 5 to 9 Minutes | 150 (15.5%) | 130 (23.8%) |
| 10 to 14 Minutes | 246 (25.4%) | 64 (11.7%) |
| 15 to 19 Minutes | 67 (6.9%) | 42 (7.7%) |
| 20 to 24 Minutes | 88 (9.1%) | 27 (5.0%) |
| 25 to 29 Minutes | 14 (1.5%) | 62 (11.4%) |
| 30 to 34 Minutes | 82 (8.5%) | 65 (11.9%) |
| 35 to 39 Minutes | 7 (0.7%) | 13 (2.4%) |
| 40 to 44 Minutes | 0 (0.0%) | 0 (0.0%) |
| 45 to 59 Minutes | 7 (0.7%) | 13 (2.4%) |
| 60 to 89 Minutes | 190 (19.6%) | 16 (2.9%) |
| 90 or more Minutes | 5 (0.5%) | 30 (5.5%) |
Time of Departure to Work by Sex in Lawrenceville
The most frequent times of departure to work in Lawrenceville are 12:00 AM to 4:59 AM (253, 26.1%) for males and 7:30 AM to 7:59 AM (117, 21.4%) for females.
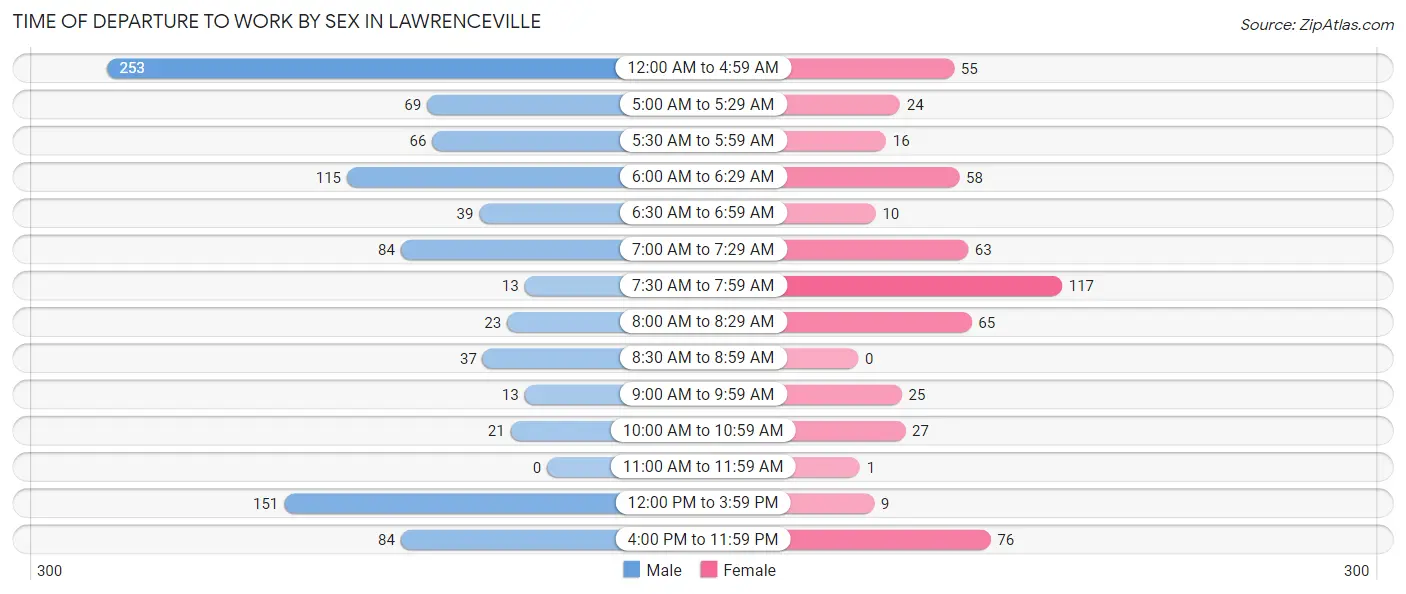
| Time of Departure | Male | Female |
| 12:00 AM to 4:59 AM | 253 (26.1%) | 55 (10.1%) |
| 5:00 AM to 5:29 AM | 69 (7.1%) | 24 (4.4%) |
| 5:30 AM to 5:59 AM | 66 (6.8%) | 16 (2.9%) |
| 6:00 AM to 6:29 AM | 115 (11.9%) | 58 (10.6%) |
| 6:30 AM to 6:59 AM | 39 (4.0%) | 10 (1.8%) |
| 7:00 AM to 7:29 AM | 84 (8.7%) | 63 (11.5%) |
| 7:30 AM to 7:59 AM | 13 (1.3%) | 117 (21.4%) |
| 8:00 AM to 8:29 AM | 23 (2.4%) | 65 (11.9%) |
| 8:30 AM to 8:59 AM | 37 (3.8%) | 0 (0.0%) |
| 9:00 AM to 9:59 AM | 13 (1.3%) | 25 (4.6%) |
| 10:00 AM to 10:59 AM | 21 (2.2%) | 27 (5.0%) |
| 11:00 AM to 11:59 AM | 0 (0.0%) | 1 (0.2%) |
| 12:00 PM to 3:59 PM | 151 (15.6%) | 9 (1.7%) |
| 4:00 PM to 11:59 PM | 84 (8.7%) | 76 (13.9%) |
| Total | 968 (100.0%) | 546 (100.0%) |
Housing Occupancy in Lawrenceville
Occupancy by Ownership in Lawrenceville
Of the total 1,662 dwellings in Lawrenceville, owner-occupied units account for 1,010 (60.8%), while renter-occupied units make up 652 (39.2%).
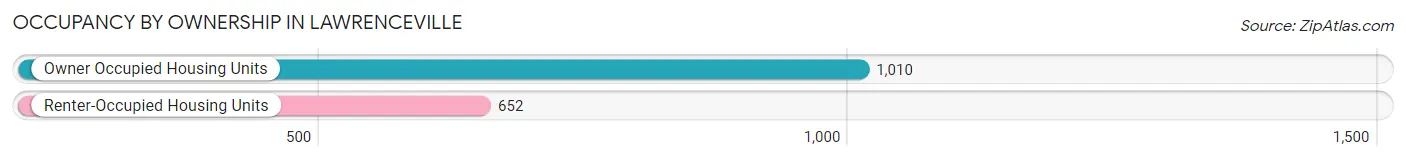
| Occupancy | # Housing Units | % Housing Units |
| Owner Occupied Housing Units | 1,010 | 60.8% |
| Renter-Occupied Housing Units | 652 | 39.2% |
| Total Occupied Housing Units | 1,662 | 100.0% |
Occupancy by Household Size in Lawrenceville
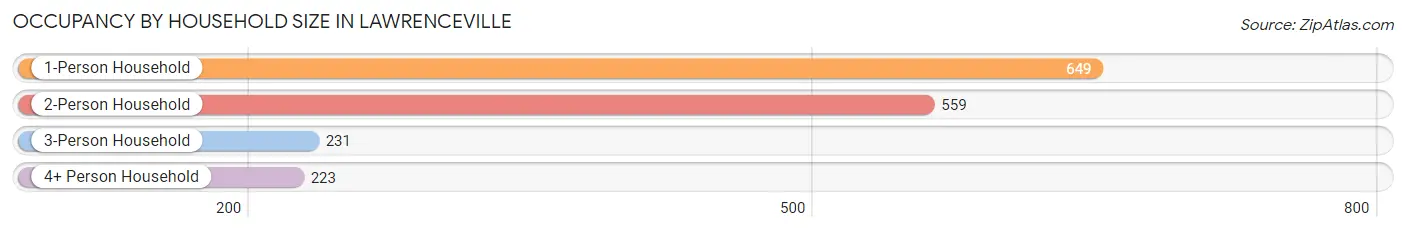
| Household Size | # Housing Units | % Housing Units |
| 1-Person Household | 649 | 39.1% |
| 2-Person Household | 559 | 33.6% |
| 3-Person Household | 231 | 13.9% |
| 4+ Person Household | 223 | 13.4% |
| Total Housing Units | 1,662 | 100.0% |
Occupancy by Ownership by Household Size in Lawrenceville
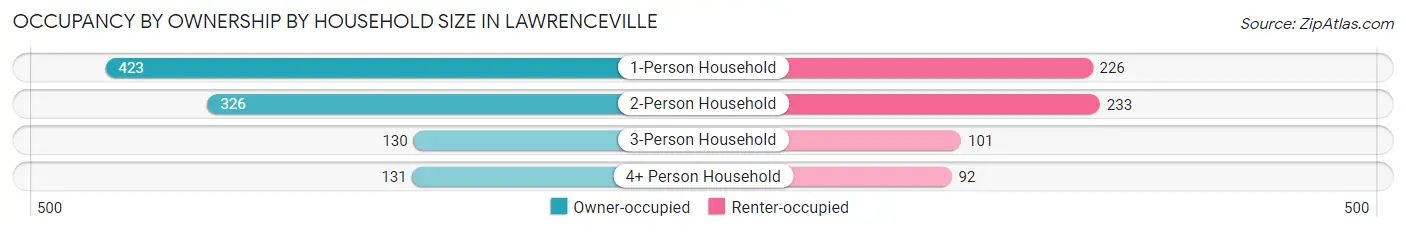
| Household Size | Owner-occupied | Renter-occupied |
| 1-Person Household | 423 (65.2%) | 226 (34.8%) |
| 2-Person Household | 326 (58.3%) | 233 (41.7%) |
| 3-Person Household | 130 (56.3%) | 101 (43.7%) |
| 4+ Person Household | 131 (58.7%) | 92 (41.3%) |
| Total Housing Units | 1,010 (60.8%) | 652 (39.2%) |
Occupancy by Educational Attainment in Lawrenceville
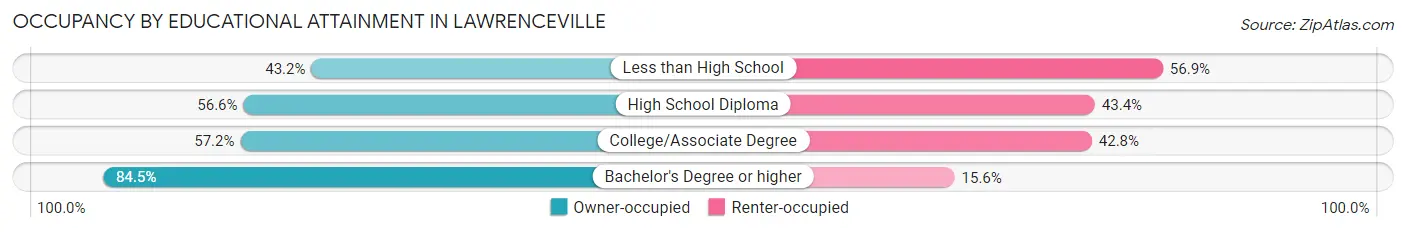
| Household Size | Owner-occupied | Renter-occupied |
| Less than High School | 85 (43.1%) | 112 (56.9%) |
| High School Diploma | 252 (56.6%) | 193 (43.4%) |
| College/Associate Degree | 396 (57.2%) | 296 (42.8%) |
| Bachelor's Degree or higher | 277 (84.5%) | 51 (15.5%) |
Occupancy by Age of Householder in Lawrenceville
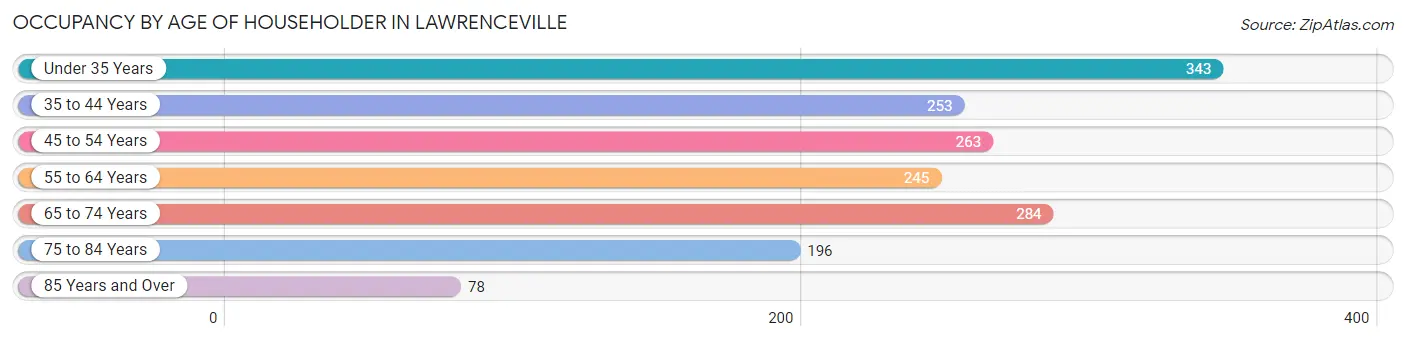
| Age Bracket | # Households | % Households |
| Under 35 Years | 343 | 20.6% |
| 35 to 44 Years | 253 | 15.2% |
| 45 to 54 Years | 263 | 15.8% |
| 55 to 64 Years | 245 | 14.7% |
| 65 to 74 Years | 284 | 17.1% |
| 75 to 84 Years | 196 | 11.8% |
| 85 Years and Over | 78 | 4.7% |
| Total | 1,662 | 100.0% |
Housing Finances in Lawrenceville
Median Income by Occupancy in Lawrenceville
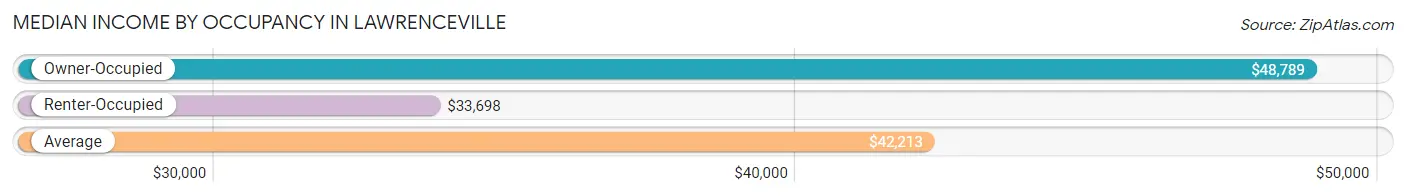
| Occupancy Type | # Households | Median Income |
| Owner-Occupied | 1,010 (60.8%) | $48,789 |
| Renter-Occupied | 652 (39.2%) | $33,698 |
| Average | 1,662 (100.0%) | $42,213 |
Occupancy by Householder Income Bracket in Lawrenceville
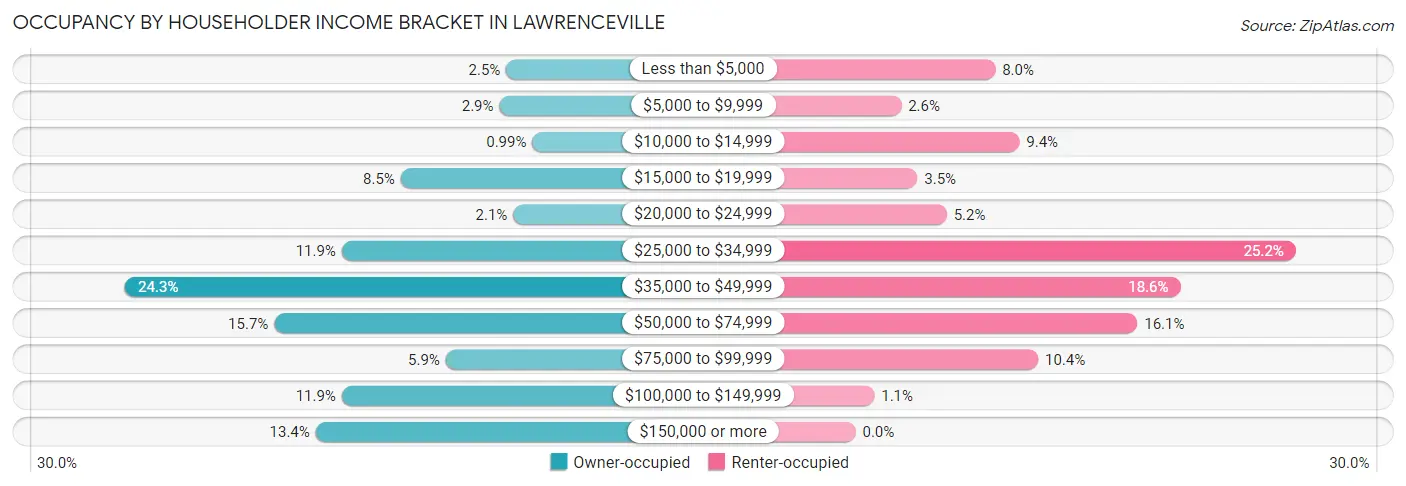
| Income Bracket | Owner-occupied | Renter-occupied |
| Less than $5,000 | 25 (2.5%) | 52 (8.0%) |
| $5,000 to $9,999 | 29 (2.9%) | 17 (2.6%) |
| $10,000 to $14,999 | 10 (1.0%) | 61 (9.4%) |
| $15,000 to $19,999 | 86 (8.5%) | 23 (3.5%) |
| $20,000 to $24,999 | 21 (2.1%) | 34 (5.2%) |
| $25,000 to $34,999 | 120 (11.9%) | 164 (25.2%) |
| $35,000 to $49,999 | 245 (24.3%) | 121 (18.6%) |
| $50,000 to $74,999 | 159 (15.7%) | 105 (16.1%) |
| $75,000 to $99,999 | 60 (5.9%) | 68 (10.4%) |
| $100,000 to $149,999 | 120 (11.9%) | 7 (1.1%) |
| $150,000 or more | 135 (13.4%) | 0 (0.0%) |
| Total | 1,010 (100.0%) | 652 (100.0%) |
Monthly Housing Cost Tiers in Lawrenceville
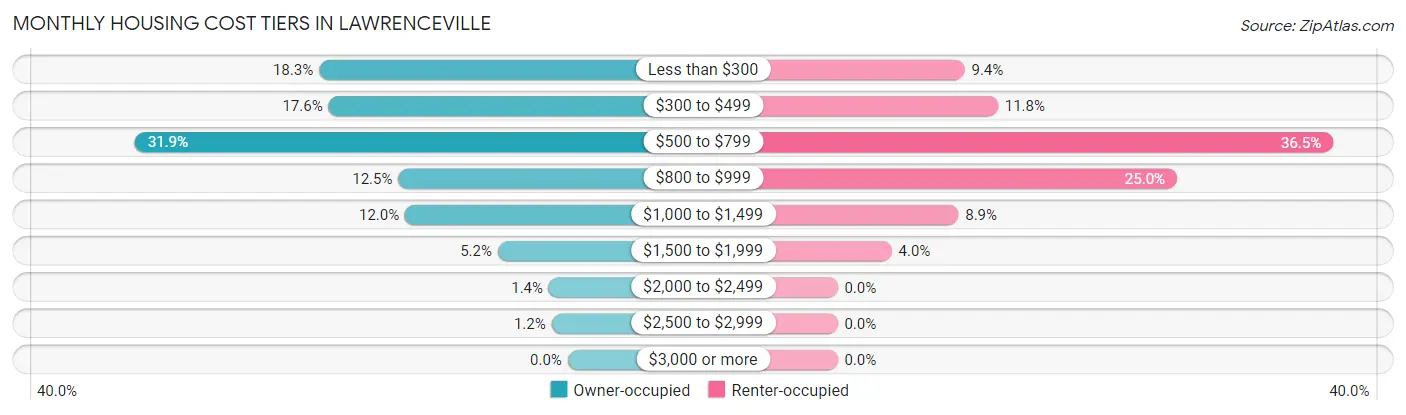
| Monthly Cost | Owner-occupied | Renter-occupied |
| Less than $300 | 185 (18.3%) | 61 (9.4%) |
| $300 to $499 | 178 (17.6%) | 77 (11.8%) |
| $500 to $799 | 322 (31.9%) | 238 (36.5%) |
| $800 to $999 | 126 (12.5%) | 163 (25.0%) |
| $1,000 to $1,499 | 121 (12.0%) | 58 (8.9%) |
| $1,500 to $1,999 | 52 (5.1%) | 26 (4.0%) |
| $2,000 to $2,499 | 14 (1.4%) | 0 (0.0%) |
| $2,500 to $2,999 | 12 (1.2%) | 0 (0.0%) |
| $3,000 or more | 0 (0.0%) | 0 (0.0%) |
| Total | 1,010 (100.0%) | 652 (100.0%) |
Physical Housing Characteristics in Lawrenceville
Housing Structures in Lawrenceville
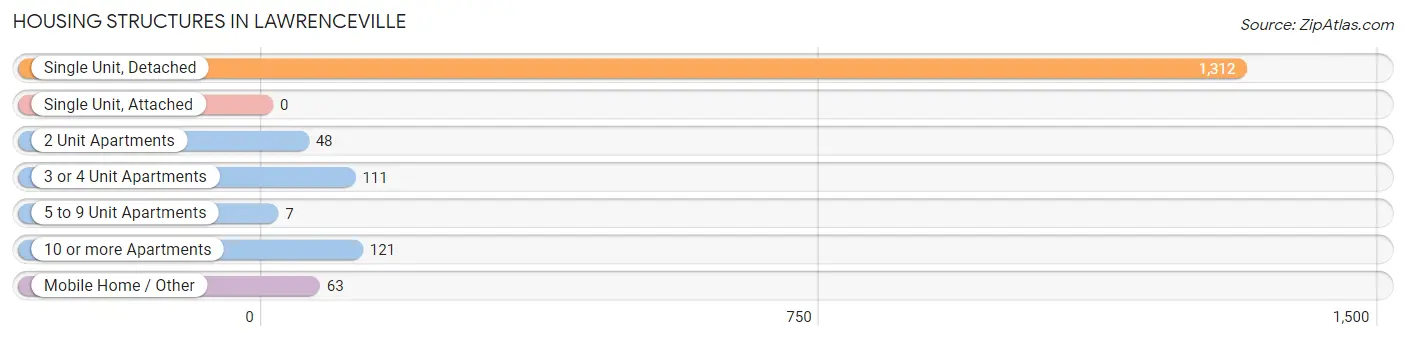
| Structure Type | # Housing Units | % Housing Units |
| Single Unit, Detached | 1,312 | 78.9% |
| Single Unit, Attached | 0 | 0.0% |
| 2 Unit Apartments | 48 | 2.9% |
| 3 or 4 Unit Apartments | 111 | 6.7% |
| 5 to 9 Unit Apartments | 7 | 0.4% |
| 10 or more Apartments | 121 | 7.3% |
| Mobile Home / Other | 63 | 3.8% |
| Total | 1,662 | 100.0% |
Housing Structures by Occupancy in Lawrenceville
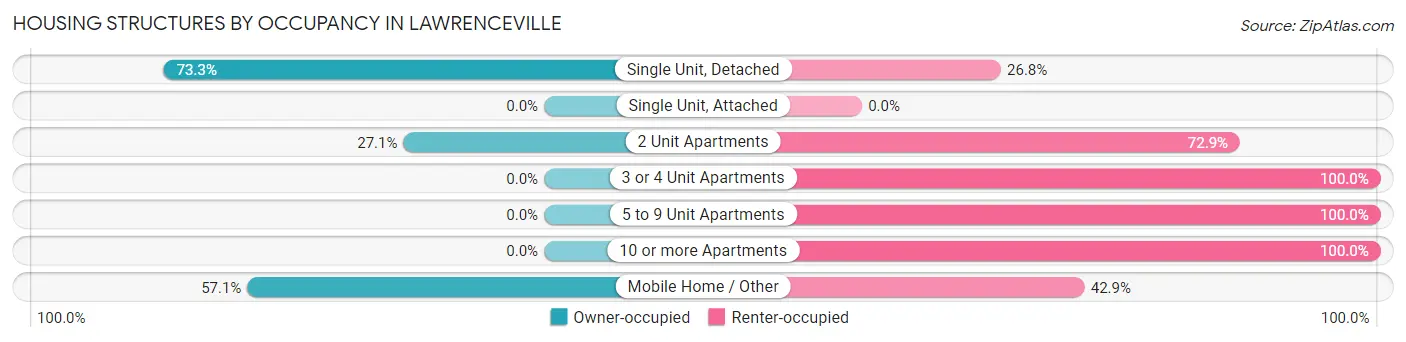
| Structure Type | Owner-occupied | Renter-occupied |
| Single Unit, Detached | 961 (73.3%) | 351 (26.8%) |
| Single Unit, Attached | 0 (0.0%) | 0 (0.0%) |
| 2 Unit Apartments | 13 (27.1%) | 35 (72.9%) |
| 3 or 4 Unit Apartments | 0 (0.0%) | 111 (100.0%) |
| 5 to 9 Unit Apartments | 0 (0.0%) | 7 (100.0%) |
| 10 or more Apartments | 0 (0.0%) | 121 (100.0%) |
| Mobile Home / Other | 36 (57.1%) | 27 (42.9%) |
| Total | 1,010 (60.8%) | 652 (39.2%) |
Housing Structures by Number of Rooms in Lawrenceville
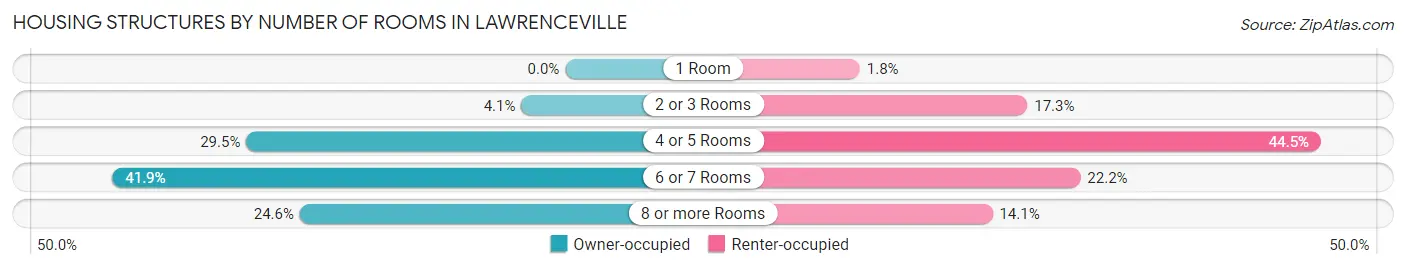
| Number of Rooms | Owner-occupied | Renter-occupied |
| 1 Room | 0 (0.0%) | 12 (1.8%) |
| 2 or 3 Rooms | 41 (4.1%) | 113 (17.3%) |
| 4 or 5 Rooms | 298 (29.5%) | 290 (44.5%) |
| 6 or 7 Rooms | 423 (41.9%) | 145 (22.2%) |
| 8 or more Rooms | 248 (24.5%) | 92 (14.1%) |
| Total | 1,010 (100.0%) | 652 (100.0%) |
Housing Structure by Heating Type in Lawrenceville
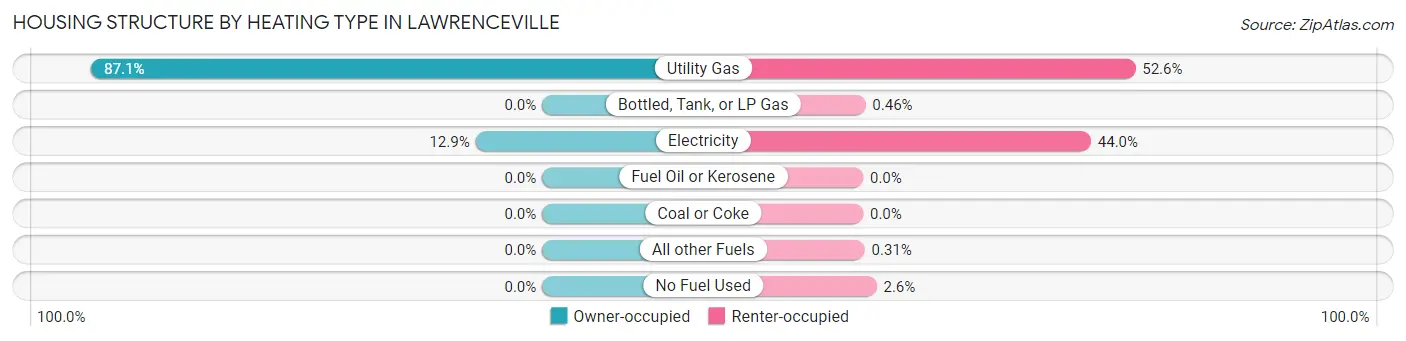
| Heating Type | Owner-occupied | Renter-occupied |
| Utility Gas | 880 (87.1%) | 343 (52.6%) |
| Bottled, Tank, or LP Gas | 0 (0.0%) | 3 (0.5%) |
| Electricity | 130 (12.9%) | 287 (44.0%) |
| Fuel Oil or Kerosene | 0 (0.0%) | 0 (0.0%) |
| Coal or Coke | 0 (0.0%) | 0 (0.0%) |
| All other Fuels | 0 (0.0%) | 2 (0.3%) |
| No Fuel Used | 0 (0.0%) | 17 (2.6%) |
| Total | 1,010 (100.0%) | 652 (100.0%) |
Household Vehicle Usage in Lawrenceville
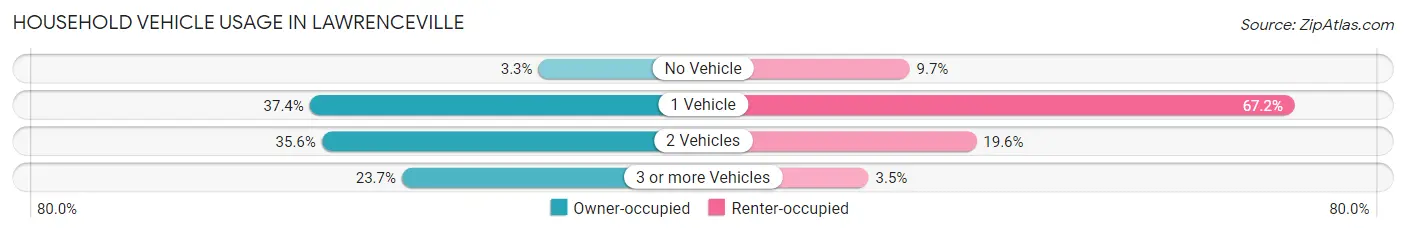
| Vehicles per Household | Owner-occupied | Renter-occupied |
| No Vehicle | 33 (3.3%) | 63 (9.7%) |
| 1 Vehicle | 378 (37.4%) | 438 (67.2%) |
| 2 Vehicles | 360 (35.6%) | 128 (19.6%) |
| 3 or more Vehicles | 239 (23.7%) | 23 (3.5%) |
| Total | 1,010 (100.0%) | 652 (100.0%) |
Real Estate & Mortgages in Lawrenceville
Real Estate and Mortgage Overview in Lawrenceville
| Characteristic | Without Mortgage | With Mortgage |
| Housing Units | 524 | 486 |
| Median Property Value | $87,100 | $92,600 |
| Median Household Income | $41,600 | $51 |
| Monthly Housing Costs | $382 | $0 |
| Real Estate Taxes | $1,243 | $82 |
Property Value by Mortgage Status in Lawrenceville
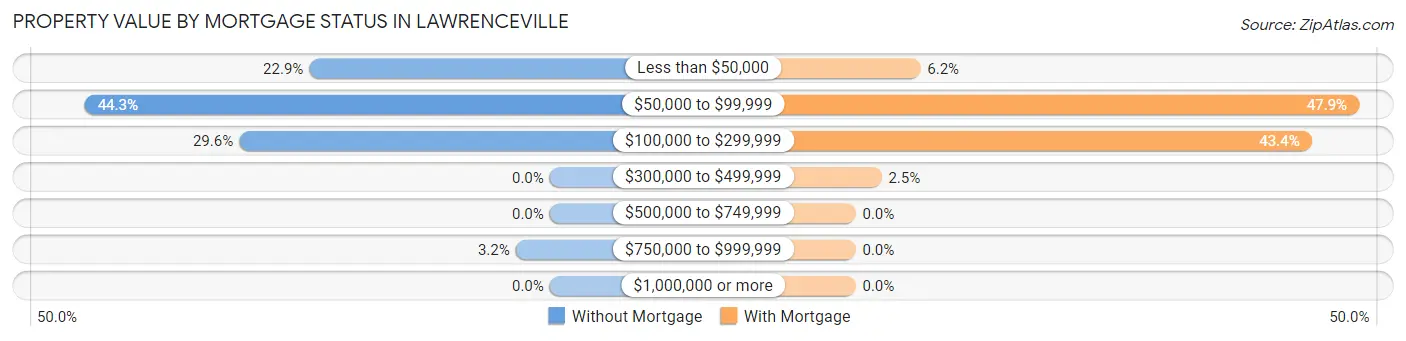
| Property Value | Without Mortgage | With Mortgage |
| Less than $50,000 | 120 (22.9%) | 30 (6.2%) |
| $50,000 to $99,999 | 232 (44.3%) | 233 (47.9%) |
| $100,000 to $299,999 | 155 (29.6%) | 211 (43.4%) |
| $300,000 to $499,999 | 0 (0.0%) | 12 (2.5%) |
| $500,000 to $749,999 | 0 (0.0%) | 0 (0.0%) |
| $750,000 to $999,999 | 17 (3.2%) | 0 (0.0%) |
| $1,000,000 or more | 0 (0.0%) | 0 (0.0%) |
| Total | 524 (100.0%) | 486 (100.0%) |
Household Income by Mortgage Status in Lawrenceville
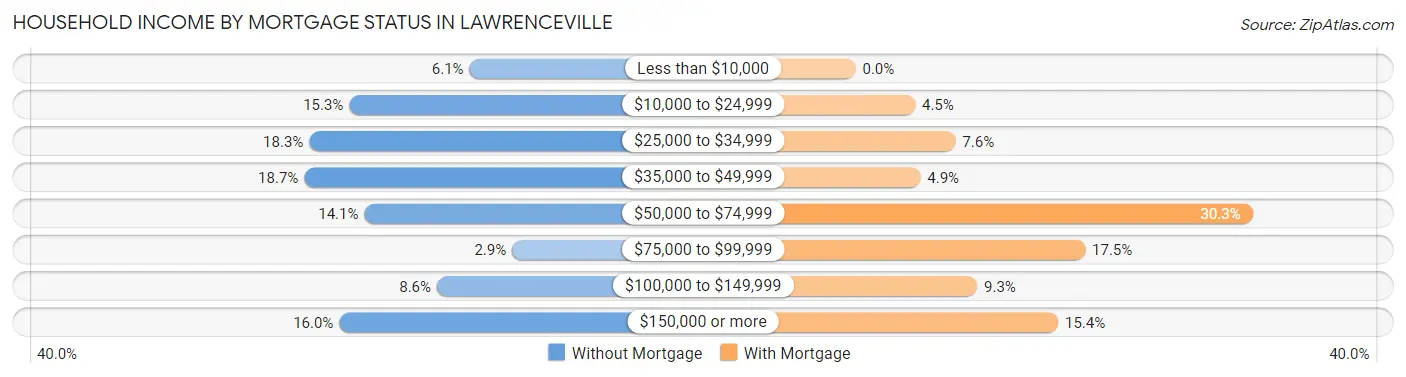
| Household Income | Without Mortgage | With Mortgage |
| Less than $10,000 | 32 (6.1%) | 0 (0.0%) |
| $10,000 to $24,999 | 80 (15.3%) | 22 (4.5%) |
| $25,000 to $34,999 | 96 (18.3%) | 37 (7.6%) |
| $35,000 to $49,999 | 98 (18.7%) | 24 (4.9%) |
| $50,000 to $74,999 | 74 (14.1%) | 147 (30.2%) |
| $75,000 to $99,999 | 15 (2.9%) | 85 (17.5%) |
| $100,000 to $149,999 | 45 (8.6%) | 45 (9.3%) |
| $150,000 or more | 84 (16.0%) | 75 (15.4%) |
| Total | 524 (100.0%) | 486 (100.0%) |
Property Value to Household Income Ratio in Lawrenceville
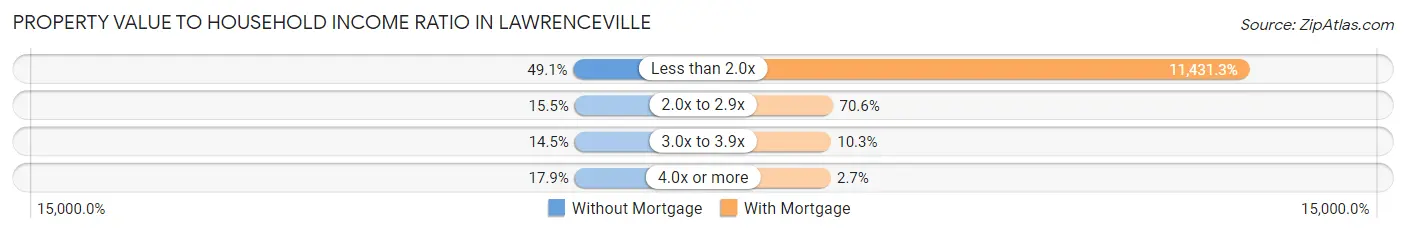
| Value-to-Income Ratio | Without Mortgage | With Mortgage |
| Less than 2.0x | 257 (49.0%) | 55,556 (11,431.3%) |
| 2.0x to 2.9x | 81 (15.5%) | 343 (70.6%) |
| 3.0x to 3.9x | 76 (14.5%) | 50 (10.3%) |
| 4.0x or more | 94 (17.9%) | 13 (2.7%) |
| Total | 524 (100.0%) | 486 (100.0%) |
Real Estate Taxes by Mortgage Status in Lawrenceville
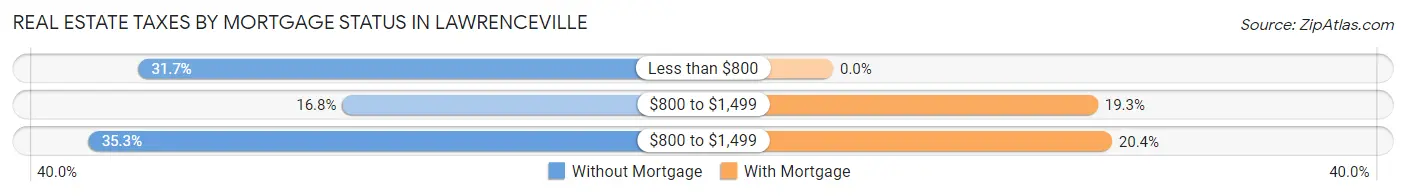
| Property Taxes | Without Mortgage | With Mortgage |
| Less than $800 | 166 (31.7%) | 0 (0.0%) |
| $800 to $1,499 | 88 (16.8%) | 94 (19.3%) |
| $800 to $1,499 | 185 (35.3%) | 99 (20.4%) |
| Total | 524 (100.0%) | 486 (100.0%) |
Health & Disability in Lawrenceville
Health Insurance Coverage by Age in Lawrenceville
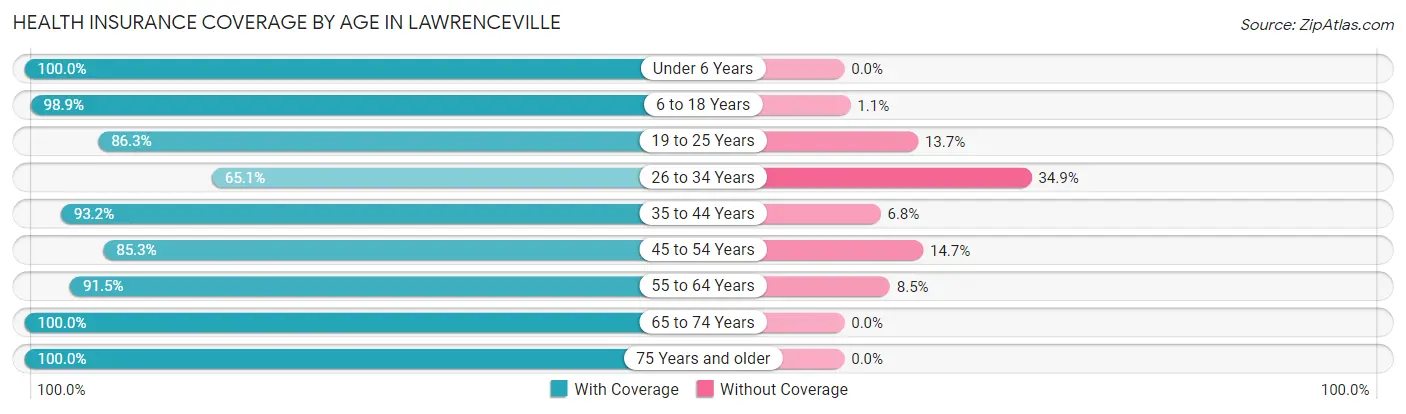
| Age Bracket | With Coverage | Without Coverage |
| Under 6 Years | 312 (100.0%) | 0 (0.0%) |
| 6 to 18 Years | 605 (98.9%) | 7 (1.1%) |
| 19 to 25 Years | 295 (86.3%) | 47 (13.7%) |
| 26 to 34 Years | 453 (65.1%) | 243 (34.9%) |
| 35 to 44 Years | 538 (93.2%) | 39 (6.8%) |
| 45 to 54 Years | 337 (85.3%) | 58 (14.7%) |
| 55 to 64 Years | 377 (91.5%) | 35 (8.5%) |
| 65 to 74 Years | 408 (100.0%) | 0 (0.0%) |
| 75 Years and older | 350 (100.0%) | 0 (0.0%) |
| Total | 3,675 (89.5%) | 429 (10.4%) |
Health Insurance Coverage by Citizenship Status in Lawrenceville
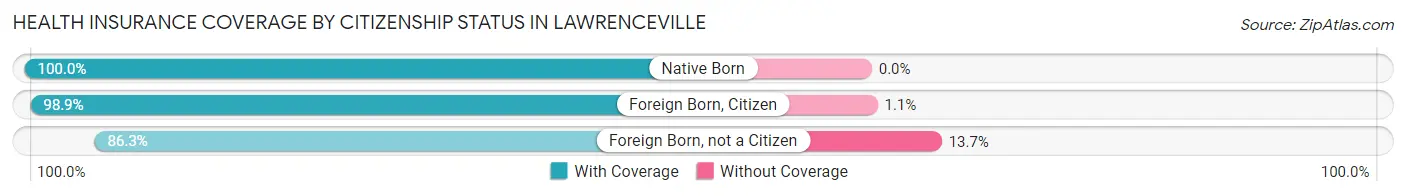
| Citizenship Status | With Coverage | Without Coverage |
| Native Born | 312 (100.0%) | 0 (0.0%) |
| Foreign Born, Citizen | 605 (98.9%) | 7 (1.1%) |
| Foreign Born, not a Citizen | 295 (86.3%) | 47 (13.7%) |
Health Insurance Coverage by Household Income in Lawrenceville
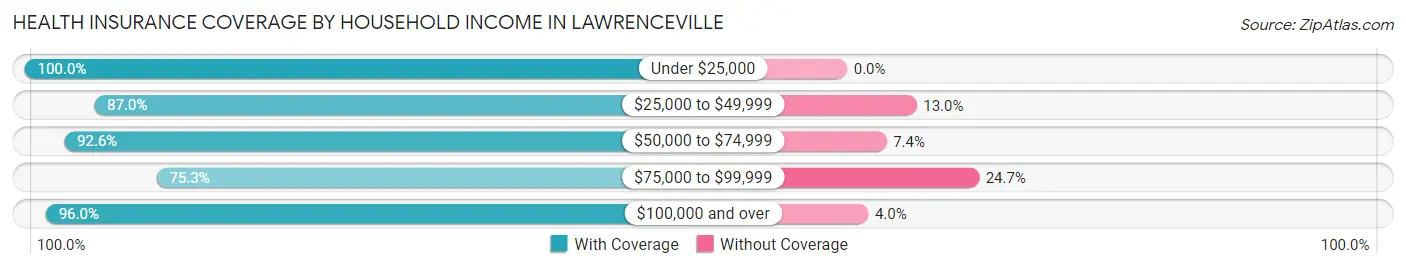
| Household Income | With Coverage | Without Coverage |
| Under $25,000 | 480 (100.0%) | 0 (0.0%) |
| $25,000 to $49,999 | 1,329 (87.0%) | 199 (13.0%) |
| $50,000 to $74,999 | 615 (92.6%) | 49 (7.4%) |
| $75,000 to $99,999 | 451 (75.3%) | 148 (24.7%) |
| $100,000 and over | 800 (96.0%) | 33 (4.0%) |
Public vs Private Health Insurance Coverage by Age in Lawrenceville
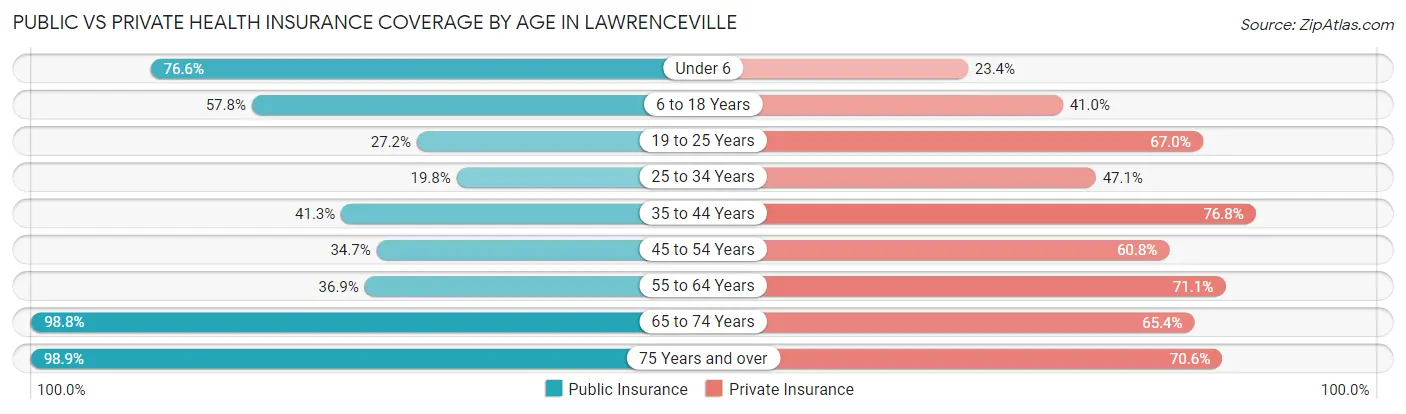
| Age Bracket | Public Insurance | Private Insurance |
| Under 6 | 239 (76.6%) | 73 (23.4%) |
| 6 to 18 Years | 354 (57.8%) | 251 (41.0%) |
| 19 to 25 Years | 93 (27.2%) | 229 (67.0%) |
| 25 to 34 Years | 138 (19.8%) | 328 (47.1%) |
| 35 to 44 Years | 238 (41.2%) | 443 (76.8%) |
| 45 to 54 Years | 137 (34.7%) | 240 (60.8%) |
| 55 to 64 Years | 152 (36.9%) | 293 (71.1%) |
| 65 to 74 Years | 403 (98.8%) | 267 (65.4%) |
| 75 Years and over | 346 (98.9%) | 247 (70.6%) |
| Total | 2,100 (51.2%) | 2,371 (57.8%) |
Disability Status by Sex by Age in Lawrenceville
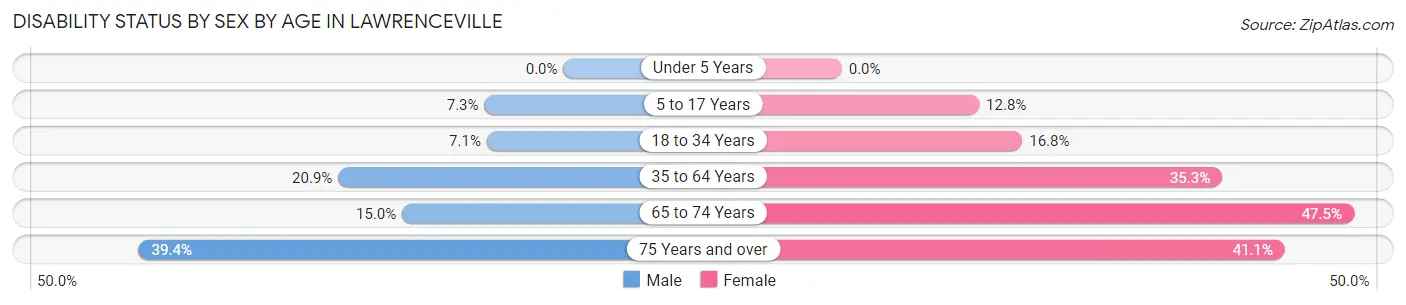
| Age Bracket | Male | Female |
| Under 5 Years | 0 (0.0%) | 0 (0.0%) |
| 5 to 17 Years | 22 (7.3%) | 38 (12.8%) |
| 18 to 34 Years | 50 (7.1%) | 65 (16.8%) |
| 35 to 64 Years | 153 (20.9%) | 230 (35.3%) |
| 65 to 74 Years | 28 (15.0%) | 105 (47.5%) |
| 75 Years and over | 67 (39.4%) | 74 (41.1%) |
Disability Class by Sex by Age in Lawrenceville
Disability Class: Hearing Difficulty
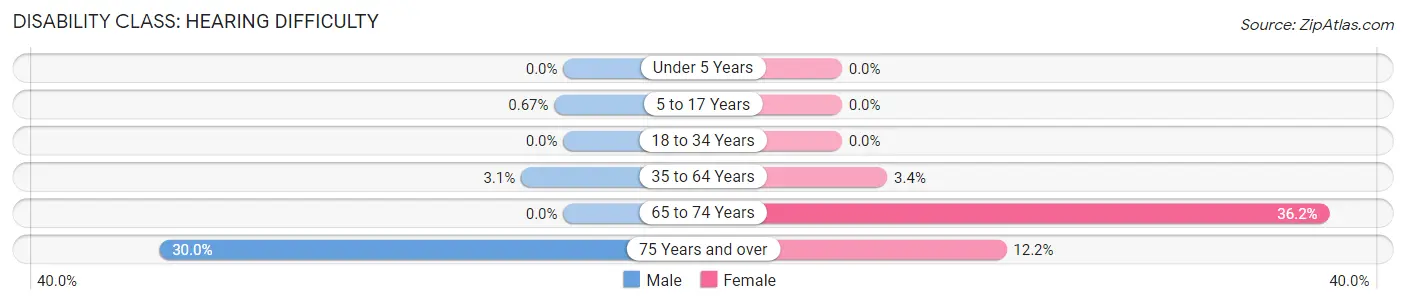
| Age Bracket | Male | Female |
| Under 5 Years | 0 (0.0%) | 0 (0.0%) |
| 5 to 17 Years | 2 (0.7%) | 0 (0.0%) |
| 18 to 34 Years | 0 (0.0%) | 0 (0.0%) |
| 35 to 64 Years | 23 (3.1%) | 22 (3.4%) |
| 65 to 74 Years | 0 (0.0%) | 80 (36.2%) |
| 75 Years and over | 51 (30.0%) | 22 (12.2%) |
Disability Class: Vision Difficulty
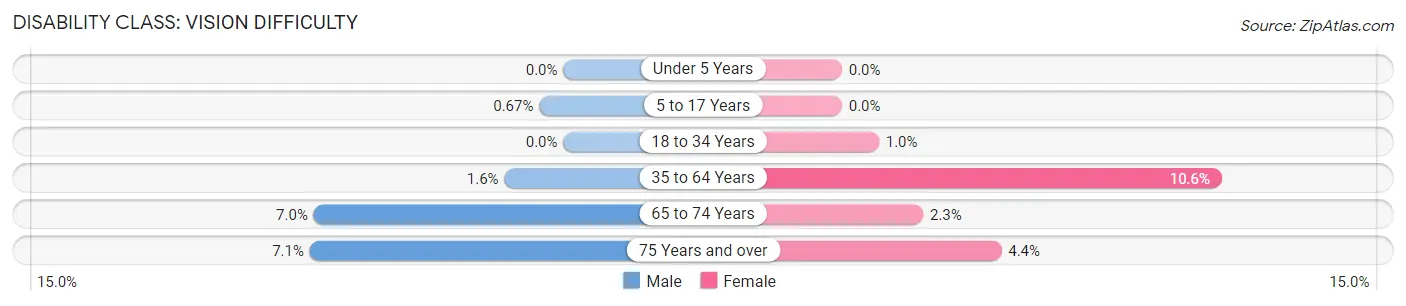
| Age Bracket | Male | Female |
| Under 5 Years | 0 (0.0%) | 0 (0.0%) |
| 5 to 17 Years | 2 (0.7%) | 0 (0.0%) |
| 18 to 34 Years | 0 (0.0%) | 4 (1.0%) |
| 35 to 64 Years | 12 (1.6%) | 69 (10.6%) |
| 65 to 74 Years | 13 (7.0%) | 5 (2.3%) |
| 75 Years and over | 12 (7.1%) | 8 (4.4%) |
Disability Class: Cognitive Difficulty
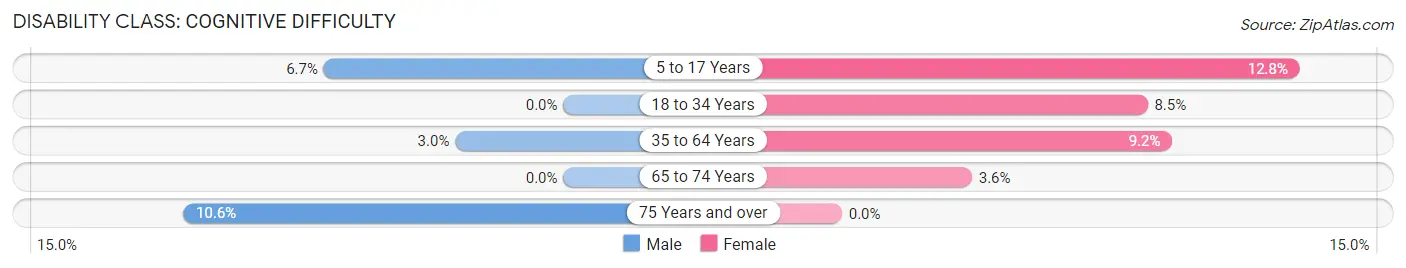
| Age Bracket | Male | Female |
| 5 to 17 Years | 20 (6.7%) | 38 (12.8%) |
| 18 to 34 Years | 0 (0.0%) | 33 (8.5%) |
| 35 to 64 Years | 22 (3.0%) | 60 (9.2%) |
| 65 to 74 Years | 0 (0.0%) | 8 (3.6%) |
| 75 Years and over | 18 (10.6%) | 0 (0.0%) |
Disability Class: Ambulatory Difficulty
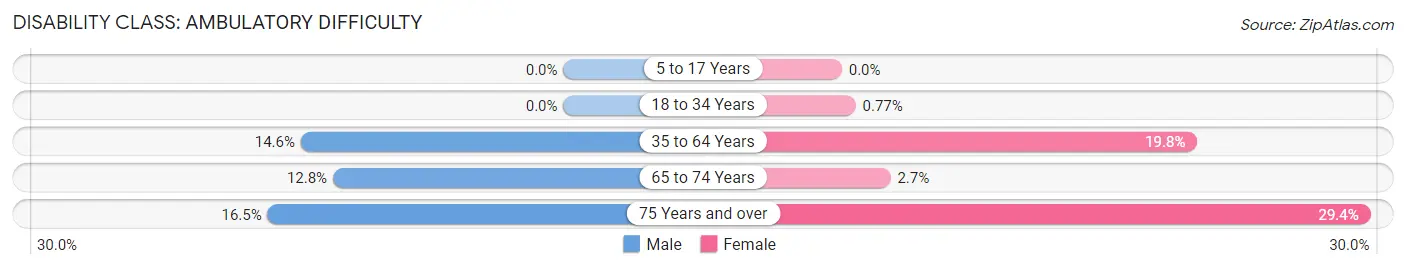
| Age Bracket | Male | Female |
| 5 to 17 Years | 0 (0.0%) | 0 (0.0%) |
| 18 to 34 Years | 0 (0.0%) | 3 (0.8%) |
| 35 to 64 Years | 107 (14.6%) | 129 (19.8%) |
| 65 to 74 Years | 24 (12.8%) | 6 (2.7%) |
| 75 Years and over | 28 (16.5%) | 53 (29.4%) |
Disability Class: Self-Care Difficulty
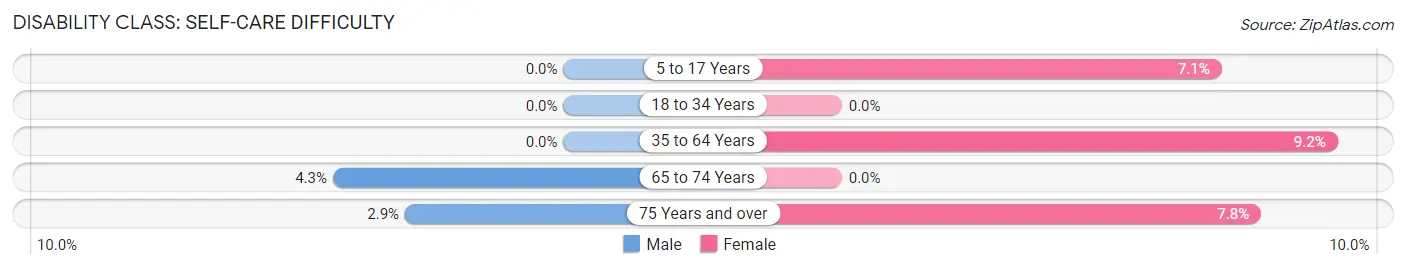
| Age Bracket | Male | Female |
| 5 to 17 Years | 0 (0.0%) | 21 (7.0%) |
| 18 to 34 Years | 0 (0.0%) | 0 (0.0%) |
| 35 to 64 Years | 0 (0.0%) | 60 (9.2%) |
| 65 to 74 Years | 8 (4.3%) | 0 (0.0%) |
| 75 Years and over | 5 (2.9%) | 14 (7.8%) |
Technology Access in Lawrenceville
Computing Device Access in Lawrenceville
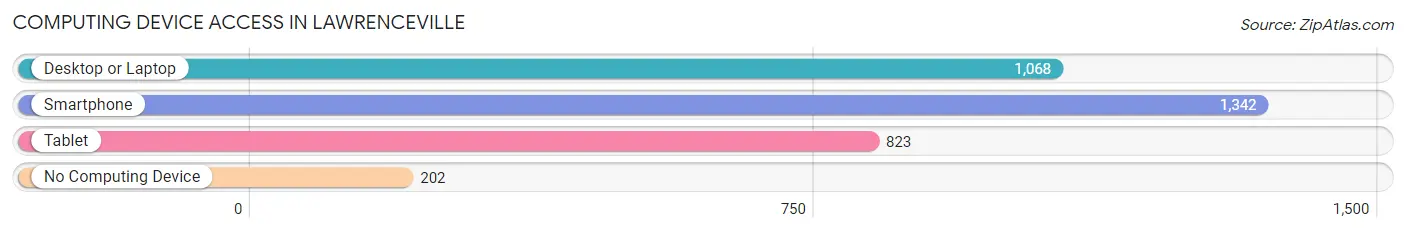
| Device Type | # Households | % Households |
| Desktop or Laptop | 1,068 | 64.3% |
| Smartphone | 1,342 | 80.7% |
| Tablet | 823 | 49.5% |
| No Computing Device | 202 | 12.1% |
| Total | 1,662 | 100.0% |
Internet Access in Lawrenceville
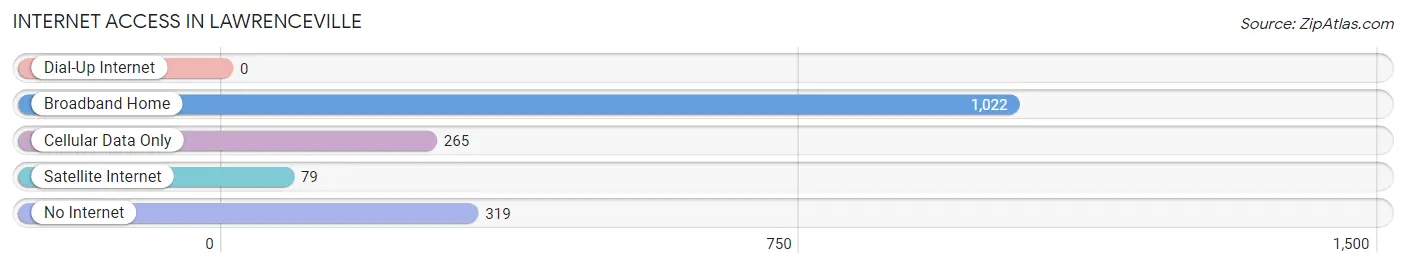
| Internet Type | # Households | % Households |
| Dial-Up Internet | 0 | 0.0% |
| Broadband Home | 1,022 | 61.5% |
| Cellular Data Only | 265 | 15.9% |
| Satellite Internet | 79 | 4.8% |
| No Internet | 319 | 19.2% |
| Total | 1,662 | 100.0% |
Lawrenceville Summary
Lawrenceville is a city located in Lawrence County, Illinois, United States. The population was 5,717 at the 2010 census. It is the county seat of Lawrence County. Lawrenceville is located in the southeastern part of the state, near the Wabash River.
History
Lawrenceville was founded in 1817 by William Lawrence, a Revolutionary War veteran. The city was named after him. Lawrenceville was incorporated in 1847.
In the early 19th century, Lawrenceville was a major stop on the Underground Railroad. It was a safe haven for escaped slaves.
Geography
Lawrenceville is located at 38°41'25"N 87°41'25"W (38.690278, -87.690278). According to the 2010 census, Lawrenceville has a total area of 4.2 square miles (10.8 km2), all land.
The city is located in the Wabash Valley, which is part of the larger Illinois Basin. The Wabash River forms the western boundary of the city.
Economy
Lawrenceville's economy is largely based on agriculture and manufacturing. The city is home to several large manufacturing companies, including Lawrenceville Manufacturing, Lawrenceville Plastics, and Lawrenceville Steel.
Agriculture is also an important part of the local economy. The city is home to several large farms, including the Lawrenceville Dairy Farm and the Lawrenceville Grain Farm.
Demographics
As of the 2010 census, there were 5,717 people, 2,310 households, and 1,541 families residing in the city. The population density was 1,364.2 people per square mile (528.2/km2). There were 2,541 housing units at an average density of 602.2 per square mile (232.7/km2). The racial makeup of the city was 97.2% White, 0.7% African American, 0.2% Native American, 0.3% Asian, 0.2% from other races, and 1.4% from two or more races. Hispanic or Latino of any race were 1.2% of the population.
There were 2,310 households, out of which 30.2% had children under the age of 18 living with them, 49.2% were married couples living together, 12.3% had a female householder with no husband present, and 33.7% were non-families. 29.3% of all households were made up of individuals, and 14.2% had someone living alone who was 65 years of age or older. The average household size was 2.41 and the average family size was 2.94.
In the city, the population was spread out, with 24.2% under the age of 18, 8.2% from 18 to 24, 27.2% from 25 to 44, 22.7% from 45 to 64, and 17.7% who were 65 years of age or older. The median age was 38 years. For every 100 females, there were 91.2 males. For every 100 females age 18 and over, there were 87.2 males.
The median income for a household in the city was $32,813, and the median income for a family was $40,000. Males had a median income of $30,917 versus $21,250 for females. The per capita income for the city was $17,845. About 10.2% of families and 13.2% of the population were below the poverty line, including 17.2% of those under age 18 and 10.2% of those age 65 or over.
Common Questions
What is Per Capita Income in Lawrenceville?
Per Capita income in Lawrenceville is $24,968.
What is the Median Family Income in Lawrenceville?
Median Family Income in Lawrenceville is $50,000.
What is the Median Household income in Lawrenceville?
Median Household Income in Lawrenceville is $42,213.
What is Income or Wage Gap in Lawrenceville?
Income or Wage Gap in Lawrenceville is 29.8%.
Women in Lawrenceville earn 70.2 cents for every dollar earned by a man.
What is Inequality or Gini Index in Lawrenceville?
Inequality or Gini Index in Lawrenceville is 0.43.
What is the Total Population of Lawrenceville?
Total Population of Lawrenceville is 4,210.
What is the Total Male Population of Lawrenceville?
Total Male Population of Lawrenceville is 2,230.
What is the Total Female Population of Lawrenceville?
Total Female Population of Lawrenceville is 1,980.
What is the Ratio of Males per 100 Females in Lawrenceville?
There are 112.63 Males per 100 Females in Lawrenceville.
What is the Ratio of Females per 100 Males in Lawrenceville?
There are 88.79 Females per 100 Males in Lawrenceville.
What is the Median Population Age in Lawrenceville?
Median Population Age in Lawrenceville is 37.5 Years.
What is the Average Family Size in Lawrenceville
Average Family Size in Lawrenceville is 3.4 People.
What is the Average Household Size in Lawrenceville
Average Household Size in Lawrenceville is 2.5 People.
How Large is the Labor Force in Lawrenceville?
There are 1,759 People in the Labor Forcein in Lawrenceville.
What is the Percentage of People in the Labor Force in Lawrenceville?
50.9% of People are in the Labor Force in Lawrenceville.
What is the Unemployment Rate in Lawrenceville?
Unemployment Rate in Lawrenceville is 6.9%.