Hoopeston, IL Map & Demographics
Hoopeston Map
Hoopeston Overview
$24,747
PER CAPITA INCOME
$58,797
AVG FAMILY INCOME
$46,973
AVG HOUSEHOLD INCOME
46.4%
WAGE / INCOME GAP [ % ]
53.6¢/ $1
WAGE / INCOME GAP [ $ ]
0.38
INEQUALITY / GINI INDEX
4,940
TOTAL POPULATION
2,434
MALE POPULATION
2,506
FEMALE POPULATION
97.13
MALES / 100 FEMALES
102.96
FEMALES / 100 MALES
44.5
MEDIAN AGE
3.1
AVG FAMILY SIZE
2.3
AVG HOUSEHOLD SIZE
2,253
LABOR FORCE [ PEOPLE ]
54.6%
PERCENT IN LABOR FORCE
11.3%
UNEMPLOYMENT RATE
Hoopeston Zip Codes
Hoopeston Area Codes
Income in Hoopeston
Income Overview in Hoopeston
Per Capita Income in Hoopeston is $24,747, while median incomes of families and households are $58,797 and $46,973 respectively.
| Characteristic | Number | Measure |
| Per Capita Income | 4,940 | $24,747 |
| Median Family Income | 1,149 | $58,797 |
| Mean Family Income | 1,149 | $69,152 |
| Median Household Income | 2,099 | $46,973 |
| Mean Household Income | 2,099 | $57,820 |
| Income Deficit | 1,149 | $0 |
| Wage / Income Gap (%) | 4,940 | 46.35% |
| Wage / Income Gap ($) | 4,940 | 53.65¢ per $1 |
| Gini / Inequality Index | 4,940 | 0.38 |
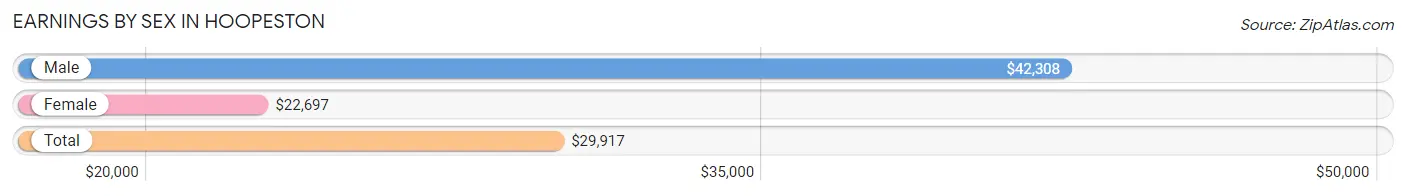
Earnings by Sex in Hoopeston
Average Earnings in Hoopeston are $29,917, $42,308 for men and $22,697 for women, a difference of 46.4%.
| Sex | Number | Average Earnings |
| Male | 1,292 (57.9%) | $42,308 |
| Female | 939 (42.1%) | $22,697 |
| Total | 2,231 (100.0%) | $29,917 |
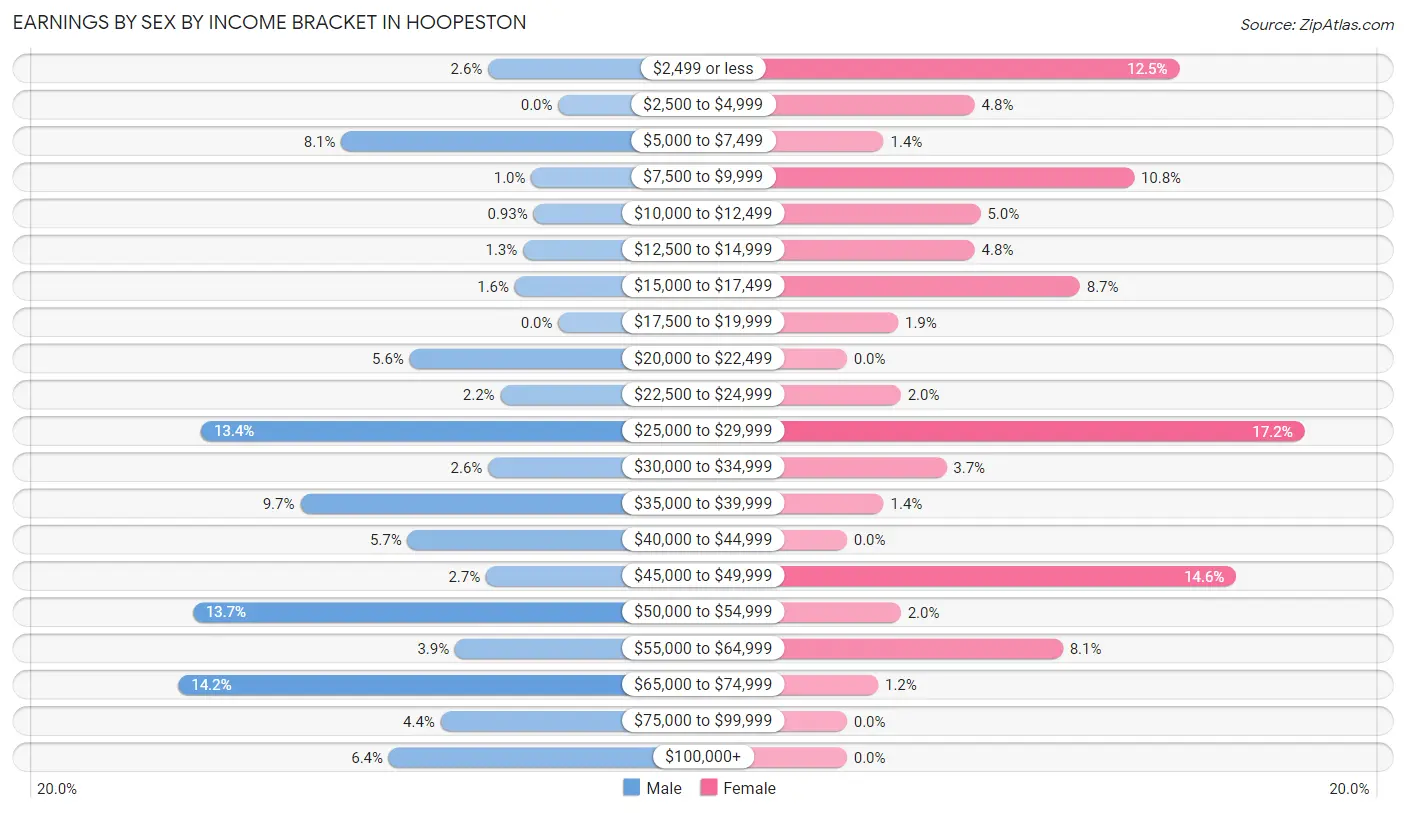
Earnings by Sex by Income Bracket in Hoopeston
The most common earnings brackets in Hoopeston are $65,000 to $74,999 for men (184 | 14.2%) and $25,000 to $29,999 for women (161 | 17.2%).
| Income | Male | Female |
| $2,499 or less | 34 (2.6%) | 117 (12.5%) |
| $2,500 to $4,999 | 0 (0.0%) | 45 (4.8%) |
| $5,000 to $7,499 | 105 (8.1%) | 13 (1.4%) |
| $7,500 to $9,999 | 13 (1.0%) | 101 (10.8%) |
| $10,000 to $12,499 | 12 (0.9%) | 47 (5.0%) |
| $12,500 to $14,999 | 17 (1.3%) | 45 (4.8%) |
| $15,000 to $17,499 | 21 (1.6%) | 82 (8.7%) |
| $17,500 to $19,999 | 0 (0.0%) | 18 (1.9%) |
| $20,000 to $22,499 | 72 (5.6%) | 0 (0.0%) |
| $22,500 to $24,999 | 28 (2.2%) | 19 (2.0%) |
| $25,000 to $29,999 | 173 (13.4%) | 161 (17.2%) |
| $30,000 to $34,999 | 34 (2.6%) | 35 (3.7%) |
| $35,000 to $39,999 | 125 (9.7%) | 13 (1.4%) |
| $40,000 to $44,999 | 73 (5.7%) | 0 (0.0%) |
| $45,000 to $49,999 | 35 (2.7%) | 137 (14.6%) |
| $50,000 to $54,999 | 177 (13.7%) | 19 (2.0%) |
| $55,000 to $64,999 | 50 (3.9%) | 76 (8.1%) |
| $65,000 to $74,999 | 184 (14.2%) | 11 (1.2%) |
| $75,000 to $99,999 | 57 (4.4%) | 0 (0.0%) |
| $100,000+ | 82 (6.4%) | 0 (0.0%) |
| Total | 1,292 (100.0%) | 939 (100.0%) |
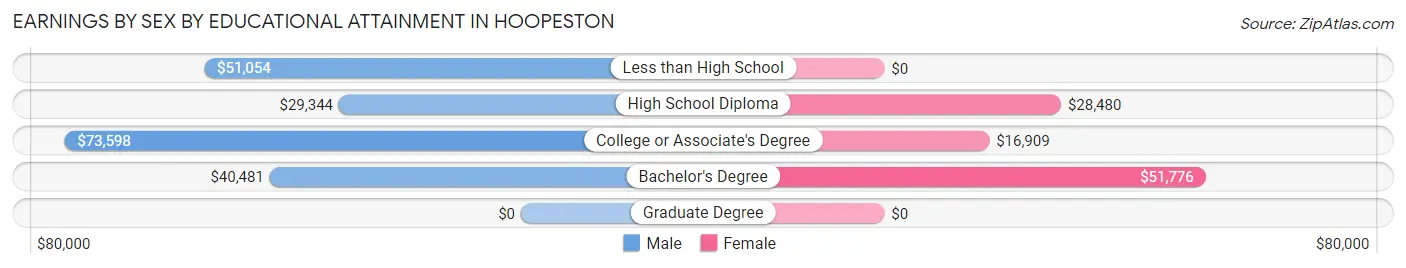
Earnings by Sex by Educational Attainment in Hoopeston
Average earnings in Hoopeston are $47,071 for men and $25,720 for women, a difference of 45.4%. Men with an educational attainment of college or associate's degree enjoy the highest average annual earnings of $73,598, while those with high school diploma education earn the least with $29,344. Women with an educational attainment of bachelor's degree earn the most with the average annual earnings of $51,776, while those with college or associate's degree education have the smallest earnings of $16,909.
| Educational Attainment | Male Income | Female Income |
| Less than High School | $51,054 | $0 |
| High School Diploma | $29,344 | $28,480 |
| College or Associate's Degree | $73,598 | $16,909 |
| Bachelor's Degree | $40,481 | $51,776 |
| Graduate Degree | - | - |
| Total | $47,071 | $25,720 |
Family Income in Hoopeston
Family Income Brackets in Hoopeston
According to the Hoopeston family income data, there are 294 families falling into the $35,000 to $49,999 income range, which is the most common income bracket and makes up 25.6% of all families.
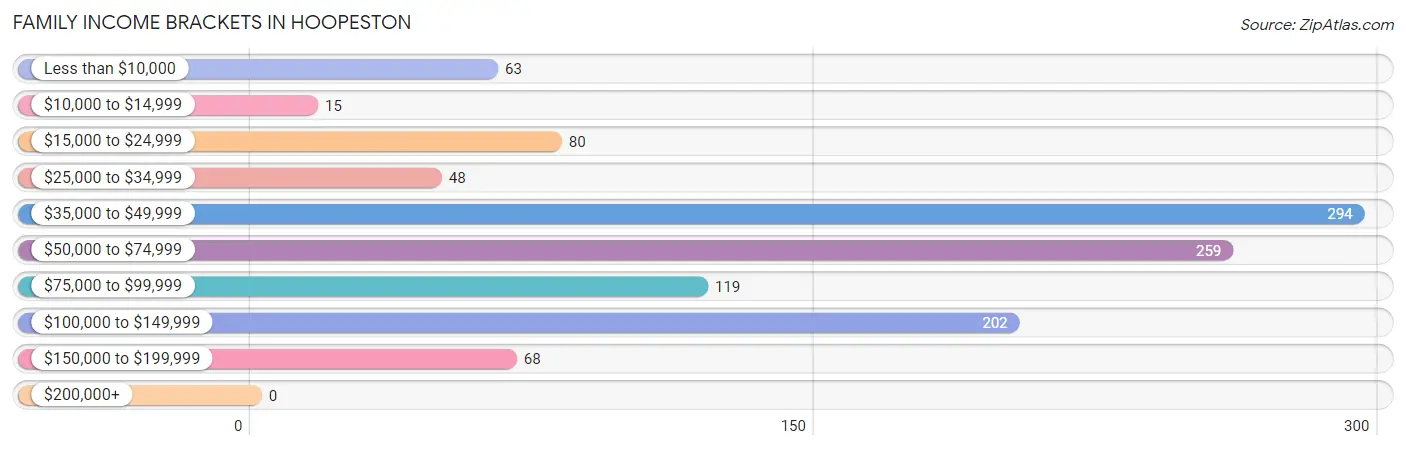
| Income Bracket | # Families | % Families |
| Less than $10,000 | 63 | 5.5% |
| $10,000 to $14,999 | 15 | 1.3% |
| $15,000 to $24,999 | 80 | 7.0% |
| $25,000 to $34,999 | 48 | 4.2% |
| $35,000 to $49,999 | 294 | 25.6% |
| $50,000 to $74,999 | 259 | 22.5% |
| $75,000 to $99,999 | 119 | 10.4% |
| $100,000 to $149,999 | 202 | 17.6% |
| $150,000 to $199,999 | 68 | 5.9% |
| $200,000+ | 0 | 0.0% |
Family Income by Famaliy Size in Hoopeston
3-person families (282 | 24.5%) account for the highest median family income in Hoopeston with $59,387 per family, while 2-person families (508 | 44.2%) have the highest median income of $25,666 per family member.
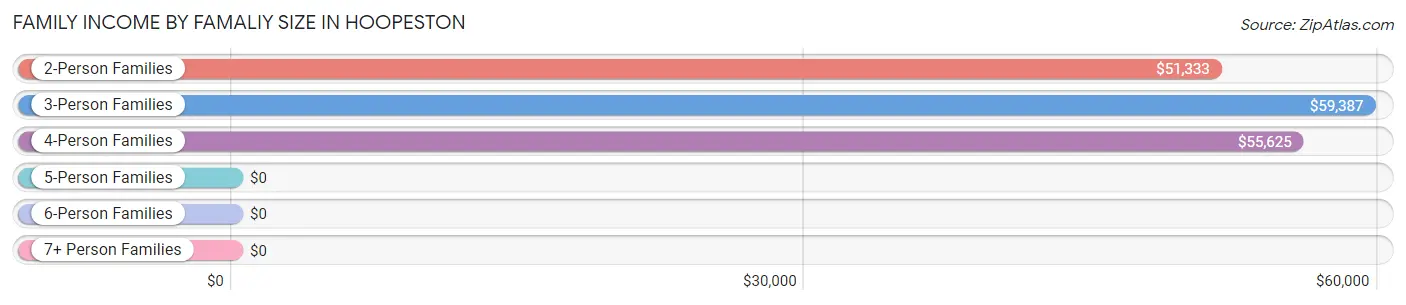
| Income Bracket | # Families | Median Income |
| 2-Person Families | 508 (44.2%) | $51,333 |
| 3-Person Families | 282 (24.5%) | $59,387 |
| 4-Person Families | 262 (22.8%) | $55,625 |
| 5-Person Families | 42 (3.7%) | $0 |
| 6-Person Families | 35 (3.0%) | $0 |
| 7+ Person Families | 20 (1.7%) | $0 |
| Total | 1,149 (100.0%) | $58,797 |
Family Income by Number of Earners in Hoopeston
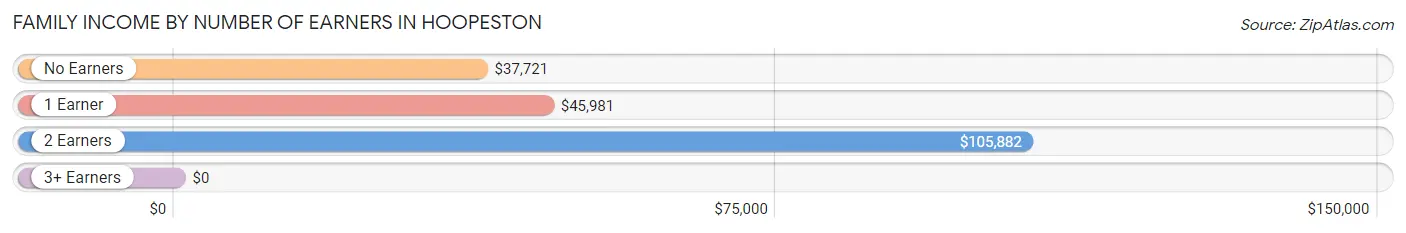
| Number of Earners | # Families | Median Income |
| No Earners | 154 (13.4%) | $37,721 |
| 1 Earner | 594 (51.7%) | $45,981 |
| 2 Earners | 362 (31.5%) | $105,882 |
| 3+ Earners | 39 (3.4%) | $0 |
| Total | 1,149 (100.0%) | $58,797 |
Household Income in Hoopeston
Household Income Brackets in Hoopeston
With 491 households falling in the category, the $50,000 to $74,999 income range is the most frequent in Hoopeston, accounting for 23.4% of all households.
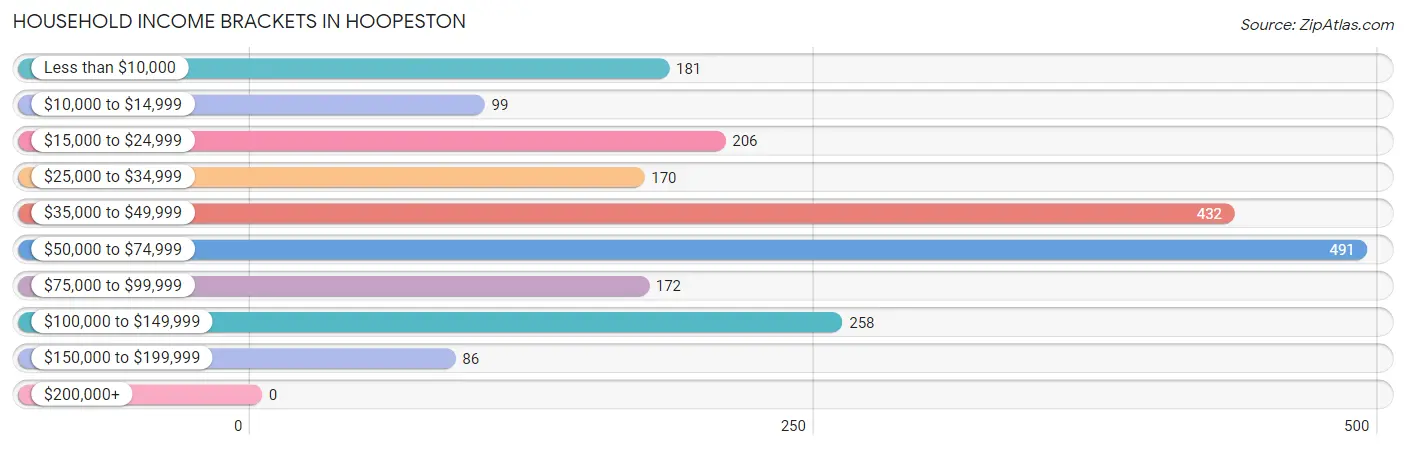
| Income Bracket | # Households | % Households |
| Less than $10,000 | 181 | 8.6% |
| $10,000 to $14,999 | 99 | 4.7% |
| $15,000 to $24,999 | 206 | 9.8% |
| $25,000 to $34,999 | 170 | 8.1% |
| $35,000 to $49,999 | 432 | 20.6% |
| $50,000 to $74,999 | 491 | 23.4% |
| $75,000 to $99,999 | 172 | 8.2% |
| $100,000 to $149,999 | 258 | 12.3% |
| $150,000 to $199,999 | 86 | 4.1% |
| $200,000+ | 0 | 0.0% |
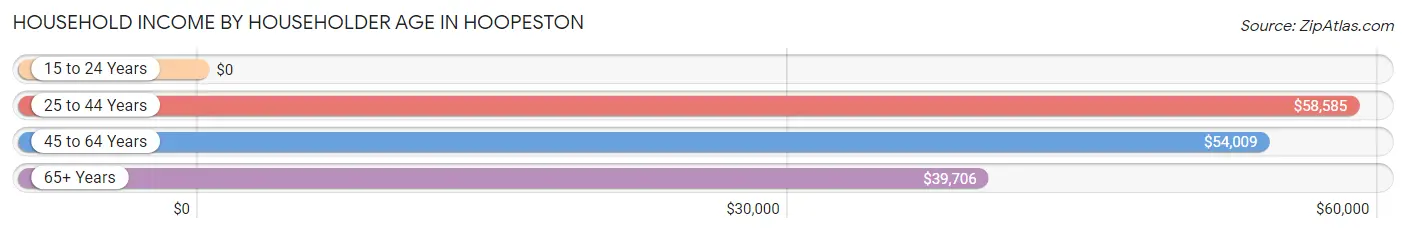
Household Income by Householder Age in Hoopeston
The median household income in Hoopeston is $46,973, with the highest median household income of $58,585 found in the 25 to 44 years age bracket for the primary householder. A total of 424 households (20.2%) fall into this category. Meanwhile, the 15 to 24 years age bracket for the primary householder has the lowest median household income of $0, with 168 households (8.0%) in this group.
| Income Bracket | # Households | Median Income |
| 15 to 24 Years | 168 (8.0%) | $0 |
| 25 to 44 Years | 424 (20.2%) | $58,585 |
| 45 to 64 Years | 801 (38.2%) | $54,009 |
| 65+ Years | 706 (33.6%) | $39,706 |
| Total | 2,099 (100.0%) | $46,973 |
Poverty in Hoopeston
Income Below Poverty by Sex and Age in Hoopeston
With 13.1% poverty level for males and 28.1% for females among the residents of Hoopeston, under 5 year old males and 5 year old females are the most vulnerable to poverty, with 35 males (60.3%) and 16 females (100.0%) in their respective age groups living below the poverty level.
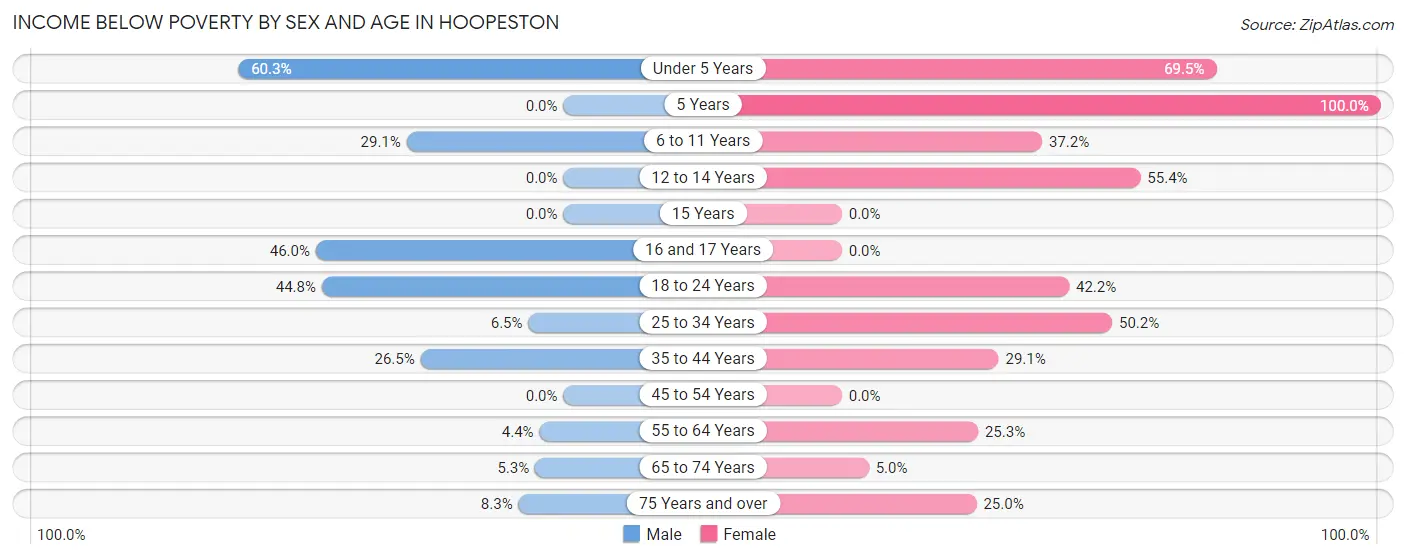
| Age Bracket | Male | Female |
| Under 5 Years | 35 (60.3%) | 98 (69.5%) |
| 5 Years | 0 (0.0%) | 16 (100.0%) |
| 6 to 11 Years | 32 (29.1%) | 84 (37.2%) |
| 12 to 14 Years | 0 (0.0%) | 51 (55.4%) |
| 15 Years | 0 (0.0%) | 0 (0.0%) |
| 16 and 17 Years | 17 (46.0%) | 0 (0.0%) |
| 18 to 24 Years | 100 (44.8%) | 89 (42.2%) |
| 25 to 34 Years | 24 (6.5%) | 160 (50.2%) |
| 35 to 44 Years | 66 (26.5%) | 48 (29.1%) |
| 45 to 54 Years | 0 (0.0%) | 0 (0.0%) |
| 55 to 64 Years | 11 (4.4%) | 91 (25.3%) |
| 65 to 74 Years | 18 (5.2%) | 13 (5.0%) |
| 75 Years and over | 11 (8.3%) | 47 (25.0%) |
| Total | 314 (13.1%) | 697 (28.1%) |
Income Above Poverty by Sex and Age in Hoopeston
According to the poverty statistics in Hoopeston, males aged 12 to 14 years and females aged 16 and 17 years are the age groups that are most secure financially, with 100.0% of males and 100.0% of females in these age groups living above the poverty line.
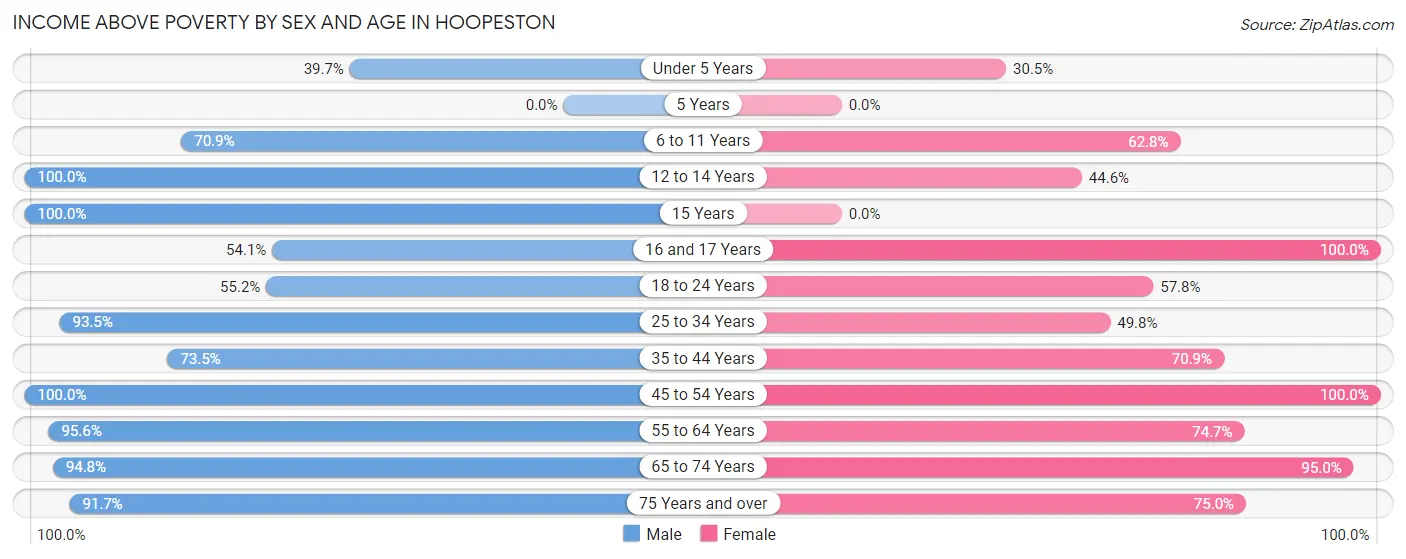
| Age Bracket | Male | Female |
| Under 5 Years | 23 (39.7%) | 43 (30.5%) |
| 5 Years | 0 (0.0%) | 0 (0.0%) |
| 6 to 11 Years | 78 (70.9%) | 142 (62.8%) |
| 12 to 14 Years | 151 (100.0%) | 41 (44.6%) |
| 15 Years | 19 (100.0%) | 0 (0.0%) |
| 16 and 17 Years | 20 (54.0%) | 127 (100.0%) |
| 18 to 24 Years | 123 (55.2%) | 122 (57.8%) |
| 25 to 34 Years | 346 (93.5%) | 159 (49.8%) |
| 35 to 44 Years | 183 (73.5%) | 117 (70.9%) |
| 45 to 54 Years | 453 (100.0%) | 379 (100.0%) |
| 55 to 64 Years | 237 (95.6%) | 269 (74.7%) |
| 65 to 74 Years | 325 (94.8%) | 247 (95.0%) |
| 75 Years and over | 121 (91.7%) | 141 (75.0%) |
| Total | 2,079 (86.9%) | 1,787 (71.9%) |
Income Below Poverty Among Married-Couple Families in Hoopeston
The poverty statistics for married-couple families in Hoopeston show that 8.2% or 76 of the total 933 families live below the poverty line. Families with 3 or 4 children have the highest poverty rate of 23.0%, comprising of 20 families. On the other hand, families with no children have the lowest poverty rate of 6.3%, which includes 37 families.
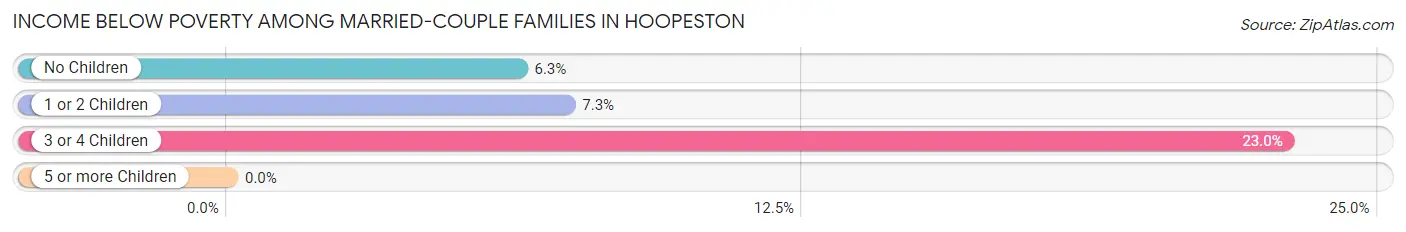
| Children | Above Poverty | Below Poverty |
| No Children | 550 (93.7%) | 37 (6.3%) |
| 1 or 2 Children | 240 (92.7%) | 19 (7.3%) |
| 3 or 4 Children | 67 (77.0%) | 20 (23.0%) |
| 5 or more Children | 0 (0.0%) | 0 (0.0%) |
| Total | 857 (91.8%) | 76 (8.2%) |
Income Below Poverty Among Single-Parent Households in Hoopeston
According to the poverty data in Hoopeston, 11.5% or 10 single-father households and 54.3% or 70 single-mother households are living below the poverty line. Among single-father households, those with 5 or more children have the highest poverty rate, with 10 households (100.0%) experiencing poverty. Likewise, among single-mother households, those with 1 or 2 children have the highest poverty rate, with 70 households (100.0%) falling below the poverty line.
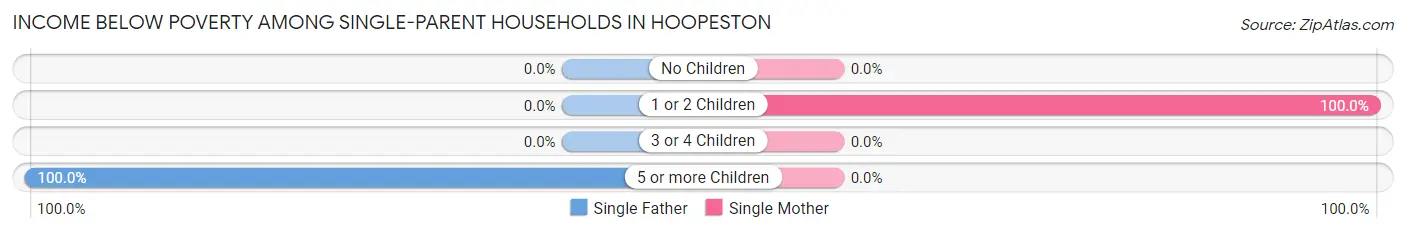
| Children | Single Father | Single Mother |
| No Children | 0 (0.0%) | 0 (0.0%) |
| 1 or 2 Children | 0 (0.0%) | 70 (100.0%) |
| 3 or 4 Children | 0 (0.0%) | 0 (0.0%) |
| 5 or more Children | 10 (100.0%) | 0 (0.0%) |
| Total | 10 (11.5%) | 70 (54.3%) |
Income Below Poverty Among Married-Couple vs Single-Parent Households in Hoopeston
The poverty data for Hoopeston shows that 76 of the married-couple family households (8.2%) and 80 of the single-parent households (37.0%) are living below the poverty level. Within the married-couple family households, those with 3 or 4 children have the highest poverty rate, with 20 households (23.0%) falling below the poverty line. Among the single-parent households, those with 5 or more children have the highest poverty rate, with 10 household (100.0%) living below poverty.
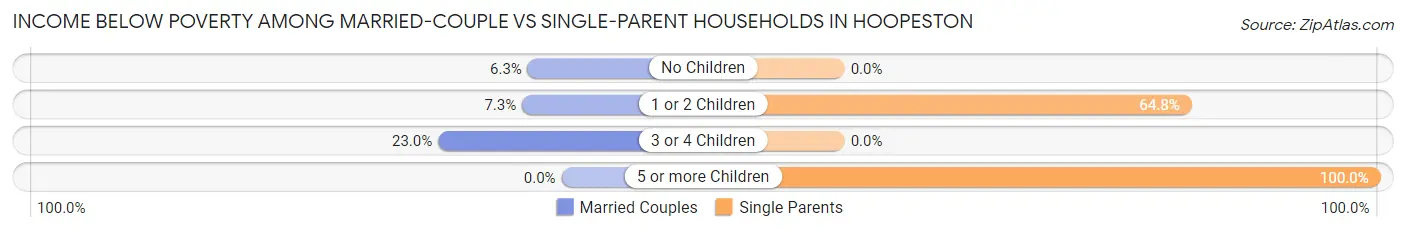
| Children | Married-Couple Families | Single-Parent Households |
| No Children | 37 (6.3%) | 0 (0.0%) |
| 1 or 2 Children | 19 (7.3%) | 70 (64.8%) |
| 3 or 4 Children | 20 (23.0%) | 0 (0.0%) |
| 5 or more Children | 0 (0.0%) | 10 (100.0%) |
| Total | 76 (8.2%) | 80 (37.0%) |
Race in Hoopeston
The most populous races in Hoopeston are White / Caucasian (4,370 | 88.5%), Hispanic or Latino (331 | 6.7%), and Two or more Races (236 | 4.8%).
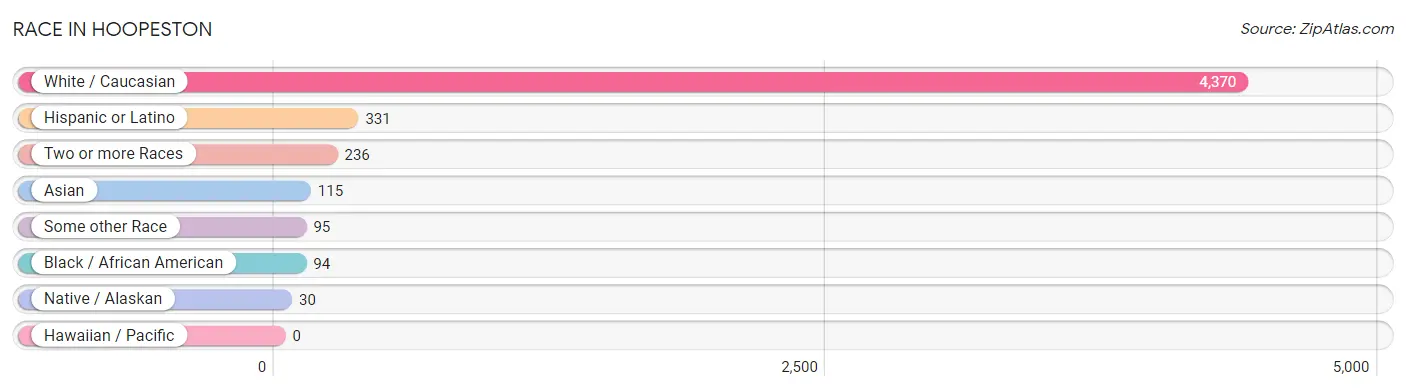
| Race | # Population | % Population |
| Asian | 115 | 2.3% |
| Black / African American | 94 | 1.9% |
| Hawaiian / Pacific | 0 | 0.0% |
| Hispanic or Latino | 331 | 6.7% |
| Native / Alaskan | 30 | 0.6% |
| White / Caucasian | 4,370 | 88.5% |
| Two or more Races | 236 | 4.8% |
| Some other Race | 95 | 1.9% |
| Total | 4,940 | 100.0% |
Ancestry in Hoopeston
The most populous ancestries reported in Hoopeston are English (534 | 10.8%), German (488 | 9.9%), American (336 | 6.8%), Irish (326 | 6.6%), and Mexican (297 | 6.0%), together accounting for 40.1% of all Hoopeston residents.
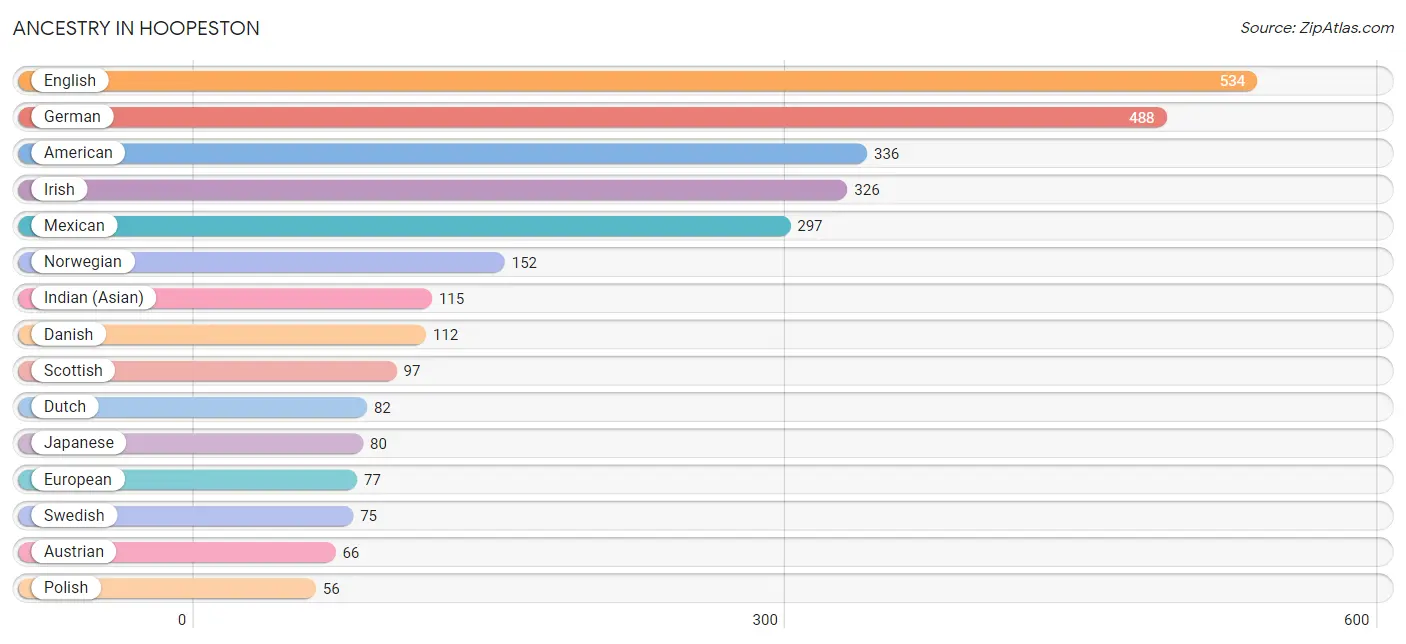
| Ancestry | # Population | % Population |
| American | 336 | 6.8% |
| Austrian | 66 | 1.3% |
| British | 12 | 0.2% |
| Danish | 112 | 2.3% |
| Dutch | 82 | 1.7% |
| English | 534 | 10.8% |
| European | 77 | 1.6% |
| French | 31 | 0.6% |
| German | 488 | 9.9% |
| Indian (Asian) | 115 | 2.3% |
| Irish | 326 | 6.6% |
| Italian | 10 | 0.2% |
| Japanese | 80 | 1.6% |
| Lithuanian | 21 | 0.4% |
| Mexican | 297 | 6.0% |
| Norwegian | 152 | 3.1% |
| Polish | 56 | 1.1% |
| Puerto Rican | 34 | 0.7% |
| Scandinavian | 18 | 0.4% |
| Scotch-Irish | 19 | 0.4% |
| Scottish | 97 | 2.0% |
| Swedish | 75 | 1.5% |
| Welsh | 55 | 1.1% | View All 23 Rows |
Immigrants in Hoopeston
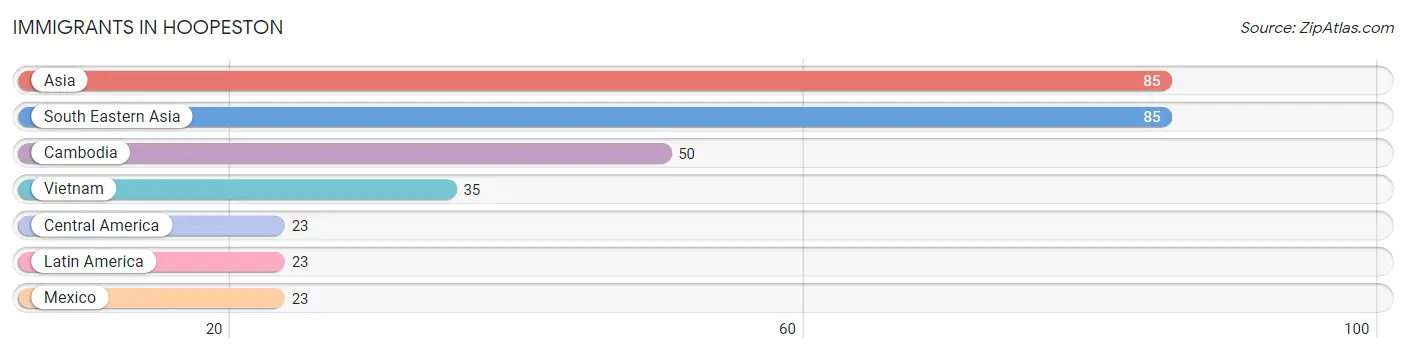
The most numerous immigrant groups reported in Hoopeston came from Asia (85 | 1.7%), South Eastern Asia (85 | 1.7%), Cambodia (50 | 1.0%), Vietnam (35 | 0.7%), and Central America (23 | 0.5%), together accounting for 5.6% of all Hoopeston residents.
| Immigration Origin | # Population | % Population |
| Asia | 85 | 1.7% |
| Cambodia | 50 | 1.0% |
| Central America | 23 | 0.5% |
| Latin America | 23 | 0.5% |
| Mexico | 23 | 0.5% |
| South Eastern Asia | 85 | 1.7% |
| Vietnam | 35 | 0.7% | View All 7 Rows |
Sex and Age in Hoopeston
Sex and Age in Hoopeston
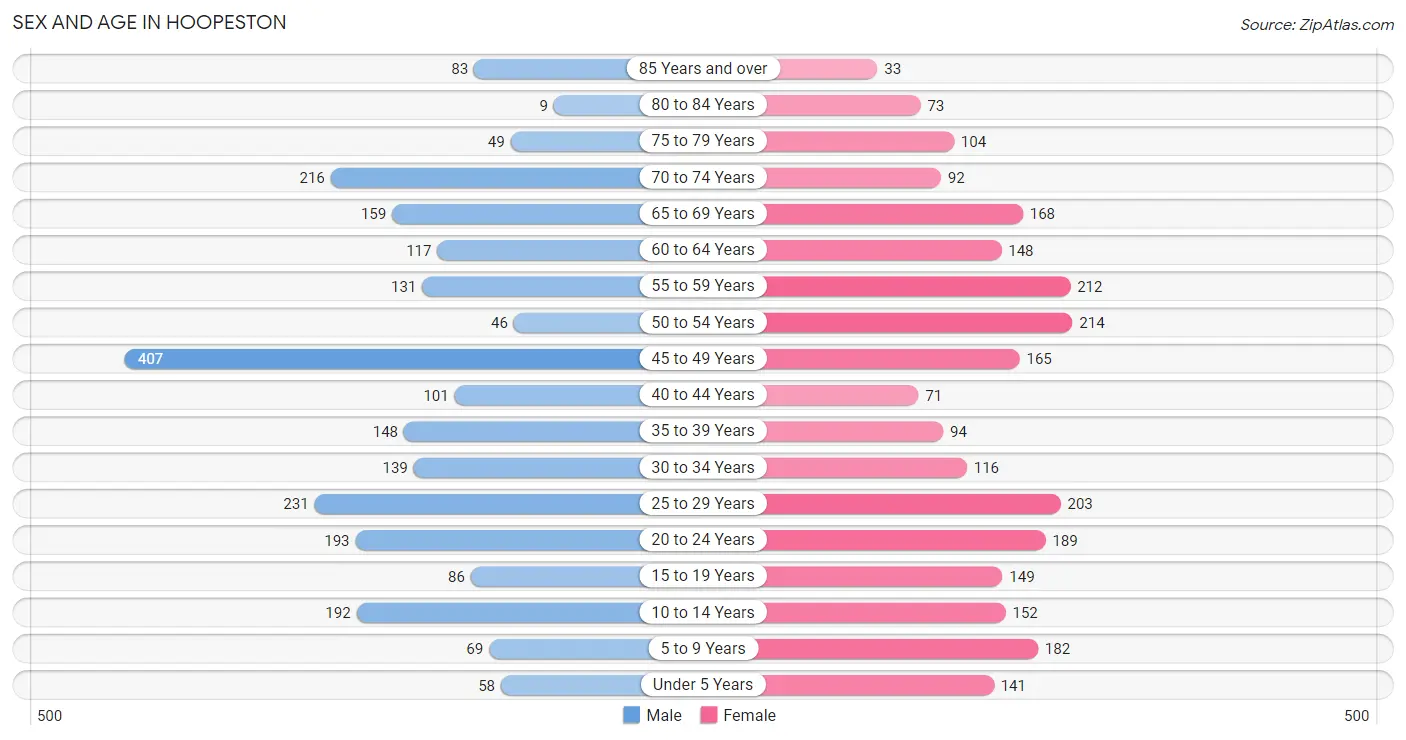
The most populous age groups in Hoopeston are 45 to 49 Years (407 | 16.7%) for men and 50 to 54 Years (214 | 8.5%) for women.
| Age Bracket | Male | Female |
| Under 5 Years | 58 (2.4%) | 141 (5.6%) |
| 5 to 9 Years | 69 (2.8%) | 182 (7.3%) |
| 10 to 14 Years | 192 (7.9%) | 152 (6.1%) |
| 15 to 19 Years | 86 (3.5%) | 149 (5.9%) |
| 20 to 24 Years | 193 (7.9%) | 189 (7.5%) |
| 25 to 29 Years | 231 (9.5%) | 203 (8.1%) |
| 30 to 34 Years | 139 (5.7%) | 116 (4.6%) |
| 35 to 39 Years | 148 (6.1%) | 94 (3.7%) |
| 40 to 44 Years | 101 (4.2%) | 71 (2.8%) |
| 45 to 49 Years | 407 (16.7%) | 165 (6.6%) |
| 50 to 54 Years | 46 (1.9%) | 214 (8.5%) |
| 55 to 59 Years | 131 (5.4%) | 212 (8.5%) |
| 60 to 64 Years | 117 (4.8%) | 148 (5.9%) |
| 65 to 69 Years | 159 (6.5%) | 168 (6.7%) |
| 70 to 74 Years | 216 (8.9%) | 92 (3.7%) |
| 75 to 79 Years | 49 (2.0%) | 104 (4.2%) |
| 80 to 84 Years | 9 (0.4%) | 73 (2.9%) |
| 85 Years and over | 83 (3.4%) | 33 (1.3%) |
| Total | 2,434 (100.0%) | 2,506 (100.0%) |
Families and Households in Hoopeston
Median Family Size in Hoopeston
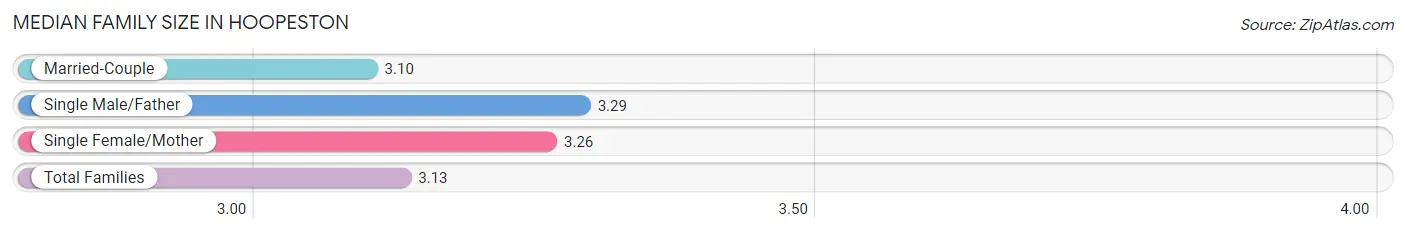
The median family size in Hoopeston is 3.13 persons per family, with single male/father families (87 | 7.6%) accounting for the largest median family size of 3.29 persons per family. On the other hand, married-couple families (933 | 81.2%) represent the smallest median family size with 3.10 persons per family.
| Family Type | # Families | Family Size |
| Married-Couple | 933 (81.2%) | 3.10 |
| Single Male/Father | 87 (7.6%) | 3.29 |
| Single Female/Mother | 129 (11.2%) | 3.26 |
| Total Families | 1,149 (100.0%) | 3.13 |
Median Household Size in Hoopeston
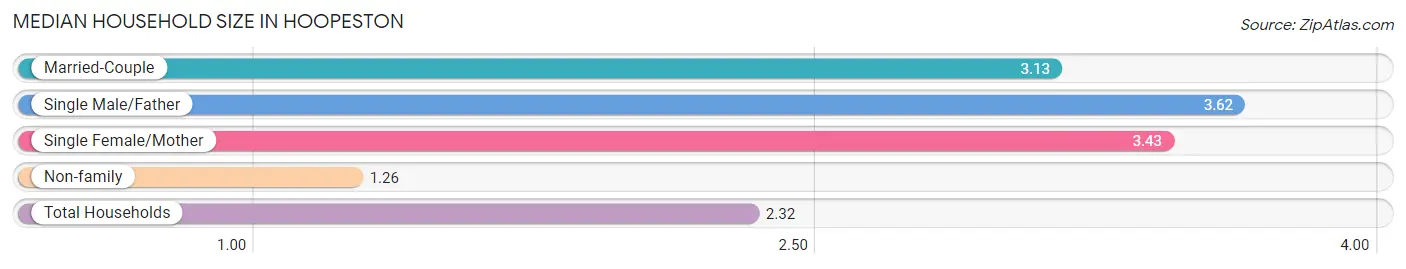
The median household size in Hoopeston is 2.32 persons per household, with single male/father households (87 | 4.1%) accounting for the largest median household size of 3.62 persons per household. non-family households (950 | 45.3%) represent the smallest median household size with 1.26 persons per household.
| Household Type | # Households | Household Size |
| Married-Couple | 933 (44.5%) | 3.13 |
| Single Male/Father | 87 (4.1%) | 3.62 |
| Single Female/Mother | 129 (6.1%) | 3.43 |
| Non-family | 950 (45.3%) | 1.26 |
| Total Households | 2,099 (100.0%) | 2.32 |
Household Size by Marriage Status in Hoopeston
Out of a total of 2,099 households in Hoopeston, 1,149 (54.7%) are family households, while 950 (45.3%) are nonfamily households. The most numerous type of family households are 2-person households, comprising 480, and the most common type of nonfamily households are 1-person households, comprising 774.
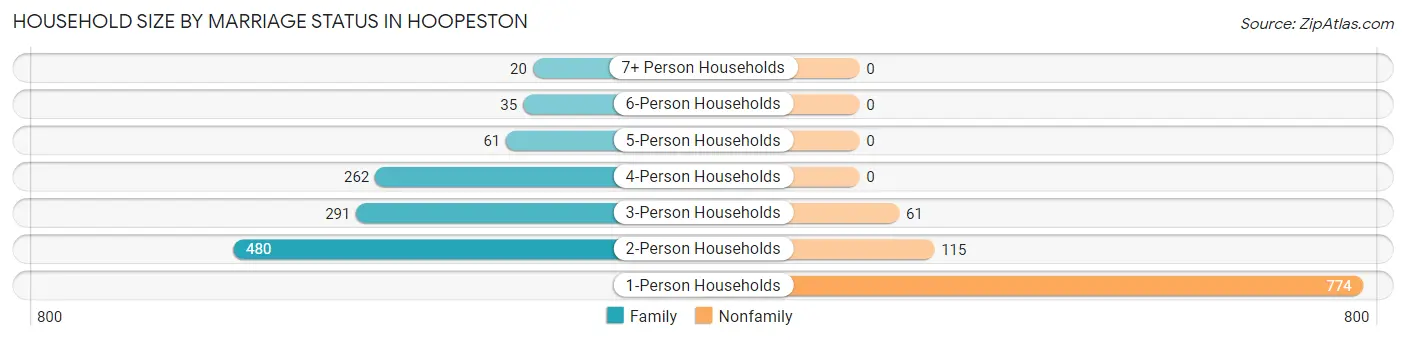
| Household Size | Family Households | Nonfamily Households |
| 1-Person Households | - | 774 (36.9%) |
| 2-Person Households | 480 (22.9%) | 115 (5.5%) |
| 3-Person Households | 291 (13.9%) | 61 (2.9%) |
| 4-Person Households | 262 (12.5%) | 0 (0.0%) |
| 5-Person Households | 61 (2.9%) | 0 (0.0%) |
| 6-Person Households | 35 (1.7%) | 0 (0.0%) |
| 7+ Person Households | 20 (0.9%) | 0 (0.0%) |
| Total | 1,149 (54.7%) | 950 (45.3%) |
Female Fertility in Hoopeston
Fertility by Age in Hoopeston
Average fertility rate in Hoopeston is 49.0 births per 1,000 women. Women in the age bracket of 20 to 34 years have the highest fertility rate with 59.0 births per 1,000 women. Women in the age bracket of 20 to 34 years acount for 58.8% of all women with births.
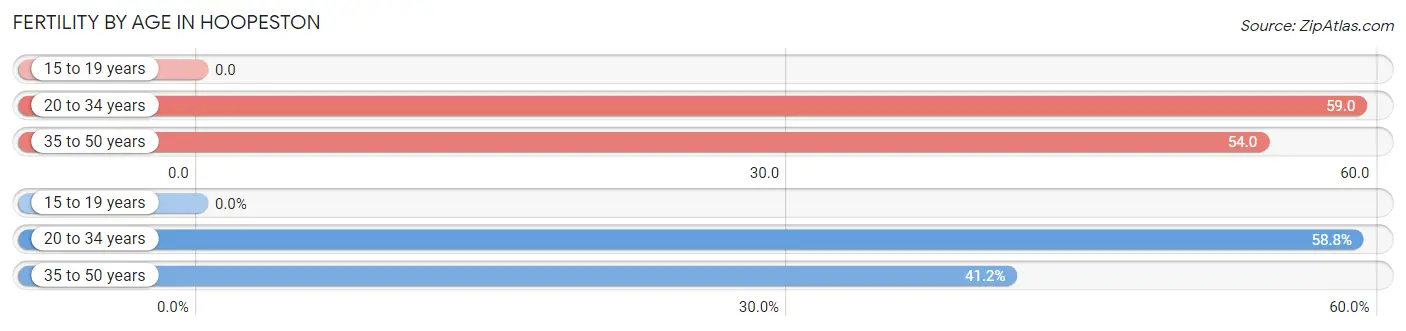
| Age Bracket | Women with Births | Births / 1,000 Women |
| 15 to 19 years | 0 (0.0%) | 0.0 |
| 20 to 34 years | 30 (58.8%) | 59.0 |
| 35 to 50 years | 21 (41.2%) | 54.0 |
| Total | 51 (100.0%) | 49.0 |
Fertility by Age by Marriage Status in Hoopeston
41.2% of women with births (51) in Hoopeston are married. The highest percentage of unmarried women with births falls into 20 to 34 years age bracket with 100.0% of them unmarried at the time of birth, while the lowest percentage of unmarried women with births belong to 35 to 50 years age bracket with 0.0% of them unmarried.
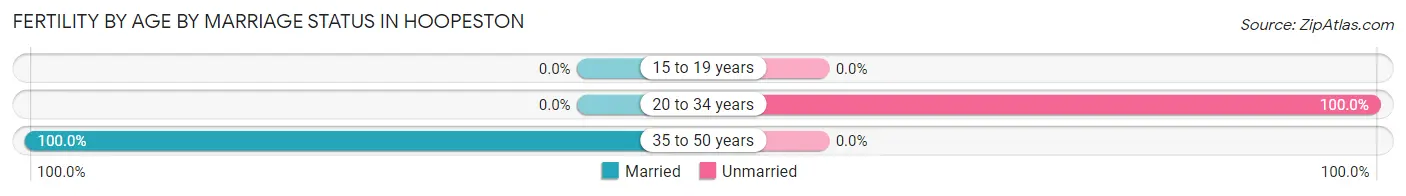
| Age Bracket | Married | Unmarried |
| 15 to 19 years | 0 (0.0%) | 0 (0.0%) |
| 20 to 34 years | 0 (0.0%) | 30 (100.0%) |
| 35 to 50 years | 21 (100.0%) | 0 (0.0%) |
| Total | 21 (41.2%) | 30 (58.8%) |
Fertility by Education in Hoopeston
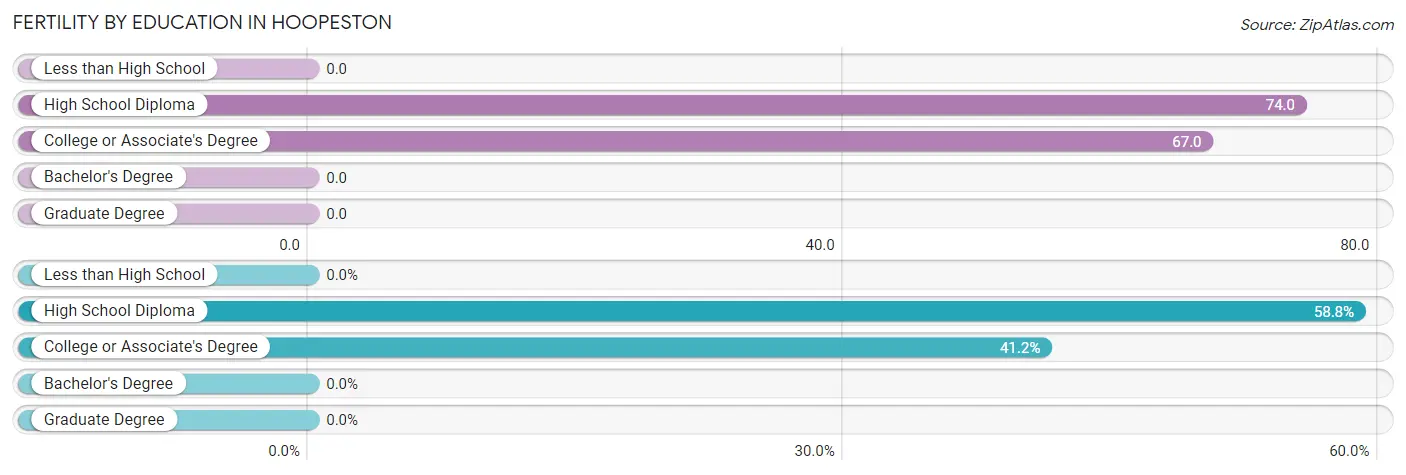
| Educational Attainment | Women with Births | Births / 1,000 Women |
| Less than High School | 0 (0.0%) | 0.0 |
| High School Diploma | 30 (58.8%) | 74.0 |
| College or Associate's Degree | 21 (41.2%) | 67.0 |
| Bachelor's Degree | 0 (0.0%) | 0.0 |
| Graduate Degree | 0 (0.0%) | 0.0 |
| Total | 51 (100.0%) | 49.0 |
Fertility by Education by Marriage Status in Hoopeston
58.8% of women with births in Hoopeston are unmarried. Women with the educational attainment of college or associate's degree are most likely to be married with 100.0% of them married at childbirth, while women with the educational attainment of high school diploma are least likely to be married with 100.0% of them unmarried at childbirth.
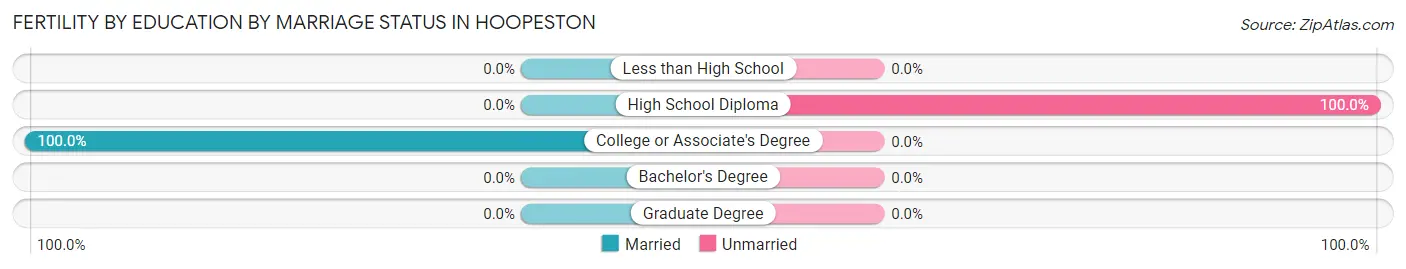
| Educational Attainment | Married | Unmarried |
| Less than High School | 0 (0.0%) | 0 (0.0%) |
| High School Diploma | 0 (0.0%) | 30 (100.0%) |
| College or Associate's Degree | 21 (100.0%) | 0 (0.0%) |
| Bachelor's Degree | 0 (0.0%) | 0 (0.0%) |
| Graduate Degree | 0 (0.0%) | 0 (0.0%) |
| Total | 21 (41.2%) | 30 (58.8%) |
Employment Characteristics in Hoopeston
Employment by Class of Employer in Hoopeston
Among the 1,946 employed individuals in Hoopeston, private company employees (1,401 | 72.0%), self-employed (not incorporated) (146 | 7.5%), and local government employees (132 | 6.8%) make up the most common classes of employment.
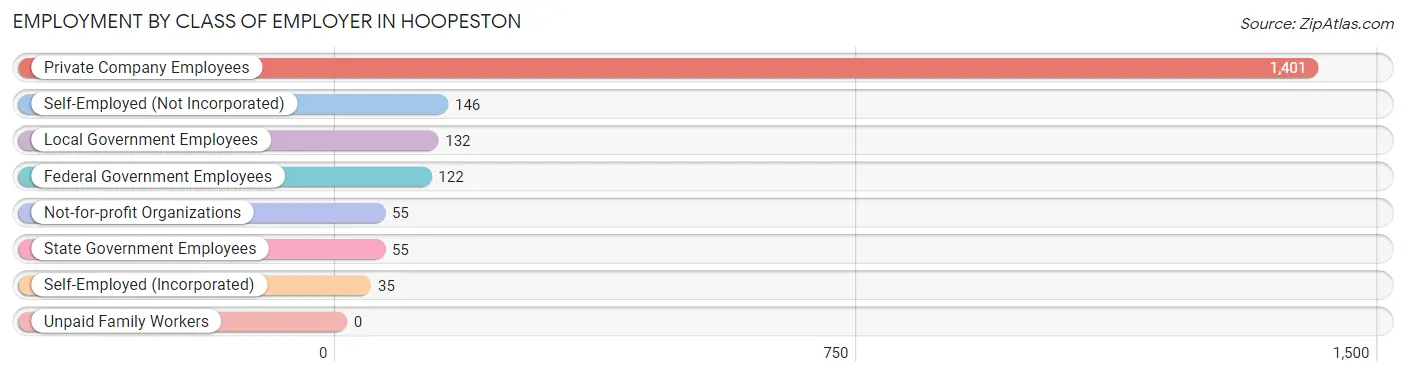
| Employer Class | # Employees | % Employees |
| Private Company Employees | 1,401 | 72.0% |
| Self-Employed (Incorporated) | 35 | 1.8% |
| Self-Employed (Not Incorporated) | 146 | 7.5% |
| Not-for-profit Organizations | 55 | 2.8% |
| Local Government Employees | 132 | 6.8% |
| State Government Employees | 55 | 2.8% |
| Federal Government Employees | 122 | 6.3% |
| Unpaid Family Workers | 0 | 0.0% |
| Total | 1,946 | 100.0% |
Employment Status by Age in Hoopeston
According to the labor force statistics for Hoopeston, out of the total population over 16 years of age (4,127), 54.6% or 2,253 individuals are in the labor force, with 11.3% or 255 of them unemployed. The age group with the highest labor force participation rate is 35 to 44 years, with 90.3% or 374 individuals in the labor force. Within the labor force, the 20 to 24 years age range has the highest percentage of unemployed individuals, with 22.5% or 70 of them being unemployed.
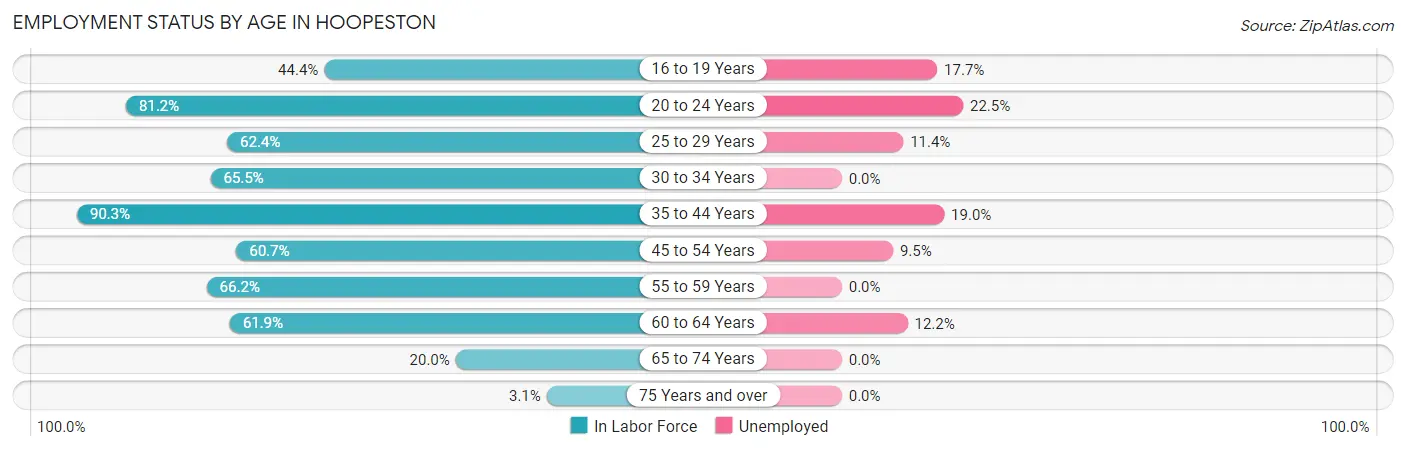
| Age Bracket | In Labor Force | Unemployed |
| 16 to 19 Years | 96 (44.4%) | 17 (17.7%) |
| 20 to 24 Years | 310 (81.2%) | 70 (22.5%) |
| 25 to 29 Years | 271 (62.4%) | 31 (11.4%) |
| 30 to 34 Years | 167 (65.5%) | 0 (0.0%) |
| 35 to 44 Years | 374 (90.3%) | 71 (19.0%) |
| 45 to 54 Years | 505 (60.7%) | 48 (9.5%) |
| 55 to 59 Years | 227 (66.2%) | 0 (0.0%) |
| 60 to 64 Years | 164 (61.9%) | 20 (12.2%) |
| 65 to 74 Years | 127 (20.0%) | 0 (0.0%) |
| 75 Years and over | 11 (3.1%) | 0 (0.0%) |
| Total | 2,253 (54.6%) | 255 (11.3%) |
Employment Status by Educational Attainment in Hoopeston
According to labor force statistics for Hoopeston, 67.2% of individuals (1,709) out of the total population between 25 and 64 years of age (2,543) are in the labor force, with 10.0% or 171 of them being unemployed. The group with the highest labor force participation rate are those with the educational attainment of college / associate degree, with 76.4% or 623 individuals in the labor force. Within the labor force, individuals with less than high school education have the highest percentage of unemployment, with 19.1% or 67 of them being unemployed.
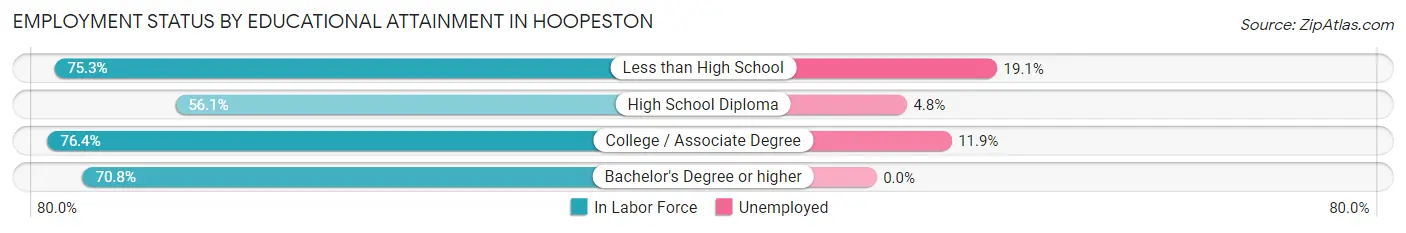
| Educational Attainment | In Labor Force | Unemployed |
| Less than High School | 351 (75.3%) | 89 (19.1%) |
| High School Diploma | 608 (56.1%) | 52 (4.8%) |
| College / Associate Degree | 623 (76.4%) | 97 (11.9%) |
| Bachelor's Degree or higher | 126 (70.8%) | 0 (0.0%) |
| Total | 1,709 (67.2%) | 254 (10.0%) |
Employment Occupations by Sex in Hoopeston
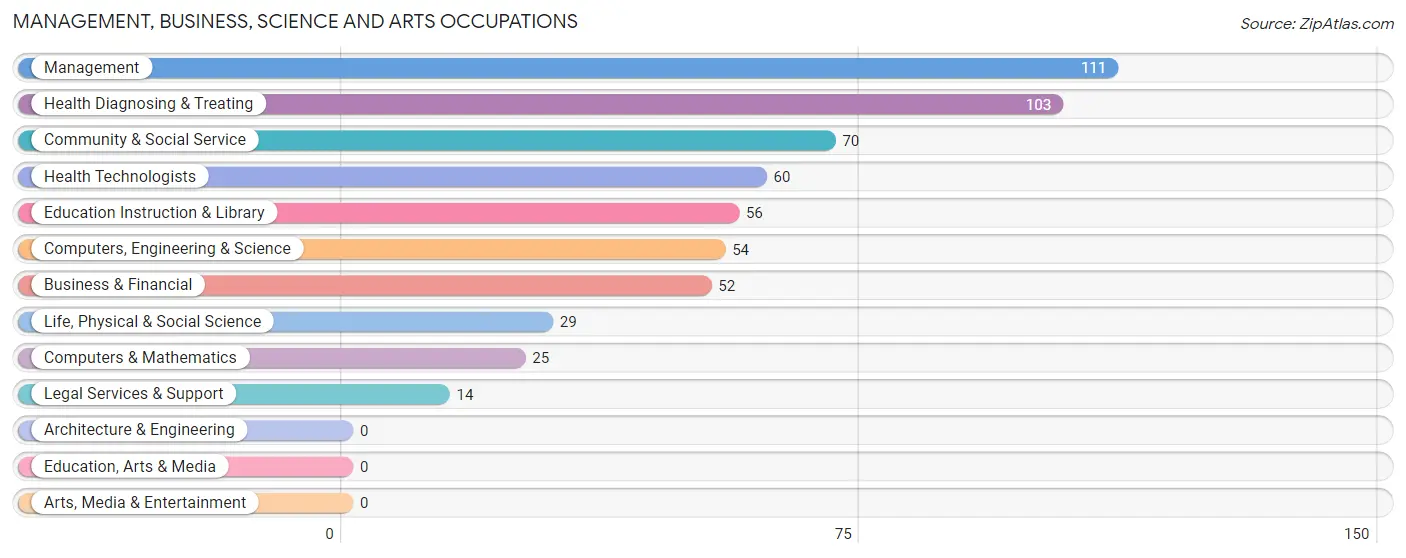
Management, Business, Science and Arts Occupations
The most common Management, Business, Science and Arts occupations in Hoopeston are Management (111 | 5.6%), Health Diagnosing & Treating (103 | 5.2%), Community & Social Service (70 | 3.5%), Health Technologists (60 | 3.0%), and Education Instruction & Library (56 | 2.8%).
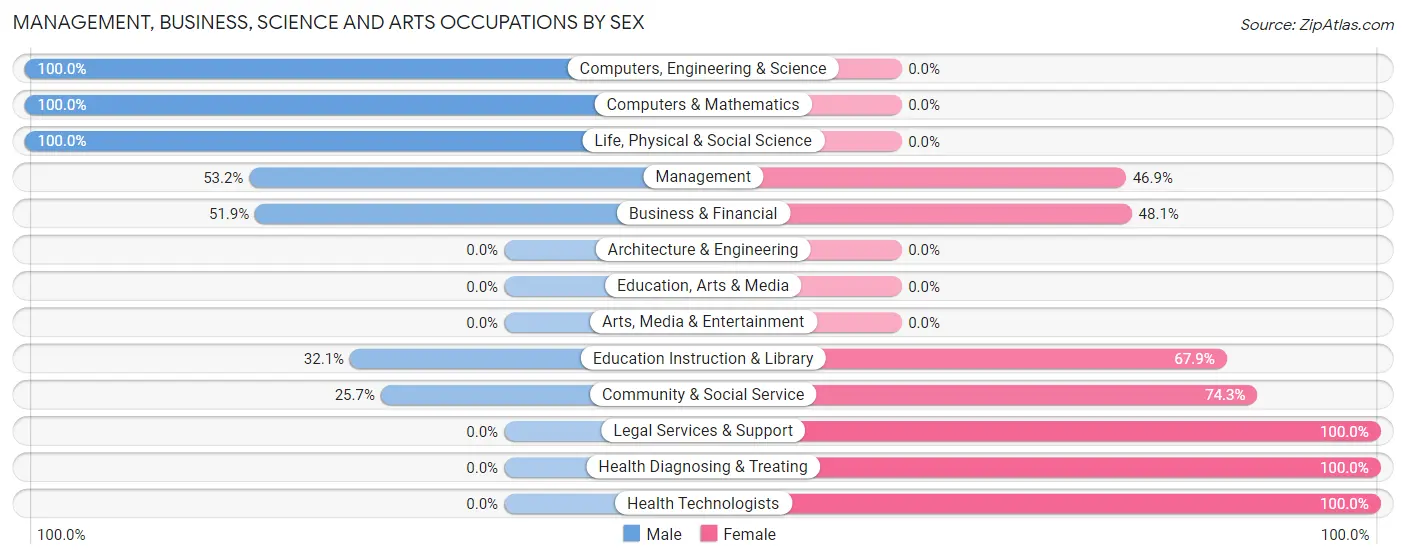
Management, Business, Science and Arts Occupations by Sex
Within the Management, Business, Science and Arts occupations in Hoopeston, the most male-oriented occupations are Computers, Engineering & Science (100.0%), Computers & Mathematics (100.0%), and Life, Physical & Social Science (100.0%), while the most female-oriented occupations are Legal Services & Support (100.0%), Health Diagnosing & Treating (100.0%), and Health Technologists (100.0%).
| Occupation | Male | Female |
| Management | 59 (53.1%) | 52 (46.9%) |
| Business & Financial | 27 (51.9%) | 25 (48.1%) |
| Computers, Engineering & Science | 54 (100.0%) | 0 (0.0%) |
| Computers & Mathematics | 25 (100.0%) | 0 (0.0%) |
| Architecture & Engineering | 0 (0.0%) | 0 (0.0%) |
| Life, Physical & Social Science | 29 (100.0%) | 0 (0.0%) |
| Community & Social Service | 18 (25.7%) | 52 (74.3%) |
| Education, Arts & Media | 0 (0.0%) | 0 (0.0%) |
| Legal Services & Support | 0 (0.0%) | 14 (100.0%) |
| Education Instruction & Library | 18 (32.1%) | 38 (67.9%) |
| Arts, Media & Entertainment | 0 (0.0%) | 0 (0.0%) |
| Health Diagnosing & Treating | 0 (0.0%) | 103 (100.0%) |
| Health Technologists | 0 (0.0%) | 60 (100.0%) |
| Total (Category) | 158 (40.5%) | 232 (59.5%) |
| Total (Overall) | 1,206 (60.7%) | 780 (39.3%) |
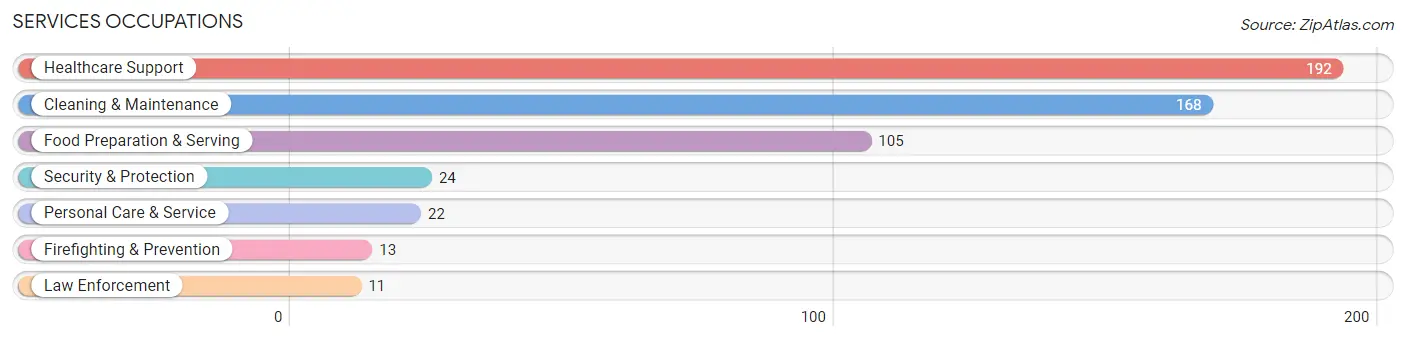
Services Occupations
The most common Services occupations in Hoopeston are Healthcare Support (192 | 9.7%), Cleaning & Maintenance (168 | 8.5%), Food Preparation & Serving (105 | 5.3%), Security & Protection (24 | 1.2%), and Personal Care & Service (22 | 1.1%).
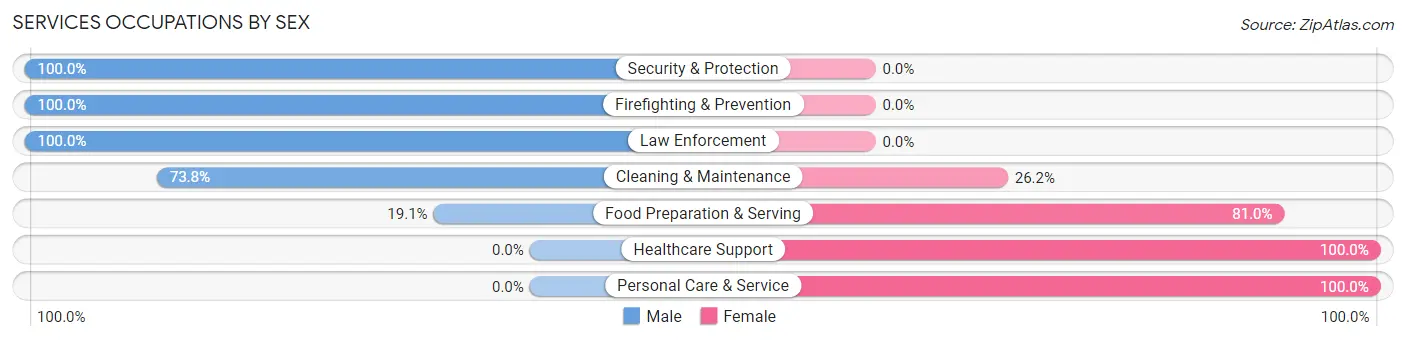
Services Occupations by Sex
Within the Services occupations in Hoopeston, the most male-oriented occupations are Security & Protection (100.0%), Firefighting & Prevention (100.0%), and Law Enforcement (100.0%), while the most female-oriented occupations are Healthcare Support (100.0%), Personal Care & Service (100.0%), and Food Preparation & Serving (80.9%).
| Occupation | Male | Female |
| Healthcare Support | 0 (0.0%) | 192 (100.0%) |
| Security & Protection | 24 (100.0%) | 0 (0.0%) |
| Firefighting & Prevention | 13 (100.0%) | 0 (0.0%) |
| Law Enforcement | 11 (100.0%) | 0 (0.0%) |
| Food Preparation & Serving | 20 (19.1%) | 85 (80.9%) |
| Cleaning & Maintenance | 124 (73.8%) | 44 (26.2%) |
| Personal Care & Service | 0 (0.0%) | 22 (100.0%) |
| Total (Category) | 168 (32.9%) | 343 (67.1%) |
| Total (Overall) | 1,206 (60.7%) | 780 (39.3%) |
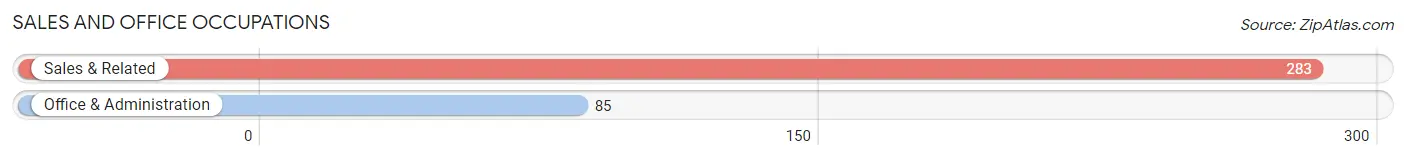
Sales and Office Occupations
The most common Sales and Office occupations in Hoopeston are Sales & Related (283 | 14.2%), and Office & Administration (85 | 4.3%).
Sales and Office Occupations by Sex
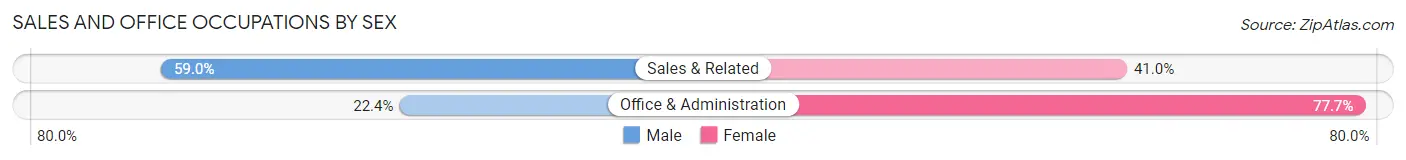
| Occupation | Male | Female |
| Sales & Related | 167 (59.0%) | 116 (41.0%) |
| Office & Administration | 19 (22.4%) | 66 (77.6%) |
| Total (Category) | 186 (50.5%) | 182 (49.5%) |
| Total (Overall) | 1,206 (60.7%) | 780 (39.3%) |
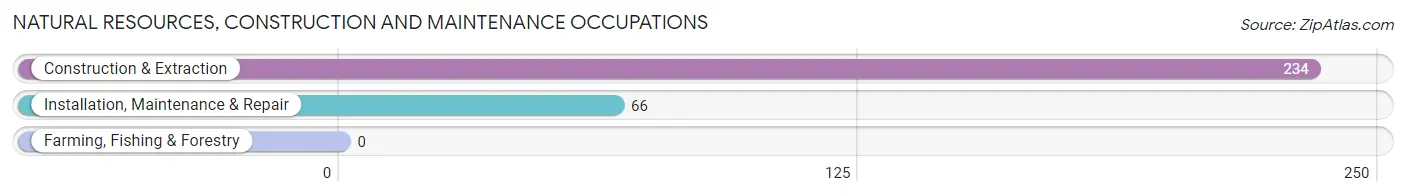
Natural Resources, Construction and Maintenance Occupations
The most common Natural Resources, Construction and Maintenance occupations in Hoopeston are Construction & Extraction (234 | 11.8%), and Installation, Maintenance & Repair (66 | 3.3%).
Natural Resources, Construction and Maintenance Occupations by Sex
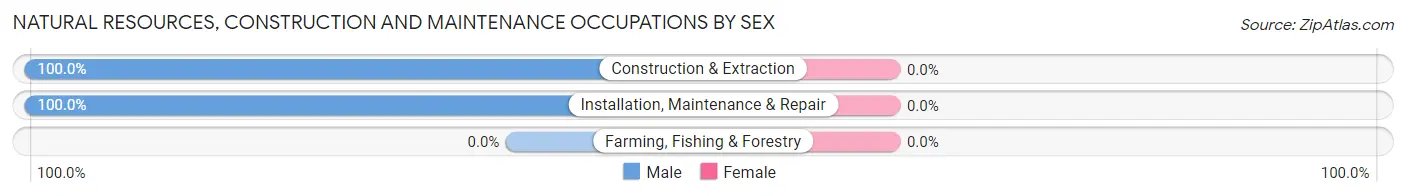
| Occupation | Male | Female |
| Farming, Fishing & Forestry | 0 (0.0%) | 0 (0.0%) |
| Construction & Extraction | 234 (100.0%) | 0 (0.0%) |
| Installation, Maintenance & Repair | 66 (100.0%) | 0 (0.0%) |
| Total (Category) | 300 (100.0%) | 0 (0.0%) |
| Total (Overall) | 1,206 (60.7%) | 780 (39.3%) |
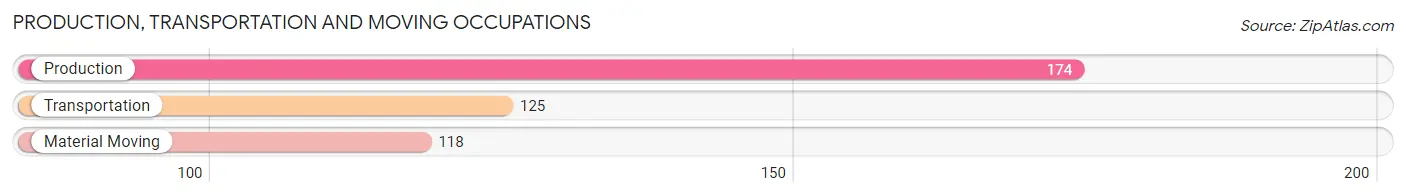
Production, Transportation and Moving Occupations
The most common Production, Transportation and Moving occupations in Hoopeston are Production (174 | 8.8%), Transportation (125 | 6.3%), and Material Moving (118 | 5.9%).
Production, Transportation and Moving Occupations by Sex
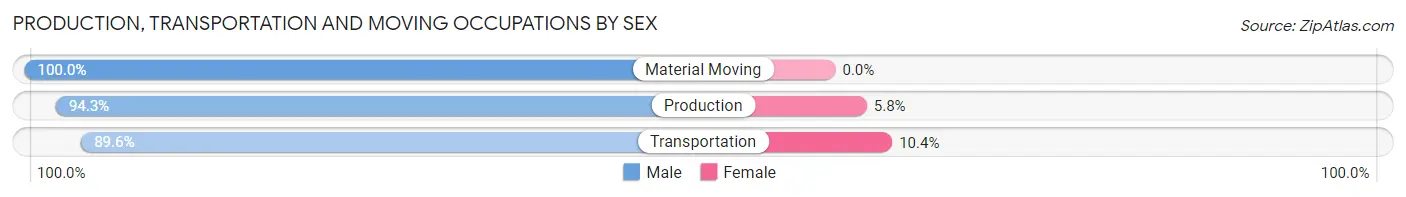
| Occupation | Male | Female |
| Production | 164 (94.3%) | 10 (5.8%) |
| Transportation | 112 (89.6%) | 13 (10.4%) |
| Material Moving | 118 (100.0%) | 0 (0.0%) |
| Total (Category) | 394 (94.5%) | 23 (5.5%) |
| Total (Overall) | 1,206 (60.7%) | 780 (39.3%) |
Employment Industries by Sex in Hoopeston
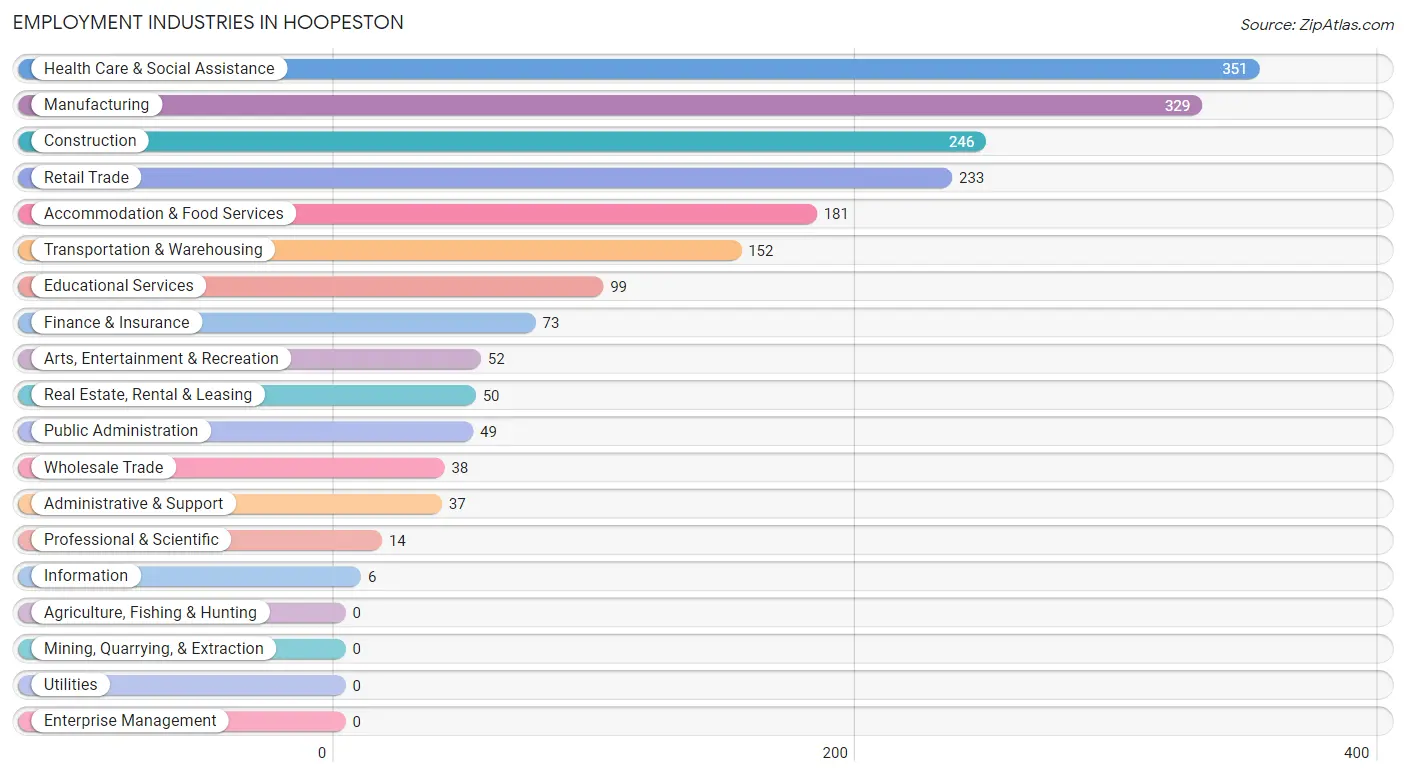
Employment Industries in Hoopeston
The major employment industries in Hoopeston include Health Care & Social Assistance (351 | 17.7%), Manufacturing (329 | 16.6%), Construction (246 | 12.4%), Retail Trade (233 | 11.7%), and Accommodation & Food Services (181 | 9.1%).
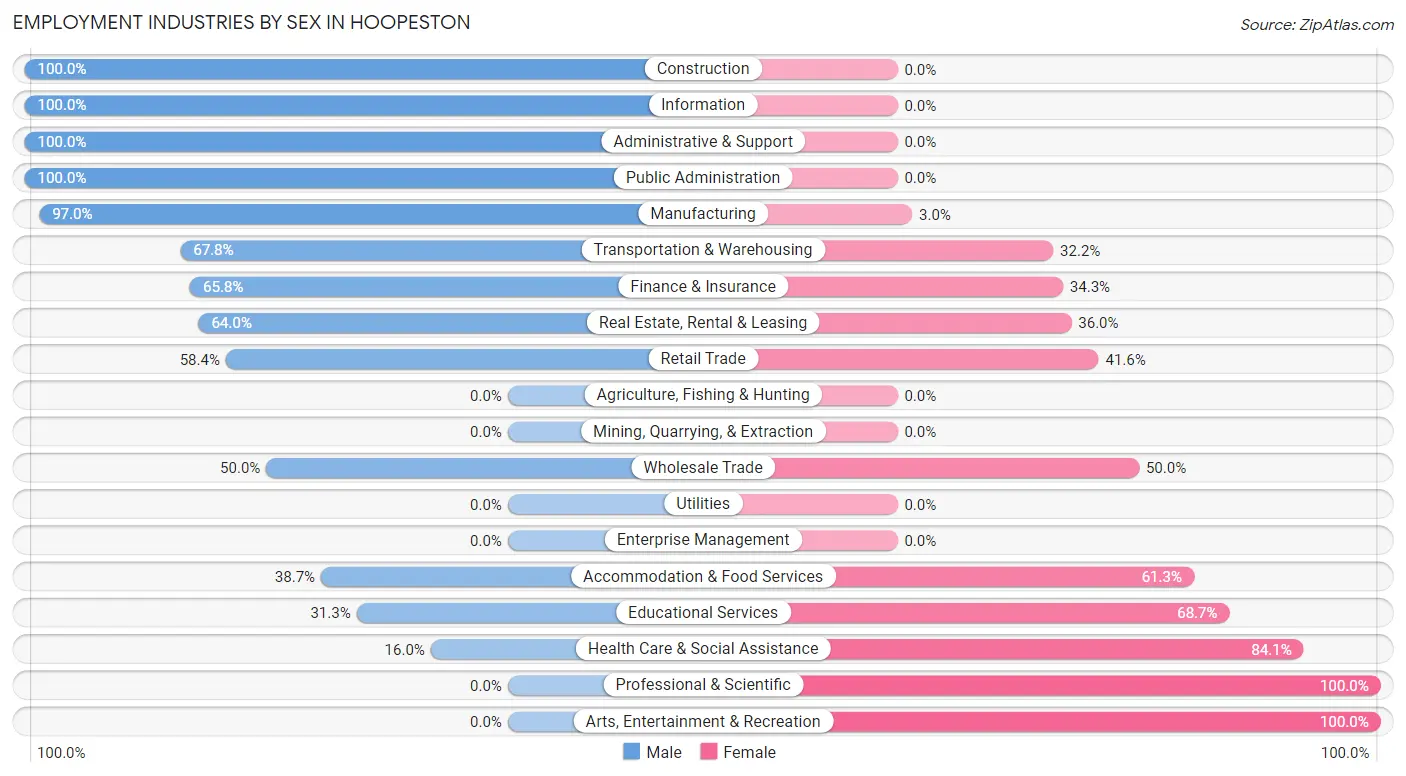
Employment Industries by Sex in Hoopeston
The Hoopeston industries that see more men than women are Construction (100.0%), Information (100.0%), and Administrative & Support (100.0%), whereas the industries that tend to have a higher number of women are Professional & Scientific (100.0%), Arts, Entertainment & Recreation (100.0%), and Health Care & Social Assistance (84.1%).
| Industry | Male | Female |
| Agriculture, Fishing & Hunting | 0 (0.0%) | 0 (0.0%) |
| Mining, Quarrying, & Extraction | 0 (0.0%) | 0 (0.0%) |
| Construction | 246 (100.0%) | 0 (0.0%) |
| Manufacturing | 319 (97.0%) | 10 (3.0%) |
| Wholesale Trade | 19 (50.0%) | 19 (50.0%) |
| Retail Trade | 136 (58.4%) | 97 (41.6%) |
| Transportation & Warehousing | 103 (67.8%) | 49 (32.2%) |
| Utilities | 0 (0.0%) | 0 (0.0%) |
| Information | 6 (100.0%) | 0 (0.0%) |
| Finance & Insurance | 48 (65.7%) | 25 (34.3%) |
| Real Estate, Rental & Leasing | 32 (64.0%) | 18 (36.0%) |
| Professional & Scientific | 0 (0.0%) | 14 (100.0%) |
| Enterprise Management | 0 (0.0%) | 0 (0.0%) |
| Administrative & Support | 37 (100.0%) | 0 (0.0%) |
| Educational Services | 31 (31.3%) | 68 (68.7%) |
| Health Care & Social Assistance | 56 (16.0%) | 295 (84.1%) |
| Arts, Entertainment & Recreation | 0 (0.0%) | 52 (100.0%) |
| Accommodation & Food Services | 70 (38.7%) | 111 (61.3%) |
| Public Administration | 49 (100.0%) | 0 (0.0%) |
| Total | 1,206 (60.7%) | 780 (39.3%) |
Education in Hoopeston
School Enrollment in Hoopeston
The most common levels of schooling among the 861 students in Hoopeston are middle school (302 | 35.1%), elementary school (235 | 27.3%), and high school (166 | 19.3%).
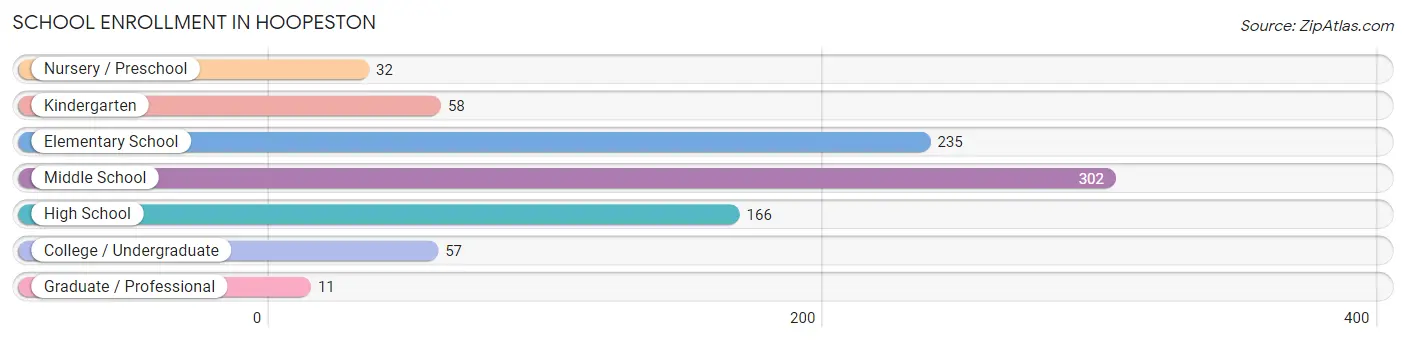
| School Level | # Students | % Students |
| Nursery / Preschool | 32 | 3.7% |
| Kindergarten | 58 | 6.7% |
| Elementary School | 235 | 27.3% |
| Middle School | 302 | 35.1% |
| High School | 166 | 19.3% |
| College / Undergraduate | 57 | 6.6% |
| Graduate / Professional | 11 | 1.3% |
| Total | 861 | 100.0% |
School Enrollment by Age by Funding Source in Hoopeston
Out of a total of 861 students who are enrolled in schools in Hoopeston, 121 (14.1%) attend a private institution, while the remaining 740 (85.9%) are enrolled in public schools. The age group of 15 to 17 year olds has the highest likelihood of being enrolled in private schools, with 41 (24.7% in the age bracket) enrolled. Conversely, the age group of 3 to 4 year olds has the lowest likelihood of being enrolled in a private school, with 32 (100.0% in the age bracket) attending a public institution.
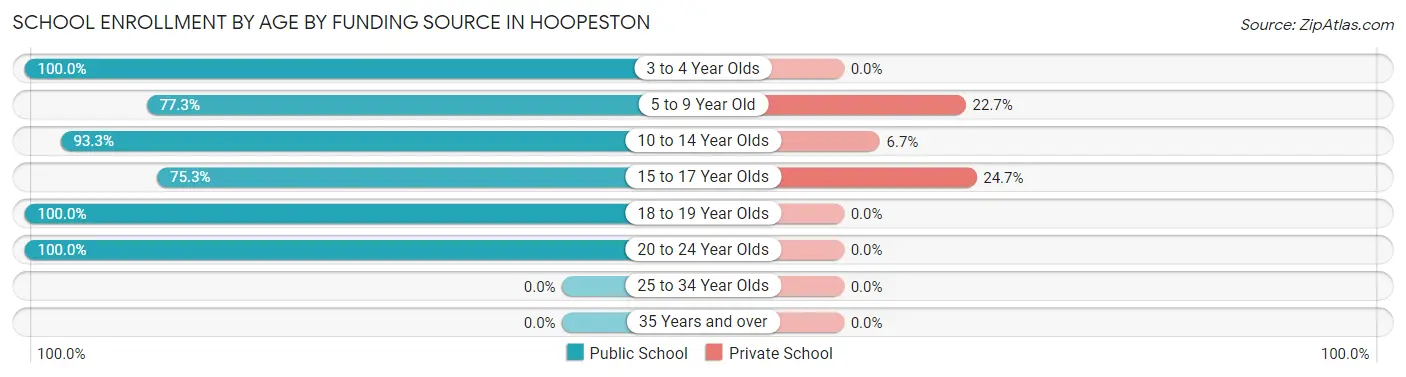
| Age Bracket | Public School | Private School |
| 3 to 4 Year Olds | 32 (100.0%) | 0 (0.0%) |
| 5 to 9 Year Old | 194 (77.3%) | 57 (22.7%) |
| 10 to 14 Year Olds | 321 (93.3%) | 23 (6.7%) |
| 15 to 17 Year Olds | 125 (75.3%) | 41 (24.7%) |
| 18 to 19 Year Olds | 30 (100.0%) | 0 (0.0%) |
| 20 to 24 Year Olds | 38 (100.0%) | 0 (0.0%) |
| 25 to 34 Year Olds | 0 (0.0%) | 0 (0.0%) |
| 35 Years and over | 0 (0.0%) | 0 (0.0%) |
| Total | 740 (85.9%) | 121 (14.1%) |
Educational Attainment by Field of Study in Hoopeston
Education (47 | 21.2%), business (44 | 19.8%), science & technology (33 | 14.9%), literature & languages (29 | 13.1%), and bio, nature & agricultural (18 | 8.1%) are the most common fields of study among 222 individuals in Hoopeston who have obtained a bachelor's degree or higher.
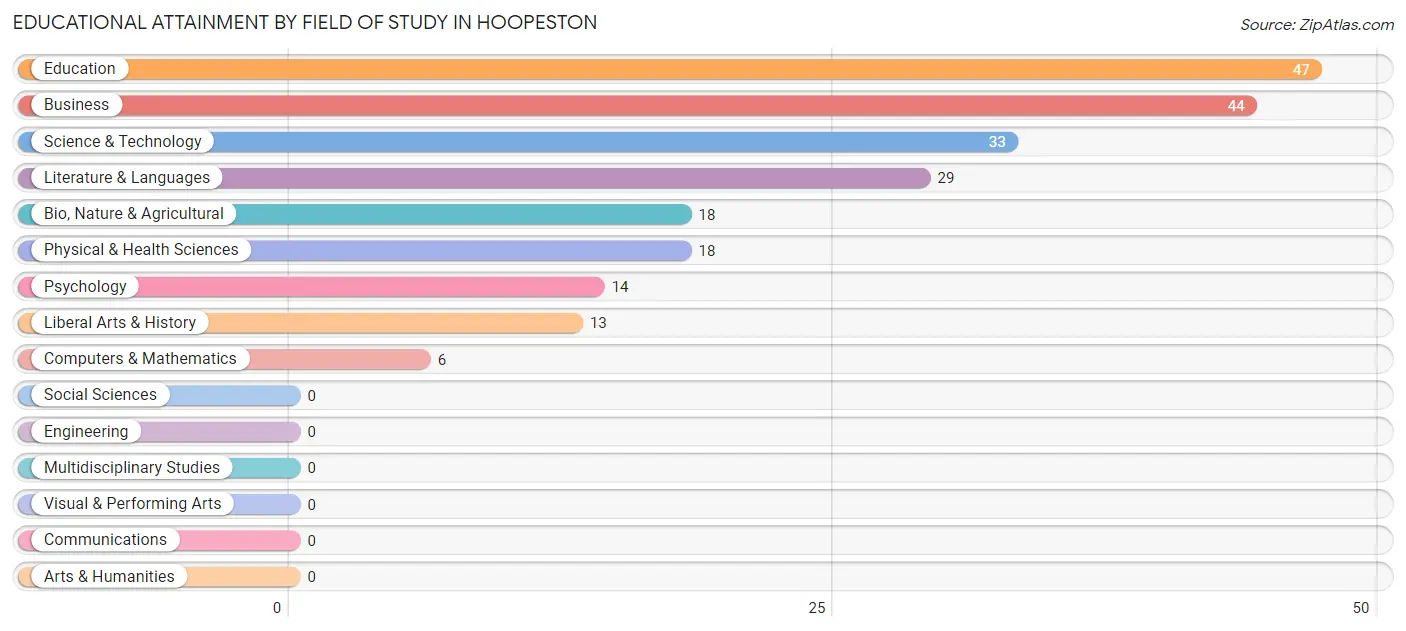
| Field of Study | # Graduates | % Graduates |
| Computers & Mathematics | 6 | 2.7% |
| Bio, Nature & Agricultural | 18 | 8.1% |
| Physical & Health Sciences | 18 | 8.1% |
| Psychology | 14 | 6.3% |
| Social Sciences | 0 | 0.0% |
| Engineering | 0 | 0.0% |
| Multidisciplinary Studies | 0 | 0.0% |
| Science & Technology | 33 | 14.9% |
| Business | 44 | 19.8% |
| Education | 47 | 21.2% |
| Literature & Languages | 29 | 13.1% |
| Liberal Arts & History | 13 | 5.9% |
| Visual & Performing Arts | 0 | 0.0% |
| Communications | 0 | 0.0% |
| Arts & Humanities | 0 | 0.0% |
| Total | 222 | 100.0% |
Transportation & Commute in Hoopeston
Vehicle Availability by Sex in Hoopeston
The most prevalent vehicle ownership categories in Hoopeston are males with 2 vehicles (415, accounting for 34.1%) and females with 2 vehicles (262, making up 57.0%).
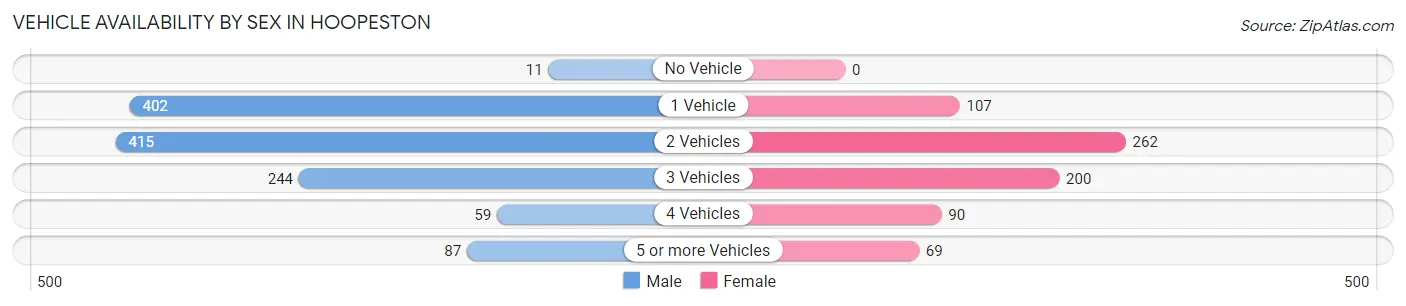
| Vehicles Available | Male | Female |
| No Vehicle | 11 (0.9%) | 0 (0.0%) |
| 1 Vehicle | 402 (33.0%) | 107 (14.7%) |
| 2 Vehicles | 415 (34.1%) | 262 (36.0%) |
| 3 Vehicles | 244 (20.0%) | 200 (27.5%) |
| 4 Vehicles | 59 (4.8%) | 90 (12.4%) |
| 5 or more Vehicles | 87 (7.1%) | 69 (9.5%) |
| Total | 1,218 (100.0%) | 728 (100.0%) |
Commute Time in Hoopeston
The most frequently occuring commute durations in Hoopeston are 5 to 9 minutes (825 commuters, 44.3%), 45 to 59 minutes (269 commuters, 14.4%), and 40 to 44 minutes (109 commuters, 5.9%).
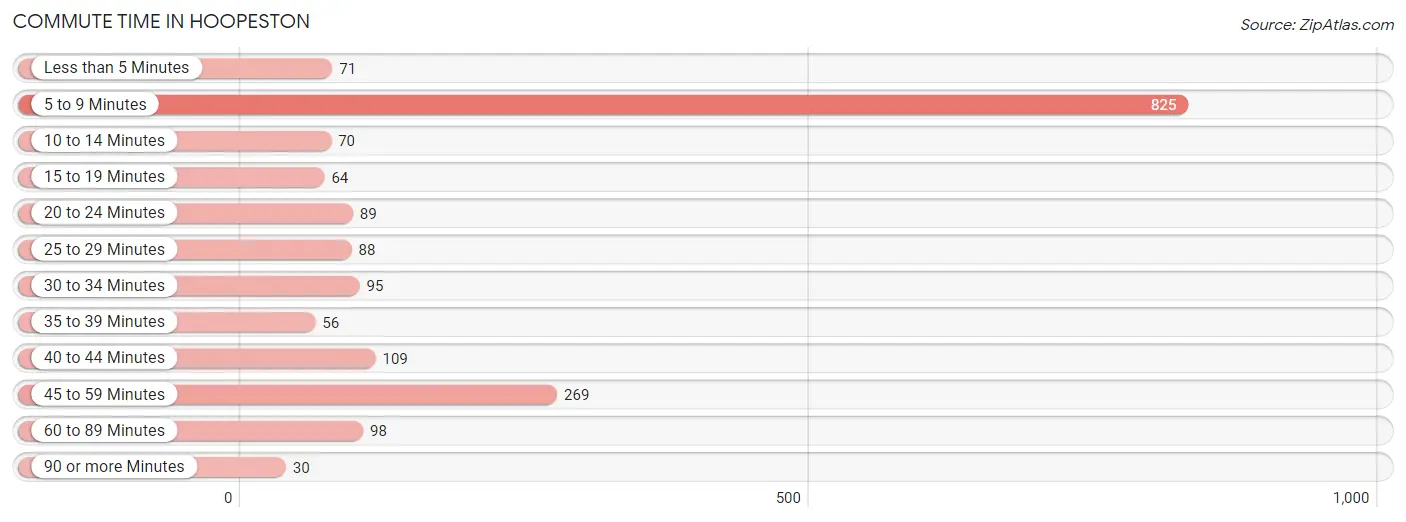
| Commute Time | # Commuters | % Commuters |
| Less than 5 Minutes | 71 | 3.8% |
| 5 to 9 Minutes | 825 | 44.3% |
| 10 to 14 Minutes | 70 | 3.8% |
| 15 to 19 Minutes | 64 | 3.4% |
| 20 to 24 Minutes | 89 | 4.8% |
| 25 to 29 Minutes | 88 | 4.7% |
| 30 to 34 Minutes | 95 | 5.1% |
| 35 to 39 Minutes | 56 | 3.0% |
| 40 to 44 Minutes | 109 | 5.9% |
| 45 to 59 Minutes | 269 | 14.4% |
| 60 to 89 Minutes | 98 | 5.3% |
| 90 or more Minutes | 30 | 1.6% |
Commute Time by Sex in Hoopeston
The most common commute times in Hoopeston are 5 to 9 minutes (374 commuters, 32.9%) for males and 5 to 9 minutes (451 commuters, 62.0%) for females.
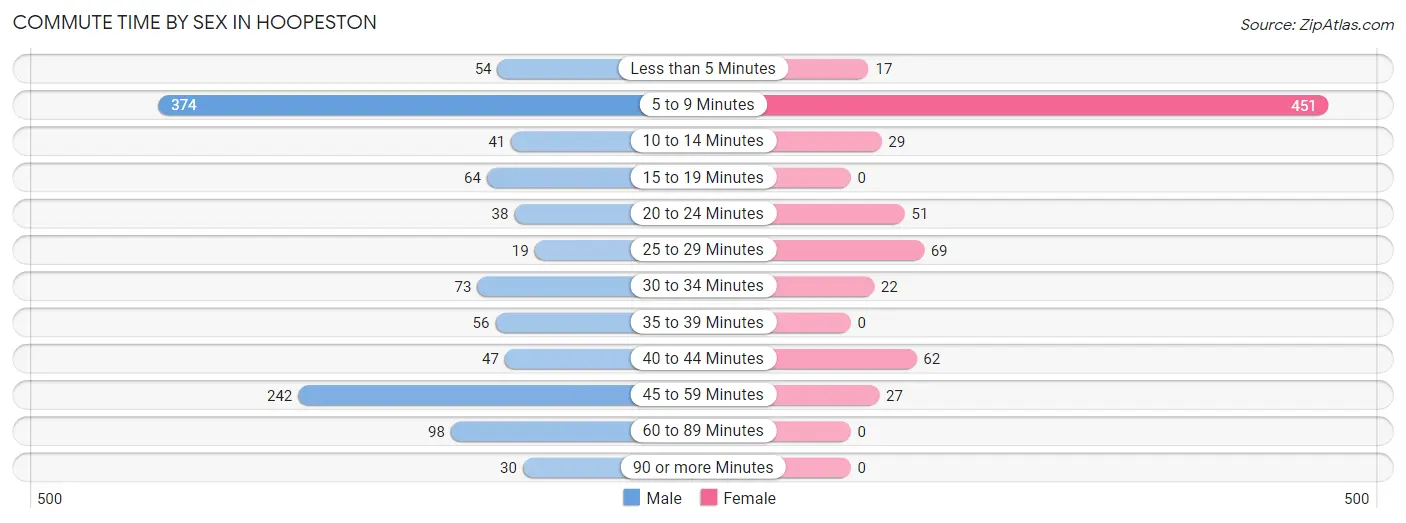
| Commute Time | Male | Female |
| Less than 5 Minutes | 54 (4.8%) | 17 (2.3%) |
| 5 to 9 Minutes | 374 (32.9%) | 451 (62.0%) |
| 10 to 14 Minutes | 41 (3.6%) | 29 (4.0%) |
| 15 to 19 Minutes | 64 (5.6%) | 0 (0.0%) |
| 20 to 24 Minutes | 38 (3.4%) | 51 (7.0%) |
| 25 to 29 Minutes | 19 (1.7%) | 69 (9.5%) |
| 30 to 34 Minutes | 73 (6.4%) | 22 (3.0%) |
| 35 to 39 Minutes | 56 (4.9%) | 0 (0.0%) |
| 40 to 44 Minutes | 47 (4.1%) | 62 (8.5%) |
| 45 to 59 Minutes | 242 (21.3%) | 27 (3.7%) |
| 60 to 89 Minutes | 98 (8.6%) | 0 (0.0%) |
| 90 or more Minutes | 30 (2.6%) | 0 (0.0%) |
Time of Departure to Work by Sex in Hoopeston
The most frequent times of departure to work in Hoopeston are 5:00 AM to 5:29 AM (271, 23.9%) for males and 4:00 PM to 11:59 PM (126, 17.3%) for females.
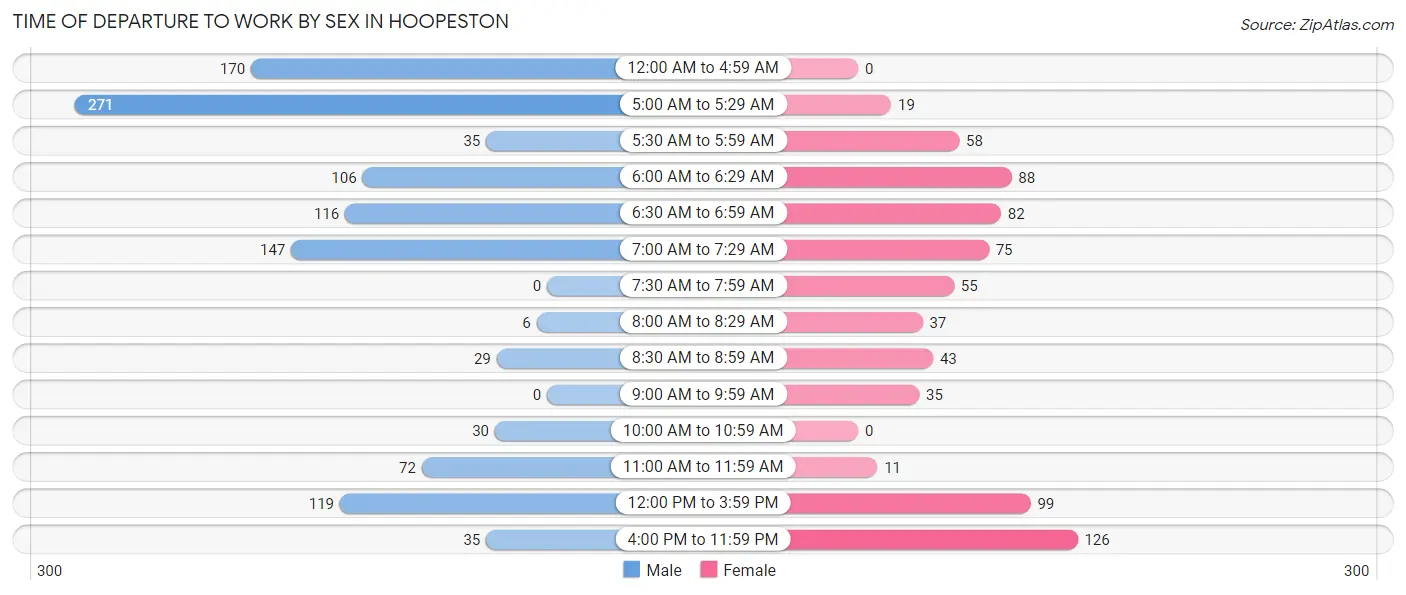
| Time of Departure | Male | Female |
| 12:00 AM to 4:59 AM | 170 (15.0%) | 0 (0.0%) |
| 5:00 AM to 5:29 AM | 271 (23.9%) | 19 (2.6%) |
| 5:30 AM to 5:59 AM | 35 (3.1%) | 58 (8.0%) |
| 6:00 AM to 6:29 AM | 106 (9.3%) | 88 (12.1%) |
| 6:30 AM to 6:59 AM | 116 (10.2%) | 82 (11.3%) |
| 7:00 AM to 7:29 AM | 147 (12.9%) | 75 (10.3%) |
| 7:30 AM to 7:59 AM | 0 (0.0%) | 55 (7.5%) |
| 8:00 AM to 8:29 AM | 6 (0.5%) | 37 (5.1%) |
| 8:30 AM to 8:59 AM | 29 (2.5%) | 43 (5.9%) |
| 9:00 AM to 9:59 AM | 0 (0.0%) | 35 (4.8%) |
| 10:00 AM to 10:59 AM | 30 (2.6%) | 0 (0.0%) |
| 11:00 AM to 11:59 AM | 72 (6.3%) | 11 (1.5%) |
| 12:00 PM to 3:59 PM | 119 (10.5%) | 99 (13.6%) |
| 4:00 PM to 11:59 PM | 35 (3.1%) | 126 (17.3%) |
| Total | 1,136 (100.0%) | 728 (100.0%) |
Housing Occupancy in Hoopeston
Occupancy by Ownership in Hoopeston
Of the total 2,099 dwellings in Hoopeston, owner-occupied units account for 1,402 (66.8%), while renter-occupied units make up 697 (33.2%).
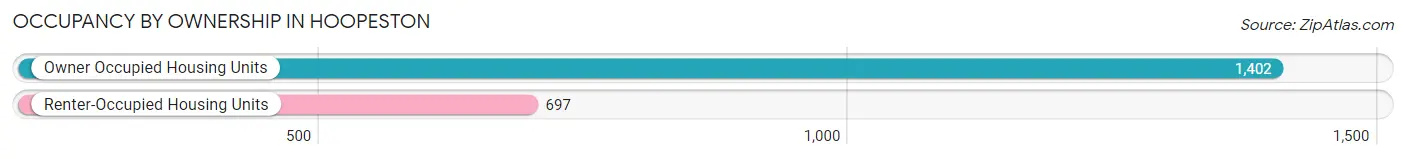
| Occupancy | # Housing Units | % Housing Units |
| Owner Occupied Housing Units | 1,402 | 66.8% |
| Renter-Occupied Housing Units | 697 | 33.2% |
| Total Occupied Housing Units | 2,099 | 100.0% |
Occupancy by Household Size in Hoopeston
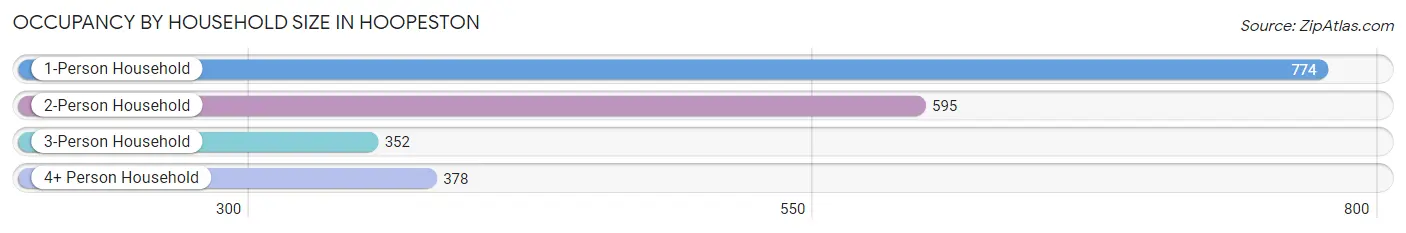
| Household Size | # Housing Units | % Housing Units |
| 1-Person Household | 774 | 36.9% |
| 2-Person Household | 595 | 28.3% |
| 3-Person Household | 352 | 16.8% |
| 4+ Person Household | 378 | 18.0% |
| Total Housing Units | 2,099 | 100.0% |
Occupancy by Ownership by Household Size in Hoopeston
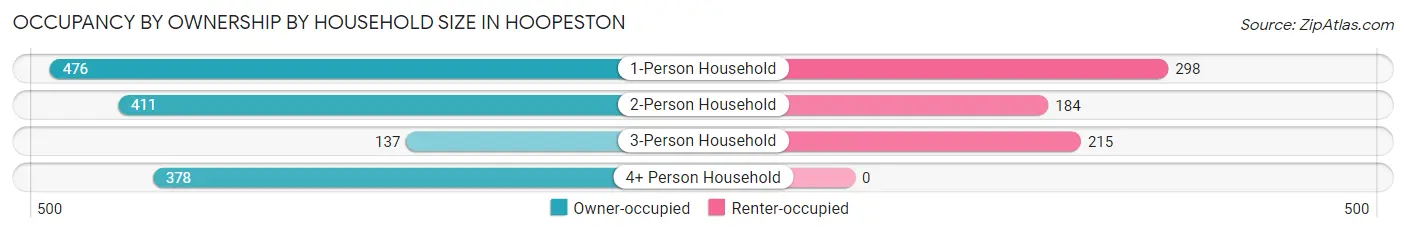
| Household Size | Owner-occupied | Renter-occupied |
| 1-Person Household | 476 (61.5%) | 298 (38.5%) |
| 2-Person Household | 411 (69.1%) | 184 (30.9%) |
| 3-Person Household | 137 (38.9%) | 215 (61.1%) |
| 4+ Person Household | 378 (100.0%) | 0 (0.0%) |
| Total Housing Units | 1,402 (66.8%) | 697 (33.2%) |
Occupancy by Educational Attainment in Hoopeston
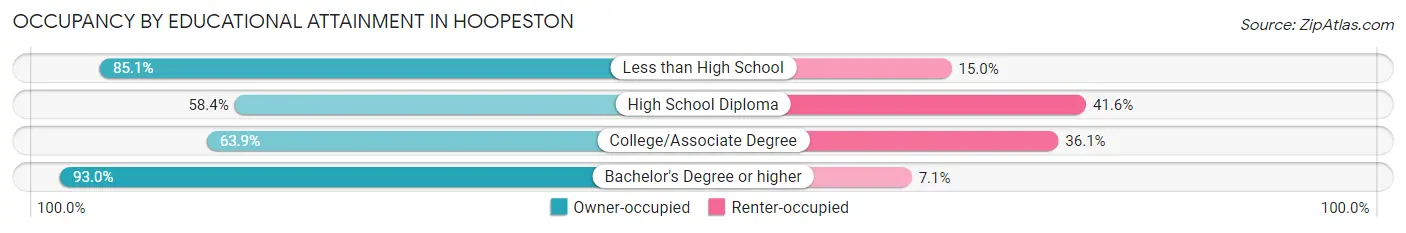
| Household Size | Owner-occupied | Renter-occupied |
| Less than High School | 239 (85.1%) | 42 (14.9%) |
| High School Diploma | 463 (58.4%) | 330 (41.6%) |
| College/Associate Degree | 555 (63.9%) | 314 (36.1%) |
| Bachelor's Degree or higher | 145 (92.9%) | 11 (7.0%) |
Occupancy by Age of Householder in Hoopeston
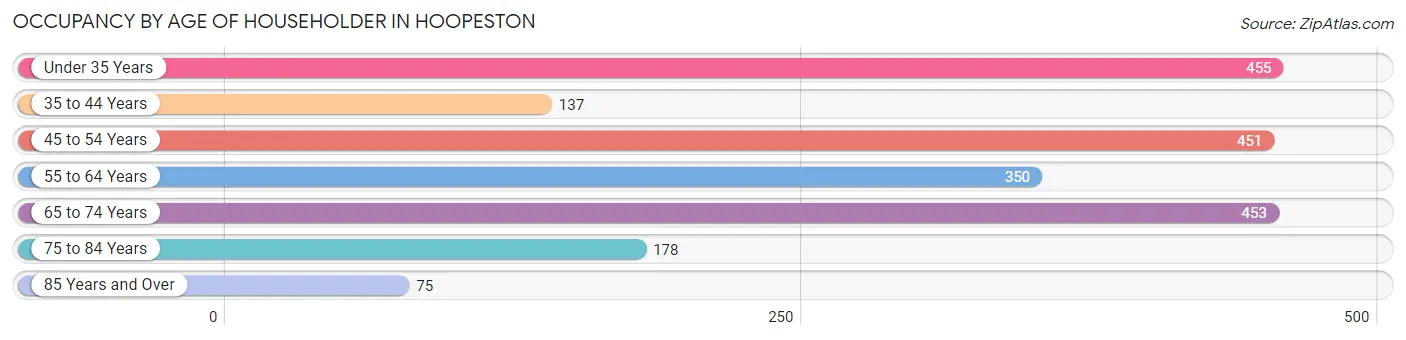
| Age Bracket | # Households | % Households |
| Under 35 Years | 455 | 21.7% |
| 35 to 44 Years | 137 | 6.5% |
| 45 to 54 Years | 451 | 21.5% |
| 55 to 64 Years | 350 | 16.7% |
| 65 to 74 Years | 453 | 21.6% |
| 75 to 84 Years | 178 | 8.5% |
| 85 Years and Over | 75 | 3.6% |
| Total | 2,099 | 100.0% |
Housing Finances in Hoopeston
Median Income by Occupancy in Hoopeston
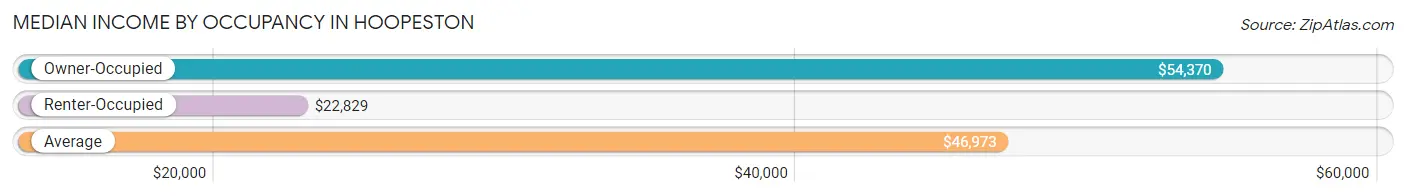
| Occupancy Type | # Households | Median Income |
| Owner-Occupied | 1,402 (66.8%) | $54,370 |
| Renter-Occupied | 697 (33.2%) | $22,829 |
| Average | 2,099 (100.0%) | $46,973 |
Occupancy by Householder Income Bracket in Hoopeston
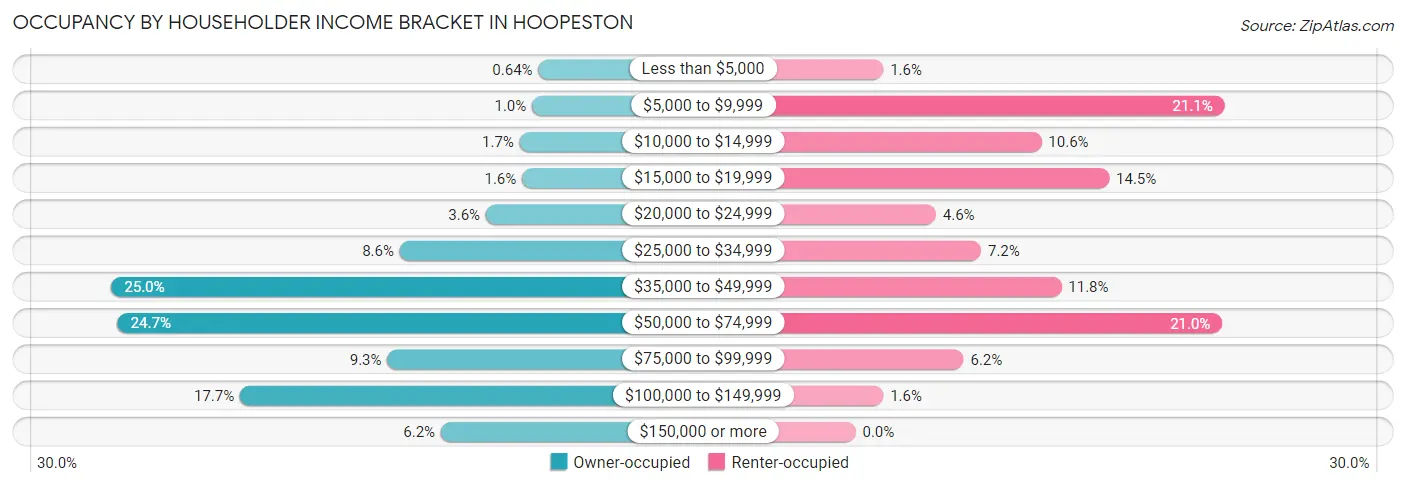
| Income Bracket | Owner-occupied | Renter-occupied |
| Less than $5,000 | 9 (0.6%) | 11 (1.6%) |
| $5,000 to $9,999 | 14 (1.0%) | 147 (21.1%) |
| $10,000 to $14,999 | 24 (1.7%) | 74 (10.6%) |
| $15,000 to $19,999 | 22 (1.6%) | 101 (14.5%) |
| $20,000 to $24,999 | 51 (3.6%) | 32 (4.6%) |
| $25,000 to $34,999 | 120 (8.6%) | 50 (7.2%) |
| $35,000 to $49,999 | 351 (25.0%) | 82 (11.8%) |
| $50,000 to $74,999 | 346 (24.7%) | 146 (20.9%) |
| $75,000 to $99,999 | 130 (9.3%) | 43 (6.2%) |
| $100,000 to $149,999 | 248 (17.7%) | 11 (1.6%) |
| $150,000 or more | 87 (6.2%) | 0 (0.0%) |
| Total | 1,402 (100.0%) | 697 (100.0%) |
Monthly Housing Cost Tiers in Hoopeston
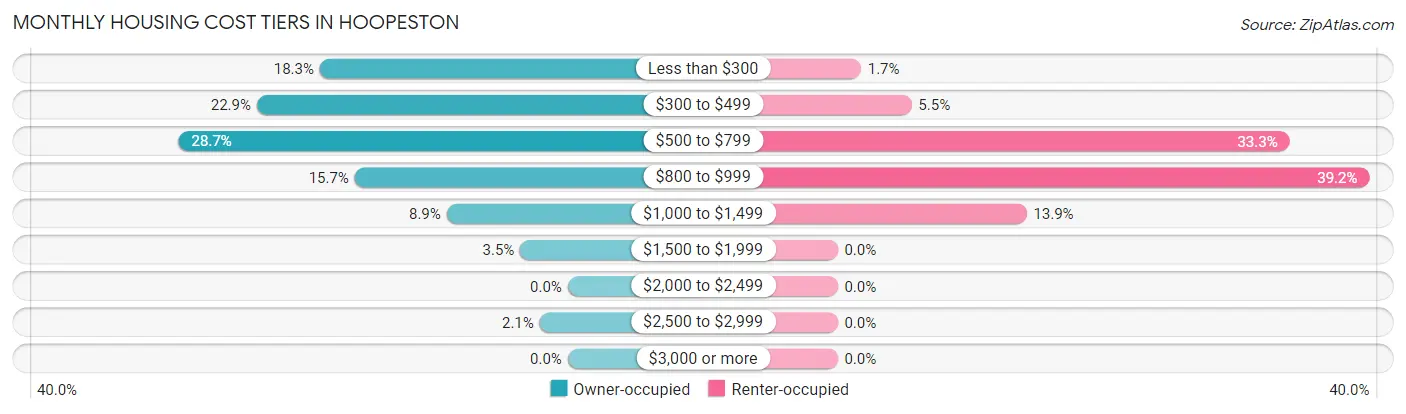
| Monthly Cost | Owner-occupied | Renter-occupied |
| Less than $300 | 256 (18.3%) | 12 (1.7%) |
| $300 to $499 | 321 (22.9%) | 38 (5.4%) |
| $500 to $799 | 402 (28.7%) | 232 (33.3%) |
| $800 to $999 | 220 (15.7%) | 273 (39.2%) |
| $1,000 to $1,499 | 125 (8.9%) | 97 (13.9%) |
| $1,500 to $1,999 | 49 (3.5%) | 0 (0.0%) |
| $2,000 to $2,499 | 0 (0.0%) | 0 (0.0%) |
| $2,500 to $2,999 | 29 (2.1%) | 0 (0.0%) |
| $3,000 or more | 0 (0.0%) | 0 (0.0%) |
| Total | 1,402 (100.0%) | 697 (100.0%) |
Physical Housing Characteristics in Hoopeston
Housing Structures in Hoopeston
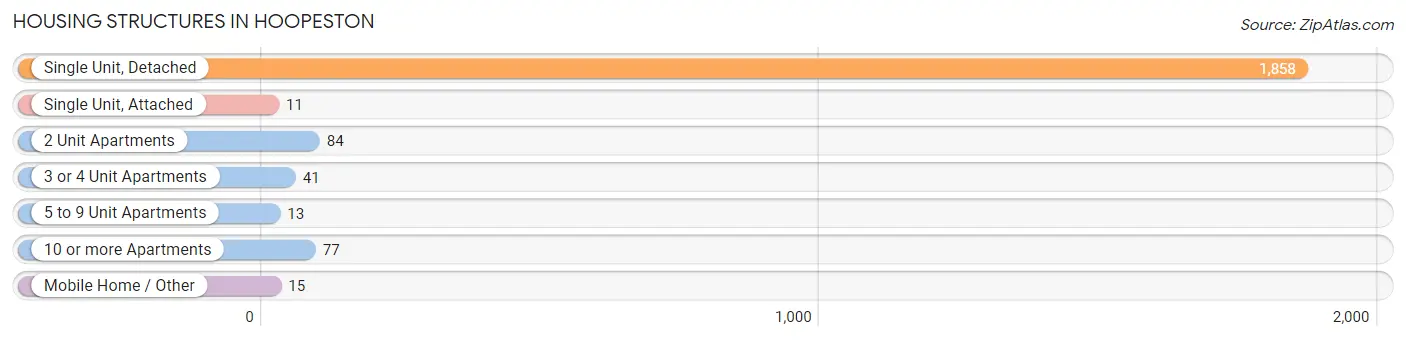
| Structure Type | # Housing Units | % Housing Units |
| Single Unit, Detached | 1,858 | 88.5% |
| Single Unit, Attached | 11 | 0.5% |
| 2 Unit Apartments | 84 | 4.0% |
| 3 or 4 Unit Apartments | 41 | 1.9% |
| 5 to 9 Unit Apartments | 13 | 0.6% |
| 10 or more Apartments | 77 | 3.7% |
| Mobile Home / Other | 15 | 0.7% |
| Total | 2,099 | 100.0% |
Housing Structures by Occupancy in Hoopeston
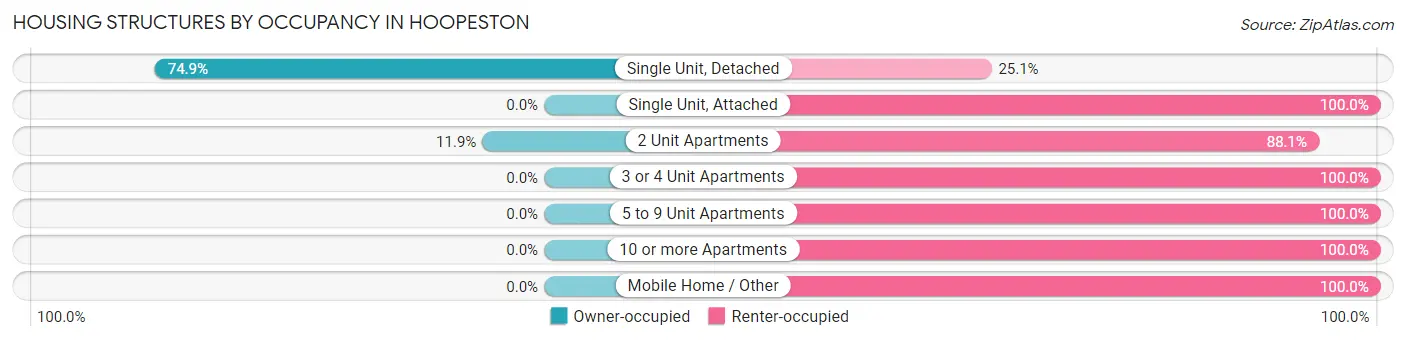
| Structure Type | Owner-occupied | Renter-occupied |
| Single Unit, Detached | 1,392 (74.9%) | 466 (25.1%) |
| Single Unit, Attached | 0 (0.0%) | 11 (100.0%) |
| 2 Unit Apartments | 10 (11.9%) | 74 (88.1%) |
| 3 or 4 Unit Apartments | 0 (0.0%) | 41 (100.0%) |
| 5 to 9 Unit Apartments | 0 (0.0%) | 13 (100.0%) |
| 10 or more Apartments | 0 (0.0%) | 77 (100.0%) |
| Mobile Home / Other | 0 (0.0%) | 15 (100.0%) |
| Total | 1,402 (66.8%) | 697 (33.2%) |
Housing Structures by Number of Rooms in Hoopeston
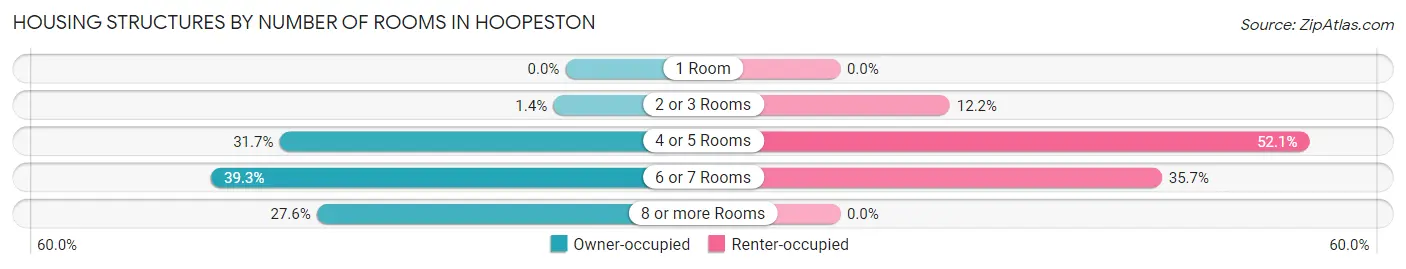
| Number of Rooms | Owner-occupied | Renter-occupied |
| 1 Room | 0 (0.0%) | 0 (0.0%) |
| 2 or 3 Rooms | 19 (1.4%) | 85 (12.2%) |
| 4 or 5 Rooms | 445 (31.7%) | 363 (52.1%) |
| 6 or 7 Rooms | 551 (39.3%) | 249 (35.7%) |
| 8 or more Rooms | 387 (27.6%) | 0 (0.0%) |
| Total | 1,402 (100.0%) | 697 (100.0%) |
Housing Structure by Heating Type in Hoopeston
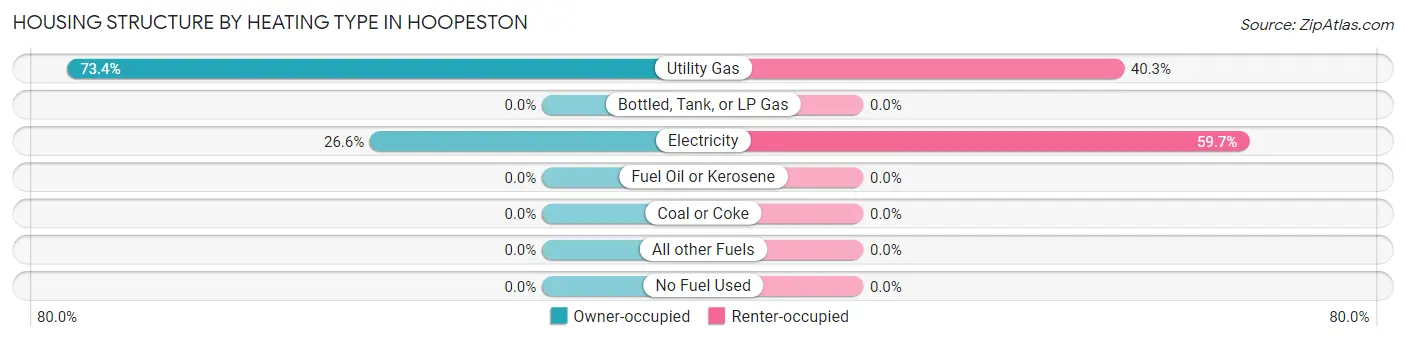
| Heating Type | Owner-occupied | Renter-occupied |
| Utility Gas | 1,029 (73.4%) | 281 (40.3%) |
| Bottled, Tank, or LP Gas | 0 (0.0%) | 0 (0.0%) |
| Electricity | 373 (26.6%) | 416 (59.7%) |
| Fuel Oil or Kerosene | 0 (0.0%) | 0 (0.0%) |
| Coal or Coke | 0 (0.0%) | 0 (0.0%) |
| All other Fuels | 0 (0.0%) | 0 (0.0%) |
| No Fuel Used | 0 (0.0%) | 0 (0.0%) |
| Total | 1,402 (100.0%) | 697 (100.0%) |
Household Vehicle Usage in Hoopeston
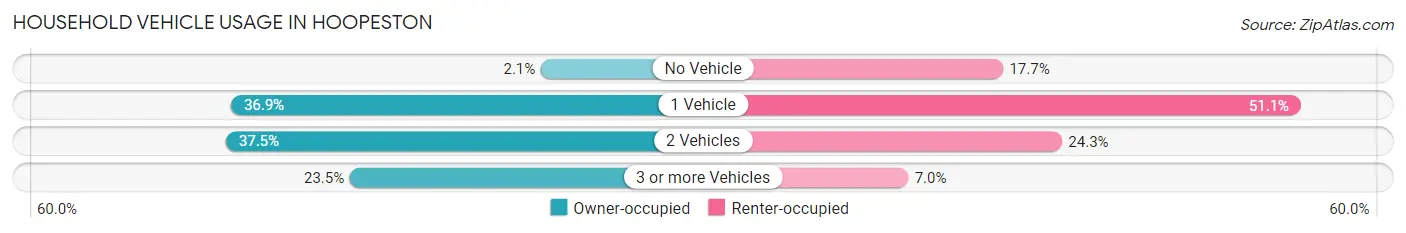
| Vehicles per Household | Owner-occupied | Renter-occupied |
| No Vehicle | 30 (2.1%) | 123 (17.6%) |
| 1 Vehicle | 517 (36.9%) | 356 (51.1%) |
| 2 Vehicles | 525 (37.4%) | 169 (24.2%) |
| 3 or more Vehicles | 330 (23.5%) | 49 (7.0%) |
| Total | 1,402 (100.0%) | 697 (100.0%) |
Real Estate & Mortgages in Hoopeston
Real Estate and Mortgage Overview in Hoopeston
| Characteristic | Without Mortgage | With Mortgage |
| Housing Units | 827 | 575 |
| Median Property Value | $65,100 | $76,500 |
| Median Household Income | $54,970 | $67 |
| Monthly Housing Costs | $418 | $0 |
| Real Estate Taxes | $749 | $48 |
Property Value by Mortgage Status in Hoopeston
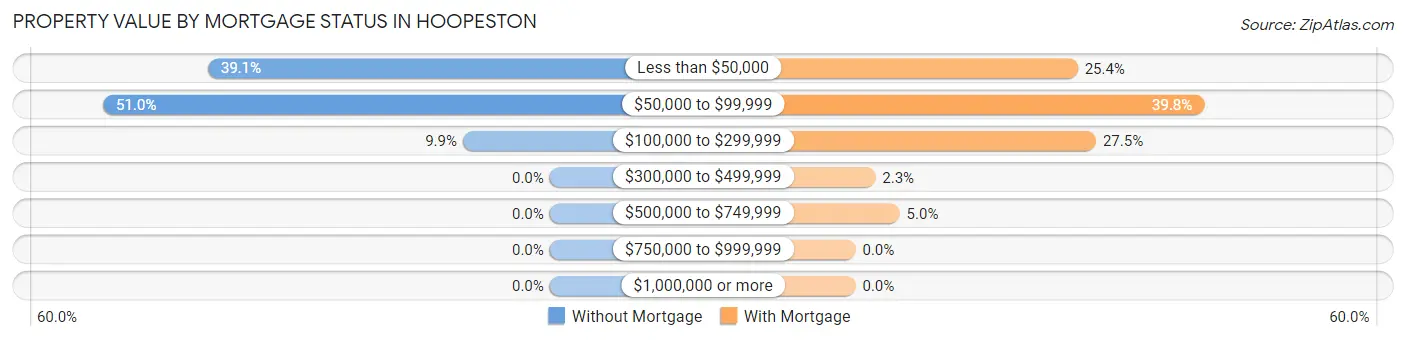
| Property Value | Without Mortgage | With Mortgage |
| Less than $50,000 | 323 (39.1%) | 146 (25.4%) |
| $50,000 to $99,999 | 422 (51.0%) | 229 (39.8%) |
| $100,000 to $299,999 | 82 (9.9%) | 158 (27.5%) |
| $300,000 to $499,999 | 0 (0.0%) | 13 (2.3%) |
| $500,000 to $749,999 | 0 (0.0%) | 29 (5.0%) |
| $750,000 to $999,999 | 0 (0.0%) | 0 (0.0%) |
| $1,000,000 or more | 0 (0.0%) | 0 (0.0%) |
| Total | 827 (100.0%) | 575 (100.0%) |
Household Income by Mortgage Status in Hoopeston
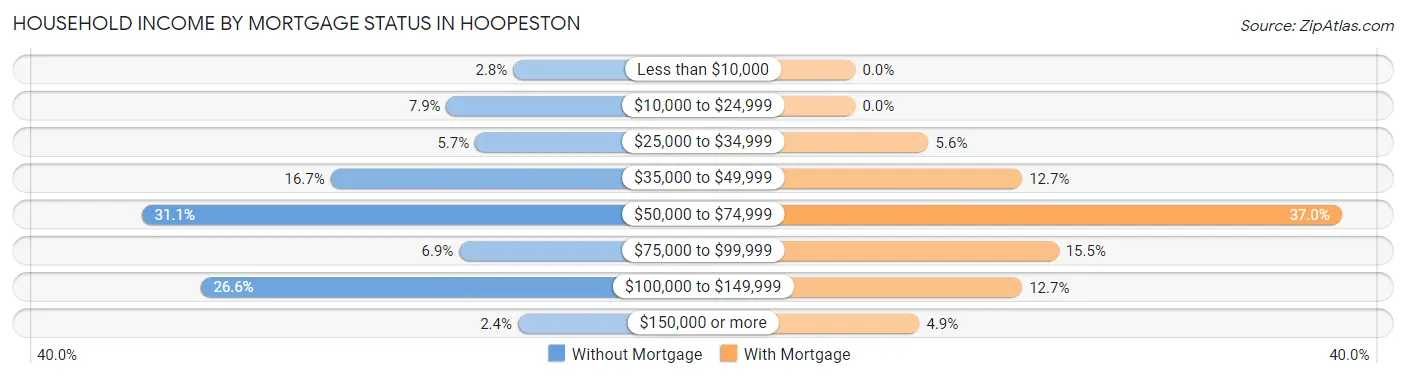
| Household Income | Without Mortgage | With Mortgage |
| Less than $10,000 | 23 (2.8%) | 0 (0.0%) |
| $10,000 to $24,999 | 65 (7.9%) | 0 (0.0%) |
| $25,000 to $34,999 | 47 (5.7%) | 32 (5.6%) |
| $35,000 to $49,999 | 138 (16.7%) | 73 (12.7%) |
| $50,000 to $74,999 | 257 (31.1%) | 213 (37.0%) |
| $75,000 to $99,999 | 57 (6.9%) | 89 (15.5%) |
| $100,000 to $149,999 | 220 (26.6%) | 73 (12.7%) |
| $150,000 or more | 20 (2.4%) | 28 (4.9%) |
| Total | 827 (100.0%) | 575 (100.0%) |
Property Value to Household Income Ratio in Hoopeston
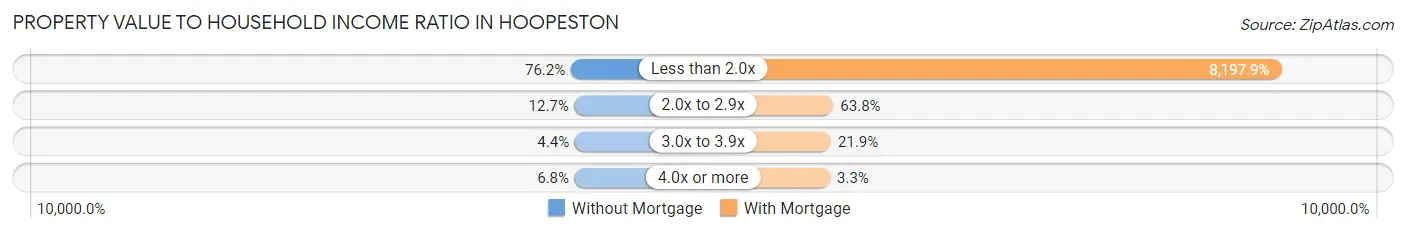
| Value-to-Income Ratio | Without Mortgage | With Mortgage |
| Less than 2.0x | 630 (76.2%) | 47,138 (8,197.9%) |
| 2.0x to 2.9x | 105 (12.7%) | 367 (63.8%) |
| 3.0x to 3.9x | 36 (4.3%) | 126 (21.9%) |
| 4.0x or more | 56 (6.8%) | 19 (3.3%) |
| Total | 827 (100.0%) | 575 (100.0%) |
Real Estate Taxes by Mortgage Status in Hoopeston
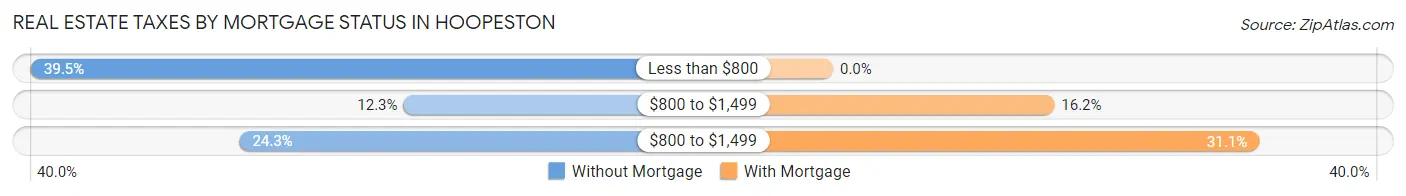
| Property Taxes | Without Mortgage | With Mortgage |
| Less than $800 | 327 (39.5%) | 0 (0.0%) |
| $800 to $1,499 | 102 (12.3%) | 93 (16.2%) |
| $800 to $1,499 | 201 (24.3%) | 179 (31.1%) |
| Total | 827 (100.0%) | 575 (100.0%) |
Health & Disability in Hoopeston
Health Insurance Coverage by Age in Hoopeston
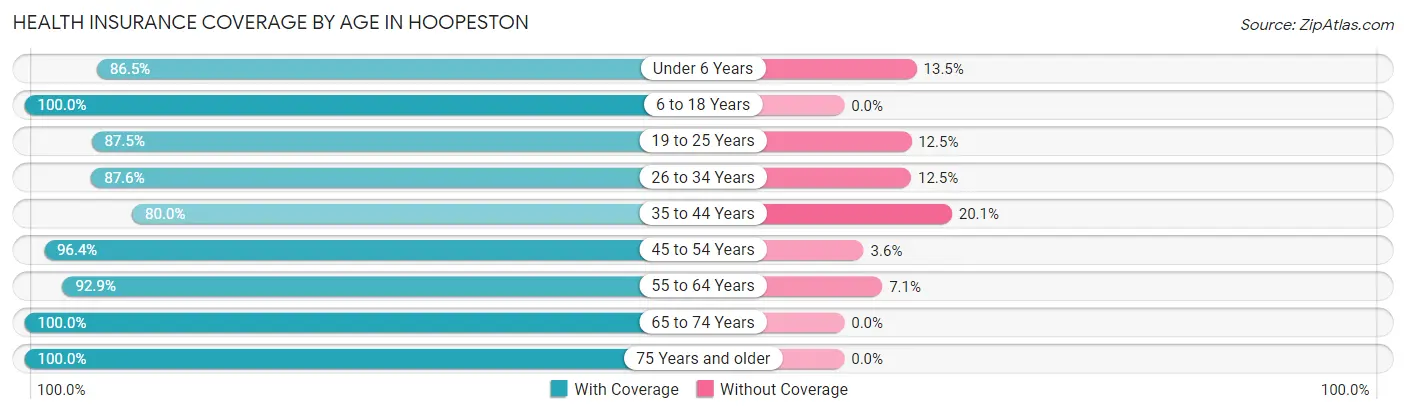
| Age Bracket | With Coverage | Without Coverage |
| Under 6 Years | 186 (86.5%) | 29 (13.5%) |
| 6 to 18 Years | 814 (100.0%) | 0 (0.0%) |
| 19 to 25 Years | 449 (87.5%) | 64 (12.5%) |
| 26 to 34 Years | 478 (87.5%) | 68 (12.4%) |
| 35 to 44 Years | 331 (79.9%) | 83 (20.1%) |
| 45 to 54 Years | 802 (96.4%) | 30 (3.6%) |
| 55 to 64 Years | 565 (92.9%) | 43 (7.1%) |
| 65 to 74 Years | 603 (100.0%) | 0 (0.0%) |
| 75 Years and older | 320 (100.0%) | 0 (0.0%) |
| Total | 4,548 (93.5%) | 317 (6.5%) |
Health Insurance Coverage by Citizenship Status in Hoopeston
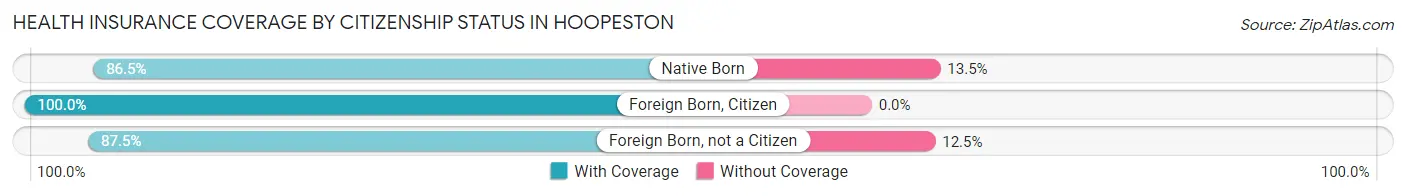
| Citizenship Status | With Coverage | Without Coverage |
| Native Born | 186 (86.5%) | 29 (13.5%) |
| Foreign Born, Citizen | 814 (100.0%) | 0 (0.0%) |
| Foreign Born, not a Citizen | 449 (87.5%) | 64 (12.5%) |
Health Insurance Coverage by Household Income in Hoopeston
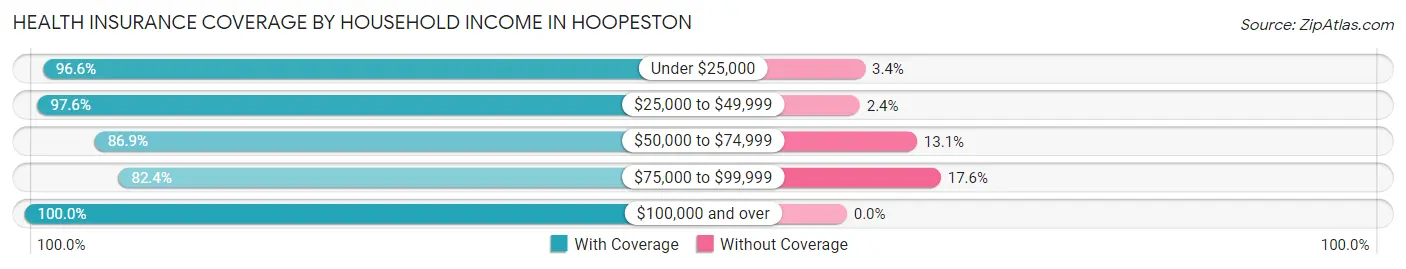
| Household Income | With Coverage | Without Coverage |
| Under $25,000 | 901 (96.6%) | 32 (3.4%) |
| $25,000 to $49,999 | 1,203 (97.6%) | 30 (2.4%) |
| $50,000 to $74,999 | 1,005 (86.9%) | 152 (13.1%) |
| $75,000 to $99,999 | 482 (82.4%) | 103 (17.6%) |
| $100,000 and over | 957 (100.0%) | 0 (0.0%) |
Public vs Private Health Insurance Coverage by Age in Hoopeston
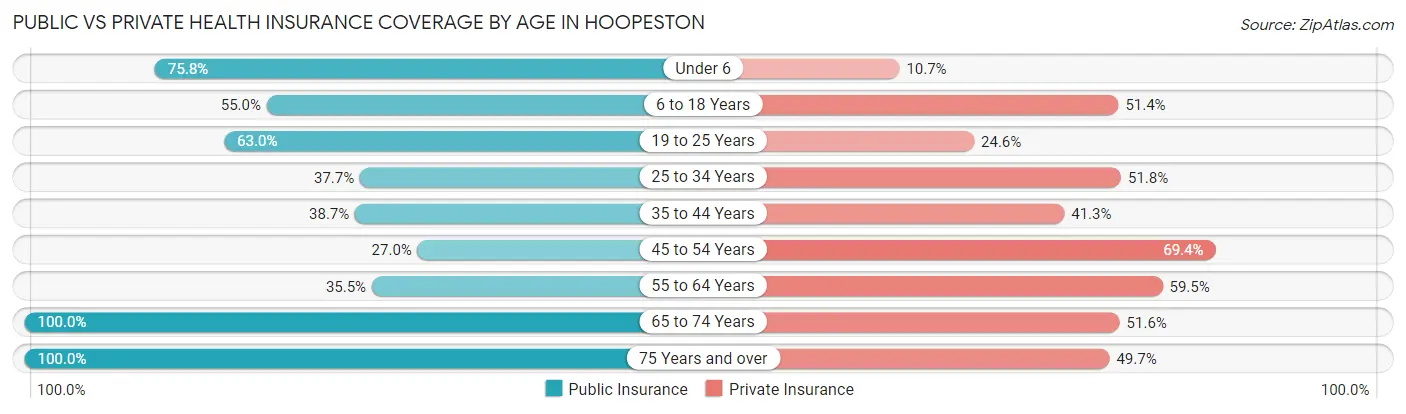
| Age Bracket | Public Insurance | Private Insurance |
| Under 6 | 163 (75.8%) | 23 (10.7%) |
| 6 to 18 Years | 448 (55.0%) | 418 (51.3%) |
| 19 to 25 Years | 323 (63.0%) | 126 (24.6%) |
| 25 to 34 Years | 206 (37.7%) | 283 (51.8%) |
| 35 to 44 Years | 160 (38.7%) | 171 (41.3%) |
| 45 to 54 Years | 225 (27.0%) | 577 (69.4%) |
| 55 to 64 Years | 216 (35.5%) | 362 (59.5%) |
| 65 to 74 Years | 603 (100.0%) | 311 (51.6%) |
| 75 Years and over | 320 (100.0%) | 159 (49.7%) |
| Total | 2,664 (54.8%) | 2,430 (49.9%) |
Disability Status by Sex by Age in Hoopeston
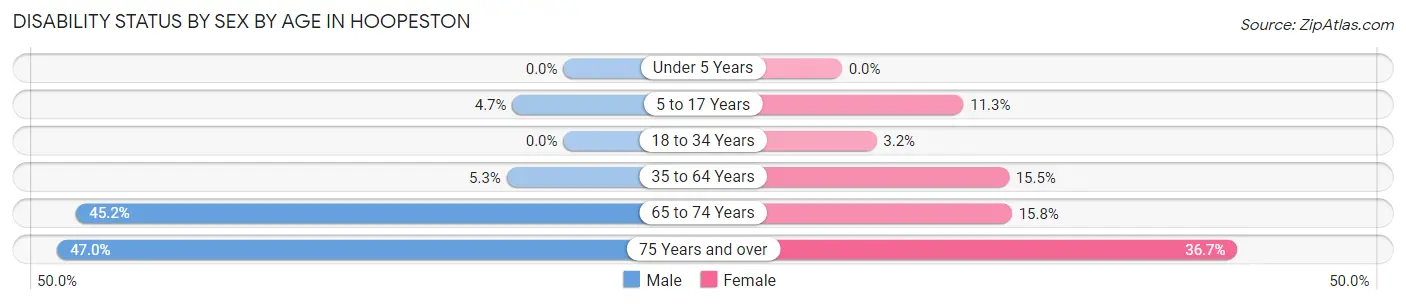
| Age Bracket | Male | Female |
| Under 5 Years | 0 (0.0%) | 0 (0.0%) |
| 5 to 17 Years | 15 (4.7%) | 52 (11.3%) |
| 18 to 34 Years | 0 (0.0%) | 17 (3.2%) |
| 35 to 64 Years | 50 (5.3%) | 140 (15.5%) |
| 65 to 74 Years | 155 (45.2%) | 41 (15.8%) |
| 75 Years and over | 62 (47.0%) | 69 (36.7%) |
Disability Class by Sex by Age in Hoopeston
Disability Class: Hearing Difficulty
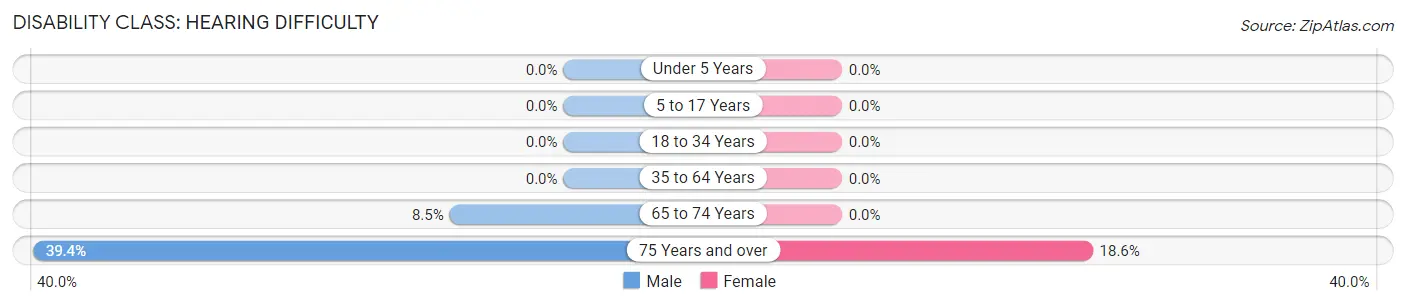
| Age Bracket | Male | Female |
| Under 5 Years | 0 (0.0%) | 0 (0.0%) |
| 5 to 17 Years | 0 (0.0%) | 0 (0.0%) |
| 18 to 34 Years | 0 (0.0%) | 0 (0.0%) |
| 35 to 64 Years | 0 (0.0%) | 0 (0.0%) |
| 65 to 74 Years | 29 (8.5%) | 0 (0.0%) |
| 75 Years and over | 52 (39.4%) | 35 (18.6%) |
Disability Class: Vision Difficulty
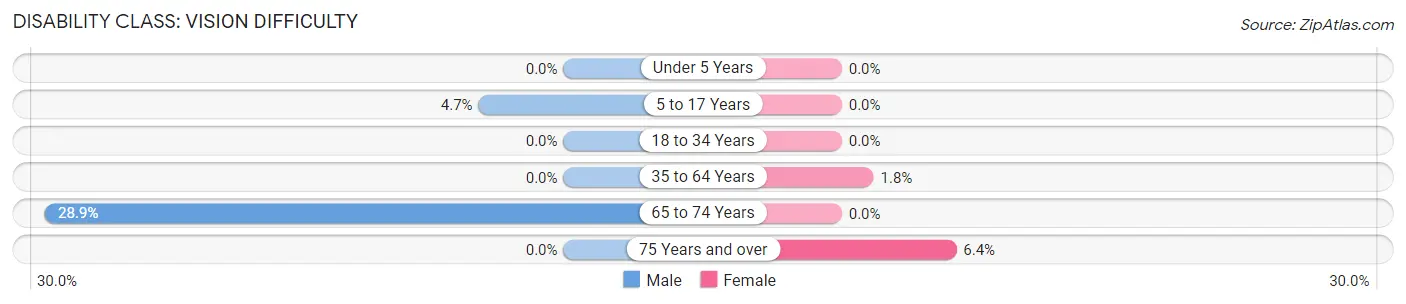
| Age Bracket | Male | Female |
| Under 5 Years | 0 (0.0%) | 0 (0.0%) |
| 5 to 17 Years | 15 (4.7%) | 0 (0.0%) |
| 18 to 34 Years | 0 (0.0%) | 0 (0.0%) |
| 35 to 64 Years | 0 (0.0%) | 16 (1.8%) |
| 65 to 74 Years | 99 (28.9%) | 0 (0.0%) |
| 75 Years and over | 0 (0.0%) | 12 (6.4%) |
Disability Class: Cognitive Difficulty
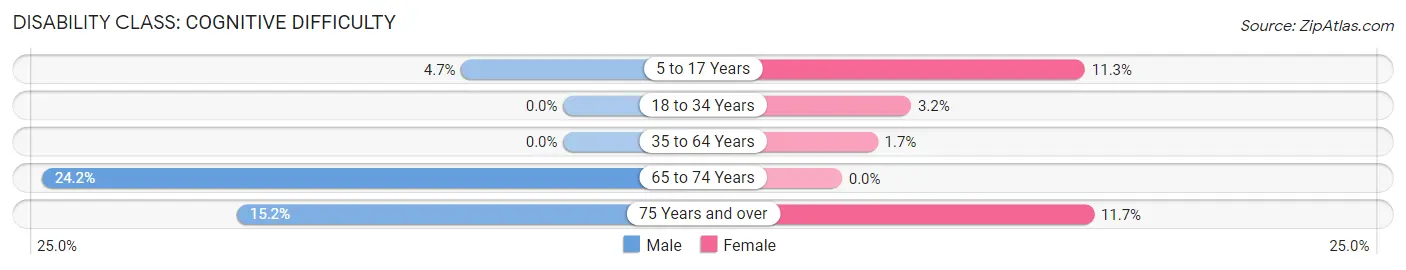
| Age Bracket | Male | Female |
| 5 to 17 Years | 15 (4.7%) | 52 (11.3%) |
| 18 to 34 Years | 0 (0.0%) | 17 (3.2%) |
| 35 to 64 Years | 0 (0.0%) | 15 (1.7%) |
| 65 to 74 Years | 83 (24.2%) | 0 (0.0%) |
| 75 Years and over | 20 (15.1%) | 22 (11.7%) |
Disability Class: Ambulatory Difficulty
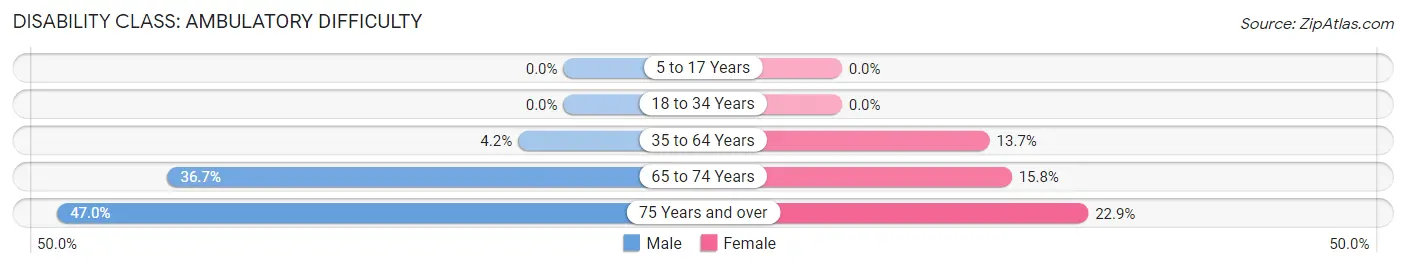
| Age Bracket | Male | Female |
| 5 to 17 Years | 0 (0.0%) | 0 (0.0%) |
| 18 to 34 Years | 0 (0.0%) | 0 (0.0%) |
| 35 to 64 Years | 40 (4.2%) | 124 (13.7%) |
| 65 to 74 Years | 126 (36.7%) | 41 (15.8%) |
| 75 Years and over | 62 (47.0%) | 43 (22.9%) |
Disability Class: Self-Care Difficulty
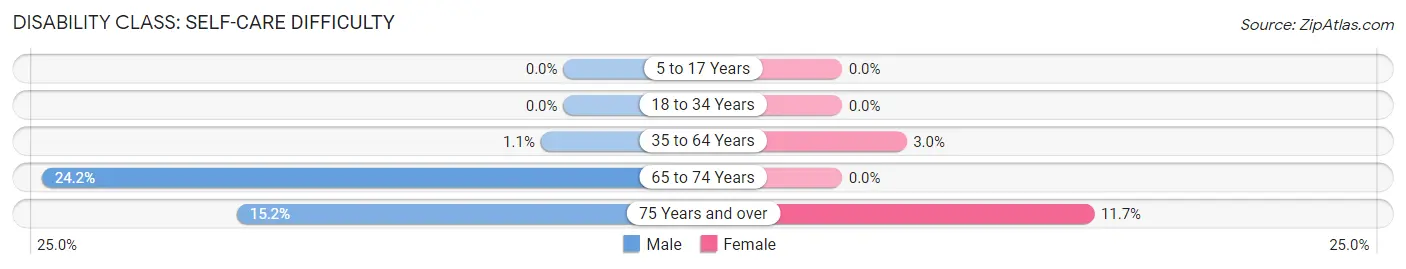
| Age Bracket | Male | Female |
| 5 to 17 Years | 0 (0.0%) | 0 (0.0%) |
| 18 to 34 Years | 0 (0.0%) | 0 (0.0%) |
| 35 to 64 Years | 10 (1.1%) | 27 (3.0%) |
| 65 to 74 Years | 83 (24.2%) | 0 (0.0%) |
| 75 Years and over | 20 (15.1%) | 22 (11.7%) |
Technology Access in Hoopeston
Computing Device Access in Hoopeston
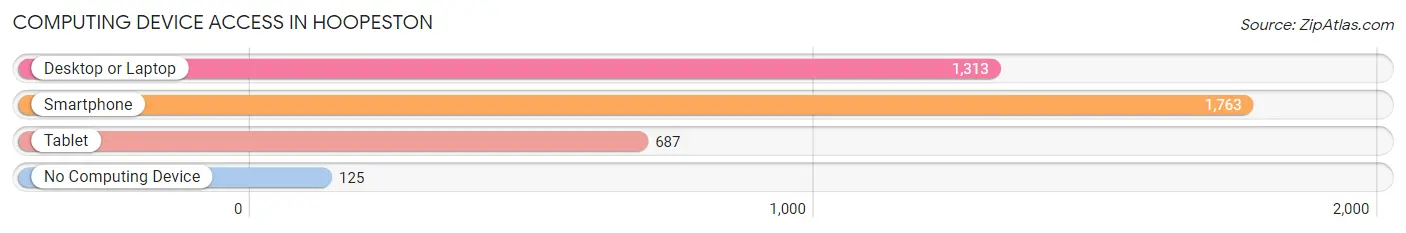
| Device Type | # Households | % Households |
| Desktop or Laptop | 1,313 | 62.5% |
| Smartphone | 1,763 | 84.0% |
| Tablet | 687 | 32.7% |
| No Computing Device | 125 | 6.0% |
| Total | 2,099 | 100.0% |
Internet Access in Hoopeston
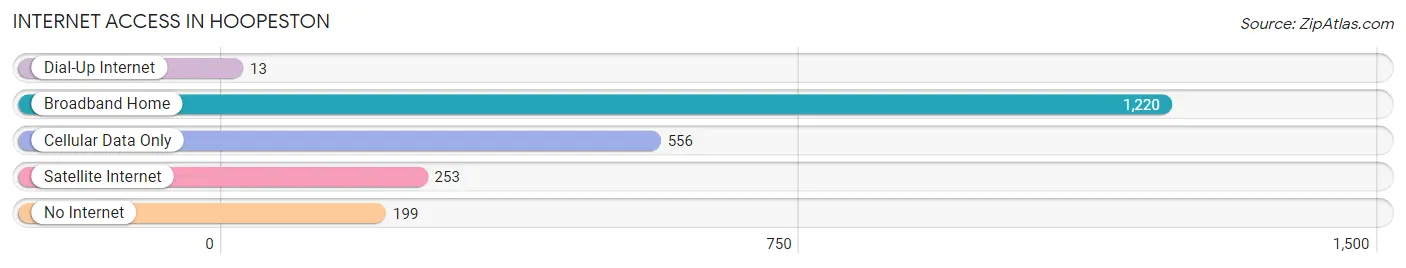
| Internet Type | # Households | % Households |
| Dial-Up Internet | 13 | 0.6% |
| Broadband Home | 1,220 | 58.1% |
| Cellular Data Only | 556 | 26.5% |
| Satellite Internet | 253 | 12.0% |
| No Internet | 199 | 9.5% |
| Total | 2,099 | 100.0% |
Hoopeston Summary
Hoopeston, Illinois is a small city located in Vermilion County, Illinois. It is situated in the eastern part of the state, about 60 miles south of Chicago. The city has a population of 5,351 as of the 2010 census, making it the second-largest city in Vermilion County.
Hoopeston was founded in 1871 by a group of settlers from Ohio. The city was named after the Hoopeston family, who were among the first settlers. The city was incorporated in 1875 and has since grown to become a thriving community.
Hoopeston is located in the heart of the Midwest, and is surrounded by some of the most fertile farmland in the country. The city is situated on the banks of the Vermilion River, which provides a source of recreation and transportation for the area.
The city is home to a variety of industries, including manufacturing, agriculture, and retail. The city is also home to a number of educational institutions, including a community college, a technical college, and a public school system.
Hoopeston is a diverse city, with a population that is made up of a variety of ethnic backgrounds. The city has a strong sense of community, and is home to a variety of churches, organizations, and businesses.
Geographically, Hoopeston is located in the eastern part of the state, about 60 miles south of Chicago. The city is situated on the banks of the Vermilion River, which provides a source of recreation and transportation for the area. The city is surrounded by some of the most fertile farmland in the country, and is home to a variety of industries, including manufacturing, agriculture, and retail.
The economy of Hoopeston is largely based on agriculture and manufacturing. The city is home to a variety of industries, including food processing, metal fabrication, and plastics manufacturing. The city is also home to a number of educational institutions, including a community college, a technical college, and a public school system.
The demographics of Hoopeston are diverse. The city has a population that is made up of a variety of ethnic backgrounds, including African American, Hispanic, Asian, and Native American. The city has a strong sense of community, and is home to a variety of churches, organizations, and businesses.
Hoopeston is a small city with a big heart. It is a thriving community that is home to a variety of industries, educational institutions, and a diverse population. The city is situated in the heart of the Midwest, and is surrounded by some of the most fertile farmland in the country. The city is a great place to live, work, and play, and is a great example of the American Dream.
Common Questions
What is Per Capita Income in Hoopeston?
Per Capita income in Hoopeston is $24,747.
What is the Median Family Income in Hoopeston?
Median Family Income in Hoopeston is $58,797.
What is the Median Household income in Hoopeston?
Median Household Income in Hoopeston is $46,973.
What is Income or Wage Gap in Hoopeston?
Income or Wage Gap in Hoopeston is 46.4%.
Women in Hoopeston earn 53.6 cents for every dollar earned by a man.
What is Inequality or Gini Index in Hoopeston?
Inequality or Gini Index in Hoopeston is 0.38.
What is the Total Population of Hoopeston?
Total Population of Hoopeston is 4,940.
What is the Total Male Population of Hoopeston?
Total Male Population of Hoopeston is 2,434.
What is the Total Female Population of Hoopeston?
Total Female Population of Hoopeston is 2,506.
What is the Ratio of Males per 100 Females in Hoopeston?
There are 97.13 Males per 100 Females in Hoopeston.
What is the Ratio of Females per 100 Males in Hoopeston?
There are 102.96 Females per 100 Males in Hoopeston.
What is the Median Population Age in Hoopeston?
Median Population Age in Hoopeston is 44.5 Years.
What is the Average Family Size in Hoopeston
Average Family Size in Hoopeston is 3.1 People.
What is the Average Household Size in Hoopeston
Average Household Size in Hoopeston is 2.3 People.
How Large is the Labor Force in Hoopeston?
There are 2,253 People in the Labor Forcein in Hoopeston.
What is the Percentage of People in the Labor Force in Hoopeston?
54.6% of People are in the Labor Force in Hoopeston.
What is the Unemployment Rate in Hoopeston?
Unemployment Rate in Hoopeston is 11.3%.