Ottawa, IL Map & Demographics
Ottawa Map
Ottawa Overview
$33,444
PER CAPITA INCOME
$79,792
AVG FAMILY INCOME
$67,940
AVG HOUSEHOLD INCOME
33.1%
WAGE / INCOME GAP [ % ]
66.9¢/ $1
WAGE / INCOME GAP [ $ ]
$11,270
FAMILY INCOME DEFICIT
0.44
INEQUALITY / GINI INDEX
18,708
TOTAL POPULATION
8,889
MALE POPULATION
9,819
FEMALE POPULATION
90.53
MALES / 100 FEMALES
110.46
FEMALES / 100 MALES
39.6
MEDIAN AGE
3.0
AVG FAMILY SIZE
2.4
AVG HOUSEHOLD SIZE
9,606
LABOR FORCE [ PEOPLE ]
64.4%
PERCENT IN LABOR FORCE
6.8%
UNEMPLOYMENT RATE
Ottawa Zip Codes
Ottawa Area Codes
Income in Ottawa
Income Overview in Ottawa
Per Capita Income in Ottawa is $33,444, while median incomes of families and households are $79,792 and $67,940 respectively.
| Characteristic | Number | Measure |
| Per Capita Income | 18,708 | $33,444 |
| Median Family Income | 4,497 | $79,792 |
| Mean Family Income | 4,497 | $96,332 |
| Median Household Income | 7,634 | $67,940 |
| Mean Household Income | 7,634 | $79,992 |
| Income Deficit | 4,497 | $11,270 |
| Wage / Income Gap (%) | 18,708 | 33.06% |
| Wage / Income Gap ($) | 18,708 | 66.94¢ per $1 |
| Gini / Inequality Index | 18,708 | 0.44 |
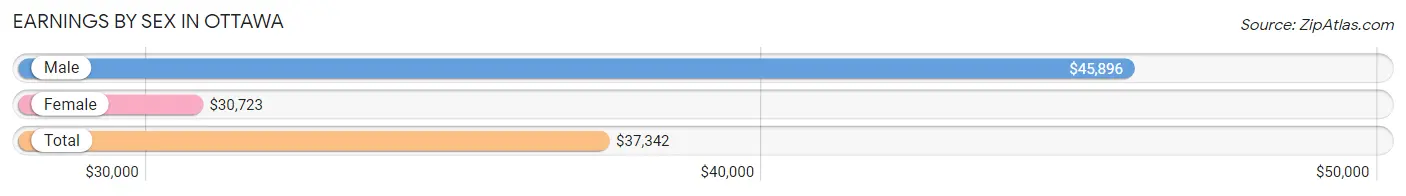
Earnings by Sex in Ottawa
Average Earnings in Ottawa are $37,342, $45,896 for men and $30,723 for women, a difference of 33.1%.
| Sex | Number | Average Earnings |
| Male | 5,155 (52.6%) | $45,896 |
| Female | 4,639 (47.4%) | $30,723 |
| Total | 9,794 (100.0%) | $37,342 |
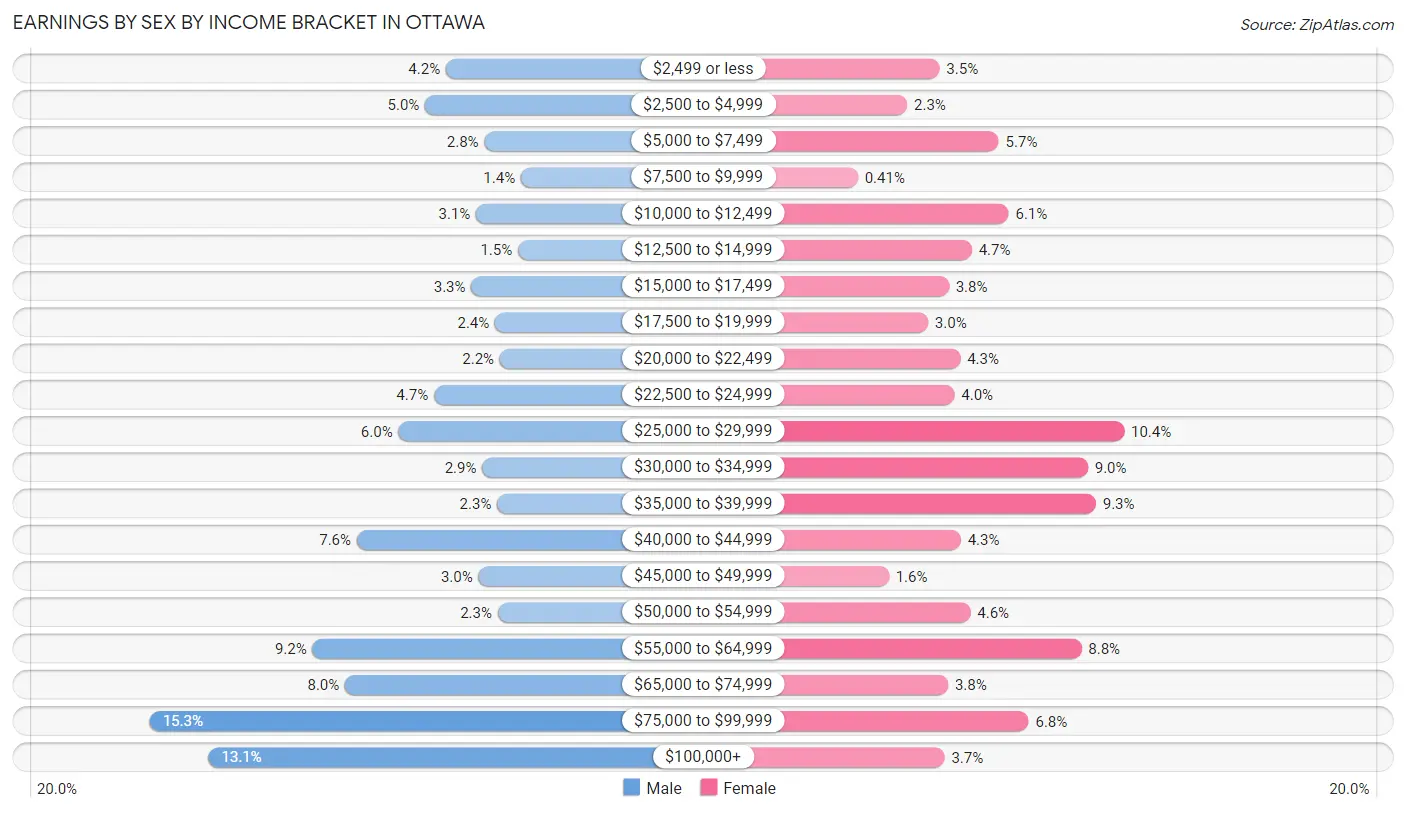
Earnings by Sex by Income Bracket in Ottawa
The most common earnings brackets in Ottawa are $75,000 to $99,999 for men (789 | 15.3%) and $25,000 to $29,999 for women (482 | 10.4%).
| Income | Male | Female |
| $2,499 or less | 217 (4.2%) | 161 (3.5%) |
| $2,500 to $4,999 | 257 (5.0%) | 105 (2.3%) |
| $5,000 to $7,499 | 143 (2.8%) | 264 (5.7%) |
| $7,500 to $9,999 | 72 (1.4%) | 19 (0.4%) |
| $10,000 to $12,499 | 159 (3.1%) | 281 (6.1%) |
| $12,500 to $14,999 | 78 (1.5%) | 217 (4.7%) |
| $15,000 to $17,499 | 168 (3.3%) | 177 (3.8%) |
| $17,500 to $19,999 | 122 (2.4%) | 141 (3.0%) |
| $20,000 to $22,499 | 113 (2.2%) | 197 (4.3%) |
| $22,500 to $24,999 | 240 (4.7%) | 187 (4.0%) |
| $25,000 to $29,999 | 309 (6.0%) | 482 (10.4%) |
| $30,000 to $34,999 | 147 (2.9%) | 419 (9.0%) |
| $35,000 to $39,999 | 118 (2.3%) | 433 (9.3%) |
| $40,000 to $44,999 | 389 (7.5%) | 198 (4.3%) |
| $45,000 to $49,999 | 154 (3.0%) | 73 (1.6%) |
| $50,000 to $54,999 | 117 (2.3%) | 215 (4.6%) |
| $55,000 to $64,999 | 475 (9.2%) | 408 (8.8%) |
| $65,000 to $74,999 | 412 (8.0%) | 176 (3.8%) |
| $75,000 to $99,999 | 789 (15.3%) | 316 (6.8%) |
| $100,000+ | 676 (13.1%) | 170 (3.7%) |
| Total | 5,155 (100.0%) | 4,639 (100.0%) |
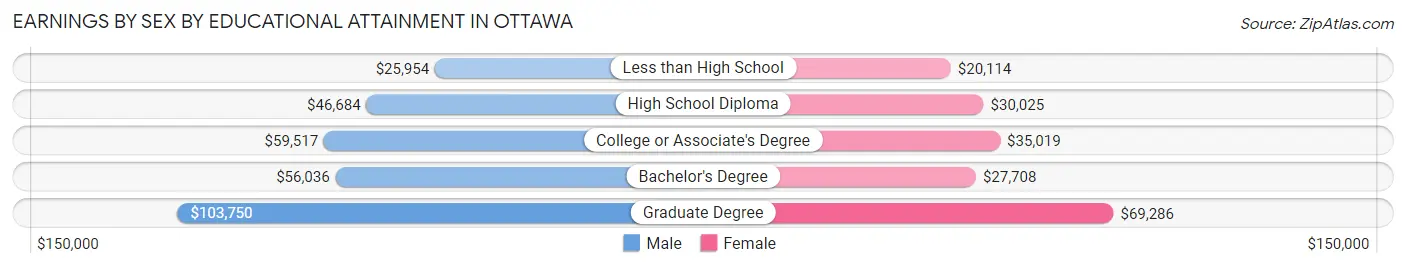
Earnings by Sex by Educational Attainment in Ottawa
Average earnings in Ottawa are $56,187 for men and $32,865 for women, a difference of 41.5%. Men with an educational attainment of graduate degree enjoy the highest average annual earnings of $103,750, while those with less than high school education earn the least with $25,954. Women with an educational attainment of graduate degree earn the most with the average annual earnings of $69,286, while those with less than high school education have the smallest earnings of $20,114.
| Educational Attainment | Male Income | Female Income |
| Less than High School | $25,954 | $20,114 |
| High School Diploma | $46,684 | $30,025 |
| College or Associate's Degree | $59,517 | $35,019 |
| Bachelor's Degree | $56,036 | $27,708 |
| Graduate Degree | $103,750 | $69,286 |
| Total | $56,187 | $32,865 |
Family Income in Ottawa
Family Income Brackets in Ottawa
According to the Ottawa family income data, there are 953 families falling into the $100,000 to $149,999 income range, which is the most common income bracket and makes up 21.2% of all families. Conversely, the less than $10,000 income bracket is the least frequent group with only 130 families (2.9%) belonging to this category.
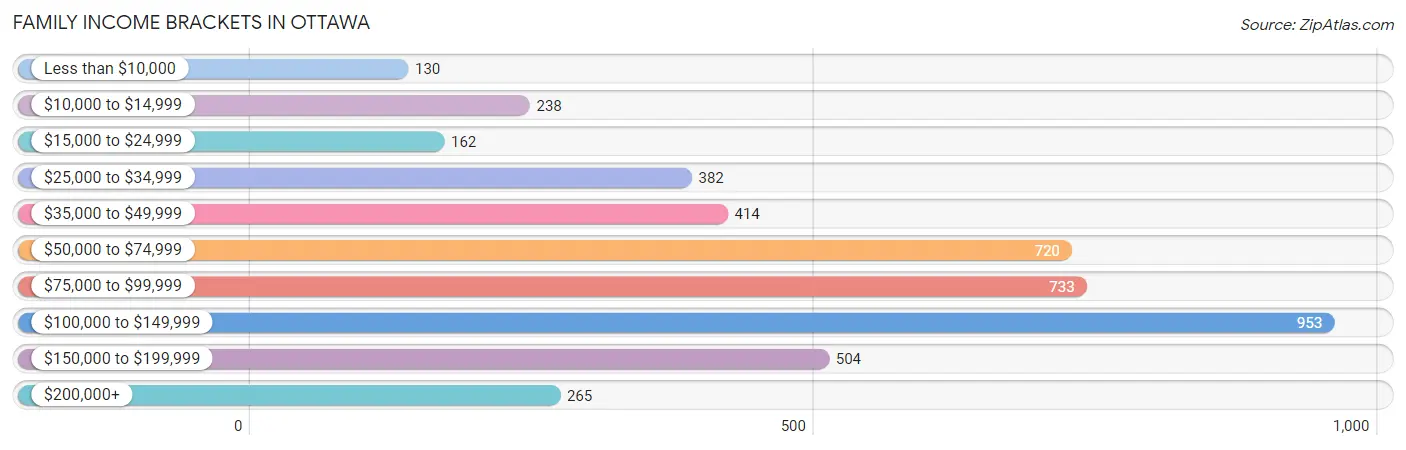
| Income Bracket | # Families | % Families |
| Less than $10,000 | 130 | 2.9% |
| $10,000 to $14,999 | 238 | 5.3% |
| $15,000 to $24,999 | 162 | 3.6% |
| $25,000 to $34,999 | 382 | 8.5% |
| $35,000 to $49,999 | 414 | 9.2% |
| $50,000 to $74,999 | 720 | 16.0% |
| $75,000 to $99,999 | 733 | 16.3% |
| $100,000 to $149,999 | 953 | 21.2% |
| $150,000 to $199,999 | 504 | 11.2% |
| $200,000+ | 265 | 5.9% |
Family Income by Famaliy Size in Ottawa
7+ person families (89 | 2.0%) account for the highest median family income in Ottawa with $230,982 per family, while 2-person families (2,154 | 47.9%) have the highest median income of $37,480 per family member.
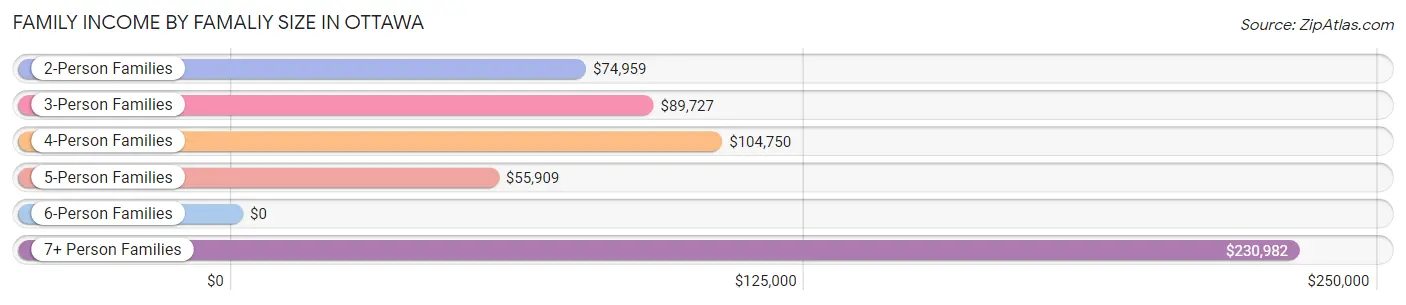
| Income Bracket | # Families | Median Income |
| 2-Person Families | 2,154 (47.9%) | $74,959 |
| 3-Person Families | 1,099 (24.4%) | $89,727 |
| 4-Person Families | 778 (17.3%) | $104,750 |
| 5-Person Families | 290 (6.5%) | $55,909 |
| 6-Person Families | 87 (1.9%) | $0 |
| 7+ Person Families | 89 (2.0%) | $230,982 |
| Total | 4,497 (100.0%) | $79,792 |
Family Income by Number of Earners in Ottawa
The median family income in Ottawa is $79,792, with families comprising 3+ earners (480) having the highest median family income of $150,000, while families with no earners (638) have the lowest median family income of $43,083, accounting for 10.7% and 14.2% of families, respectively.
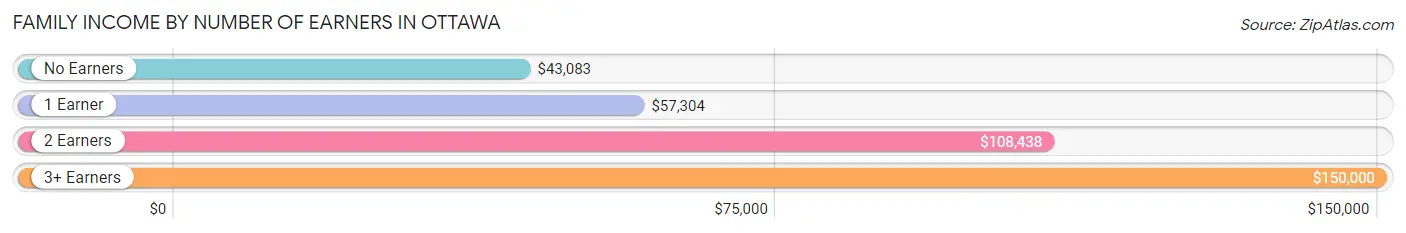
| Number of Earners | # Families | Median Income |
| No Earners | 638 (14.2%) | $43,083 |
| 1 Earner | 1,631 (36.3%) | $57,304 |
| 2 Earners | 1,748 (38.9%) | $108,438 |
| 3+ Earners | 480 (10.7%) | $150,000 |
| Total | 4,497 (100.0%) | $79,792 |
Household Income in Ottawa
Household Income Brackets in Ottawa
With 1,260 households falling in the category, the $50,000 to $74,999 income range is the most frequent in Ottawa, accounting for 16.5% of all households. In contrast, only 321 households (4.2%) fall into the $200,000+ income bracket, making it the least populous group.
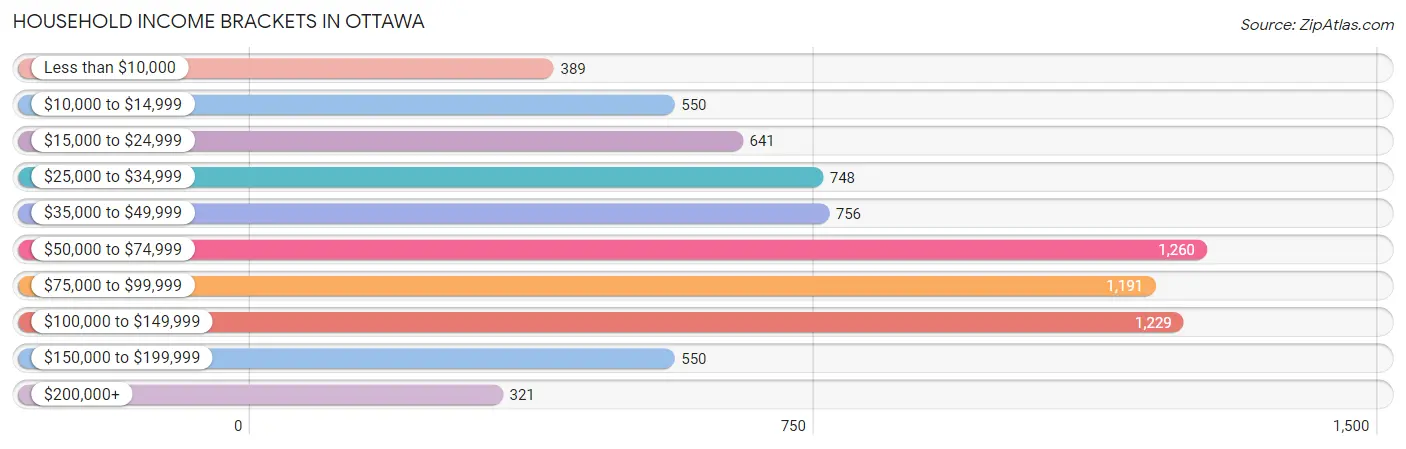
| Income Bracket | # Households | % Households |
| Less than $10,000 | 389 | 5.1% |
| $10,000 to $14,999 | 550 | 7.2% |
| $15,000 to $24,999 | 641 | 8.4% |
| $25,000 to $34,999 | 748 | 9.8% |
| $35,000 to $49,999 | 756 | 9.9% |
| $50,000 to $74,999 | 1,260 | 16.5% |
| $75,000 to $99,999 | 1,191 | 15.6% |
| $100,000 to $149,999 | 1,229 | 16.1% |
| $150,000 to $199,999 | 550 | 7.2% |
| $200,000+ | 321 | 4.2% |
Household Income by Householder Age in Ottawa
The median household income in Ottawa is $67,940, with the highest median household income of $76,250 found in the 45 to 64 years age bracket for the primary householder. A total of 3,065 households (40.2%) fall into this category. Meanwhile, the 15 to 24 years age bracket for the primary householder has the lowest median household income of $41,250, with 240 households (3.1%) in this group.
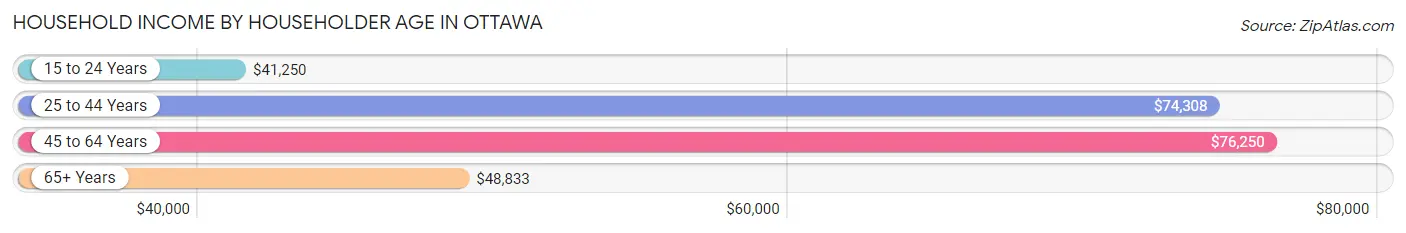
| Income Bracket | # Households | Median Income |
| 15 to 24 Years | 240 (3.1%) | $41,250 |
| 25 to 44 Years | 2,405 (31.5%) | $74,308 |
| 45 to 64 Years | 3,065 (40.2%) | $76,250 |
| 65+ Years | 1,924 (25.2%) | $48,833 |
| Total | 7,634 (100.0%) | $67,940 |
Poverty in Ottawa
Income Below Poverty by Sex and Age in Ottawa
With 17.0% poverty level for males and 19.4% for females among the residents of Ottawa, 15 year old males and 5 year old females are the most vulnerable to poverty, with 62 males (59.6%) and 107 females (54.0%) in their respective age groups living below the poverty level.
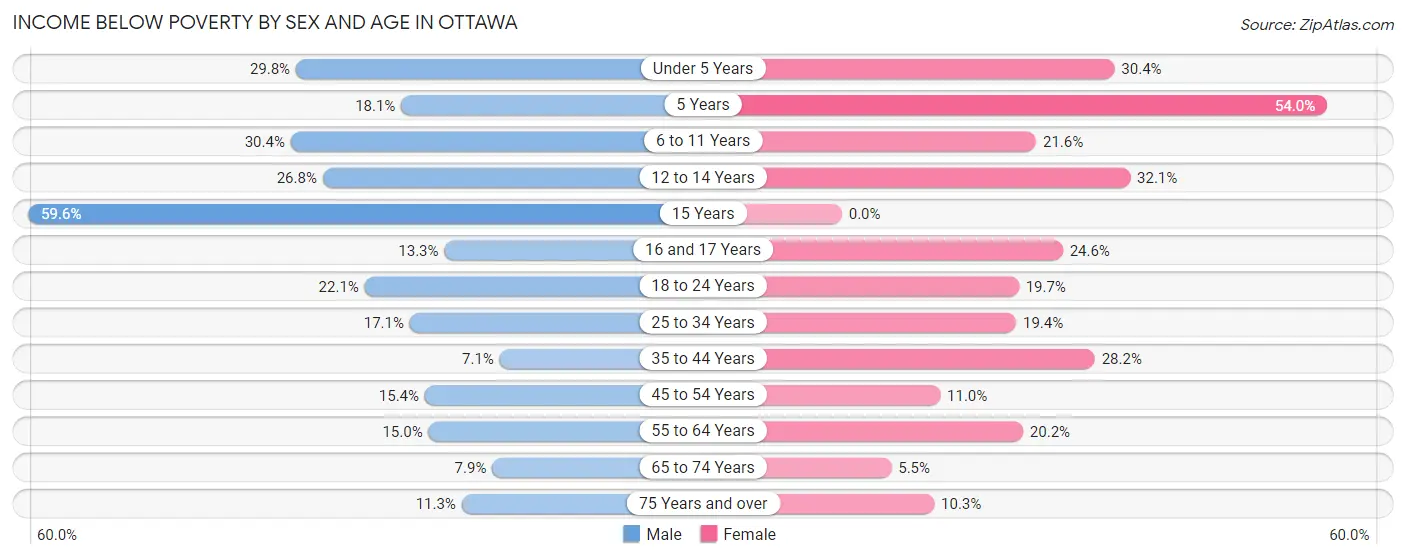
| Age Bracket | Male | Female |
| Under 5 Years | 162 (29.8%) | 177 (30.4%) |
| 5 Years | 13 (18.1%) | 107 (54.0%) |
| 6 to 11 Years | 184 (30.4%) | 133 (21.6%) |
| 12 to 14 Years | 93 (26.8%) | 105 (32.1%) |
| 15 Years | 62 (59.6%) | 0 (0.0%) |
| 16 and 17 Years | 53 (13.3%) | 62 (24.6%) |
| 18 to 24 Years | 106 (22.1%) | 146 (19.7%) |
| 25 to 34 Years | 242 (17.1%) | 232 (19.4%) |
| 35 to 44 Years | 76 (7.1%) | 293 (28.2%) |
| 45 to 54 Years | 151 (15.4%) | 116 (11.0%) |
| 55 to 64 Years | 222 (15.0%) | 333 (20.2%) |
| 65 to 74 Years | 62 (7.9%) | 47 (5.5%) |
| 75 Years and over | 42 (11.3%) | 84 (10.3%) |
| Total | 1,468 (17.0%) | 1,835 (19.4%) |
Income Above Poverty by Sex and Age in Ottawa
According to the poverty statistics in Ottawa, males aged 35 to 44 years and females aged 15 years are the age groups that are most secure financially, with 92.9% of males and 100.0% of females in these age groups living above the poverty line.
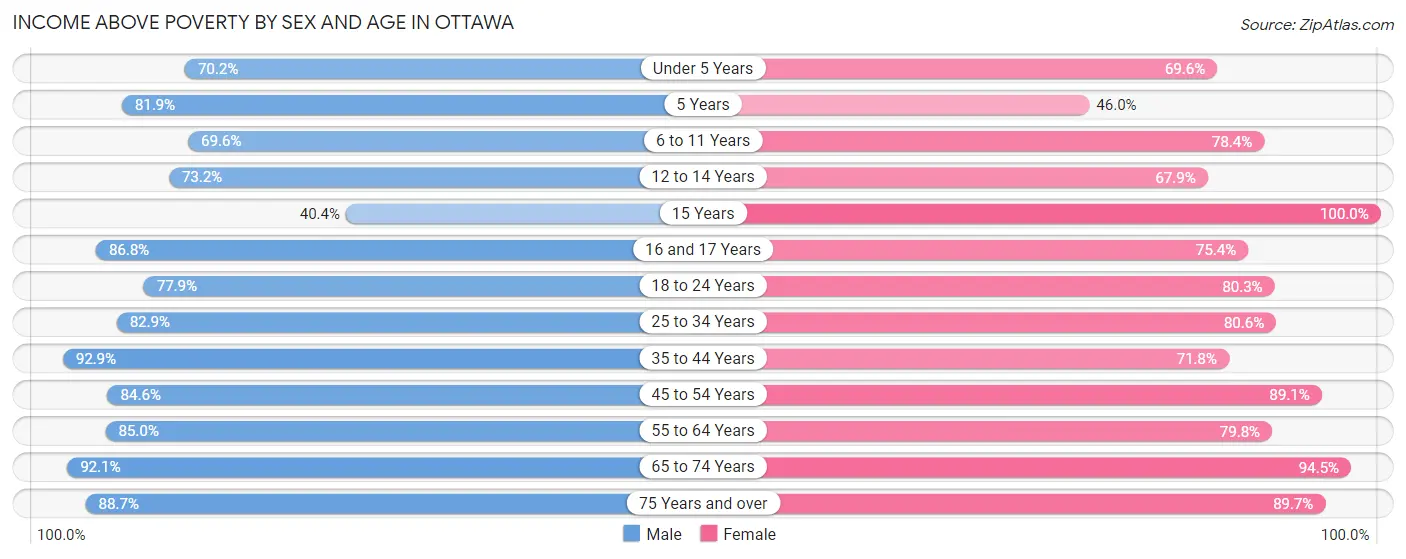
| Age Bracket | Male | Female |
| Under 5 Years | 382 (70.2%) | 406 (69.6%) |
| 5 Years | 59 (81.9%) | 91 (46.0%) |
| 6 to 11 Years | 422 (69.6%) | 482 (78.4%) |
| 12 to 14 Years | 254 (73.2%) | 222 (67.9%) |
| 15 Years | 42 (40.4%) | 116 (100.0%) |
| 16 and 17 Years | 347 (86.8%) | 190 (75.4%) |
| 18 to 24 Years | 373 (77.9%) | 595 (80.3%) |
| 25 to 34 Years | 1,173 (82.9%) | 963 (80.6%) |
| 35 to 44 Years | 996 (92.9%) | 747 (71.8%) |
| 45 to 54 Years | 828 (84.6%) | 943 (89.0%) |
| 55 to 64 Years | 1,256 (85.0%) | 1,318 (79.8%) |
| 65 to 74 Years | 721 (92.1%) | 806 (94.5%) |
| 75 Years and over | 329 (88.7%) | 733 (89.7%) |
| Total | 7,182 (83.0%) | 7,612 (80.6%) |
Income Below Poverty Among Married-Couple Families in Ottawa
The poverty statistics for married-couple families in Ottawa show that 8.1% or 247 of the total 3,034 families live below the poverty line. Families with 3 or 4 children have the highest poverty rate of 39.4%, comprising of 93 families. On the other hand, families with 5 or more children have the lowest poverty rate of 0.0%, which includes 0 families.
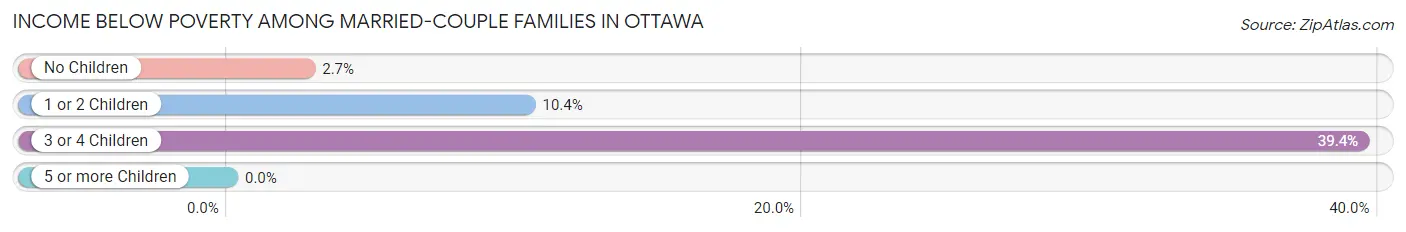
| Children | Above Poverty | Below Poverty |
| No Children | 1,698 (97.3%) | 47 (2.7%) |
| 1 or 2 Children | 926 (89.6%) | 107 (10.4%) |
| 3 or 4 Children | 143 (60.6%) | 93 (39.4%) |
| 5 or more Children | 20 (100.0%) | 0 (0.0%) |
| Total | 2,787 (91.9%) | 247 (8.1%) |
Income Below Poverty Among Single-Parent Households in Ottawa
According to the poverty data in Ottawa, 16.9% or 58 single-father households and 30.4% or 340 single-mother households are living below the poverty line. Among single-father households, those with 5 or more children have the highest poverty rate, with 11 households (100.0%) experiencing poverty. Likewise, among single-mother households, those with 5 or more children have the highest poverty rate, with 33 households (100.0%) falling below the poverty line.
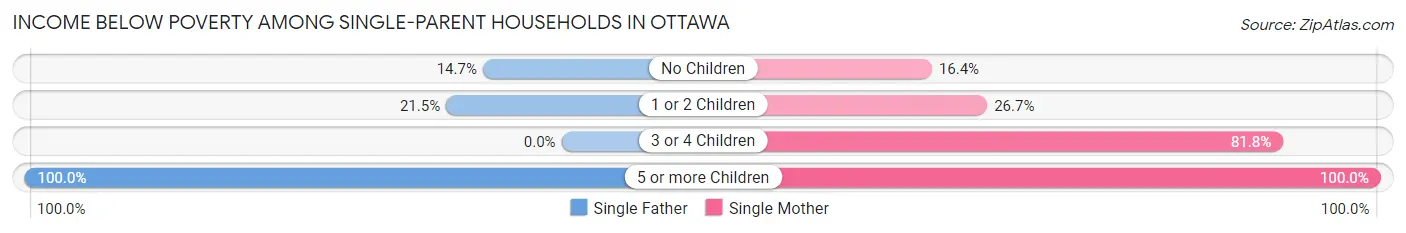
| Children | Single Father | Single Mother |
| No Children | 27 (14.7%) | 61 (16.4%) |
| 1 or 2 Children | 20 (21.5%) | 165 (26.7%) |
| 3 or 4 Children | 0 (0.0%) | 81 (81.8%) |
| 5 or more Children | 11 (100.0%) | 33 (100.0%) |
| Total | 58 (16.9%) | 340 (30.4%) |
Income Below Poverty Among Married-Couple vs Single-Parent Households in Ottawa
The poverty data for Ottawa shows that 247 of the married-couple family households (8.1%) and 398 of the single-parent households (27.2%) are living below the poverty level. Within the married-couple family households, those with 3 or 4 children have the highest poverty rate, with 93 households (39.4%) falling below the poverty line. Among the single-parent households, those with 5 or more children have the highest poverty rate, with 44 household (100.0%) living below poverty.
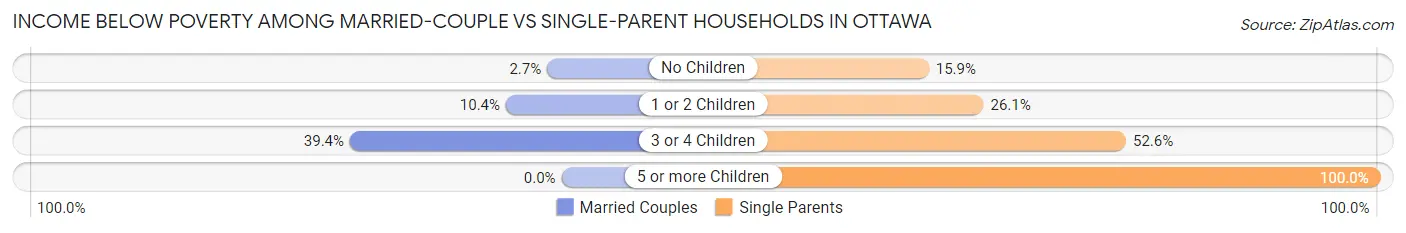
| Children | Married-Couple Families | Single-Parent Households |
| No Children | 47 (2.7%) | 88 (15.9%) |
| 1 or 2 Children | 107 (10.4%) | 185 (26.1%) |
| 3 or 4 Children | 93 (39.4%) | 81 (52.6%) |
| 5 or more Children | 0 (0.0%) | 44 (100.0%) |
| Total | 247 (8.1%) | 398 (27.2%) |
Race in Ottawa
The most populous races in Ottawa are White / Caucasian (16,602 | 88.7%), Hispanic or Latino (1,988 | 10.6%), and Two or more Races (811 | 4.3%).
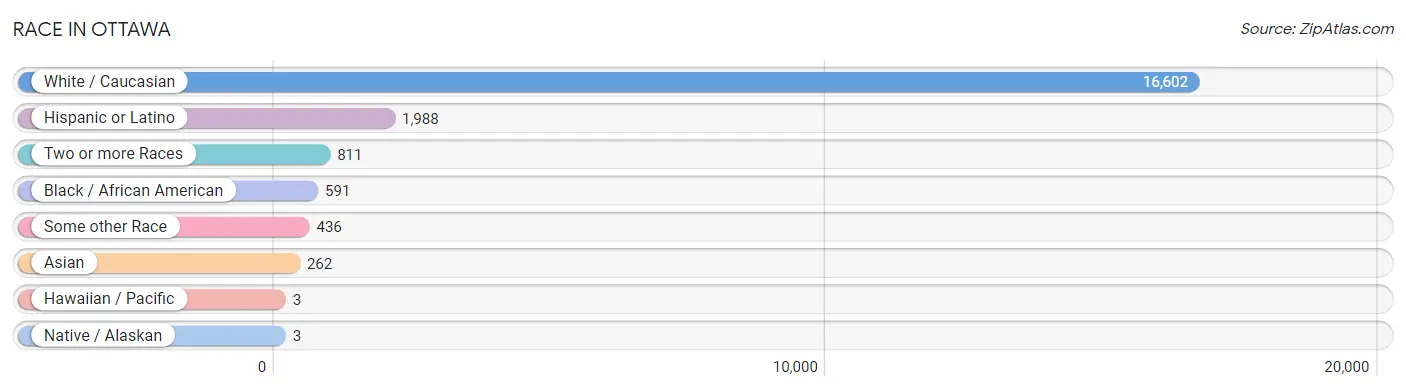
| Race | # Population | % Population |
| Asian | 262 | 1.4% |
| Black / African American | 591 | 3.2% |
| Hawaiian / Pacific | 3 | 0.0% |
| Hispanic or Latino | 1,988 | 10.6% |
| Native / Alaskan | 3 | 0.0% |
| White / Caucasian | 16,602 | 88.7% |
| Two or more Races | 811 | 4.3% |
| Some other Race | 436 | 2.3% |
| Total | 18,708 | 100.0% |
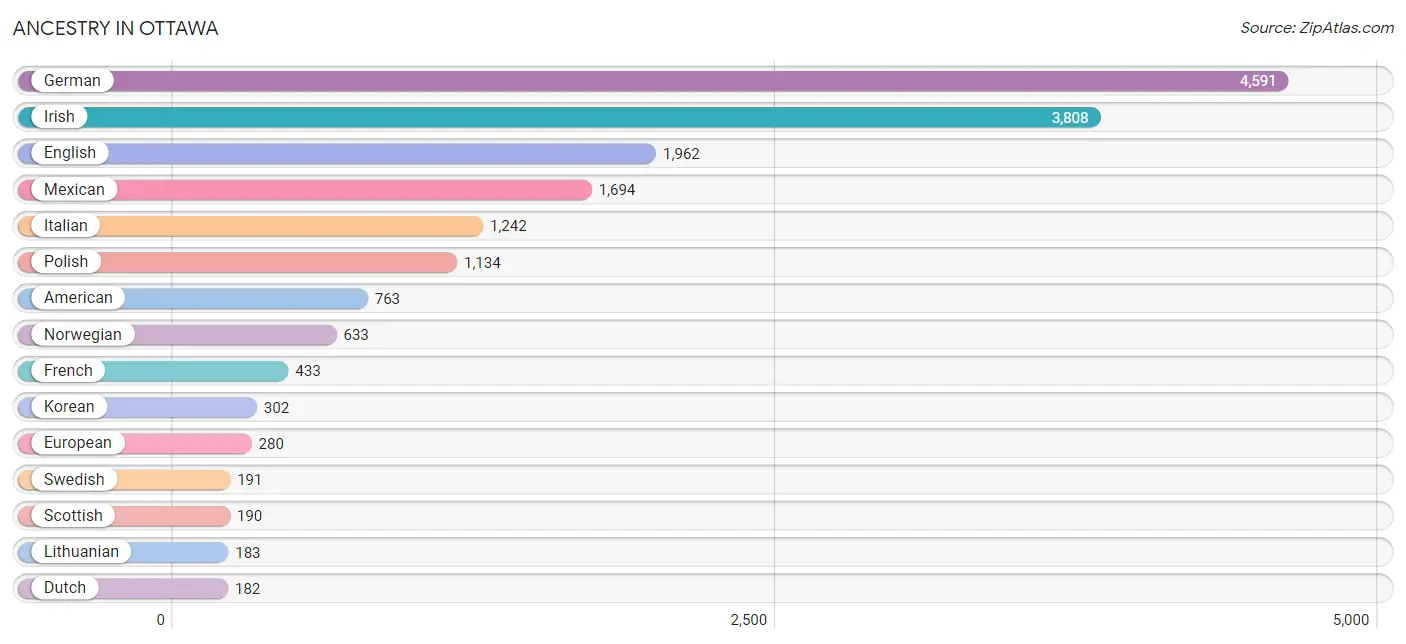
Ancestry in Ottawa
The most populous ancestries reported in Ottawa are German (4,591 | 24.5%), Irish (3,808 | 20.3%), English (1,962 | 10.5%), Mexican (1,694 | 9.0%), and Italian (1,242 | 6.6%), together accounting for 71.1% of all Ottawa residents.
| Ancestry | # Population | % Population |
| African | 24 | 0.1% |
| American | 763 | 4.1% |
| Apache | 16 | 0.1% |
| Arab | 164 | 0.9% |
| Assyrian / Chaldean / Syriac | 9 | 0.1% |
| Austrian | 122 | 0.6% |
| Bhutanese | 38 | 0.2% |
| Blackfeet | 3 | 0.0% |
| Brazilian | 12 | 0.1% |
| British | 57 | 0.3% |
| Burmese | 9 | 0.1% |
| Canadian | 9 | 0.1% |
| Cherokee | 10 | 0.1% |
| Cheyenne | 3 | 0.0% |
| Chilean | 11 | 0.1% |
| Choctaw | 5 | 0.0% |
| Czech | 57 | 0.3% |
| Czechoslovakian | 30 | 0.2% |
| Danish | 107 | 0.6% |
| Dutch | 182 | 1.0% |
| Eastern European | 30 | 0.2% |
| Egyptian | 164 | 0.9% |
| English | 1,962 | 10.5% |
| European | 280 | 1.5% |
| Finnish | 14 | 0.1% |
| French | 433 | 2.3% |
| French Canadian | 18 | 0.1% |
| German | 4,591 | 24.5% |
| Greek | 33 | 0.2% |
| Haitian | 10 | 0.1% |
| Hungarian | 176 | 0.9% |
| Iranian | 8 | 0.0% |
| Irish | 3,808 | 20.3% |
| Israeli | 9 | 0.1% |
| Italian | 1,242 | 6.6% |
| Japanese | 7 | 0.0% |
| Korean | 302 | 1.6% |
| Latvian | 23 | 0.1% |
| Lebanese | 164 | 0.9% |
| Lithuanian | 183 | 1.0% |
| Macedonian | 3 | 0.0% |
| Menominee | 6 | 0.0% |
| Mexican | 1,694 | 9.0% |
| Native Hawaiian | 43 | 0.2% |
| Navajo | 2 | 0.0% |
| Northern European | 18 | 0.1% |
| Norwegian | 633 | 3.4% |
| Polish | 1,134 | 6.1% |
| Potawatomi | 15 | 0.1% |
| Puerto Rican | 6 | 0.0% |
| Romanian | 34 | 0.2% |
| Russian | 17 | 0.1% |
| Scandinavian | 84 | 0.4% |
| Scotch-Irish | 141 | 0.7% |
| Scottish | 190 | 1.0% |
| Slovak | 149 | 0.8% |
| Slovene | 35 | 0.2% |
| South American | 11 | 0.1% |
| Spaniard | 21 | 0.1% |
| Spanish | 14 | 0.1% |
| Subsaharan African | 24 | 0.1% |
| Swedish | 191 | 1.0% |
| Swiss | 7 | 0.0% |
| Thai | 37 | 0.2% |
| Welsh | 25 | 0.1% |
| Yugoslavian | 5 | 0.0% | View All 66 Rows |
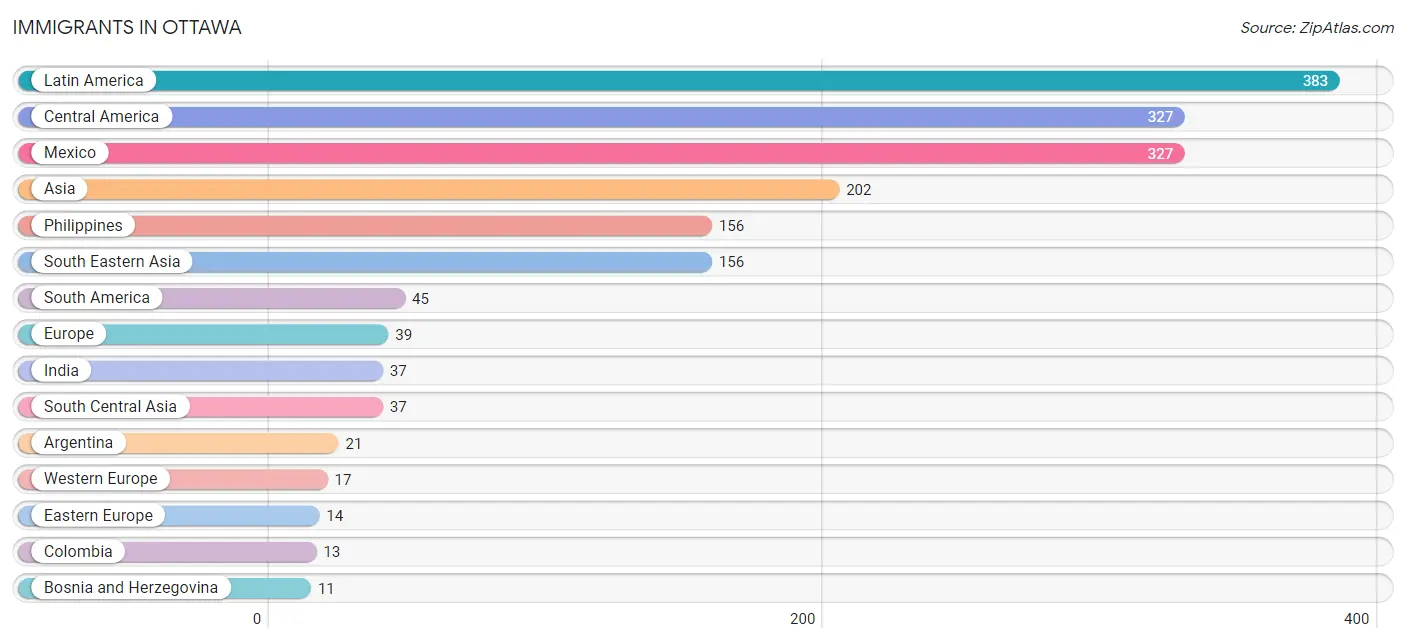
Immigrants in Ottawa
The most numerous immigrant groups reported in Ottawa came from Latin America (383 | 2.1%), Central America (327 | 1.8%), Mexico (327 | 1.8%), Asia (202 | 1.1%), and Philippines (156 | 0.8%), together accounting for 7.5% of all Ottawa residents.
| Immigration Origin | # Population | % Population |
| Argentina | 21 | 0.1% |
| Asia | 202 | 1.1% |
| Bosnia and Herzegovina | 11 | 0.1% |
| Canada | 1 | 0.0% |
| Caribbean | 11 | 0.1% |
| Central America | 327 | 1.8% |
| Chile | 11 | 0.1% |
| Colombia | 13 | 0.1% |
| Eastern Asia | 9 | 0.1% |
| Eastern Europe | 14 | 0.1% |
| Europe | 39 | 0.2% |
| Germany | 9 | 0.1% |
| Greece | 3 | 0.0% |
| Haiti | 11 | 0.1% |
| India | 37 | 0.2% |
| Korea | 9 | 0.1% |
| Latin America | 383 | 2.1% |
| Mexico | 327 | 1.8% |
| Netherlands | 8 | 0.0% |
| North Macedonia | 3 | 0.0% |
| Philippines | 156 | 0.8% |
| Portugal | 5 | 0.0% |
| South America | 45 | 0.2% |
| South Central Asia | 37 | 0.2% |
| South Eastern Asia | 156 | 0.8% |
| Southern Europe | 8 | 0.0% |
| Western Europe | 17 | 0.1% | View All 27 Rows |
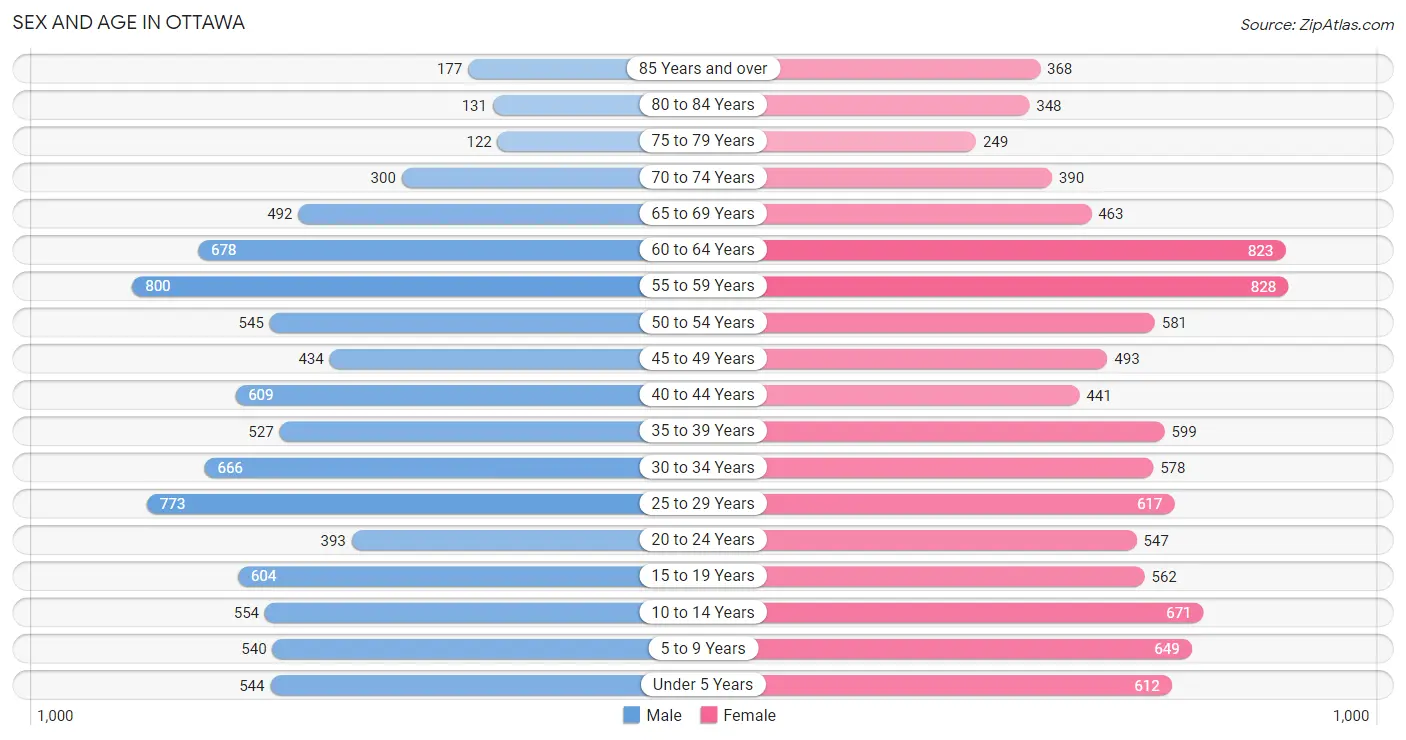
Sex and Age in Ottawa
Sex and Age in Ottawa
The most populous age groups in Ottawa are 55 to 59 Years (800 | 9.0%) for men and 55 to 59 Years (828 | 8.4%) for women.
| Age Bracket | Male | Female |
| Under 5 Years | 544 (6.1%) | 612 (6.2%) |
| 5 to 9 Years | 540 (6.1%) | 649 (6.6%) |
| 10 to 14 Years | 554 (6.2%) | 671 (6.8%) |
| 15 to 19 Years | 604 (6.8%) | 562 (5.7%) |
| 20 to 24 Years | 393 (4.4%) | 547 (5.6%) |
| 25 to 29 Years | 773 (8.7%) | 617 (6.3%) |
| 30 to 34 Years | 666 (7.5%) | 578 (5.9%) |
| 35 to 39 Years | 527 (5.9%) | 599 (6.1%) |
| 40 to 44 Years | 609 (6.9%) | 441 (4.5%) |
| 45 to 49 Years | 434 (4.9%) | 493 (5.0%) |
| 50 to 54 Years | 545 (6.1%) | 581 (5.9%) |
| 55 to 59 Years | 800 (9.0%) | 828 (8.4%) |
| 60 to 64 Years | 678 (7.6%) | 823 (8.4%) |
| 65 to 69 Years | 492 (5.5%) | 463 (4.7%) |
| 70 to 74 Years | 300 (3.4%) | 390 (4.0%) |
| 75 to 79 Years | 122 (1.4%) | 249 (2.5%) |
| 80 to 84 Years | 131 (1.5%) | 348 (3.5%) |
| 85 Years and over | 177 (2.0%) | 368 (3.7%) |
| Total | 8,889 (100.0%) | 9,819 (100.0%) |
Families and Households in Ottawa
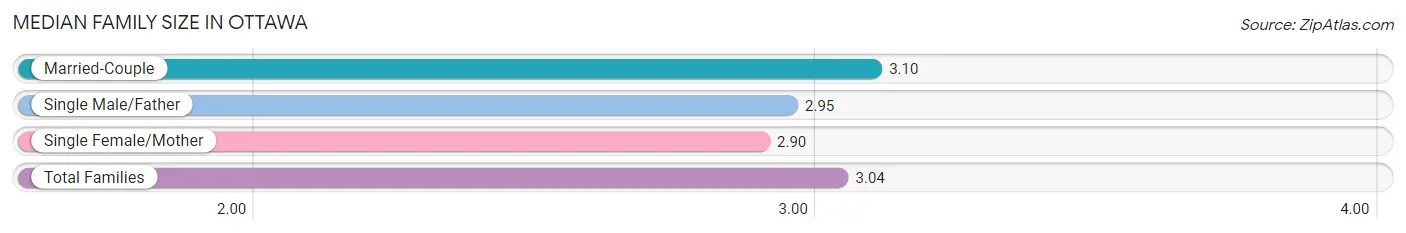
Median Family Size in Ottawa
The median family size in Ottawa is 3.04 persons per family, with married-couple families (3,034 | 67.5%) accounting for the largest median family size of 3.1 persons per family. On the other hand, single female/mother families (1,120 | 24.9%) represent the smallest median family size with 2.90 persons per family.
| Family Type | # Families | Family Size |
| Married-Couple | 3,034 (67.5%) | 3.10 |
| Single Male/Father | 343 (7.6%) | 2.95 |
| Single Female/Mother | 1,120 (24.9%) | 2.90 |
| Total Families | 4,497 (100.0%) | 3.04 |
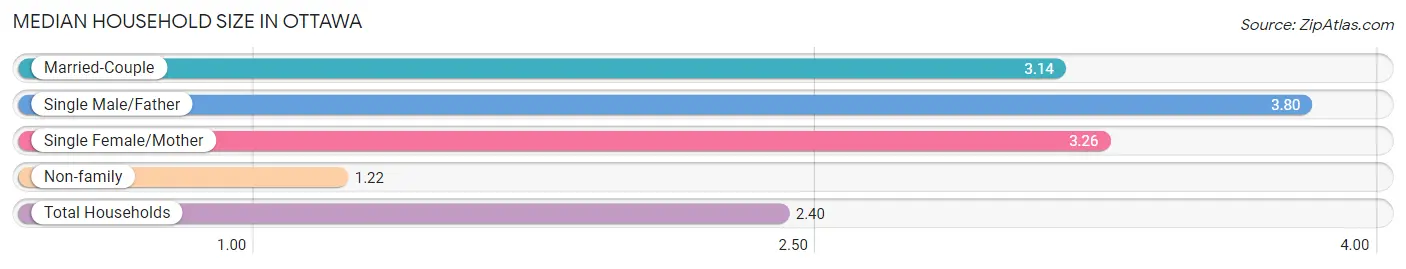
Median Household Size in Ottawa
The median household size in Ottawa is 2.40 persons per household, with single male/father households (343 | 4.5%) accounting for the largest median household size of 3.8 persons per household. non-family households (3,137 | 41.1%) represent the smallest median household size with 1.22 persons per household.
| Household Type | # Households | Household Size |
| Married-Couple | 3,034 (39.7%) | 3.14 |
| Single Male/Father | 343 (4.5%) | 3.80 |
| Single Female/Mother | 1,120 (14.7%) | 3.26 |
| Non-family | 3,137 (41.1%) | 1.22 |
| Total Households | 7,634 (100.0%) | 2.40 |
Household Size by Marriage Status in Ottawa
Out of a total of 7,634 households in Ottawa, 4,497 (58.9%) are family households, while 3,137 (41.1%) are nonfamily households. The most numerous type of family households are 2-person households, comprising 1,925, and the most common type of nonfamily households are 1-person households, comprising 2,590.
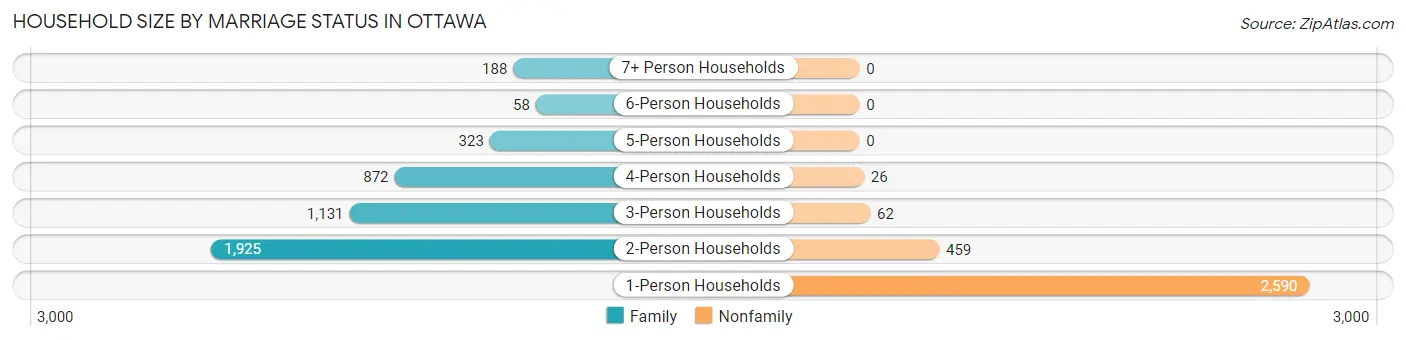
| Household Size | Family Households | Nonfamily Households |
| 1-Person Households | - | 2,590 (33.9%) |
| 2-Person Households | 1,925 (25.2%) | 459 (6.0%) |
| 3-Person Households | 1,131 (14.8%) | 62 (0.8%) |
| 4-Person Households | 872 (11.4%) | 26 (0.3%) |
| 5-Person Households | 323 (4.2%) | 0 (0.0%) |
| 6-Person Households | 58 (0.8%) | 0 (0.0%) |
| 7+ Person Households | 188 (2.5%) | 0 (0.0%) |
| Total | 4,497 (58.9%) | 3,137 (41.1%) |
Female Fertility in Ottawa
Fertility by Age in Ottawa
Average fertility rate in Ottawa is 95.0 births per 1,000 women. Women in the age bracket of 20 to 34 years have the highest fertility rate with 168.0 births per 1,000 women. Women in the age bracket of 20 to 34 years acount for 78.5% of all women with births.
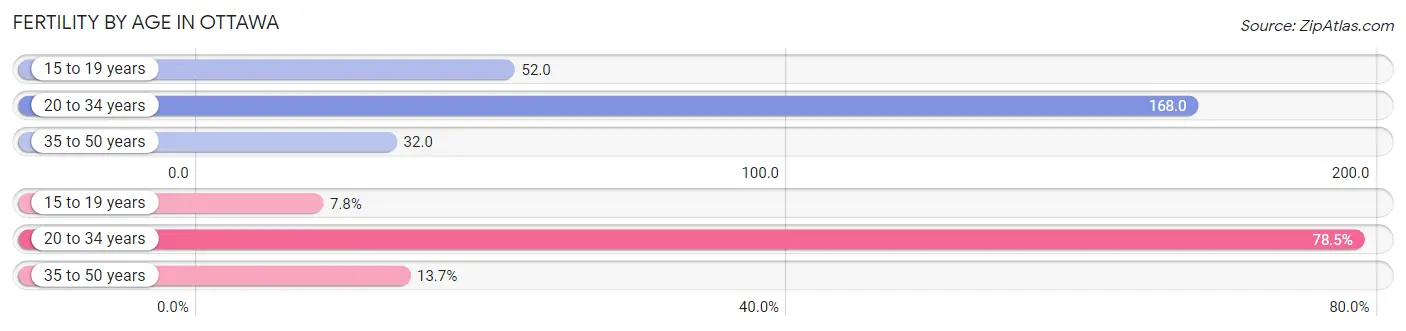
| Age Bracket | Women with Births | Births / 1,000 Women |
| 15 to 19 years | 29 (7.8%) | 52.0 |
| 20 to 34 years | 292 (78.5%) | 168.0 |
| 35 to 50 years | 51 (13.7%) | 32.0 |
| Total | 372 (100.0%) | 95.0 |
Fertility by Age by Marriage Status in Ottawa
51.6% of women with births (372) in Ottawa are married. The highest percentage of unmarried women with births falls into 15 to 19 years age bracket with 100.0% of them unmarried at the time of birth, while the lowest percentage of unmarried women with births belong to 35 to 50 years age bracket with 0.0% of them unmarried.
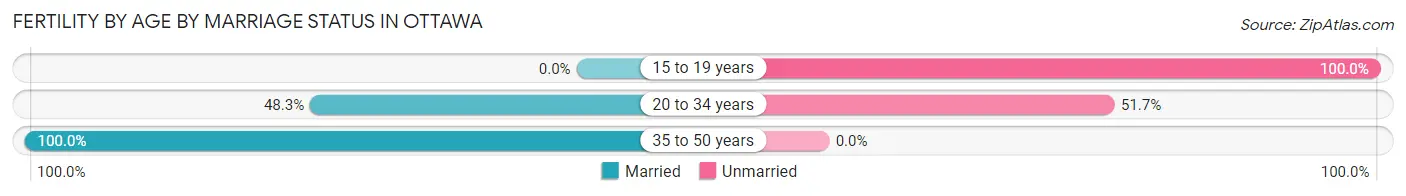
| Age Bracket | Married | Unmarried |
| 15 to 19 years | 0 (0.0%) | 29 (100.0%) |
| 20 to 34 years | 141 (48.3%) | 151 (51.7%) |
| 35 to 50 years | 51 (100.0%) | 0 (0.0%) |
| Total | 192 (51.6%) | 180 (48.4%) |
Fertility by Education in Ottawa
Average fertility rate in Ottawa is 95.0 births per 1,000 women. Women with the education attainment of graduate degree have the highest fertility rate of 135.0 births per 1,000 women, while women with the education attainment of college or associate's degree have the lowest fertility at 75.0 births per 1,000 women. Women with the education attainment of college or associate's degree represent 32.5% of all women with births.
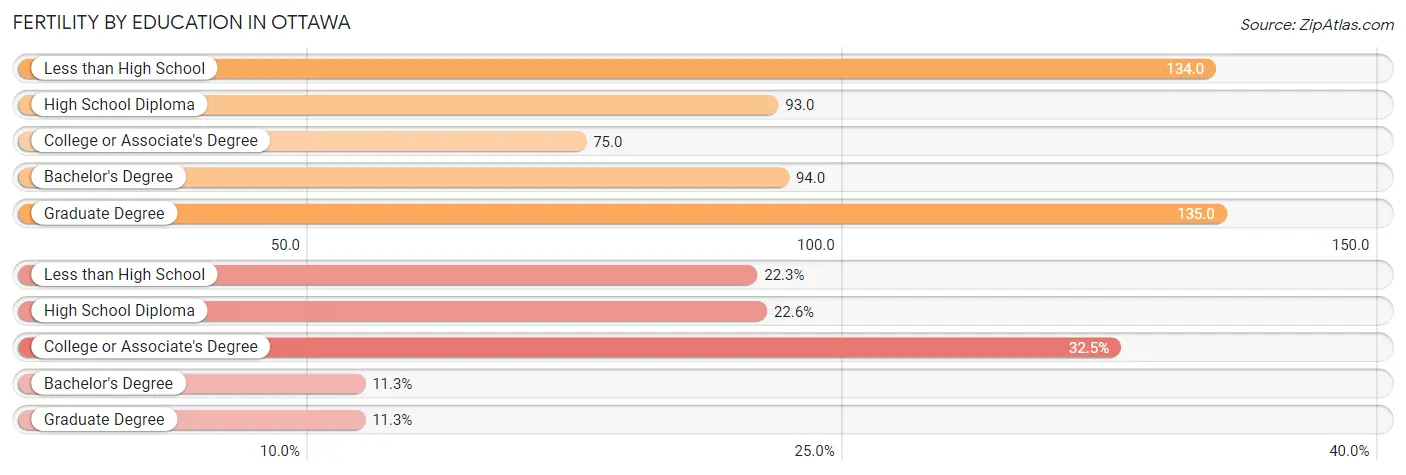
| Educational Attainment | Women with Births | Births / 1,000 Women |
| Less than High School | 83 (22.3%) | 134.0 |
| High School Diploma | 84 (22.6%) | 93.0 |
| College or Associate's Degree | 121 (32.5%) | 75.0 |
| Bachelor's Degree | 42 (11.3%) | 94.0 |
| Graduate Degree | 42 (11.3%) | 135.0 |
| Total | 372 (100.0%) | 95.0 |
Fertility by Education by Marriage Status in Ottawa
48.4% of women with births in Ottawa are unmarried. Women with the educational attainment of graduate degree are most likely to be married with 100.0% of them married at childbirth, while women with the educational attainment of less than high school are least likely to be married with 79.5% of them unmarried at childbirth.
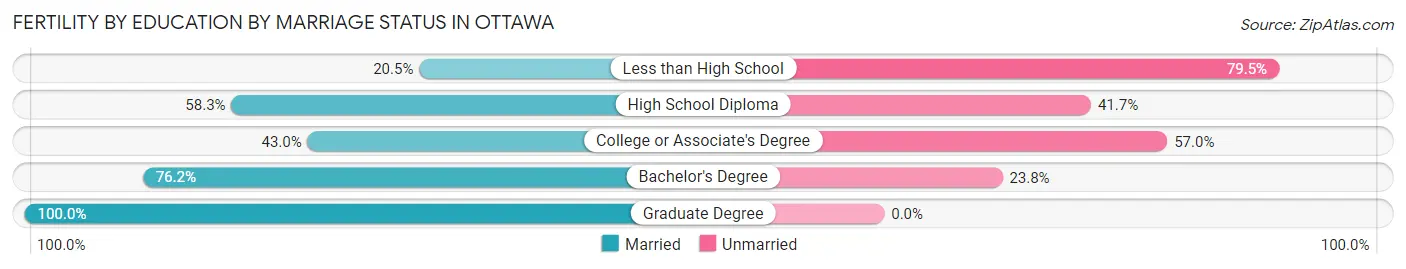
| Educational Attainment | Married | Unmarried |
| Less than High School | 17 (20.5%) | 66 (79.5%) |
| High School Diploma | 49 (58.3%) | 35 (41.7%) |
| College or Associate's Degree | 52 (43.0%) | 69 (57.0%) |
| Bachelor's Degree | 32 (76.2%) | 10 (23.8%) |
| Graduate Degree | 42 (100.0%) | 0 (0.0%) |
| Total | 192 (51.6%) | 180 (48.4%) |
Employment Characteristics in Ottawa
Employment by Class of Employer in Ottawa
Among the 8,520 employed individuals in Ottawa, private company employees (6,039 | 70.9%), local government employees (869 | 10.2%), and not-for-profit organizations (676 | 7.9%) make up the most common classes of employment.
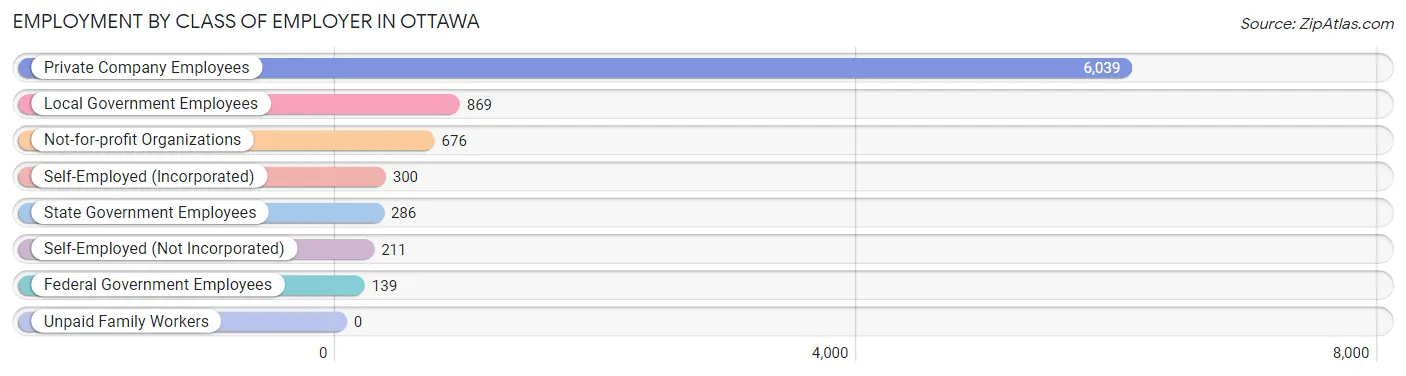
| Employer Class | # Employees | % Employees |
| Private Company Employees | 6,039 | 70.9% |
| Self-Employed (Incorporated) | 300 | 3.5% |
| Self-Employed (Not Incorporated) | 211 | 2.5% |
| Not-for-profit Organizations | 676 | 7.9% |
| Local Government Employees | 869 | 10.2% |
| State Government Employees | 286 | 3.4% |
| Federal Government Employees | 139 | 1.6% |
| Unpaid Family Workers | 0 | 0.0% |
| Total | 8,520 | 100.0% |
Employment Status by Age in Ottawa
According to the labor force statistics for Ottawa, out of the total population over 16 years of age (14,916), 64.4% or 9,606 individuals are in the labor force, with 6.8% or 653 of them unemployed. The age group with the highest labor force participation rate is 20 to 24 years, with 90.4% or 850 individuals in the labor force. Within the labor force, the 20 to 24 years age range has the highest percentage of unemployed individuals, with 18.9% or 161 of them being unemployed.
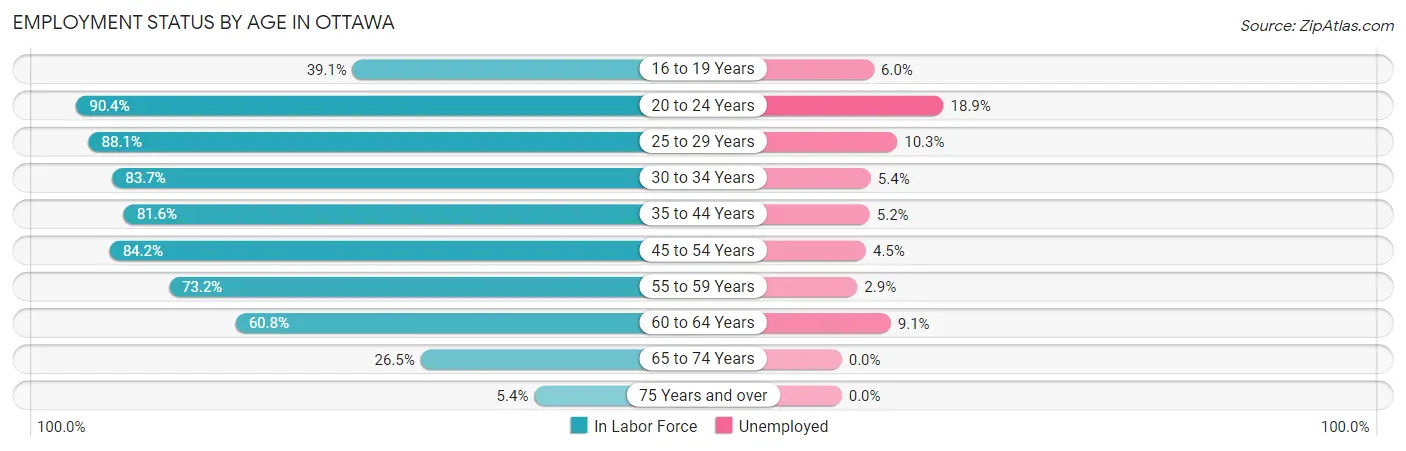
| Age Bracket | In Labor Force | Unemployed |
| 16 to 19 Years | 369 (39.1%) | 22 (6.0%) |
| 20 to 24 Years | 850 (90.4%) | 161 (18.9%) |
| 25 to 29 Years | 1,225 (88.1%) | 126 (10.3%) |
| 30 to 34 Years | 1,041 (83.7%) | 56 (5.4%) |
| 35 to 44 Years | 1,776 (81.6%) | 92 (5.2%) |
| 45 to 54 Years | 1,729 (84.2%) | 78 (4.5%) |
| 55 to 59 Years | 1,192 (73.2%) | 35 (2.9%) |
| 60 to 64 Years | 913 (60.8%) | 83 (9.1%) |
| 65 to 74 Years | 436 (26.5%) | 0 (0.0%) |
| 75 Years and over | 75 (5.4%) | 0 (0.0%) |
| Total | 9,606 (64.4%) | 653 (6.8%) |
Employment Status by Educational Attainment in Ottawa
According to labor force statistics for Ottawa, 78.8% of individuals (7,874) out of the total population between 25 and 64 years of age (9,992) are in the labor force, with 6.0% or 472 of them being unemployed. The group with the highest labor force participation rate are those with the educational attainment of bachelor's degree or higher, with 92.7% or 2,006 individuals in the labor force. Within the labor force, individuals with less than high school education have the highest percentage of unemployment, with 12.5% or 55 of them being unemployed.
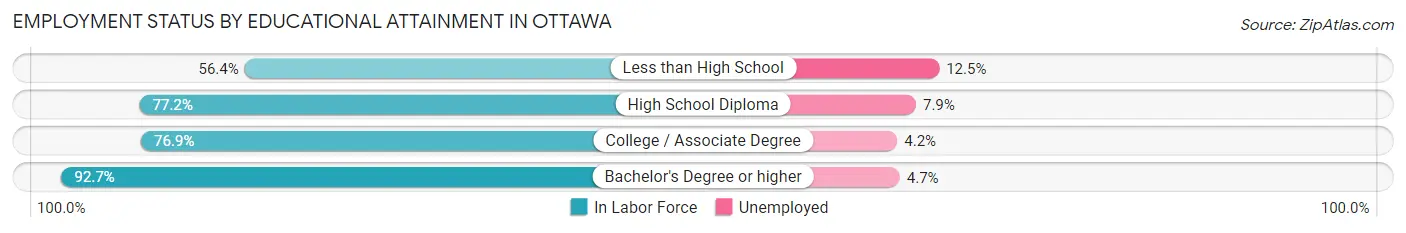
| Educational Attainment | In Labor Force | Unemployed |
| Less than High School | 439 (56.4%) | 97 (12.5%) |
| High School Diploma | 2,504 (77.2%) | 256 (7.9%) |
| College / Associate Degree | 2,928 (76.9%) | 160 (4.2%) |
| Bachelor's Degree or higher | 2,006 (92.7%) | 102 (4.7%) |
| Total | 7,874 (78.8%) | 600 (6.0%) |
Employment Occupations by Sex in Ottawa
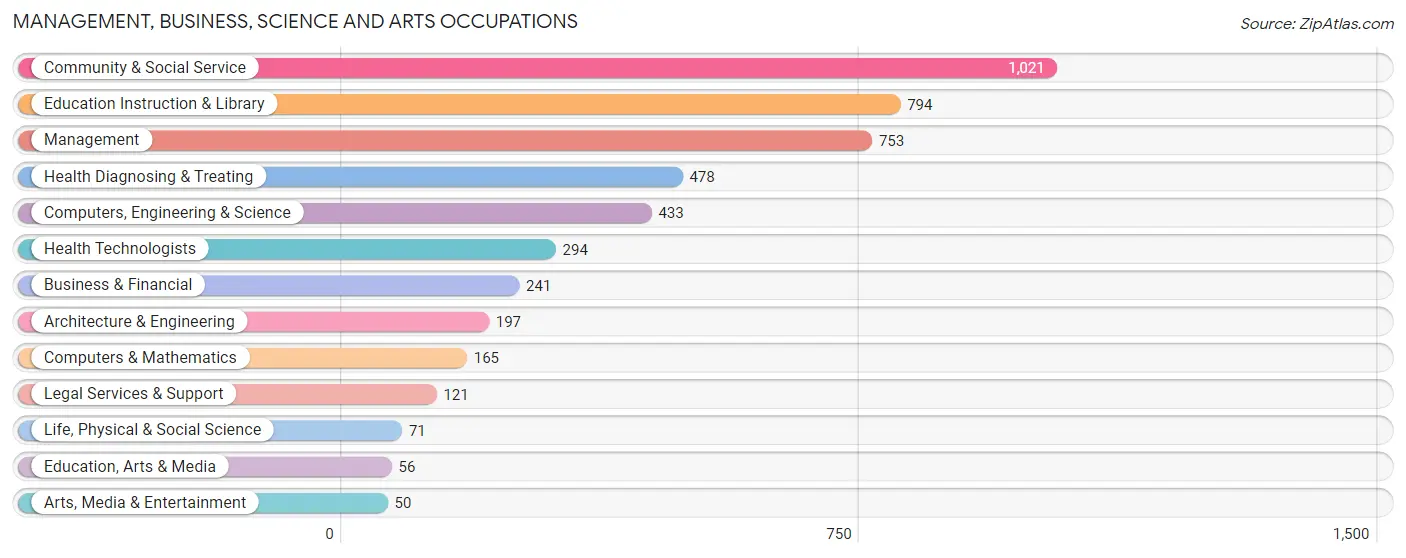
Management, Business, Science and Arts Occupations
The most common Management, Business, Science and Arts occupations in Ottawa are Community & Social Service (1,021 | 11.4%), Education Instruction & Library (794 | 8.9%), Management (753 | 8.4%), Health Diagnosing & Treating (478 | 5.3%), and Computers, Engineering & Science (433 | 4.8%).
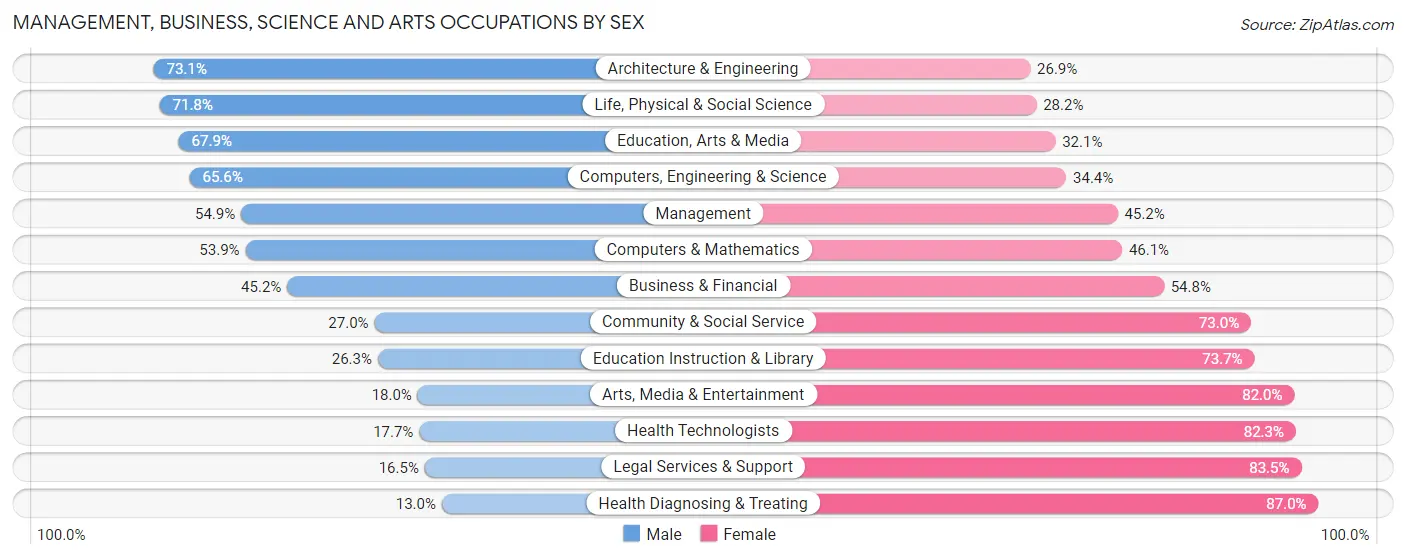
Management, Business, Science and Arts Occupations by Sex
Within the Management, Business, Science and Arts occupations in Ottawa, the most male-oriented occupations are Architecture & Engineering (73.1%), Life, Physical & Social Science (71.8%), and Education, Arts & Media (67.9%), while the most female-oriented occupations are Health Diagnosing & Treating (87.0%), Legal Services & Support (83.5%), and Health Technologists (82.3%).
| Occupation | Male | Female |
| Management | 413 (54.8%) | 340 (45.2%) |
| Business & Financial | 109 (45.2%) | 132 (54.8%) |
| Computers, Engineering & Science | 284 (65.6%) | 149 (34.4%) |
| Computers & Mathematics | 89 (53.9%) | 76 (46.1%) |
| Architecture & Engineering | 144 (73.1%) | 53 (26.9%) |
| Life, Physical & Social Science | 51 (71.8%) | 20 (28.2%) |
| Community & Social Service | 276 (27.0%) | 745 (73.0%) |
| Education, Arts & Media | 38 (67.9%) | 18 (32.1%) |
| Legal Services & Support | 20 (16.5%) | 101 (83.5%) |
| Education Instruction & Library | 209 (26.3%) | 585 (73.7%) |
| Arts, Media & Entertainment | 9 (18.0%) | 41 (82.0%) |
| Health Diagnosing & Treating | 62 (13.0%) | 416 (87.0%) |
| Health Technologists | 52 (17.7%) | 242 (82.3%) |
| Total (Category) | 1,144 (39.1%) | 1,782 (60.9%) |
| Total (Overall) | 4,659 (52.0%) | 4,292 (47.9%) |
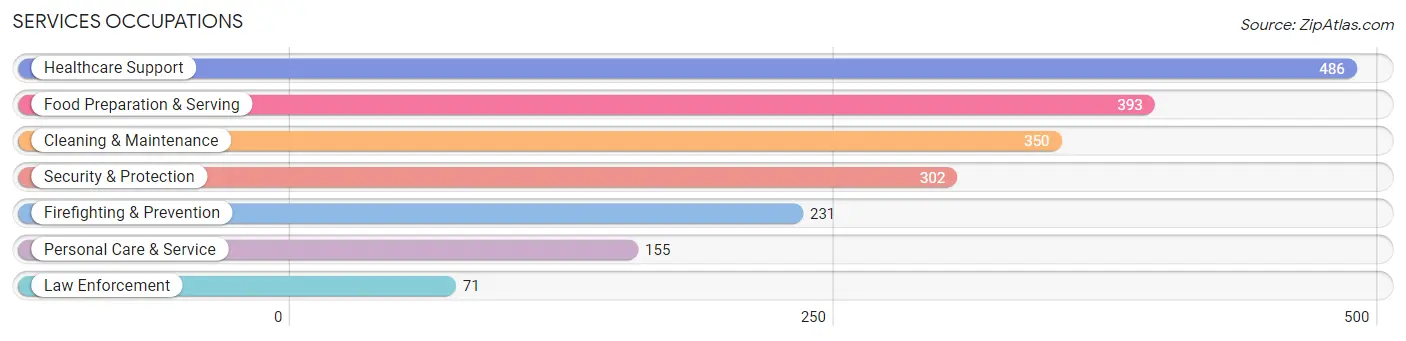
Services Occupations
The most common Services occupations in Ottawa are Healthcare Support (486 | 5.4%), Food Preparation & Serving (393 | 4.4%), Cleaning & Maintenance (350 | 3.9%), Security & Protection (302 | 3.4%), and Firefighting & Prevention (231 | 2.6%).
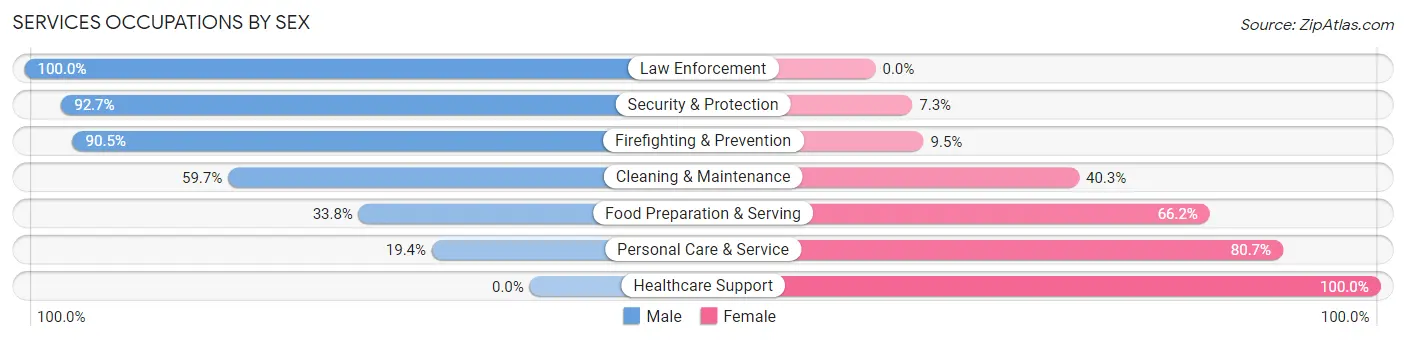
Services Occupations by Sex
Within the Services occupations in Ottawa, the most male-oriented occupations are Law Enforcement (100.0%), Security & Protection (92.7%), and Firefighting & Prevention (90.5%), while the most female-oriented occupations are Healthcare Support (100.0%), Personal Care & Service (80.6%), and Food Preparation & Serving (66.2%).
| Occupation | Male | Female |
| Healthcare Support | 0 (0.0%) | 486 (100.0%) |
| Security & Protection | 280 (92.7%) | 22 (7.3%) |
| Firefighting & Prevention | 209 (90.5%) | 22 (9.5%) |
| Law Enforcement | 71 (100.0%) | 0 (0.0%) |
| Food Preparation & Serving | 133 (33.8%) | 260 (66.2%) |
| Cleaning & Maintenance | 209 (59.7%) | 141 (40.3%) |
| Personal Care & Service | 30 (19.4%) | 125 (80.6%) |
| Total (Category) | 652 (38.7%) | 1,034 (61.3%) |
| Total (Overall) | 4,659 (52.0%) | 4,292 (47.9%) |
Sales and Office Occupations
The most common Sales and Office occupations in Ottawa are Office & Administration (1,016 | 11.4%), and Sales & Related (752 | 8.4%).
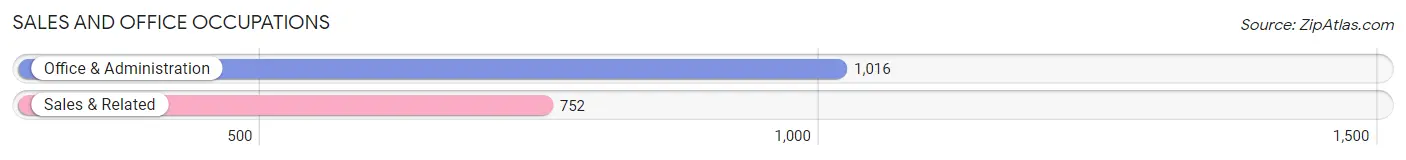
Sales and Office Occupations by Sex
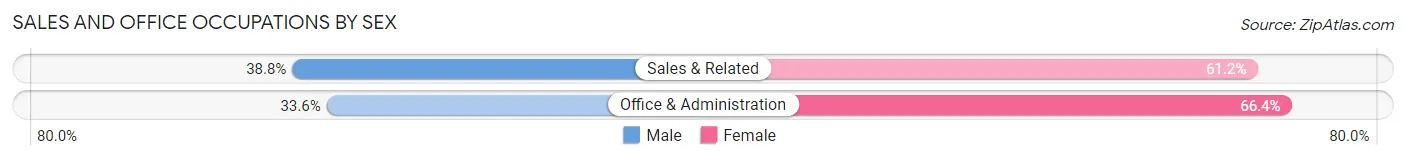
| Occupation | Male | Female |
| Sales & Related | 292 (38.8%) | 460 (61.2%) |
| Office & Administration | 341 (33.6%) | 675 (66.4%) |
| Total (Category) | 633 (35.8%) | 1,135 (64.2%) |
| Total (Overall) | 4,659 (52.0%) | 4,292 (47.9%) |
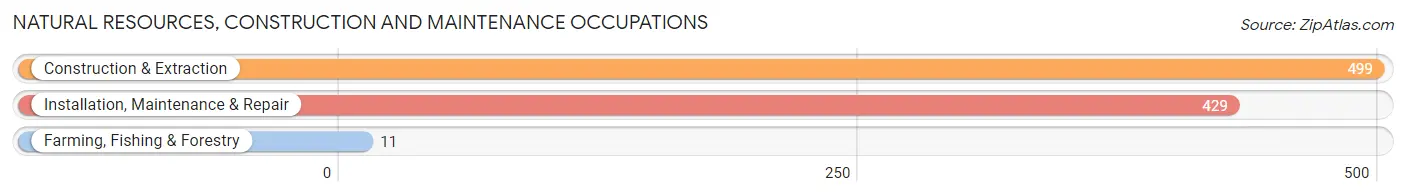
Natural Resources, Construction and Maintenance Occupations
The most common Natural Resources, Construction and Maintenance occupations in Ottawa are Construction & Extraction (499 | 5.6%), Installation, Maintenance & Repair (429 | 4.8%), and Farming, Fishing & Forestry (11 | 0.1%).
Natural Resources, Construction and Maintenance Occupations by Sex
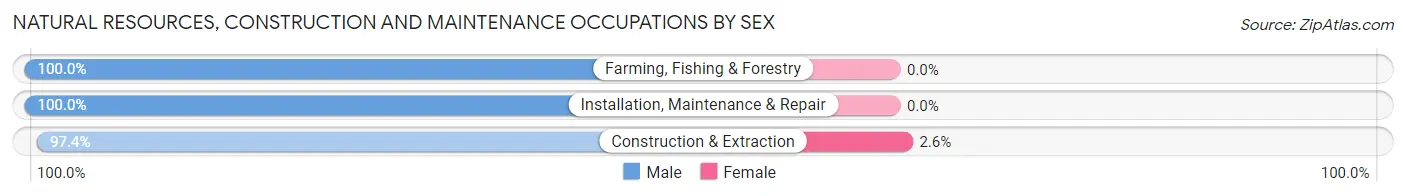
| Occupation | Male | Female |
| Farming, Fishing & Forestry | 11 (100.0%) | 0 (0.0%) |
| Construction & Extraction | 486 (97.4%) | 13 (2.6%) |
| Installation, Maintenance & Repair | 429 (100.0%) | 0 (0.0%) |
| Total (Category) | 926 (98.6%) | 13 (1.4%) |
| Total (Overall) | 4,659 (52.0%) | 4,292 (47.9%) |
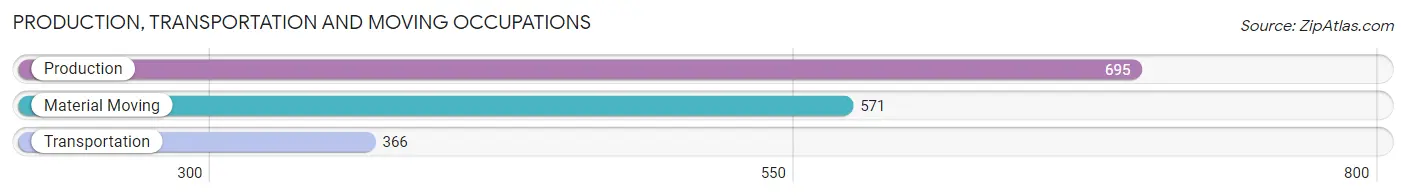
Production, Transportation and Moving Occupations
The most common Production, Transportation and Moving occupations in Ottawa are Production (695 | 7.8%), Material Moving (571 | 6.4%), and Transportation (366 | 4.1%).
Production, Transportation and Moving Occupations by Sex
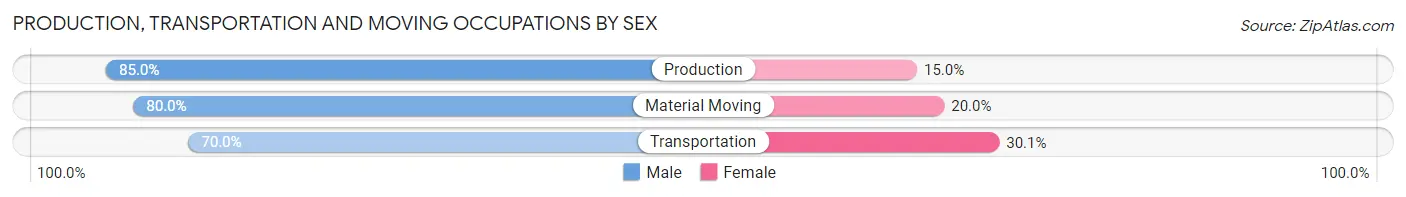
| Occupation | Male | Female |
| Production | 591 (85.0%) | 104 (15.0%) |
| Transportation | 256 (70.0%) | 110 (30.0%) |
| Material Moving | 457 (80.0%) | 114 (20.0%) |
| Total (Category) | 1,304 (79.9%) | 328 (20.1%) |
| Total (Overall) | 4,659 (52.0%) | 4,292 (47.9%) |
Employment Industries by Sex in Ottawa
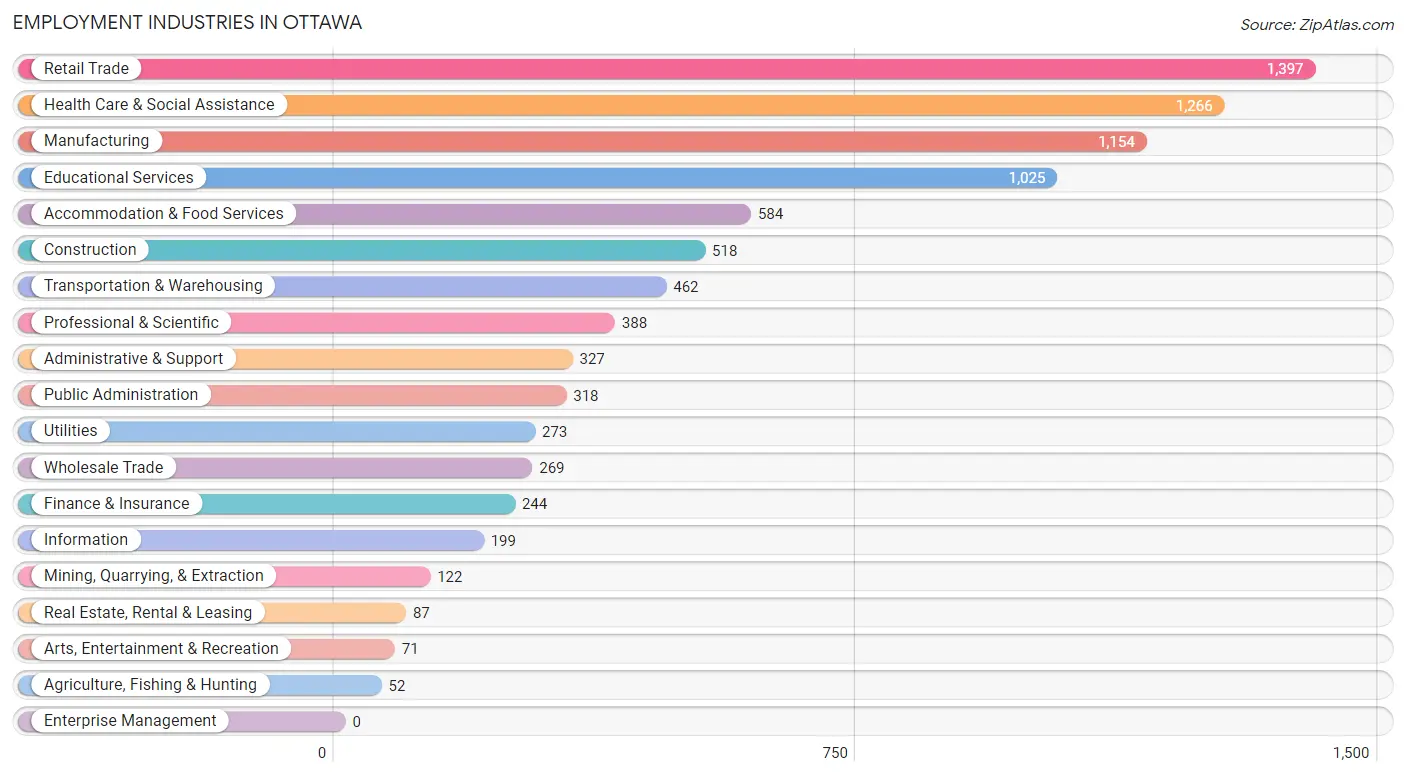
Employment Industries in Ottawa
The major employment industries in Ottawa include Retail Trade (1,397 | 15.6%), Health Care & Social Assistance (1,266 | 14.1%), Manufacturing (1,154 | 12.9%), Educational Services (1,025 | 11.5%), and Accommodation & Food Services (584 | 6.5%).
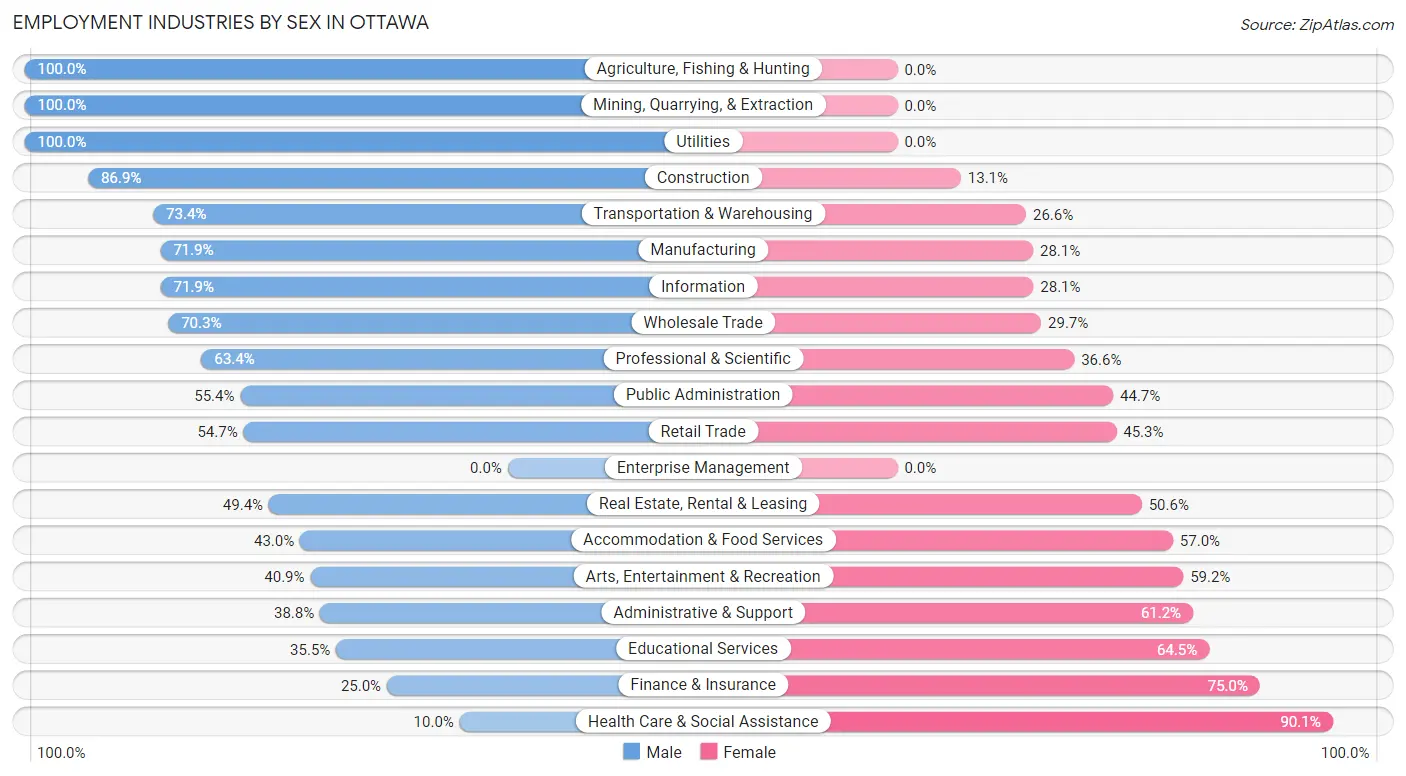
Employment Industries by Sex in Ottawa
The Ottawa industries that see more men than women are Agriculture, Fishing & Hunting (100.0%), Mining, Quarrying, & Extraction (100.0%), and Utilities (100.0%), whereas the industries that tend to have a higher number of women are Health Care & Social Assistance (90.0%), Finance & Insurance (75.0%), and Educational Services (64.5%).
| Industry | Male | Female |
| Agriculture, Fishing & Hunting | 52 (100.0%) | 0 (0.0%) |
| Mining, Quarrying, & Extraction | 122 (100.0%) | 0 (0.0%) |
| Construction | 450 (86.9%) | 68 (13.1%) |
| Manufacturing | 830 (71.9%) | 324 (28.1%) |
| Wholesale Trade | 189 (70.3%) | 80 (29.7%) |
| Retail Trade | 764 (54.7%) | 633 (45.3%) |
| Transportation & Warehousing | 339 (73.4%) | 123 (26.6%) |
| Utilities | 273 (100.0%) | 0 (0.0%) |
| Information | 143 (71.9%) | 56 (28.1%) |
| Finance & Insurance | 61 (25.0%) | 183 (75.0%) |
| Real Estate, Rental & Leasing | 43 (49.4%) | 44 (50.6%) |
| Professional & Scientific | 246 (63.4%) | 142 (36.6%) |
| Enterprise Management | 0 (0.0%) | 0 (0.0%) |
| Administrative & Support | 127 (38.8%) | 200 (61.2%) |
| Educational Services | 364 (35.5%) | 661 (64.5%) |
| Health Care & Social Assistance | 126 (10.0%) | 1,140 (90.0%) |
| Arts, Entertainment & Recreation | 29 (40.8%) | 42 (59.2%) |
| Accommodation & Food Services | 251 (43.0%) | 333 (57.0%) |
| Public Administration | 176 (55.3%) | 142 (44.7%) |
| Total | 4,659 (52.0%) | 4,292 (47.9%) |
Education in Ottawa
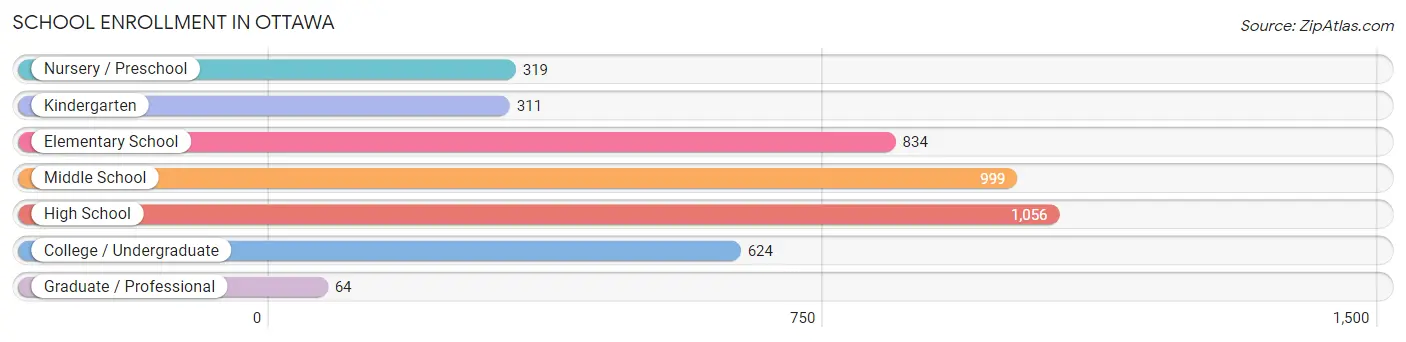
School Enrollment in Ottawa
The most common levels of schooling among the 4,207 students in Ottawa are high school (1,056 | 25.1%), middle school (999 | 23.7%), and elementary school (834 | 19.8%).
| School Level | # Students | % Students |
| Nursery / Preschool | 319 | 7.6% |
| Kindergarten | 311 | 7.4% |
| Elementary School | 834 | 19.8% |
| Middle School | 999 | 23.7% |
| High School | 1,056 | 25.1% |
| College / Undergraduate | 624 | 14.8% |
| Graduate / Professional | 64 | 1.5% |
| Total | 4,207 | 100.0% |
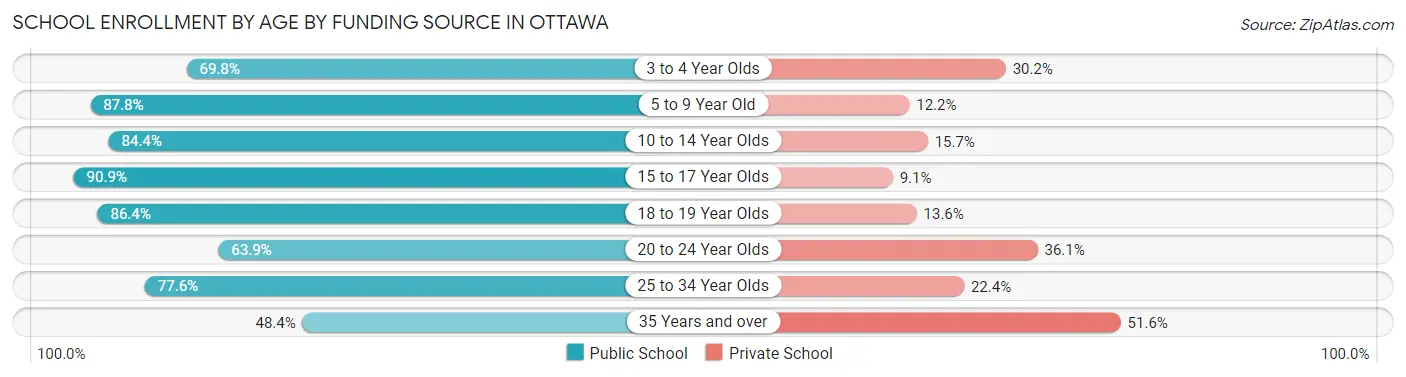
School Enrollment by Age by Funding Source in Ottawa
Out of a total of 4,207 students who are enrolled in schools in Ottawa, 711 (16.9%) attend a private institution, while the remaining 3,496 (83.1%) are enrolled in public schools. The age group of 35 years and over has the highest likelihood of being enrolled in private schools, with 81 (51.6% in the age bracket) enrolled. Conversely, the age group of 15 to 17 year olds has the lowest likelihood of being enrolled in a private school, with 716 (90.9% in the age bracket) attending a public institution.
| Age Bracket | Public School | Private School |
| 3 to 4 Year Olds | 199 (69.8%) | 86 (30.2%) |
| 5 to 9 Year Old | 1,005 (87.8%) | 140 (12.2%) |
| 10 to 14 Year Olds | 1,024 (84.4%) | 190 (15.7%) |
| 15 to 17 Year Olds | 716 (90.9%) | 72 (9.1%) |
| 18 to 19 Year Olds | 159 (86.4%) | 25 (13.6%) |
| 20 to 24 Year Olds | 92 (63.9%) | 52 (36.1%) |
| 25 to 34 Year Olds | 225 (77.6%) | 65 (22.4%) |
| 35 Years and over | 76 (48.4%) | 81 (51.6%) |
| Total | 3,496 (83.1%) | 711 (16.9%) |
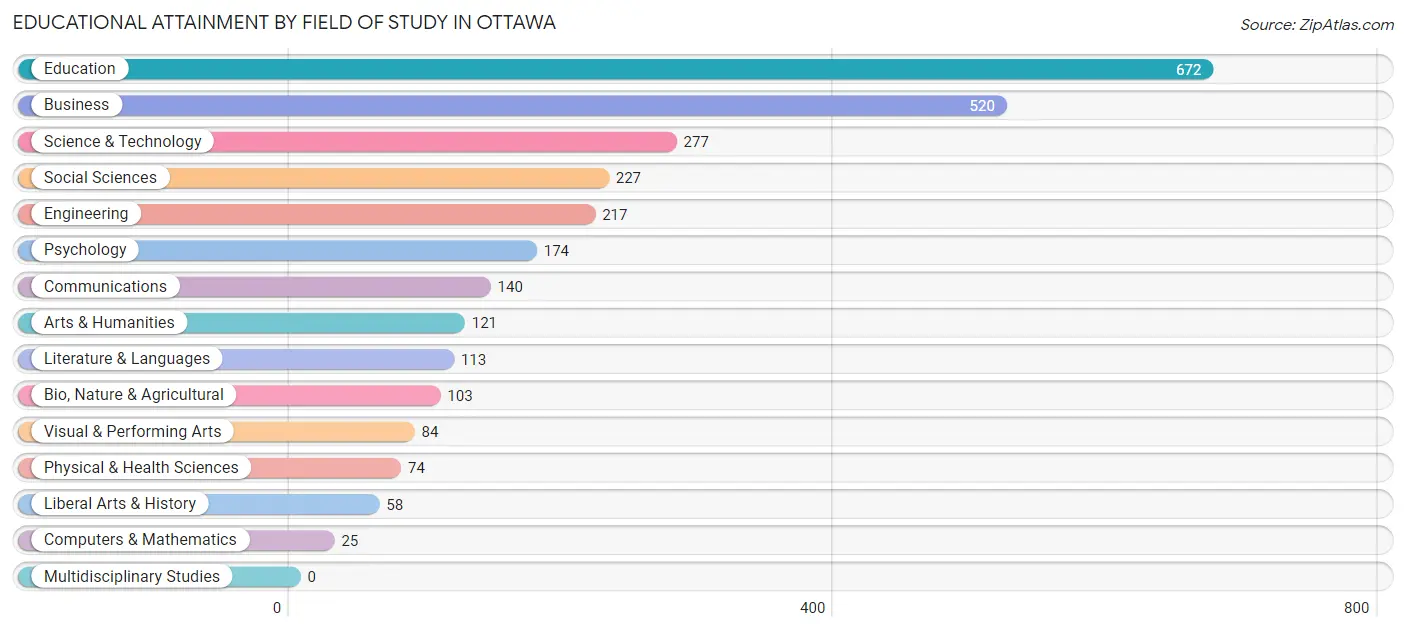
Educational Attainment by Field of Study in Ottawa
Education (672 | 24.0%), business (520 | 18.5%), science & technology (277 | 9.9%), social sciences (227 | 8.1%), and engineering (217 | 7.7%) are the most common fields of study among 2,805 individuals in Ottawa who have obtained a bachelor's degree or higher.
| Field of Study | # Graduates | % Graduates |
| Computers & Mathematics | 25 | 0.9% |
| Bio, Nature & Agricultural | 103 | 3.7% |
| Physical & Health Sciences | 74 | 2.6% |
| Psychology | 174 | 6.2% |
| Social Sciences | 227 | 8.1% |
| Engineering | 217 | 7.7% |
| Multidisciplinary Studies | 0 | 0.0% |
| Science & Technology | 277 | 9.9% |
| Business | 520 | 18.5% |
| Education | 672 | 24.0% |
| Literature & Languages | 113 | 4.0% |
| Liberal Arts & History | 58 | 2.1% |
| Visual & Performing Arts | 84 | 3.0% |
| Communications | 140 | 5.0% |
| Arts & Humanities | 121 | 4.3% |
| Total | 2,805 | 100.0% |
Transportation & Commute in Ottawa
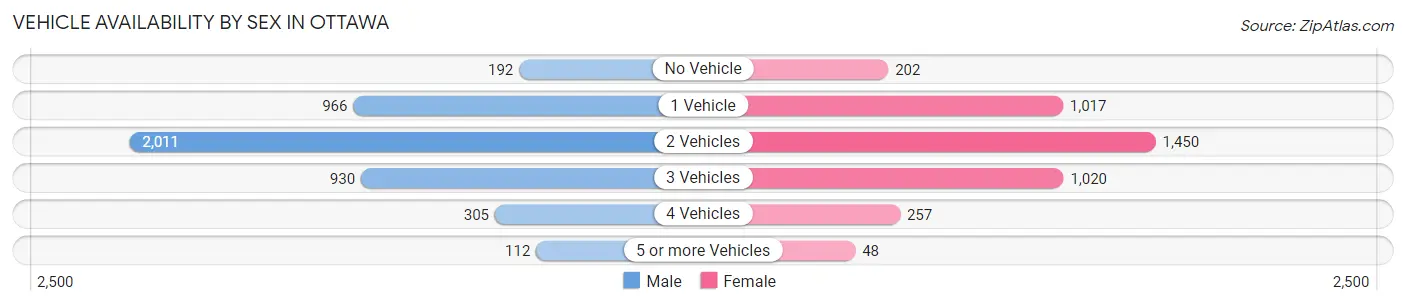
Vehicle Availability by Sex in Ottawa
The most prevalent vehicle ownership categories in Ottawa are males with 2 vehicles (2,011, accounting for 44.5%) and females with 2 vehicles (1,450, making up 50.3%).
| Vehicles Available | Male | Female |
| No Vehicle | 192 (4.3%) | 202 (5.1%) |
| 1 Vehicle | 966 (21.4%) | 1,017 (25.5%) |
| 2 Vehicles | 2,011 (44.5%) | 1,450 (36.3%) |
| 3 Vehicles | 930 (20.6%) | 1,020 (25.5%) |
| 4 Vehicles | 305 (6.8%) | 257 (6.4%) |
| 5 or more Vehicles | 112 (2.5%) | 48 (1.2%) |
| Total | 4,516 (100.0%) | 3,994 (100.0%) |
Commute Time in Ottawa
The most frequently occuring commute durations in Ottawa are 10 to 14 minutes (1,818 commuters, 22.2%), 5 to 9 minutes (1,760 commuters, 21.5%), and 15 to 19 minutes (1,008 commuters, 12.3%).
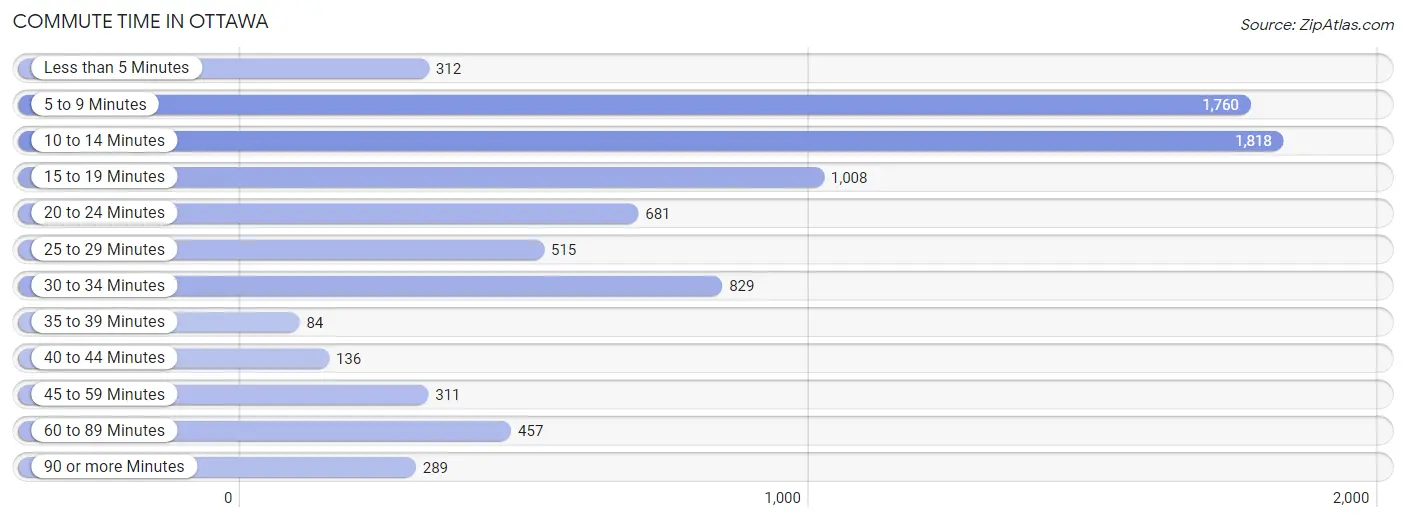
| Commute Time | # Commuters | % Commuters |
| Less than 5 Minutes | 312 | 3.8% |
| 5 to 9 Minutes | 1,760 | 21.5% |
| 10 to 14 Minutes | 1,818 | 22.2% |
| 15 to 19 Minutes | 1,008 | 12.3% |
| 20 to 24 Minutes | 681 | 8.3% |
| 25 to 29 Minutes | 515 | 6.3% |
| 30 to 34 Minutes | 829 | 10.1% |
| 35 to 39 Minutes | 84 | 1.0% |
| 40 to 44 Minutes | 136 | 1.7% |
| 45 to 59 Minutes | 311 | 3.8% |
| 60 to 89 Minutes | 457 | 5.6% |
| 90 or more Minutes | 289 | 3.5% |
Commute Time by Sex in Ottawa
The most common commute times in Ottawa are 5 to 9 minutes (840 commuters, 18.9%) for males and 10 to 14 minutes (978 commuters, 26.0%) for females.
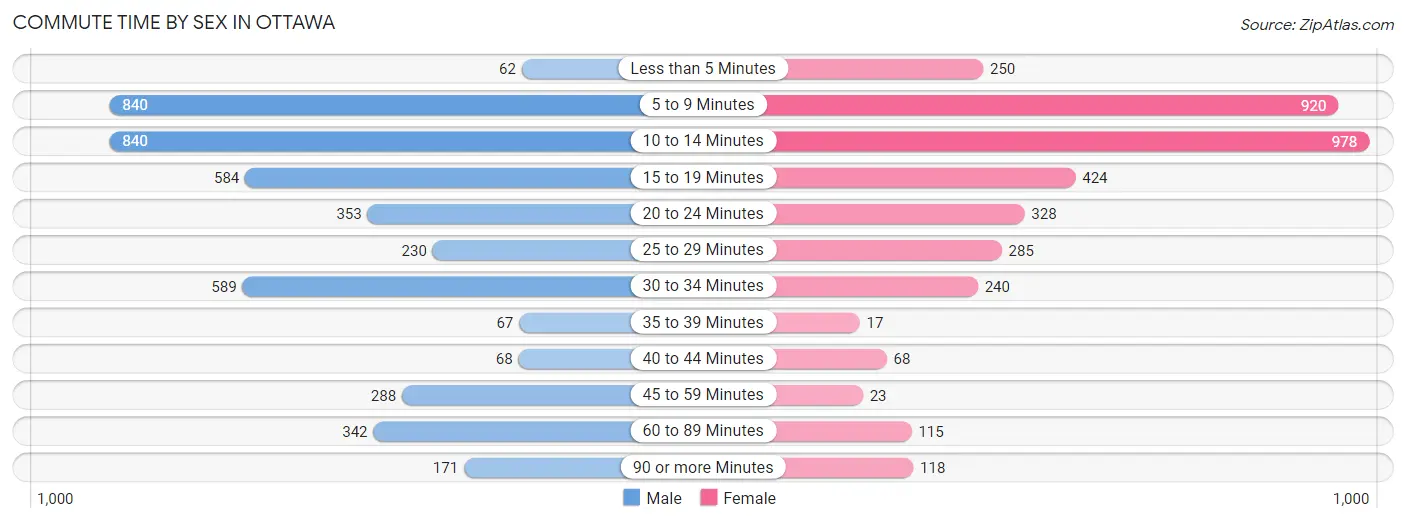
| Commute Time | Male | Female |
| Less than 5 Minutes | 62 (1.4%) | 250 (6.6%) |
| 5 to 9 Minutes | 840 (18.9%) | 920 (24.4%) |
| 10 to 14 Minutes | 840 (18.9%) | 978 (26.0%) |
| 15 to 19 Minutes | 584 (13.2%) | 424 (11.3%) |
| 20 to 24 Minutes | 353 (8.0%) | 328 (8.7%) |
| 25 to 29 Minutes | 230 (5.2%) | 285 (7.6%) |
| 30 to 34 Minutes | 589 (13.3%) | 240 (6.4%) |
| 35 to 39 Minutes | 67 (1.5%) | 17 (0.4%) |
| 40 to 44 Minutes | 68 (1.5%) | 68 (1.8%) |
| 45 to 59 Minutes | 288 (6.5%) | 23 (0.6%) |
| 60 to 89 Minutes | 342 (7.7%) | 115 (3.0%) |
| 90 or more Minutes | 171 (3.9%) | 118 (3.1%) |
Time of Departure to Work by Sex in Ottawa
The most frequent times of departure to work in Ottawa are 4:00 PM to 11:59 PM (667, 15.0%) for males and 7:30 AM to 7:59 AM (796, 21.1%) for females.
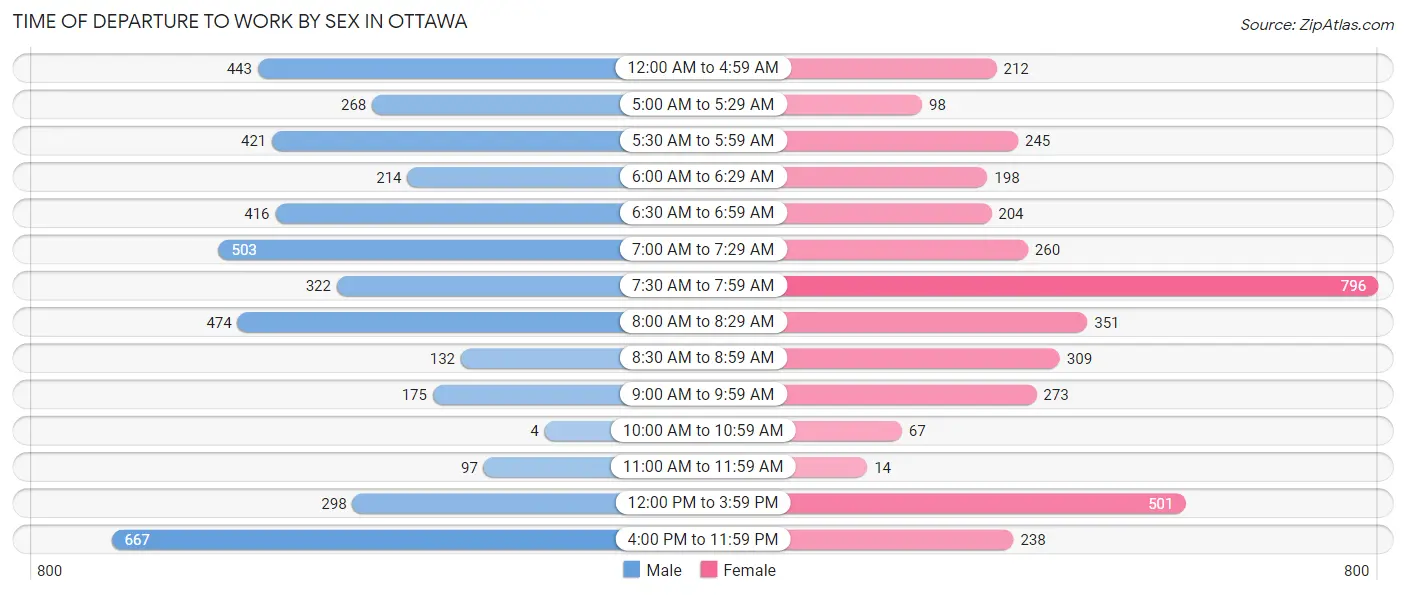
| Time of Departure | Male | Female |
| 12:00 AM to 4:59 AM | 443 (10.0%) | 212 (5.6%) |
| 5:00 AM to 5:29 AM | 268 (6.0%) | 98 (2.6%) |
| 5:30 AM to 5:59 AM | 421 (9.5%) | 245 (6.5%) |
| 6:00 AM to 6:29 AM | 214 (4.8%) | 198 (5.3%) |
| 6:30 AM to 6:59 AM | 416 (9.4%) | 204 (5.4%) |
| 7:00 AM to 7:29 AM | 503 (11.3%) | 260 (6.9%) |
| 7:30 AM to 7:59 AM | 322 (7.3%) | 796 (21.1%) |
| 8:00 AM to 8:29 AM | 474 (10.7%) | 351 (9.3%) |
| 8:30 AM to 8:59 AM | 132 (3.0%) | 309 (8.2%) |
| 9:00 AM to 9:59 AM | 175 (4.0%) | 273 (7.2%) |
| 10:00 AM to 10:59 AM | 4 (0.1%) | 67 (1.8%) |
| 11:00 AM to 11:59 AM | 97 (2.2%) | 14 (0.4%) |
| 12:00 PM to 3:59 PM | 298 (6.7%) | 501 (13.3%) |
| 4:00 PM to 11:59 PM | 667 (15.0%) | 238 (6.3%) |
| Total | 4,434 (100.0%) | 3,766 (100.0%) |
Housing Occupancy in Ottawa
Occupancy by Ownership in Ottawa
Of the total 7,634 dwellings in Ottawa, owner-occupied units account for 5,235 (68.6%), while renter-occupied units make up 2,399 (31.4%).
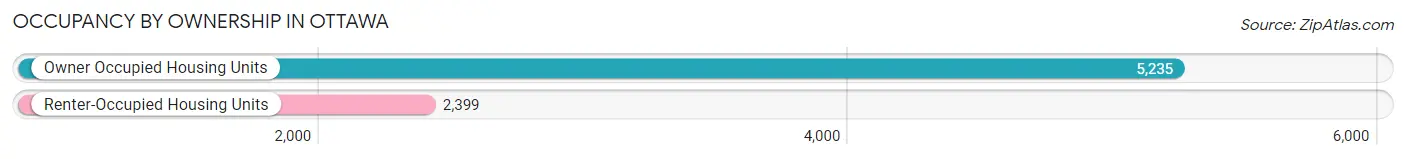
| Occupancy | # Housing Units | % Housing Units |
| Owner Occupied Housing Units | 5,235 | 68.6% |
| Renter-Occupied Housing Units | 2,399 | 31.4% |
| Total Occupied Housing Units | 7,634 | 100.0% |
Occupancy by Household Size in Ottawa
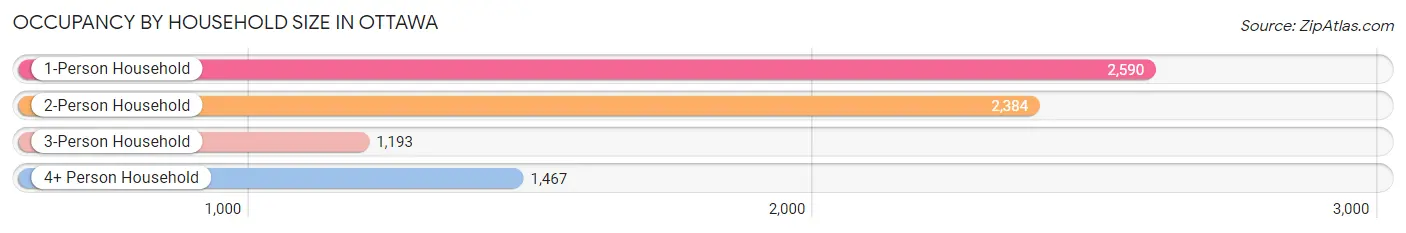
| Household Size | # Housing Units | % Housing Units |
| 1-Person Household | 2,590 | 33.9% |
| 2-Person Household | 2,384 | 31.2% |
| 3-Person Household | 1,193 | 15.6% |
| 4+ Person Household | 1,467 | 19.2% |
| Total Housing Units | 7,634 | 100.0% |
Occupancy by Ownership by Household Size in Ottawa
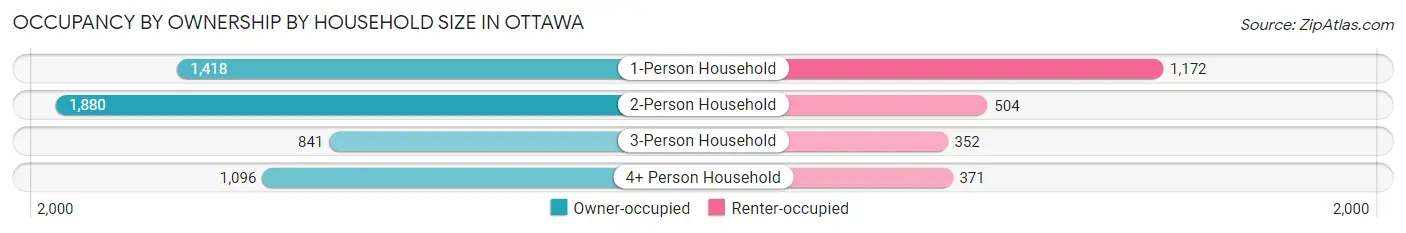
| Household Size | Owner-occupied | Renter-occupied |
| 1-Person Household | 1,418 (54.7%) | 1,172 (45.3%) |
| 2-Person Household | 1,880 (78.9%) | 504 (21.1%) |
| 3-Person Household | 841 (70.5%) | 352 (29.5%) |
| 4+ Person Household | 1,096 (74.7%) | 371 (25.3%) |
| Total Housing Units | 5,235 (68.6%) | 2,399 (31.4%) |
Occupancy by Educational Attainment in Ottawa
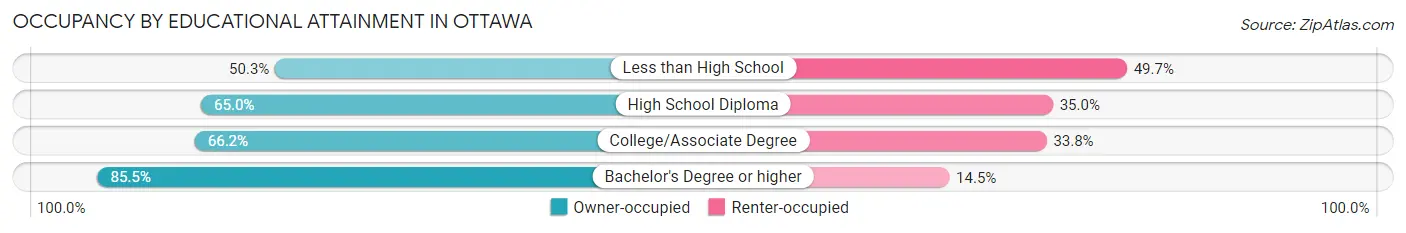
| Household Size | Owner-occupied | Renter-occupied |
| Less than High School | 310 (50.3%) | 306 (49.7%) |
| High School Diploma | 1,563 (65.0%) | 842 (35.0%) |
| College/Associate Degree | 2,003 (66.2%) | 1,021 (33.8%) |
| Bachelor's Degree or higher | 1,359 (85.5%) | 230 (14.5%) |
Occupancy by Age of Householder in Ottawa
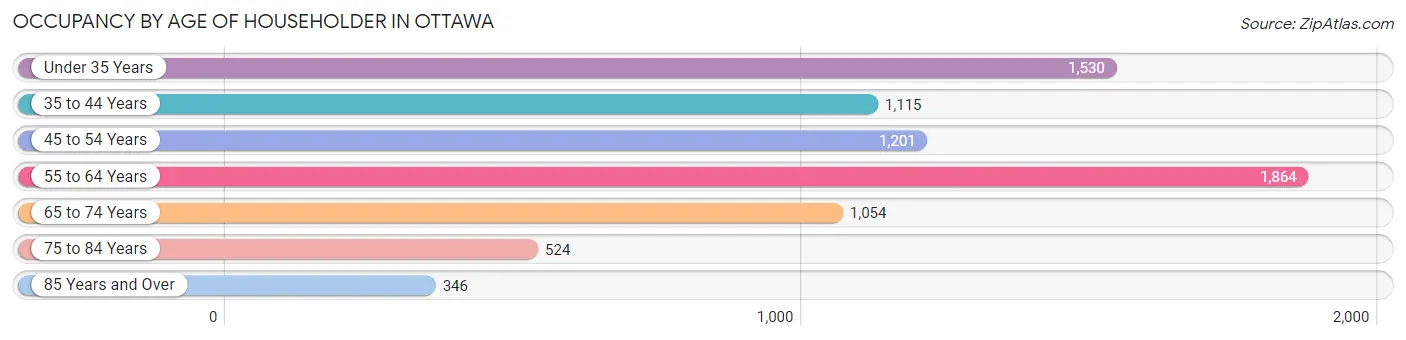
| Age Bracket | # Households | % Households |
| Under 35 Years | 1,530 | 20.0% |
| 35 to 44 Years | 1,115 | 14.6% |
| 45 to 54 Years | 1,201 | 15.7% |
| 55 to 64 Years | 1,864 | 24.4% |
| 65 to 74 Years | 1,054 | 13.8% |
| 75 to 84 Years | 524 | 6.9% |
| 85 Years and Over | 346 | 4.5% |
| Total | 7,634 | 100.0% |
Housing Finances in Ottawa
Median Income by Occupancy in Ottawa
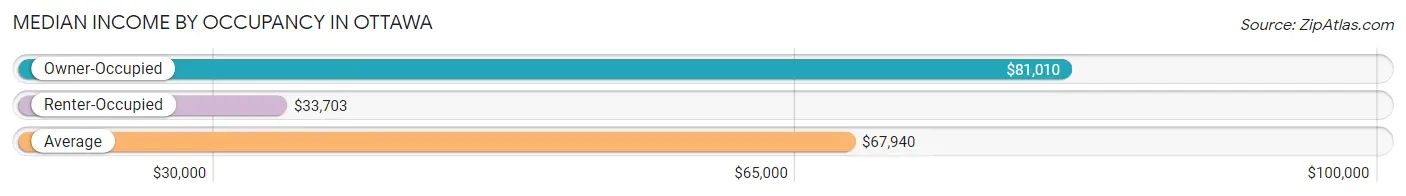
| Occupancy Type | # Households | Median Income |
| Owner-Occupied | 5,235 (68.6%) | $81,010 |
| Renter-Occupied | 2,399 (31.4%) | $33,703 |
| Average | 7,634 (100.0%) | $67,940 |
Occupancy by Householder Income Bracket in Ottawa
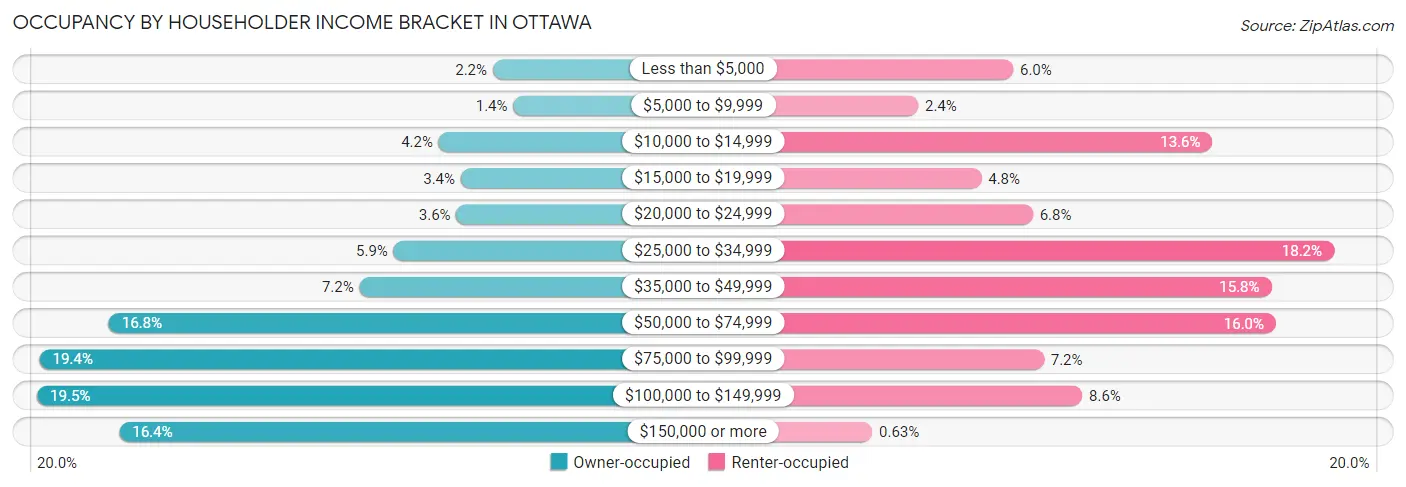
| Income Bracket | Owner-occupied | Renter-occupied |
| Less than $5,000 | 113 (2.2%) | 144 (6.0%) |
| $5,000 to $9,999 | 72 (1.4%) | 57 (2.4%) |
| $10,000 to $14,999 | 221 (4.2%) | 326 (13.6%) |
| $15,000 to $19,999 | 177 (3.4%) | 115 (4.8%) |
| $20,000 to $24,999 | 186 (3.5%) | 162 (6.8%) |
| $25,000 to $34,999 | 311 (5.9%) | 437 (18.2%) |
| $35,000 to $49,999 | 379 (7.2%) | 380 (15.8%) |
| $50,000 to $74,999 | 879 (16.8%) | 384 (16.0%) |
| $75,000 to $99,999 | 1,017 (19.4%) | 172 (7.2%) |
| $100,000 to $149,999 | 1,022 (19.5%) | 207 (8.6%) |
| $150,000 or more | 858 (16.4%) | 15 (0.6%) |
| Total | 5,235 (100.0%) | 2,399 (100.0%) |
Monthly Housing Cost Tiers in Ottawa
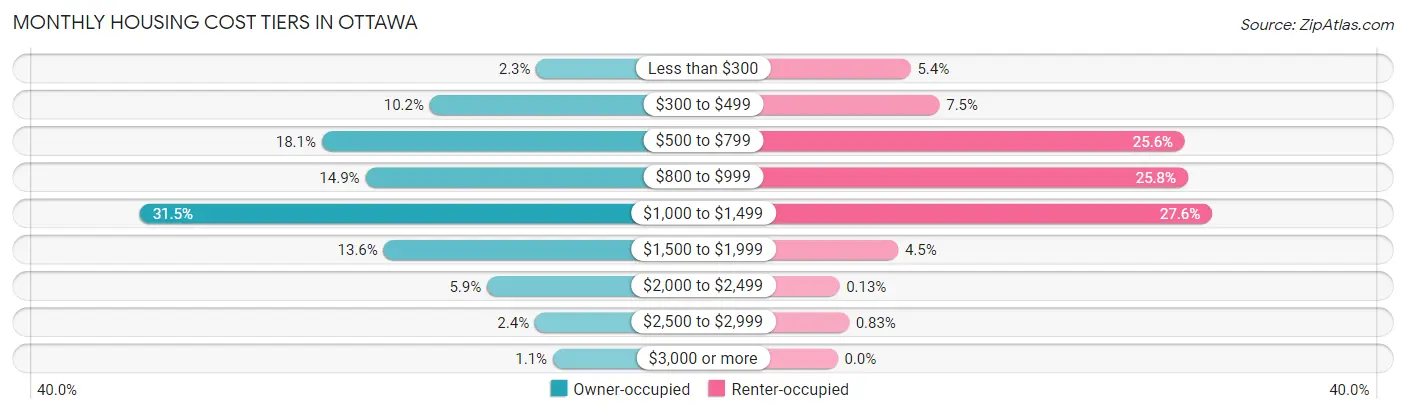
| Monthly Cost | Owner-occupied | Renter-occupied |
| Less than $300 | 121 (2.3%) | 129 (5.4%) |
| $300 to $499 | 532 (10.2%) | 180 (7.5%) |
| $500 to $799 | 948 (18.1%) | 614 (25.6%) |
| $800 to $999 | 780 (14.9%) | 619 (25.8%) |
| $1,000 to $1,499 | 1,650 (31.5%) | 662 (27.6%) |
| $1,500 to $1,999 | 710 (13.6%) | 107 (4.5%) |
| $2,000 to $2,499 | 311 (5.9%) | 3 (0.1%) |
| $2,500 to $2,999 | 126 (2.4%) | 20 (0.8%) |
| $3,000 or more | 57 (1.1%) | 0 (0.0%) |
| Total | 5,235 (100.0%) | 2,399 (100.0%) |
Physical Housing Characteristics in Ottawa
Housing Structures in Ottawa
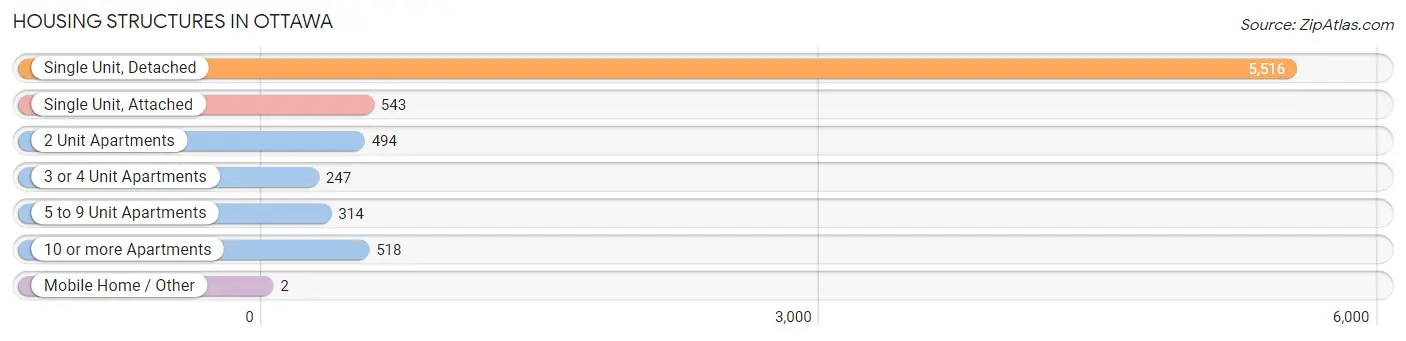
| Structure Type | # Housing Units | % Housing Units |
| Single Unit, Detached | 5,516 | 72.3% |
| Single Unit, Attached | 543 | 7.1% |
| 2 Unit Apartments | 494 | 6.5% |
| 3 or 4 Unit Apartments | 247 | 3.2% |
| 5 to 9 Unit Apartments | 314 | 4.1% |
| 10 or more Apartments | 518 | 6.8% |
| Mobile Home / Other | 2 | 0.0% |
| Total | 7,634 | 100.0% |
Housing Structures by Occupancy in Ottawa
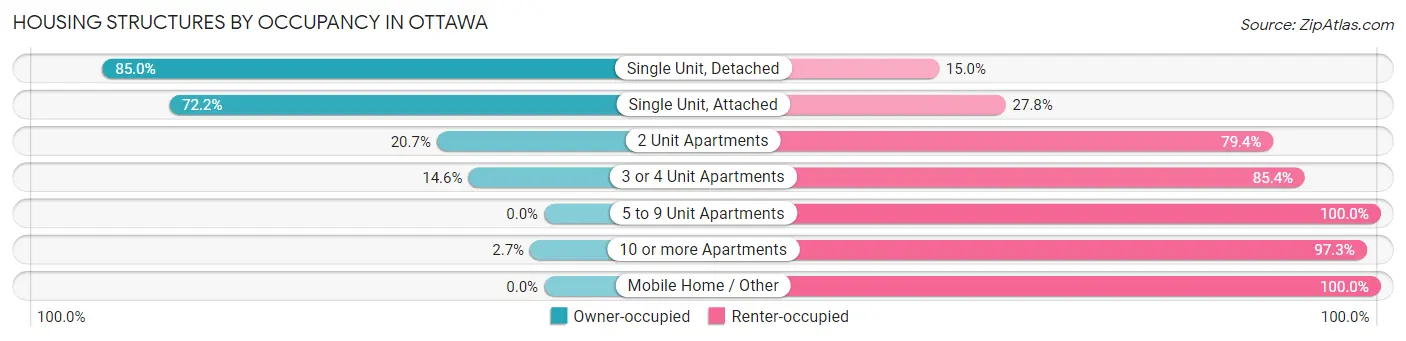
| Structure Type | Owner-occupied | Renter-occupied |
| Single Unit, Detached | 4,691 (85.0%) | 825 (15.0%) |
| Single Unit, Attached | 392 (72.2%) | 151 (27.8%) |
| 2 Unit Apartments | 102 (20.6%) | 392 (79.3%) |
| 3 or 4 Unit Apartments | 36 (14.6%) | 211 (85.4%) |
| 5 to 9 Unit Apartments | 0 (0.0%) | 314 (100.0%) |
| 10 or more Apartments | 14 (2.7%) | 504 (97.3%) |
| Mobile Home / Other | 0 (0.0%) | 2 (100.0%) |
| Total | 5,235 (68.6%) | 2,399 (31.4%) |
Housing Structures by Number of Rooms in Ottawa
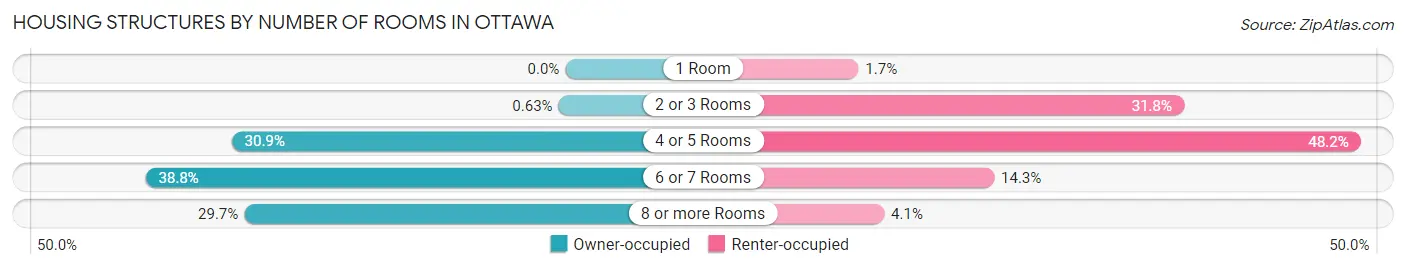
| Number of Rooms | Owner-occupied | Renter-occupied |
| 1 Room | 0 (0.0%) | 41 (1.7%) |
| 2 or 3 Rooms | 33 (0.6%) | 763 (31.8%) |
| 4 or 5 Rooms | 1,615 (30.8%) | 1,155 (48.1%) |
| 6 or 7 Rooms | 2,032 (38.8%) | 342 (14.3%) |
| 8 or more Rooms | 1,555 (29.7%) | 98 (4.1%) |
| Total | 5,235 (100.0%) | 2,399 (100.0%) |
Housing Structure by Heating Type in Ottawa
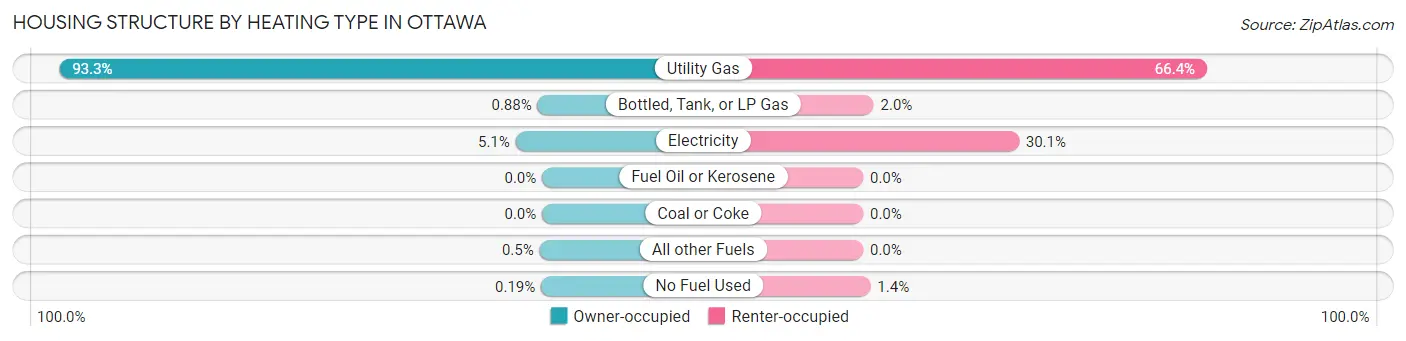
| Heating Type | Owner-occupied | Renter-occupied |
| Utility Gas | 4,885 (93.3%) | 1,594 (66.4%) |
| Bottled, Tank, or LP Gas | 46 (0.9%) | 49 (2.0%) |
| Electricity | 268 (5.1%) | 722 (30.1%) |
| Fuel Oil or Kerosene | 0 (0.0%) | 0 (0.0%) |
| Coal or Coke | 0 (0.0%) | 0 (0.0%) |
| All other Fuels | 26 (0.5%) | 0 (0.0%) |
| No Fuel Used | 10 (0.2%) | 34 (1.4%) |
| Total | 5,235 (100.0%) | 2,399 (100.0%) |
Household Vehicle Usage in Ottawa
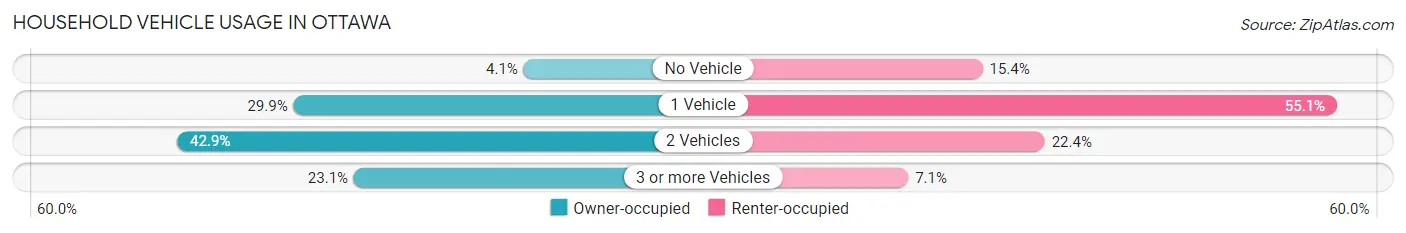
| Vehicles per Household | Owner-occupied | Renter-occupied |
| No Vehicle | 214 (4.1%) | 370 (15.4%) |
| 1 Vehicle | 1,564 (29.9%) | 1,322 (55.1%) |
| 2 Vehicles | 2,247 (42.9%) | 537 (22.4%) |
| 3 or more Vehicles | 1,210 (23.1%) | 170 (7.1%) |
| Total | 5,235 (100.0%) | 2,399 (100.0%) |
Real Estate & Mortgages in Ottawa
Real Estate and Mortgage Overview in Ottawa
| Characteristic | Without Mortgage | With Mortgage |
| Housing Units | 1,823 | 3,412 |
| Median Property Value | $123,200 | $146,700 |
| Median Household Income | $64,471 | $681 |
| Monthly Housing Costs | $566 | $46 |
| Real Estate Taxes | $3,458 | $74 |
Property Value by Mortgage Status in Ottawa
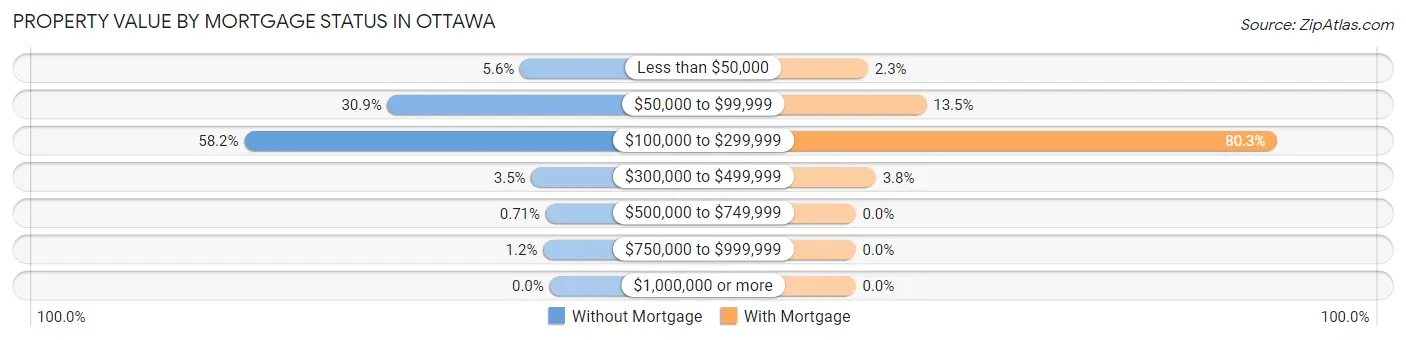
| Property Value | Without Mortgage | With Mortgage |
| Less than $50,000 | 102 (5.6%) | 80 (2.3%) |
| $50,000 to $99,999 | 563 (30.9%) | 460 (13.5%) |
| $100,000 to $299,999 | 1,060 (58.2%) | 2,741 (80.3%) |
| $300,000 to $499,999 | 63 (3.5%) | 131 (3.8%) |
| $500,000 to $749,999 | 13 (0.7%) | 0 (0.0%) |
| $750,000 to $999,999 | 22 (1.2%) | 0 (0.0%) |
| $1,000,000 or more | 0 (0.0%) | 0 (0.0%) |
| Total | 1,823 (100.0%) | 3,412 (100.0%) |
Household Income by Mortgage Status in Ottawa
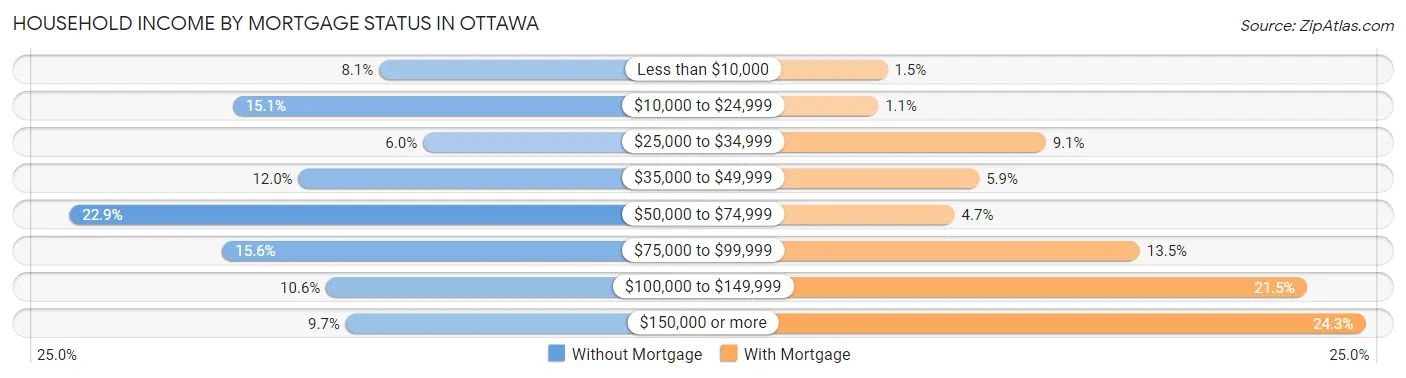
| Household Income | Without Mortgage | With Mortgage |
| Less than $10,000 | 148 (8.1%) | 52 (1.5%) |
| $10,000 to $24,999 | 275 (15.1%) | 37 (1.1%) |
| $25,000 to $34,999 | 110 (6.0%) | 309 (9.1%) |
| $35,000 to $49,999 | 218 (12.0%) | 201 (5.9%) |
| $50,000 to $74,999 | 417 (22.9%) | 161 (4.7%) |
| $75,000 to $99,999 | 284 (15.6%) | 462 (13.5%) |
| $100,000 to $149,999 | 194 (10.6%) | 733 (21.5%) |
| $150,000 or more | 177 (9.7%) | 828 (24.3%) |
| Total | 1,823 (100.0%) | 3,412 (100.0%) |
Property Value to Household Income Ratio in Ottawa
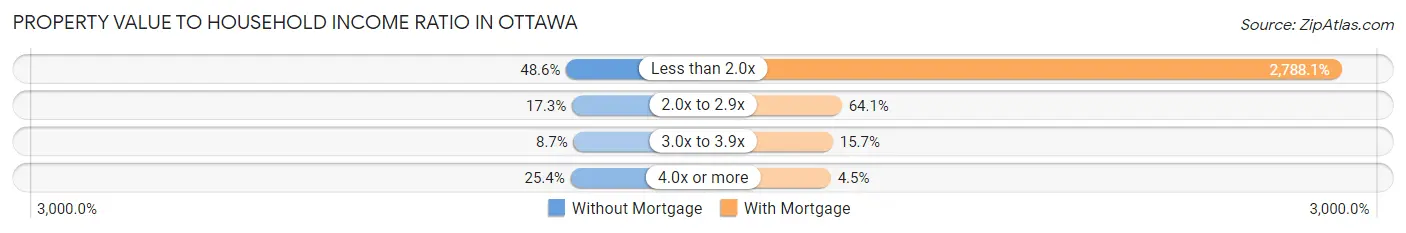
| Value-to-Income Ratio | Without Mortgage | With Mortgage |
| Less than 2.0x | 886 (48.6%) | 95,129 (2,788.1%) |
| 2.0x to 2.9x | 316 (17.3%) | 2,187 (64.1%) |
| 3.0x to 3.9x | 158 (8.7%) | 534 (15.7%) |
| 4.0x or more | 463 (25.4%) | 154 (4.5%) |
| Total | 1,823 (100.0%) | 3,412 (100.0%) |
Real Estate Taxes by Mortgage Status in Ottawa
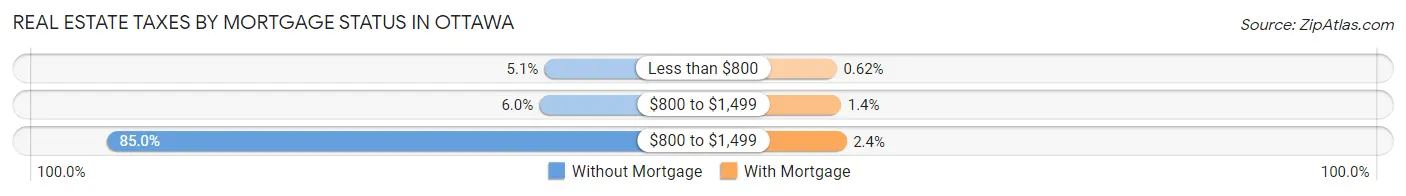
| Property Taxes | Without Mortgage | With Mortgage |
| Less than $800 | 93 (5.1%) | 21 (0.6%) |
| $800 to $1,499 | 110 (6.0%) | 48 (1.4%) |
| $800 to $1,499 | 1,550 (85.0%) | 82 (2.4%) |
| Total | 1,823 (100.0%) | 3,412 (100.0%) |
Health & Disability in Ottawa
Health Insurance Coverage by Age in Ottawa
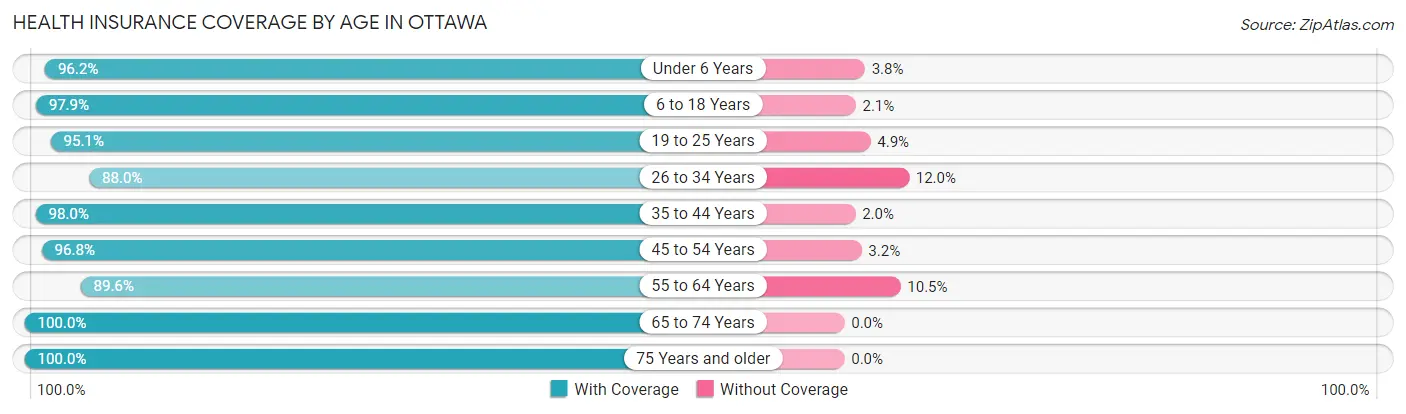
| Age Bracket | With Coverage | Without Coverage |
| Under 6 Years | 1,387 (96.2%) | 55 (3.8%) |
| 6 to 18 Years | 3,032 (97.9%) | 65 (2.1%) |
| 19 to 25 Years | 1,272 (95.1%) | 65 (4.9%) |
| 26 to 34 Years | 2,108 (88.0%) | 288 (12.0%) |
| 35 to 44 Years | 2,069 (98.0%) | 43 (2.0%) |
| 45 to 54 Years | 1,973 (96.8%) | 65 (3.2%) |
| 55 to 64 Years | 2,802 (89.5%) | 327 (10.4%) |
| 65 to 74 Years | 1,636 (100.0%) | 0 (0.0%) |
| 75 Years and older | 1,188 (100.0%) | 0 (0.0%) |
| Total | 17,467 (95.1%) | 908 (4.9%) |
Health Insurance Coverage by Citizenship Status in Ottawa
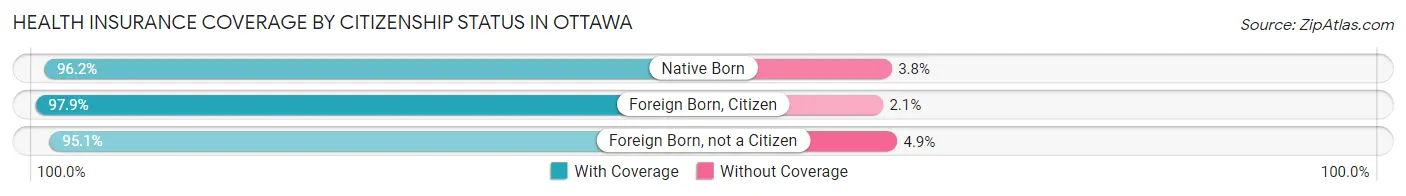
| Citizenship Status | With Coverage | Without Coverage |
| Native Born | 1,387 (96.2%) | 55 (3.8%) |
| Foreign Born, Citizen | 3,032 (97.9%) | 65 (2.1%) |
| Foreign Born, not a Citizen | 1,272 (95.1%) | 65 (4.9%) |
Health Insurance Coverage by Household Income in Ottawa
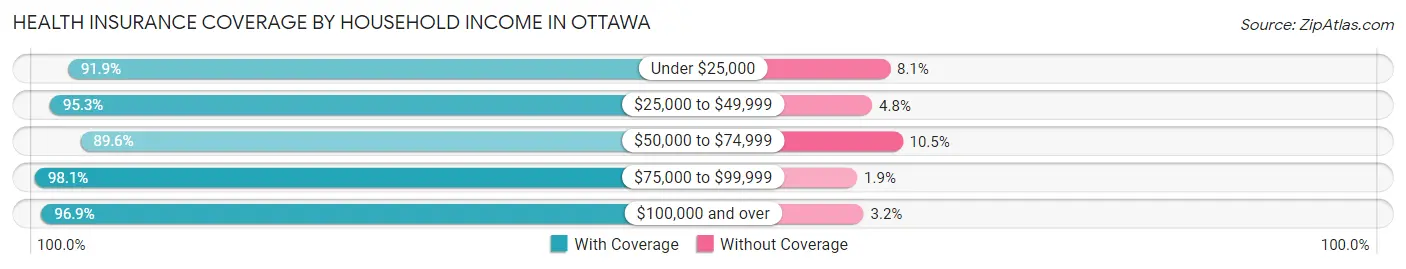
| Household Income | With Coverage | Without Coverage |
| Under $25,000 | 2,350 (91.9%) | 207 (8.1%) |
| $25,000 to $49,999 | 3,109 (95.3%) | 155 (4.8%) |
| $50,000 to $74,999 | 2,373 (89.5%) | 277 (10.4%) |
| $75,000 to $99,999 | 3,292 (98.1%) | 65 (1.9%) |
| $100,000 and over | 6,267 (96.9%) | 204 (3.2%) |
Public vs Private Health Insurance Coverage by Age in Ottawa
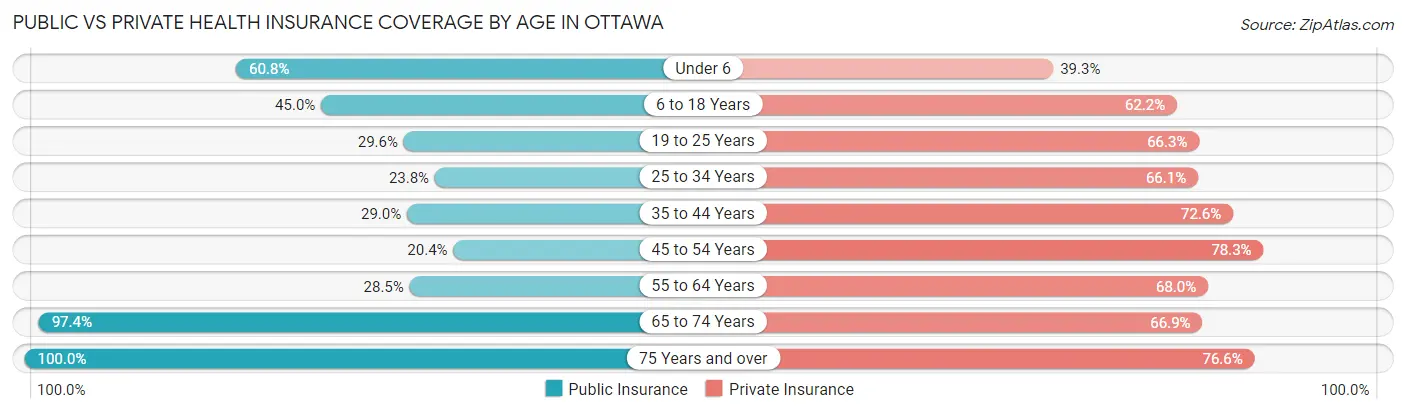
| Age Bracket | Public Insurance | Private Insurance |
| Under 6 | 876 (60.8%) | 566 (39.3%) |
| 6 to 18 Years | 1,392 (45.0%) | 1,927 (62.2%) |
| 19 to 25 Years | 396 (29.6%) | 887 (66.3%) |
| 25 to 34 Years | 571 (23.8%) | 1,584 (66.1%) |
| 35 to 44 Years | 613 (29.0%) | 1,534 (72.6%) |
| 45 to 54 Years | 416 (20.4%) | 1,595 (78.3%) |
| 55 to 64 Years | 893 (28.5%) | 2,127 (68.0%) |
| 65 to 74 Years | 1,593 (97.4%) | 1,095 (66.9%) |
| 75 Years and over | 1,188 (100.0%) | 910 (76.6%) |
| Total | 7,938 (43.2%) | 12,225 (66.5%) |
Disability Status by Sex by Age in Ottawa
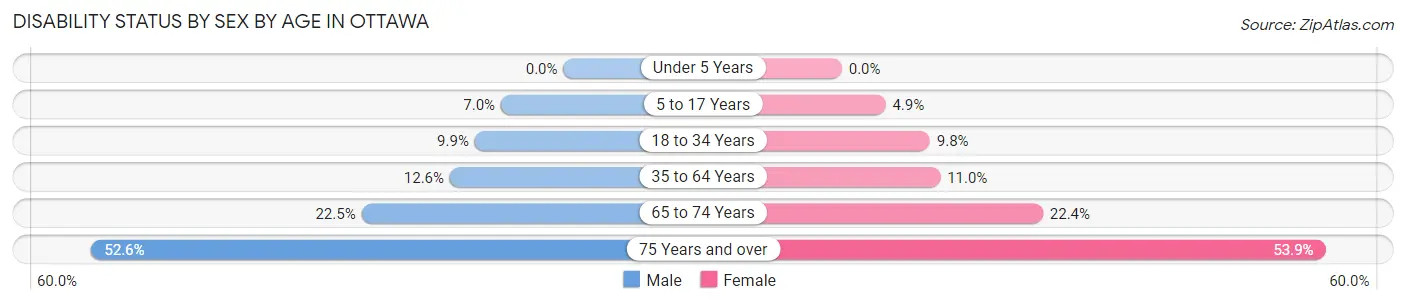
| Age Bracket | Male | Female |
| Under 5 Years | 0 (0.0%) | 0 (0.0%) |
| 5 to 17 Years | 111 (7.0%) | 82 (4.9%) |
| 18 to 34 Years | 187 (9.9%) | 190 (9.8%) |
| 35 to 64 Years | 446 (12.6%) | 411 (11.0%) |
| 65 to 74 Years | 176 (22.5%) | 191 (22.4%) |
| 75 Years and over | 195 (52.6%) | 440 (53.9%) |
Disability Class by Sex by Age in Ottawa
Disability Class: Hearing Difficulty
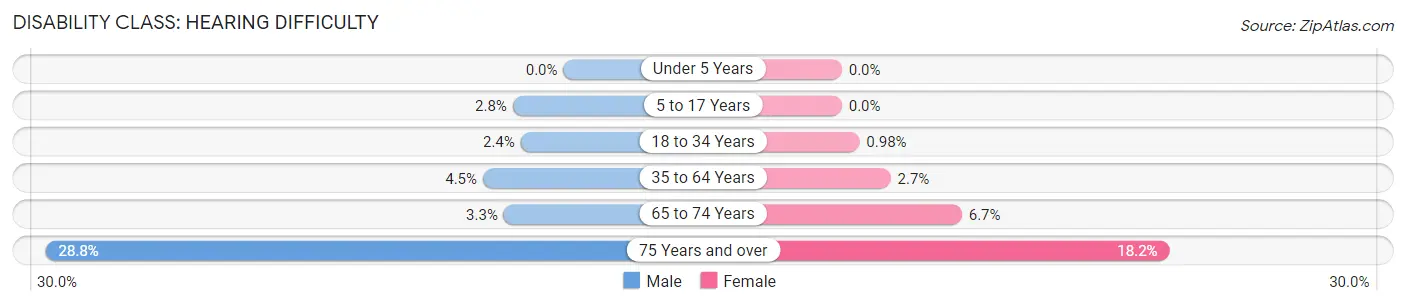
| Age Bracket | Male | Female |
| Under 5 Years | 0 (0.0%) | 0 (0.0%) |
| 5 to 17 Years | 45 (2.8%) | 0 (0.0%) |
| 18 to 34 Years | 45 (2.4%) | 19 (1.0%) |
| 35 to 64 Years | 158 (4.5%) | 102 (2.7%) |
| 65 to 74 Years | 26 (3.3%) | 57 (6.7%) |
| 75 Years and over | 107 (28.8%) | 149 (18.2%) |
Disability Class: Vision Difficulty
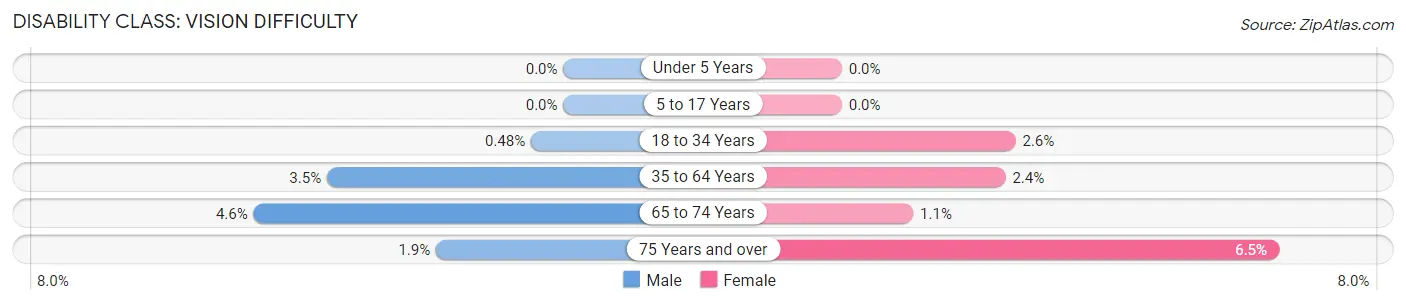
| Age Bracket | Male | Female |
| Under 5 Years | 0 (0.0%) | 0 (0.0%) |
| 5 to 17 Years | 0 (0.0%) | 0 (0.0%) |
| 18 to 34 Years | 9 (0.5%) | 50 (2.6%) |
| 35 to 64 Years | 124 (3.5%) | 91 (2.4%) |
| 65 to 74 Years | 36 (4.6%) | 9 (1.1%) |
| 75 Years and over | 7 (1.9%) | 53 (6.5%) |
Disability Class: Cognitive Difficulty
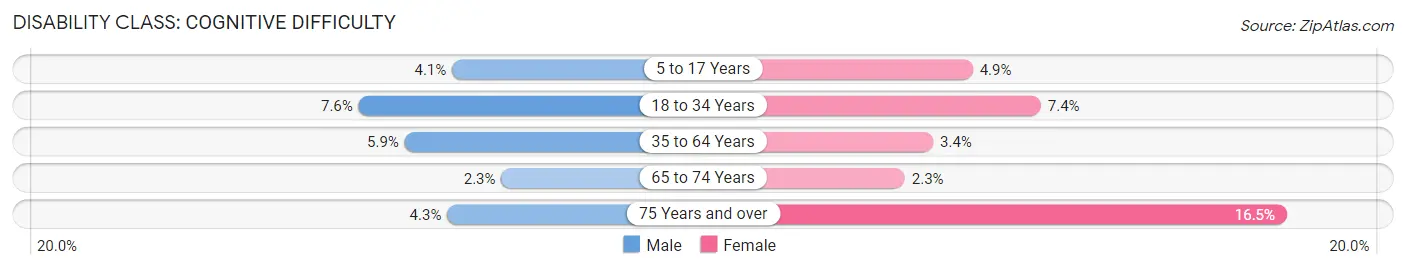
| Age Bracket | Male | Female |
| 5 to 17 Years | 66 (4.1%) | 82 (4.9%) |
| 18 to 34 Years | 144 (7.6%) | 143 (7.4%) |
| 35 to 64 Years | 208 (5.9%) | 127 (3.4%) |
| 65 to 74 Years | 18 (2.3%) | 20 (2.3%) |
| 75 Years and over | 16 (4.3%) | 135 (16.5%) |
Disability Class: Ambulatory Difficulty
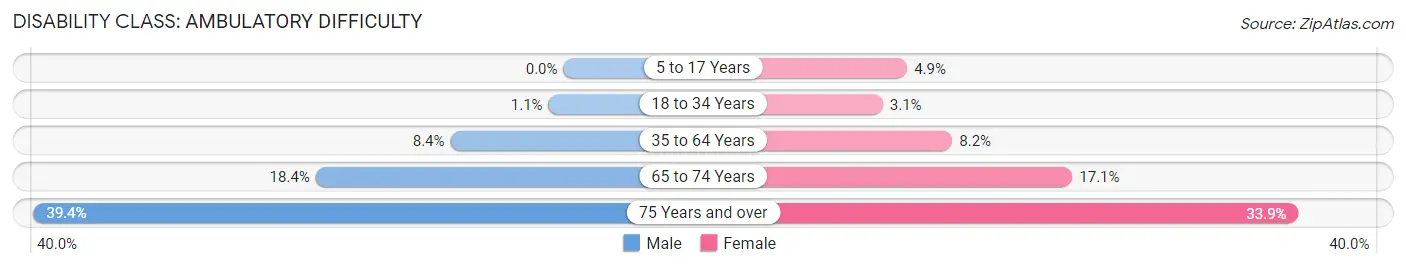
| Age Bracket | Male | Female |
| 5 to 17 Years | 0 (0.0%) | 82 (4.9%) |
| 18 to 34 Years | 21 (1.1%) | 59 (3.0%) |
| 35 to 64 Years | 296 (8.4%) | 308 (8.2%) |
| 65 to 74 Years | 144 (18.4%) | 146 (17.1%) |
| 75 Years and over | 146 (39.4%) | 277 (33.9%) |
Disability Class: Self-Care Difficulty
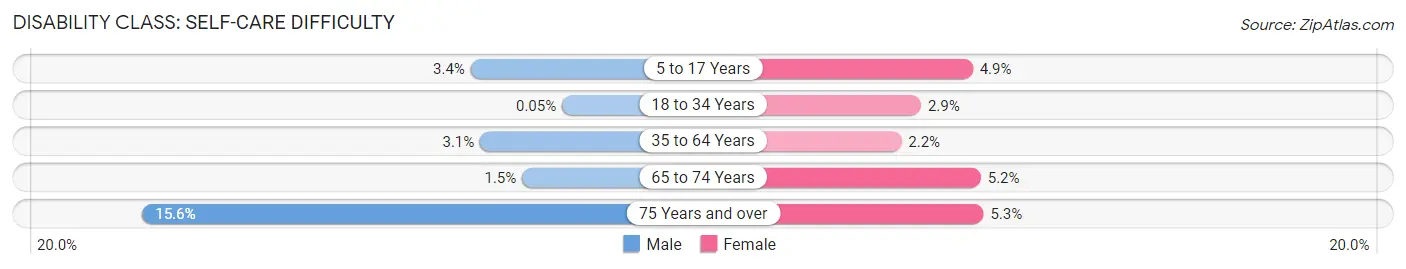
| Age Bracket | Male | Female |
| 5 to 17 Years | 55 (3.4%) | 82 (4.9%) |
| 18 to 34 Years | 1 (0.1%) | 57 (2.9%) |
| 35 to 64 Years | 109 (3.1%) | 83 (2.2%) |
| 65 to 74 Years | 12 (1.5%) | 44 (5.2%) |
| 75 Years and over | 58 (15.6%) | 43 (5.3%) |
Technology Access in Ottawa
Computing Device Access in Ottawa
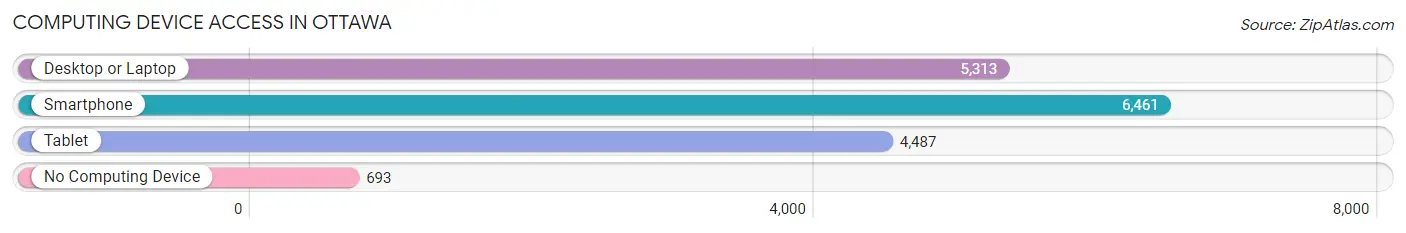
| Device Type | # Households | % Households |
| Desktop or Laptop | 5,313 | 69.6% |
| Smartphone | 6,461 | 84.6% |
| Tablet | 4,487 | 58.8% |
| No Computing Device | 693 | 9.1% |
| Total | 7,634 | 100.0% |
Internet Access in Ottawa
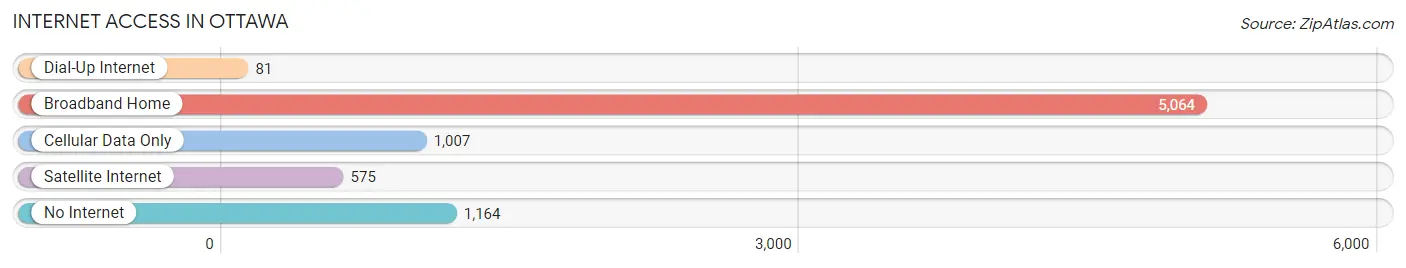
| Internet Type | # Households | % Households |
| Dial-Up Internet | 81 | 1.1% |
| Broadband Home | 5,064 | 66.3% |
| Cellular Data Only | 1,007 | 13.2% |
| Satellite Internet | 575 | 7.5% |
| No Internet | 1,164 | 15.2% |
| Total | 7,634 | 100.0% |
Ottawa Summary
Ottawa, Illinois is a city located in LaSalle County, Illinois, United States. The city is situated on the Fox River, approximately 80 miles southwest of Chicago. As of the 2010 census, the city had a population of 18,307.
History
The area that is now Ottawa was first settled in 1833 by William H. Davis, who built a log cabin near the Fox River. The area was originally known as Davis' Ferry, and was later renamed Hennepin. In 1837, the first post office was established in the area, and the name was changed to Ottawa. The name was chosen in honor of the Ottawa tribe of Native Americans who had previously inhabited the area.
In 1839, the first bridge was built across the Fox River, connecting Ottawa to the nearby town of Utica. This bridge was replaced in 1869 by a steel bridge, which was in turn replaced by a concrete bridge in 1916.
In 1853, the Illinois and Michigan Canal was completed, connecting the Great Lakes to the Mississippi River. This canal ran through Ottawa, and the city became an important transportation hub. The canal was used to transport goods and passengers until 1933, when it was replaced by the Illinois Waterway.
In 1871, the first railroad line was built in Ottawa, connecting the city to Chicago. This line was later extended to St. Louis, and Ottawa became an important railroad hub.
In 1873, the first public school was established in Ottawa. The city's first library was established in 1877, and the first hospital was established in 1883.
Geography
Ottawa is located at 41°19'N 88°51'W (41.3167, -88.85). According to the United States Census Bureau, the city has a total area of 8.3 square miles (21.5 km2), of which 8.2 square miles (21.3 km2) is land and 0.1 square miles (0.2 km2) is water.
The city is situated on the Fox River, and is surrounded by rolling hills and farmland. The city is located approximately 80 miles southwest of Chicago.
Economy
The economy of Ottawa is largely based on manufacturing and agriculture. The city is home to several large manufacturing companies, including Caterpillar, Inc., which has a large plant in the city. Other major employers in the city include the Ottawa School District, the LaSalle County government, and the Illinois Valley Community Hospital.
Agriculture is also an important part of the local economy. The area is known for its production of corn, soybeans, and wheat.
Demographics
As of the 2010 census, there were 18,307 people, 7,093 households, and 4,717 families residing in the city. The population density was 2,225.2 people per square mile (861.2/km2). There were 7,717 housing units at an average density of 941.2 per square mile (363.7/km2). The racial makeup of the city was 92.2% White, 2.2% African American, 0.3% Native American, 0.9% Asian, 0.1% Pacific Islander, 2.7% from other races, and 1.6% from two or more races. Hispanic or Latino of any race were 8.2% of the population.
There were 7,093 households, out of which 30.2% had children under the age of 18 living with them, 48.2% were married couples living together, 12.2% had a female householder with no husband present, and 35.2% were non-families. 30.2% of all households were made up of individuals, and 13.2% had someone living alone who was 65 years of age or older. The average household size was 2.45 and the average family size was 3.04.
In the city, the population was spread out, with 24.7% under the age of 18, 8.3% from 18 to 24, 28.2% from 25 to 44, 22.2% from 45 to 64, and 16.6% who were 65 years of age or older. The median age was 38 years. For every 100 females, there were 93.2 males. For every 100 females age 18 and over, there were 89.3 males.
The median income for a household in the city was $45,945, and the median income for a family was $54,945. Males had a median income of $41,945 versus $30,945 for females. The per capita income for the city was $21,945. About 6.2% of families and 8.2% of the population were below the poverty line, including 11.2% of those under age 18 and 6.2% of those age 65 or over.
Common Questions
What is Per Capita Income in Ottawa?
Per Capita income in Ottawa is $33,444.
What is the Median Family Income in Ottawa?
Median Family Income in Ottawa is $79,792.
What is the Median Household income in Ottawa?
Median Household Income in Ottawa is $67,940.
What is Income or Wage Gap in Ottawa?
Income or Wage Gap in Ottawa is 33.1%.
Women in Ottawa earn 66.9 cents for every dollar earned by a man.
What is Family Income Deficit in Ottawa?
Family Income Deficit in Ottawa is $11,270.
Families that are below poverty line in Ottawa earn $11,270 less on average than the poverty threshold level.
What is Inequality or Gini Index in Ottawa?
Inequality or Gini Index in Ottawa is 0.44.
What is the Total Population of Ottawa?
Total Population of Ottawa is 18,708.
What is the Total Male Population of Ottawa?
Total Male Population of Ottawa is 8,889.
What is the Total Female Population of Ottawa?
Total Female Population of Ottawa is 9,819.
What is the Ratio of Males per 100 Females in Ottawa?
There are 90.53 Males per 100 Females in Ottawa.
What is the Ratio of Females per 100 Males in Ottawa?
There are 110.46 Females per 100 Males in Ottawa.
What is the Median Population Age in Ottawa?
Median Population Age in Ottawa is 39.6 Years.
What is the Average Family Size in Ottawa
Average Family Size in Ottawa is 3.0 People.
What is the Average Household Size in Ottawa
Average Household Size in Ottawa is 2.4 People.
How Large is the Labor Force in Ottawa?
There are 9,606 People in the Labor Forcein in Ottawa.
What is the Percentage of People in the Labor Force in Ottawa?
64.4% of People are in the Labor Force in Ottawa.
What is the Unemployment Rate in Ottawa?
Unemployment Rate in Ottawa is 6.8%.