Lanark, IL Map & Demographics
Lanark Map
Lanark Overview
$32,643
PER CAPITA INCOME
$93,194
AVG FAMILY INCOME
$67,031
AVG HOUSEHOLD INCOME
39.5%
WAGE / INCOME GAP [ % ]
60.5¢/ $1
WAGE / INCOME GAP [ $ ]
0.39
INEQUALITY / GINI INDEX
1,553
TOTAL POPULATION
819
MALE POPULATION
734
FEMALE POPULATION
111.58
MALES / 100 FEMALES
89.62
FEMALES / 100 MALES
38.7
MEDIAN AGE
2.8
AVG FAMILY SIZE
2.4
AVG HOUSEHOLD SIZE
832
LABOR FORCE [ PEOPLE ]
69.3%
PERCENT IN LABOR FORCE
4.0%
UNEMPLOYMENT RATE
Lanark Zip Codes
Lanark Area Codes
Income in Lanark
Income Overview in Lanark
Per Capita Income in Lanark is $32,643, while median incomes of families and households are $93,194 and $67,031 respectively.
| Characteristic | Number | Measure |
| Per Capita Income | 1,553 | $32,643 |
| Median Family Income | 451 | $93,194 |
| Mean Family Income | 451 | $93,069 |
| Median Household Income | 652 | $67,031 |
| Mean Household Income | 652 | $77,726 |
| Income Deficit | 451 | $0 |
| Wage / Income Gap (%) | 1,553 | 39.49% |
| Wage / Income Gap ($) | 1,553 | 60.51¢ per $1 |
| Gini / Inequality Index | 1,553 | 0.39 |
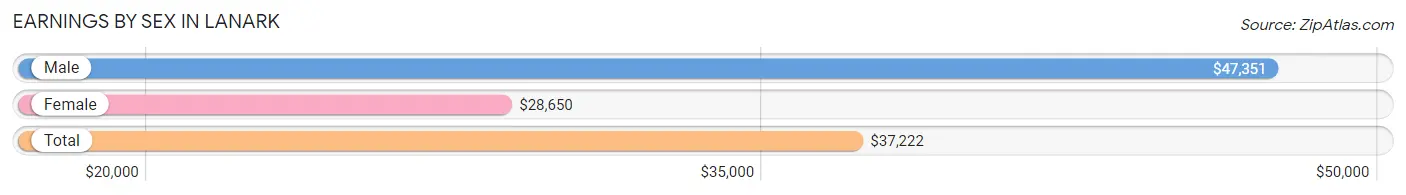
Earnings by Sex in Lanark
Average Earnings in Lanark are $37,222, $47,351 for men and $28,650 for women, a difference of 39.5%.
| Sex | Number | Average Earnings |
| Male | 497 (57.0%) | $47,351 |
| Female | 375 (43.0%) | $28,650 |
| Total | 872 (100.0%) | $37,222 |
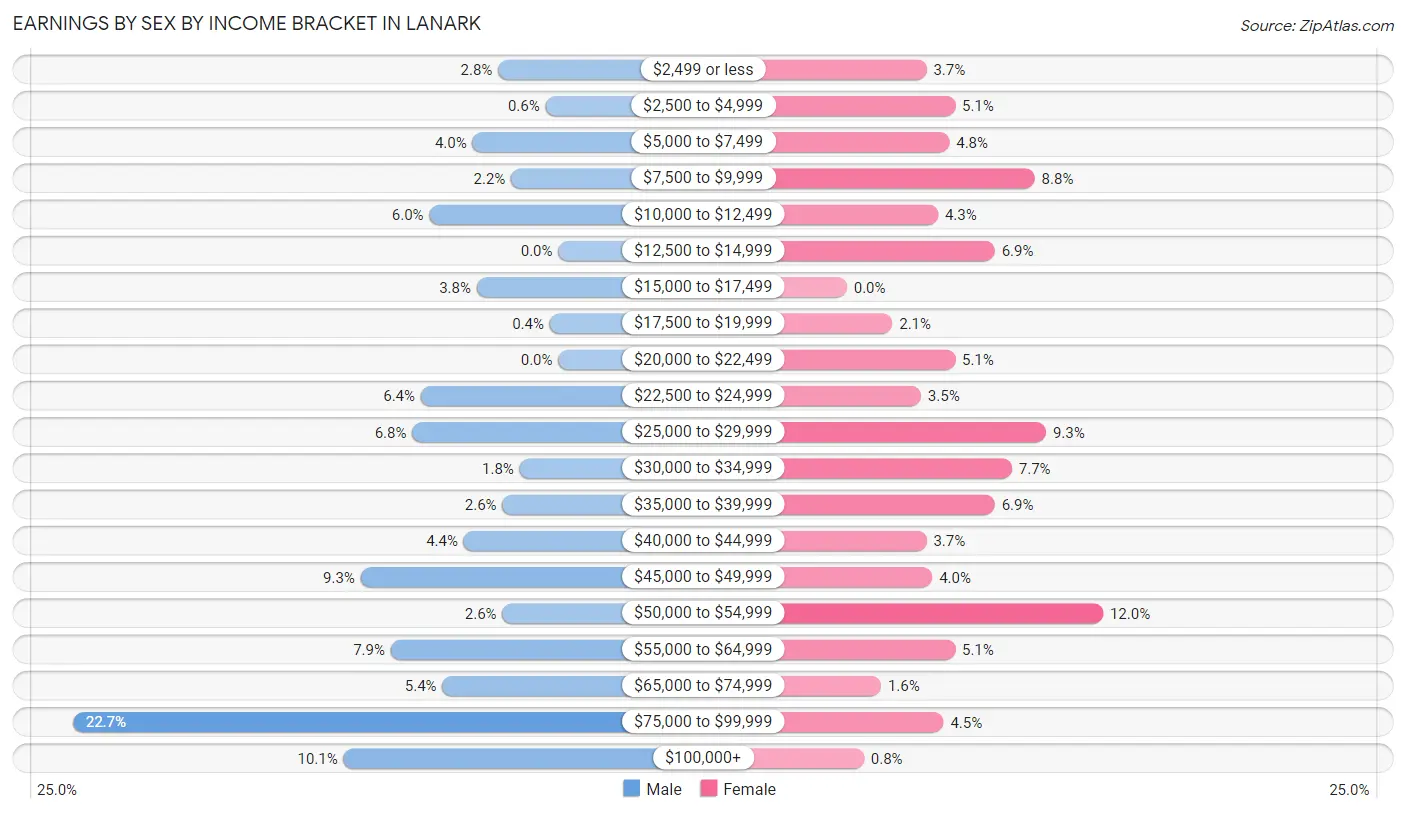
Earnings by Sex by Income Bracket in Lanark
The most common earnings brackets in Lanark are $75,000 to $99,999 for men (113 | 22.7%) and $50,000 to $54,999 for women (45 | 12.0%).
| Income | Male | Female |
| $2,499 or less | 14 (2.8%) | 14 (3.7%) |
| $2,500 to $4,999 | 3 (0.6%) | 19 (5.1%) |
| $5,000 to $7,499 | 20 (4.0%) | 18 (4.8%) |
| $7,500 to $9,999 | 11 (2.2%) | 33 (8.8%) |
| $10,000 to $12,499 | 30 (6.0%) | 16 (4.3%) |
| $12,500 to $14,999 | 0 (0.0%) | 26 (6.9%) |
| $15,000 to $17,499 | 19 (3.8%) | 0 (0.0%) |
| $17,500 to $19,999 | 2 (0.4%) | 8 (2.1%) |
| $20,000 to $22,499 | 0 (0.0%) | 19 (5.1%) |
| $22,500 to $24,999 | 32 (6.4%) | 13 (3.5%) |
| $25,000 to $29,999 | 34 (6.8%) | 35 (9.3%) |
| $30,000 to $34,999 | 9 (1.8%) | 29 (7.7%) |
| $35,000 to $39,999 | 13 (2.6%) | 26 (6.9%) |
| $40,000 to $44,999 | 22 (4.4%) | 14 (3.7%) |
| $45,000 to $49,999 | 46 (9.3%) | 15 (4.0%) |
| $50,000 to $54,999 | 13 (2.6%) | 45 (12.0%) |
| $55,000 to $64,999 | 39 (7.9%) | 19 (5.1%) |
| $65,000 to $74,999 | 27 (5.4%) | 6 (1.6%) |
| $75,000 to $99,999 | 113 (22.7%) | 17 (4.5%) |
| $100,000+ | 50 (10.1%) | 3 (0.8%) |
| Total | 497 (100.0%) | 375 (100.0%) |
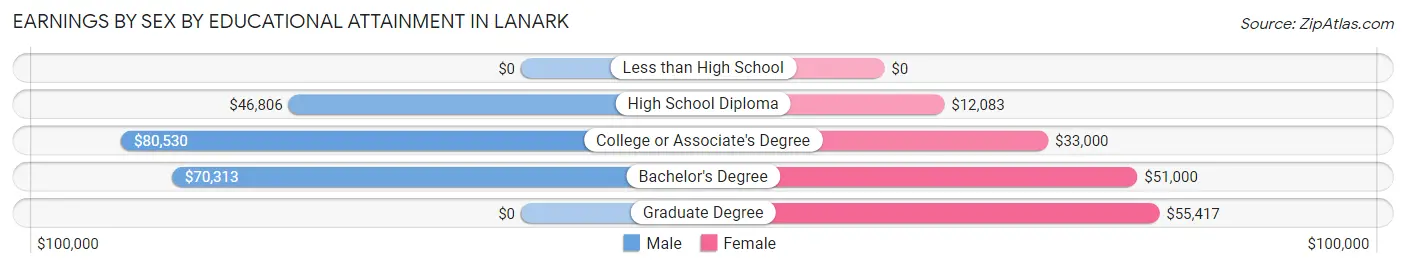
Earnings by Sex by Educational Attainment in Lanark
Average earnings in Lanark are $60,625 for men and $30,417 for women, a difference of 49.8%. Men with an educational attainment of college or associate's degree enjoy the highest average annual earnings of $80,530, while those with high school diploma education earn the least with $46,806. Women with an educational attainment of graduate degree earn the most with the average annual earnings of $55,417, while those with high school diploma education have the smallest earnings of $12,083.
| Educational Attainment | Male Income | Female Income |
| Less than High School | - | - |
| High School Diploma | $46,806 | $12,083 |
| College or Associate's Degree | $80,530 | $33,000 |
| Bachelor's Degree | $70,313 | $51,000 |
| Graduate Degree | - | - |
| Total | $60,625 | $30,417 |
Family Income in Lanark
Family Income Brackets in Lanark
According to the Lanark family income data, there are 153 families falling into the $100,000 to $149,999 income range, which is the most common income bracket and makes up 33.9% of all families. Conversely, the $25,000 to $34,999 income bracket is the least frequent group with only 13 families (2.9%) belonging to this category.
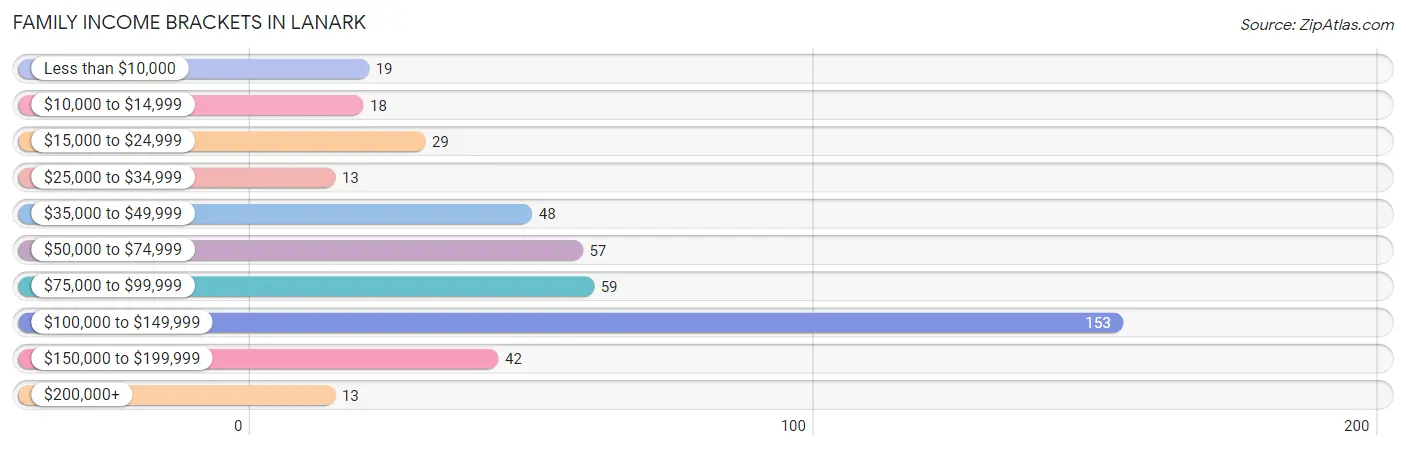
| Income Bracket | # Families | % Families |
| Less than $10,000 | 19 | 4.2% |
| $10,000 to $14,999 | 18 | 4.0% |
| $15,000 to $24,999 | 29 | 6.4% |
| $25,000 to $34,999 | 13 | 2.9% |
| $35,000 to $49,999 | 48 | 10.6% |
| $50,000 to $74,999 | 57 | 12.6% |
| $75,000 to $99,999 | 59 | 13.1% |
| $100,000 to $149,999 | 153 | 33.9% |
| $150,000 to $199,999 | 42 | 9.3% |
| $200,000+ | 13 | 2.9% |
Family Income by Famaliy Size in Lanark
3-person families (153 | 33.9%) account for the highest median family income in Lanark with $132,785 per family, while 3-person families (153 | 33.9%) have the highest median income of $44,262 per family member.
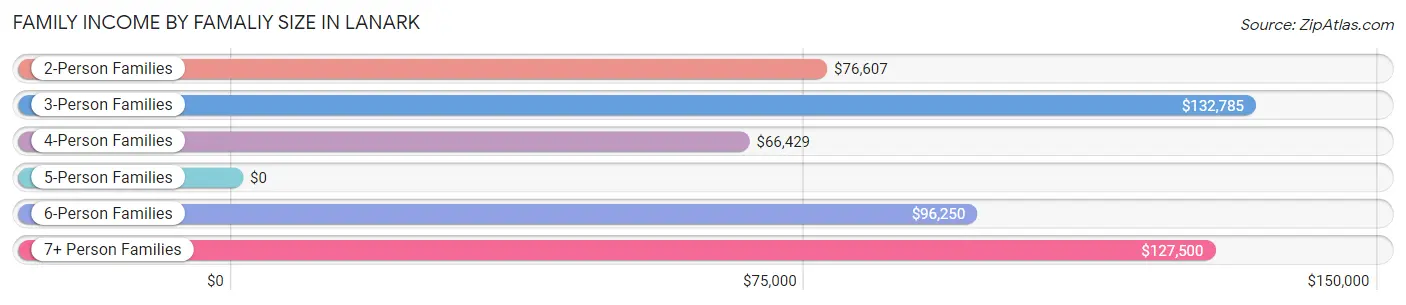
| Income Bracket | # Families | Median Income |
| 2-Person Families | 217 (48.1%) | $76,607 |
| 3-Person Families | 153 (33.9%) | $132,785 |
| 4-Person Families | 46 (10.2%) | $66,429 |
| 5-Person Families | 13 (2.9%) | $0 |
| 6-Person Families | 16 (3.5%) | $96,250 |
| 7+ Person Families | 6 (1.3%) | $127,500 |
| Total | 451 (100.0%) | $93,194 |
Family Income by Number of Earners in Lanark
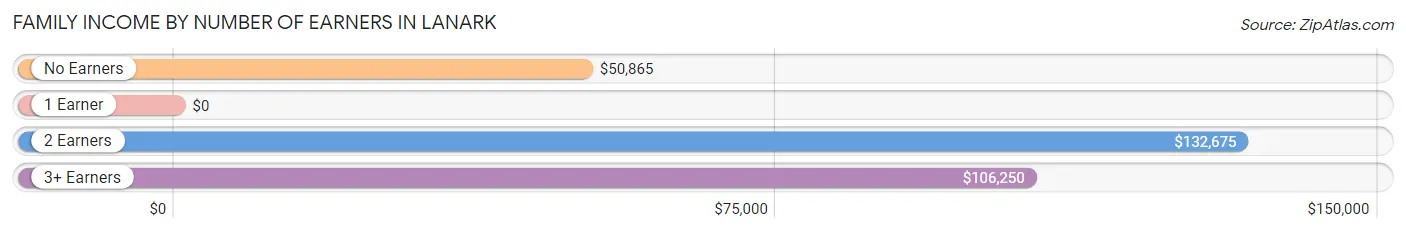
| Number of Earners | # Families | Median Income |
| No Earners | 63 (14.0%) | $50,865 |
| 1 Earner | 156 (34.6%) | $0 |
| 2 Earners | 188 (41.7%) | $132,675 |
| 3+ Earners | 44 (9.8%) | $106,250 |
| Total | 451 (100.0%) | $93,194 |
Household Income in Lanark
Household Income Brackets in Lanark
With 156 households falling in the category, the $100,000 to $149,999 income range is the most frequent in Lanark, accounting for 23.9% of all households. In contrast, only 13 households (2.0%) fall into the $200,000+ income bracket, making it the least populous group.
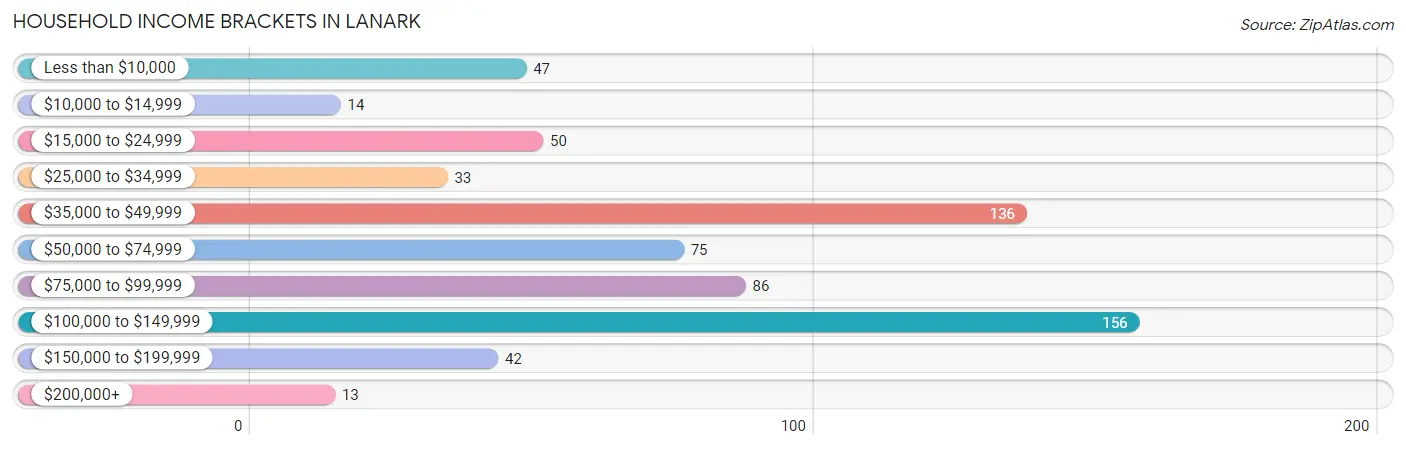
| Income Bracket | # Households | % Households |
| Less than $10,000 | 47 | 7.2% |
| $10,000 to $14,999 | 14 | 2.1% |
| $15,000 to $24,999 | 50 | 7.7% |
| $25,000 to $34,999 | 33 | 5.1% |
| $35,000 to $49,999 | 136 | 20.9% |
| $50,000 to $74,999 | 75 | 11.5% |
| $75,000 to $99,999 | 86 | 13.2% |
| $100,000 to $149,999 | 156 | 23.9% |
| $150,000 to $199,999 | 42 | 6.4% |
| $200,000+ | 13 | 2.0% |
Household Income by Householder Age in Lanark
The median household income in Lanark is $67,031, with the highest median household income of $104,375 found in the 25 to 44 years age bracket for the primary householder. A total of 192 households (29.4%) fall into this category. Meanwhile, the 15 to 24 years age bracket for the primary householder has the lowest median household income of $38,500, with 74 households (11.4%) in this group.
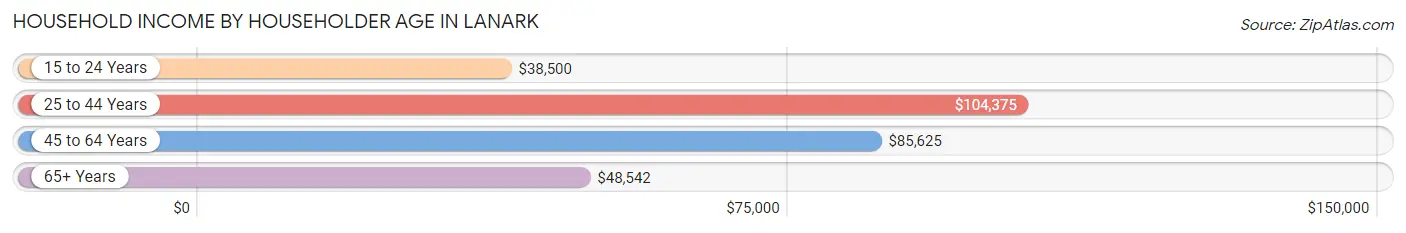
| Income Bracket | # Households | Median Income |
| 15 to 24 Years | 74 (11.4%) | $38,500 |
| 25 to 44 Years | 192 (29.4%) | $104,375 |
| 45 to 64 Years | 174 (26.7%) | $85,625 |
| 65+ Years | 212 (32.5%) | $48,542 |
| Total | 652 (100.0%) | $67,031 |
Poverty in Lanark
Income Below Poverty by Sex and Age in Lanark
With 10.9% poverty level for males and 19.5% for females among the residents of Lanark, 12 to 14 year old males and 12 to 14 year old females are the most vulnerable to poverty, with 10 males (27.8%) and 6 females (42.9%) in their respective age groups living below the poverty level.
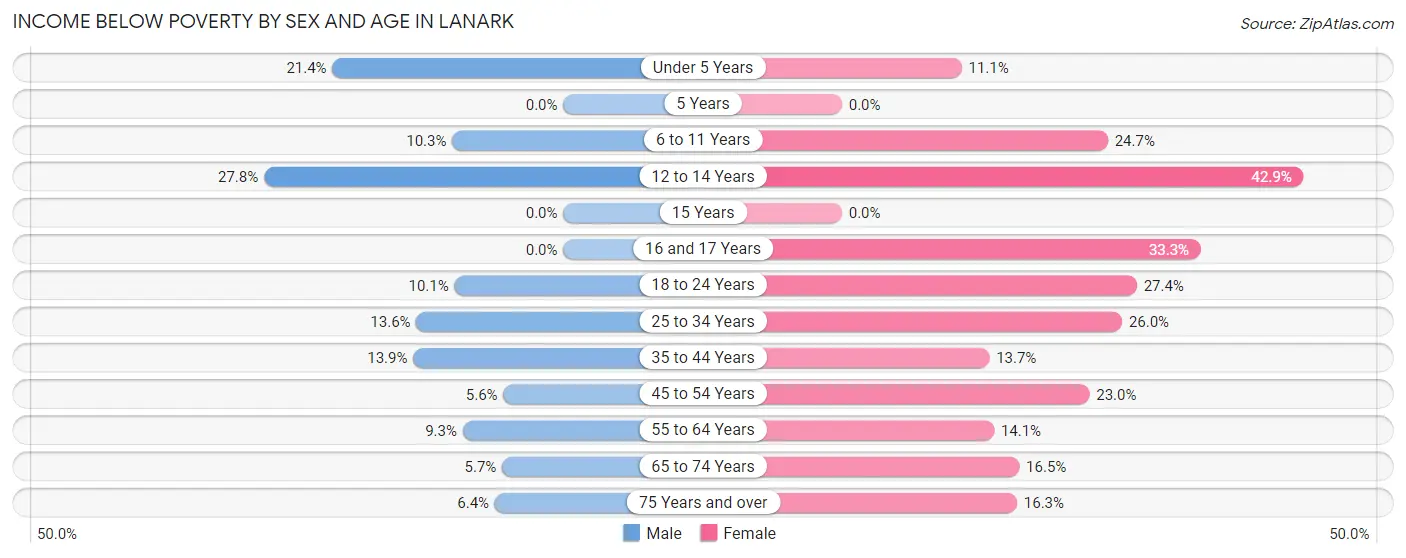
| Age Bracket | Male | Female |
| Under 5 Years | 12 (21.4%) | 5 (11.1%) |
| 5 Years | 0 (0.0%) | 0 (0.0%) |
| 6 to 11 Years | 10 (10.3%) | 19 (24.7%) |
| 12 to 14 Years | 10 (27.8%) | 6 (42.9%) |
| 15 Years | 0 (0.0%) | 0 (0.0%) |
| 16 and 17 Years | 0 (0.0%) | 3 (33.3%) |
| 18 to 24 Years | 10 (10.1%) | 26 (27.4%) |
| 25 to 34 Years | 9 (13.6%) | 13 (26.0%) |
| 35 to 44 Years | 17 (13.9%) | 16 (13.7%) |
| 45 to 54 Years | 5 (5.6%) | 17 (23.0%) |
| 55 to 64 Years | 7 (9.3%) | 12 (14.1%) |
| 65 to 74 Years | 5 (5.7%) | 13 (16.5%) |
| 75 Years and over | 4 (6.4%) | 13 (16.3%) |
| Total | 89 (10.9%) | 143 (19.5%) |
Income Above Poverty by Sex and Age in Lanark
According to the poverty statistics in Lanark, males aged 5 years and females aged 5 years are the age groups that are most secure financially, with 100.0% of males and 100.0% of females in these age groups living above the poverty line.
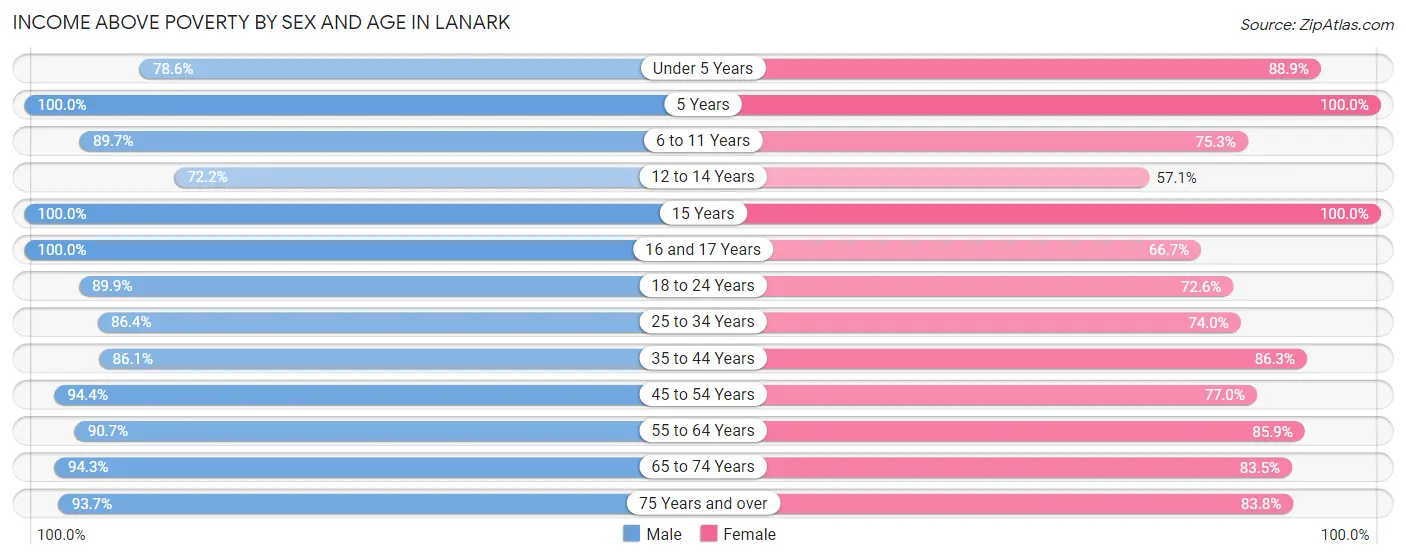
| Age Bracket | Male | Female |
| Under 5 Years | 44 (78.6%) | 40 (88.9%) |
| 5 Years | 14 (100.0%) | 6 (100.0%) |
| 6 to 11 Years | 87 (89.7%) | 58 (75.3%) |
| 12 to 14 Years | 26 (72.2%) | 8 (57.1%) |
| 15 Years | 1 (100.0%) | 3 (100.0%) |
| 16 and 17 Years | 8 (100.0%) | 6 (66.7%) |
| 18 to 24 Years | 89 (89.9%) | 69 (72.6%) |
| 25 to 34 Years | 57 (86.4%) | 37 (74.0%) |
| 35 to 44 Years | 105 (86.1%) | 101 (86.3%) |
| 45 to 54 Years | 85 (94.4%) | 57 (77.0%) |
| 55 to 64 Years | 68 (90.7%) | 73 (85.9%) |
| 65 to 74 Years | 83 (94.3%) | 66 (83.5%) |
| 75 Years and over | 59 (93.6%) | 67 (83.8%) |
| Total | 726 (89.1%) | 591 (80.5%) |
Income Below Poverty Among Married-Couple Families in Lanark
The poverty statistics for married-couple families in Lanark show that 2.7% or 9 of the total 328 families live below the poverty line. Families with 3 or 4 children have the highest poverty rate of 13.6%, comprising of 3 families. On the other hand, families with 1 or 2 children have the lowest poverty rate of 0.0%, which includes 0 families.
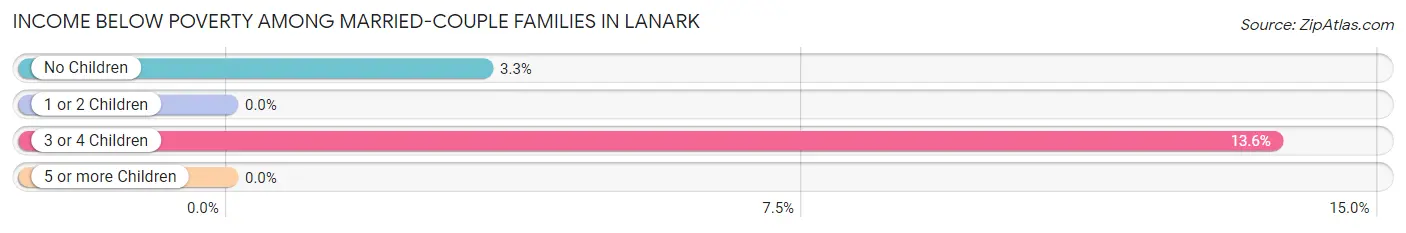
| Children | Above Poverty | Below Poverty |
| No Children | 174 (96.7%) | 6 (3.3%) |
| 1 or 2 Children | 125 (100.0%) | 0 (0.0%) |
| 3 or 4 Children | 19 (86.4%) | 3 (13.6%) |
| 5 or more Children | 1 (100.0%) | 0 (0.0%) |
| Total | 319 (97.3%) | 9 (2.7%) |
Income Below Poverty Among Single-Parent Households in Lanark
According to the poverty data in Lanark, 28.6% or 8 single-father households and 43.2% or 41 single-mother households are living below the poverty line. Among single-father households, those with 1 or 2 children have the highest poverty rate, with 8 households (50.0%) experiencing poverty. Likewise, among single-mother households, those with 3 or 4 children have the highest poverty rate, with 21 households (100.0%) falling below the poverty line.
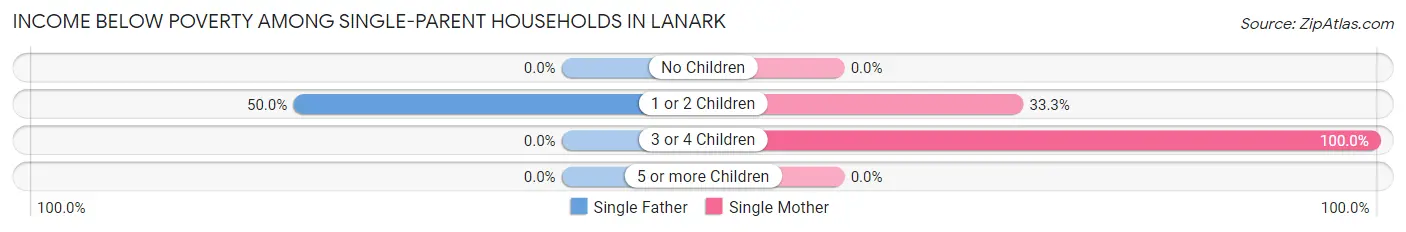
| Children | Single Father | Single Mother |
| No Children | 0 (0.0%) | 0 (0.0%) |
| 1 or 2 Children | 8 (50.0%) | 20 (33.3%) |
| 3 or 4 Children | 0 (0.0%) | 21 (100.0%) |
| 5 or more Children | 0 (0.0%) | 0 (0.0%) |
| Total | 8 (28.6%) | 41 (43.2%) |
Income Below Poverty Among Married-Couple vs Single-Parent Households in Lanark
The poverty data for Lanark shows that 9 of the married-couple family households (2.7%) and 49 of the single-parent households (39.8%) are living below the poverty level. Within the married-couple family households, those with 3 or 4 children have the highest poverty rate, with 3 households (13.6%) falling below the poverty line. Among the single-parent households, those with 3 or 4 children have the highest poverty rate, with 21 household (84.0%) living below poverty.
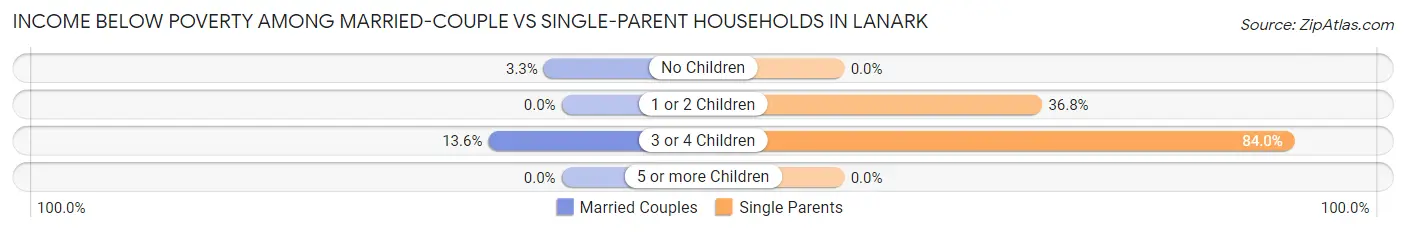
| Children | Married-Couple Families | Single-Parent Households |
| No Children | 6 (3.3%) | 0 (0.0%) |
| 1 or 2 Children | 0 (0.0%) | 28 (36.8%) |
| 3 or 4 Children | 3 (13.6%) | 21 (84.0%) |
| 5 or more Children | 0 (0.0%) | 0 (0.0%) |
| Total | 9 (2.7%) | 49 (39.8%) |
Race in Lanark
The most populous races in Lanark are White / Caucasian (1,467 | 94.5%), Hispanic or Latino (43 | 2.8%), and Two or more Races (41 | 2.6%).
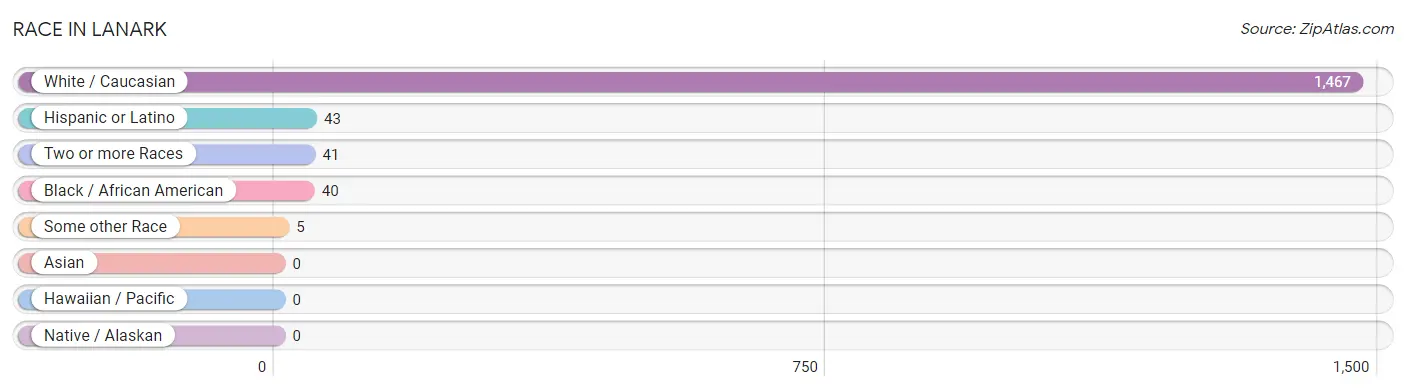
| Race | # Population | % Population |
| Asian | 0 | 0.0% |
| Black / African American | 40 | 2.6% |
| Hawaiian / Pacific | 0 | 0.0% |
| Hispanic or Latino | 43 | 2.8% |
| Native / Alaskan | 0 | 0.0% |
| White / Caucasian | 1,467 | 94.5% |
| Two or more Races | 41 | 2.6% |
| Some other Race | 5 | 0.3% |
| Total | 1,553 | 100.0% |
Ancestry in Lanark
The most populous ancestries reported in Lanark are German (561 | 36.1%), English (189 | 12.2%), American (130 | 8.4%), Irish (119 | 7.7%), and Italian (49 | 3.2%), together accounting for 67.5% of all Lanark residents.
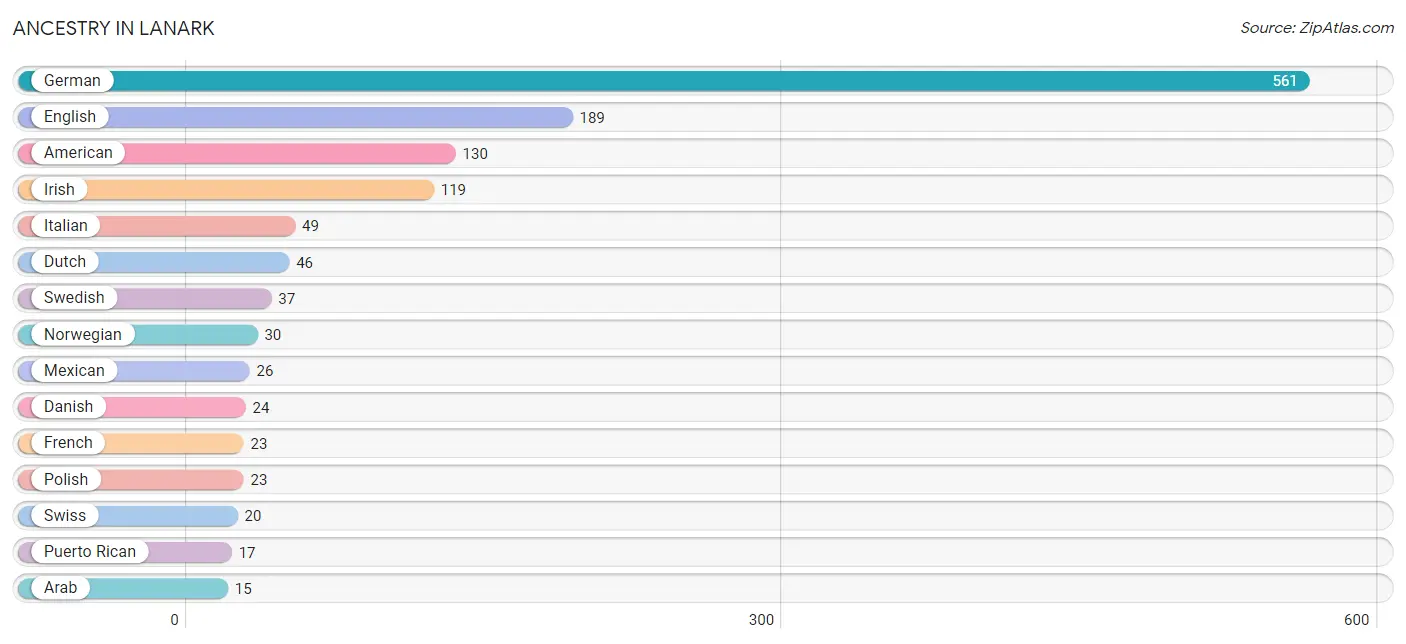
| Ancestry | # Population | % Population |
| American | 130 | 8.4% |
| Arab | 15 | 1.0% |
| Assyrian / Chaldean / Syriac | 4 | 0.3% |
| Austrian | 8 | 0.5% |
| Belgian | 6 | 0.4% |
| Canadian | 2 | 0.1% |
| Danish | 24 | 1.5% |
| Dutch | 46 | 3.0% |
| Eastern European | 2 | 0.1% |
| Egyptian | 15 | 1.0% |
| English | 189 | 12.2% |
| European | 6 | 0.4% |
| Finnish | 7 | 0.4% |
| French | 23 | 1.5% |
| German | 561 | 36.1% |
| German Russian | 10 | 0.6% |
| Greek | 3 | 0.2% |
| Hungarian | 3 | 0.2% |
| Irish | 119 | 7.7% |
| Italian | 49 | 3.2% |
| Mexican | 26 | 1.7% |
| Norwegian | 30 | 1.9% |
| Polish | 23 | 1.5% |
| Puerto Rican | 17 | 1.1% |
| Russian | 8 | 0.5% |
| Scotch-Irish | 6 | 0.4% |
| Scottish | 11 | 0.7% |
| Swedish | 37 | 2.4% |
| Swiss | 20 | 1.3% |
| Ukrainian | 4 | 0.3% |
| Welsh | 4 | 0.3% |
| West Indian | 10 | 0.6% | View All 32 Rows |
Immigrants in Lanark
The most numerous immigrant groups reported in Lanark came from Africa (5 | 0.3%), Egypt (5 | 0.3%), and Northern Africa (5 | 0.3%), together accounting for 1.0% of all Lanark residents.
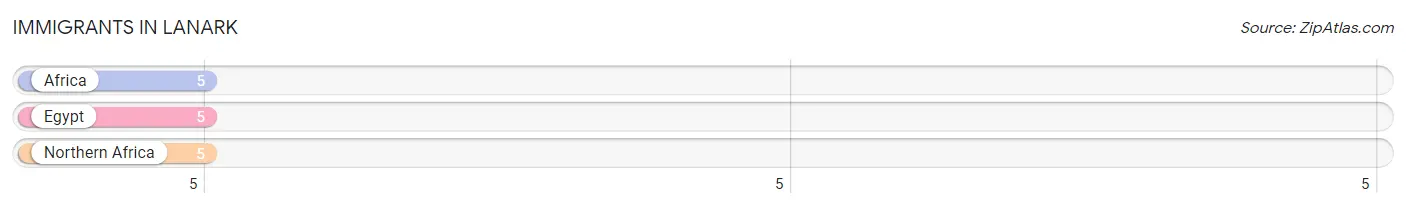
| Immigration Origin | # Population | % Population |
| Africa | 5 | 0.3% |
| Egypt | 5 | 0.3% |
| Northern Africa | 5 | 0.3% | View All 3 Rows |
Sex and Age in Lanark
Sex and Age in Lanark
The most populous age groups in Lanark are 5 to 9 Years (106 | 12.9%) for men and 20 to 24 Years (82 | 11.2%) for women.
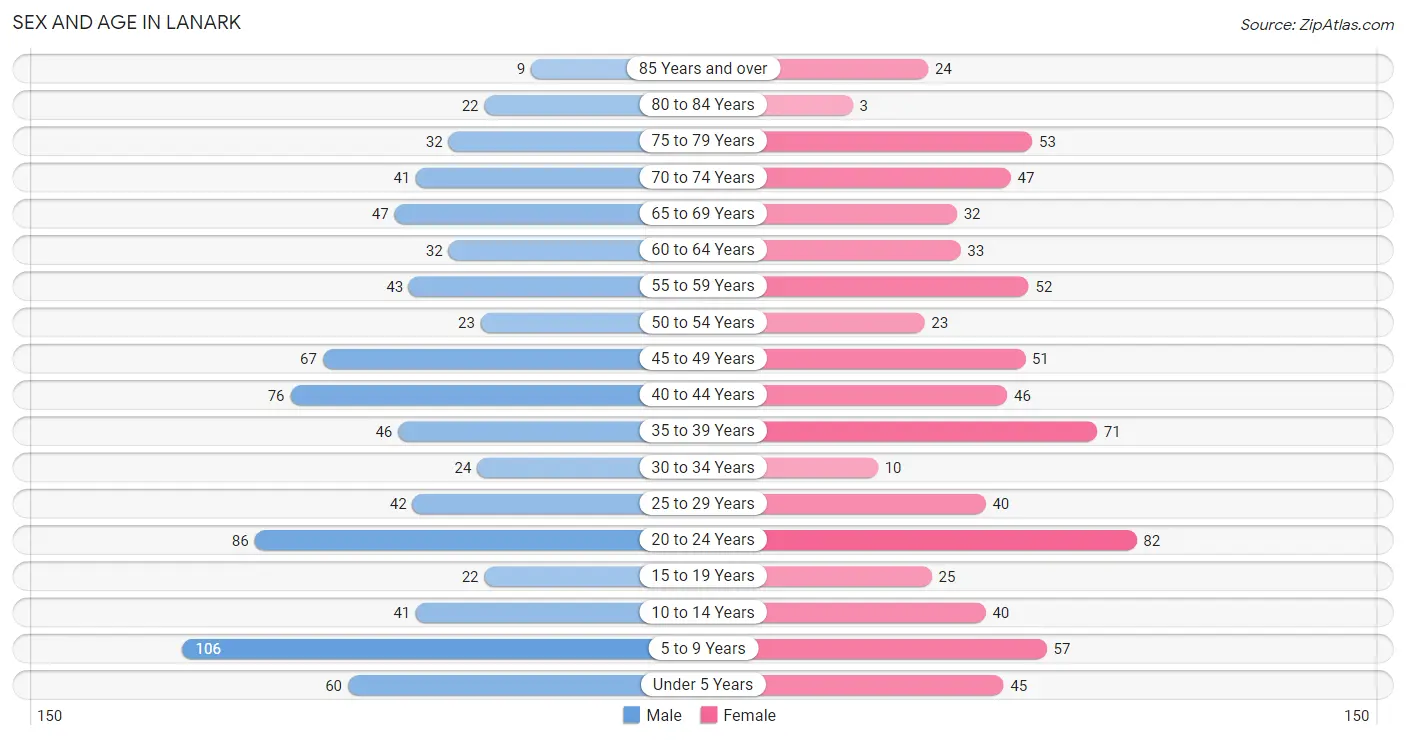
| Age Bracket | Male | Female |
| Under 5 Years | 60 (7.3%) | 45 (6.1%) |
| 5 to 9 Years | 106 (12.9%) | 57 (7.8%) |
| 10 to 14 Years | 41 (5.0%) | 40 (5.4%) |
| 15 to 19 Years | 22 (2.7%) | 25 (3.4%) |
| 20 to 24 Years | 86 (10.5%) | 82 (11.2%) |
| 25 to 29 Years | 42 (5.1%) | 40 (5.4%) |
| 30 to 34 Years | 24 (2.9%) | 10 (1.4%) |
| 35 to 39 Years | 46 (5.6%) | 71 (9.7%) |
| 40 to 44 Years | 76 (9.3%) | 46 (6.3%) |
| 45 to 49 Years | 67 (8.2%) | 51 (7.0%) |
| 50 to 54 Years | 23 (2.8%) | 23 (3.1%) |
| 55 to 59 Years | 43 (5.2%) | 52 (7.1%) |
| 60 to 64 Years | 32 (3.9%) | 33 (4.5%) |
| 65 to 69 Years | 47 (5.7%) | 32 (4.4%) |
| 70 to 74 Years | 41 (5.0%) | 47 (6.4%) |
| 75 to 79 Years | 32 (3.9%) | 53 (7.2%) |
| 80 to 84 Years | 22 (2.7%) | 3 (0.4%) |
| 85 Years and over | 9 (1.1%) | 24 (3.3%) |
| Total | 819 (100.0%) | 734 (100.0%) |
Families and Households in Lanark
Median Family Size in Lanark
The median family size in Lanark is 2.77 persons per family, with married-couple families (328 | 72.7%) accounting for the largest median family size of 2.94 persons per family. On the other hand, single male/father families (28 | 6.2%) represent the smallest median family size with 2.32 persons per family.
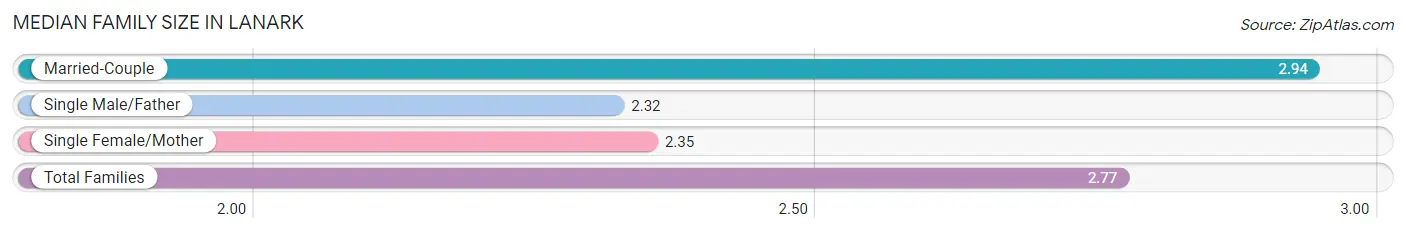
| Family Type | # Families | Family Size |
| Married-Couple | 328 (72.7%) | 2.94 |
| Single Male/Father | 28 (6.2%) | 2.32 |
| Single Female/Mother | 95 (21.1%) | 2.35 |
| Total Families | 451 (100.0%) | 2.77 |
Median Household Size in Lanark
The median household size in Lanark is 2.36 persons per household, with married-couple households (328 | 50.3%) accounting for the largest median household size of 2.94 persons per household. non-family households (201 | 30.8%) represent the smallest median household size with 1.18 persons per household.
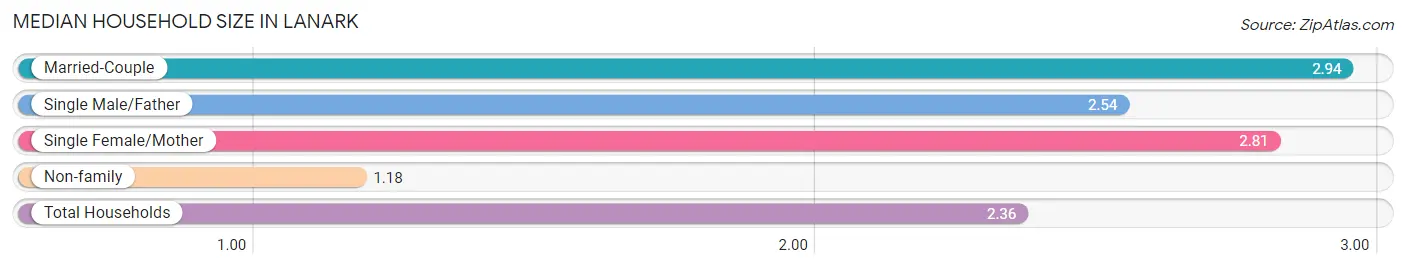
| Household Type | # Households | Household Size |
| Married-Couple | 328 (50.3%) | 2.94 |
| Single Male/Father | 28 (4.3%) | 2.54 |
| Single Female/Mother | 95 (14.6%) | 2.81 |
| Non-family | 201 (30.8%) | 1.18 |
| Total Households | 652 (100.0%) | 2.36 |
Household Size by Marriage Status in Lanark
Out of a total of 652 households in Lanark, 451 (69.2%) are family households, while 201 (30.8%) are nonfamily households. The most numerous type of family households are 2-person households, comprising 202, and the most common type of nonfamily households are 1-person households, comprising 170.
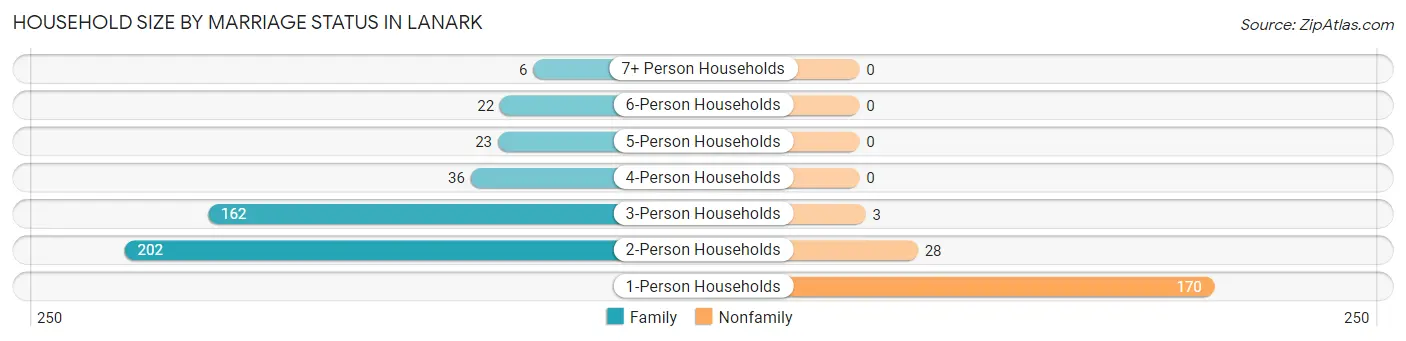
| Household Size | Family Households | Nonfamily Households |
| 1-Person Households | - | 170 (26.1%) |
| 2-Person Households | 202 (31.0%) | 28 (4.3%) |
| 3-Person Households | 162 (24.8%) | 3 (0.5%) |
| 4-Person Households | 36 (5.5%) | 0 (0.0%) |
| 5-Person Households | 23 (3.5%) | 0 (0.0%) |
| 6-Person Households | 22 (3.4%) | 0 (0.0%) |
| 7+ Person Households | 6 (0.9%) | 0 (0.0%) |
| Total | 451 (69.2%) | 201 (30.8%) |
Female Fertility in Lanark
Fertility by Age in Lanark
Average fertility rate in Lanark is 122.0 births per 1,000 women. Women in the age bracket of 20 to 34 years have the highest fertility rate with 280.0 births per 1,000 women. Women in the age bracket of 20 to 34 years acount for 92.5% of all women with births.
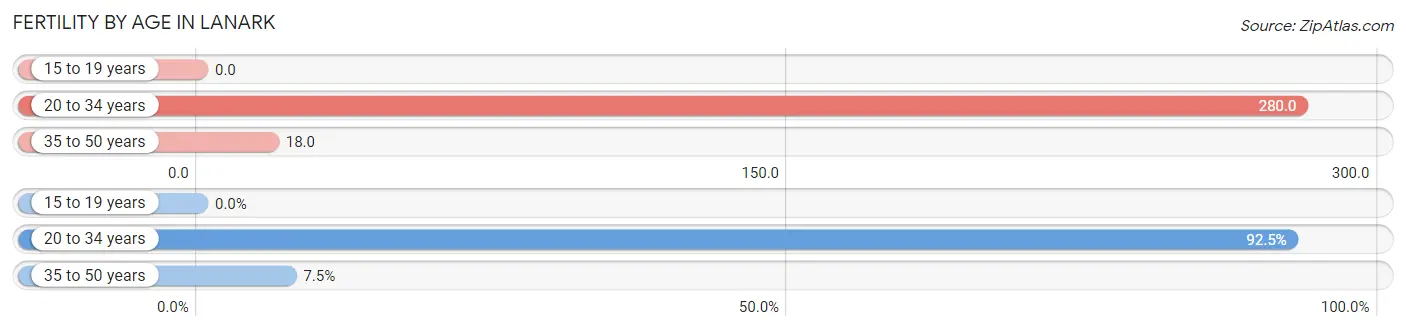
| Age Bracket | Women with Births | Births / 1,000 Women |
| 15 to 19 years | 0 (0.0%) | 0.0 |
| 20 to 34 years | 37 (92.5%) | 280.0 |
| 35 to 50 years | 3 (7.5%) | 18.0 |
| Total | 40 (100.0%) | 122.0 |
Fertility by Age by Marriage Status in Lanark
65.0% of women with births (40) in Lanark are married. The highest percentage of unmarried women with births falls into 35 to 50 years age bracket with 66.7% of them unmarried at the time of birth, while the lowest percentage of unmarried women with births belong to 20 to 34 years age bracket with 32.4% of them unmarried.
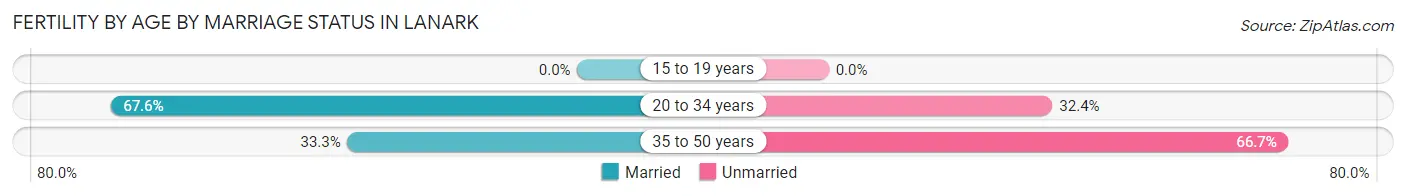
| Age Bracket | Married | Unmarried |
| 15 to 19 years | 0 (0.0%) | 0 (0.0%) |
| 20 to 34 years | 25 (67.6%) | 12 (32.4%) |
| 35 to 50 years | 1 (33.3%) | 2 (66.7%) |
| Total | 26 (65.0%) | 14 (35.0%) |
Fertility by Education in Lanark
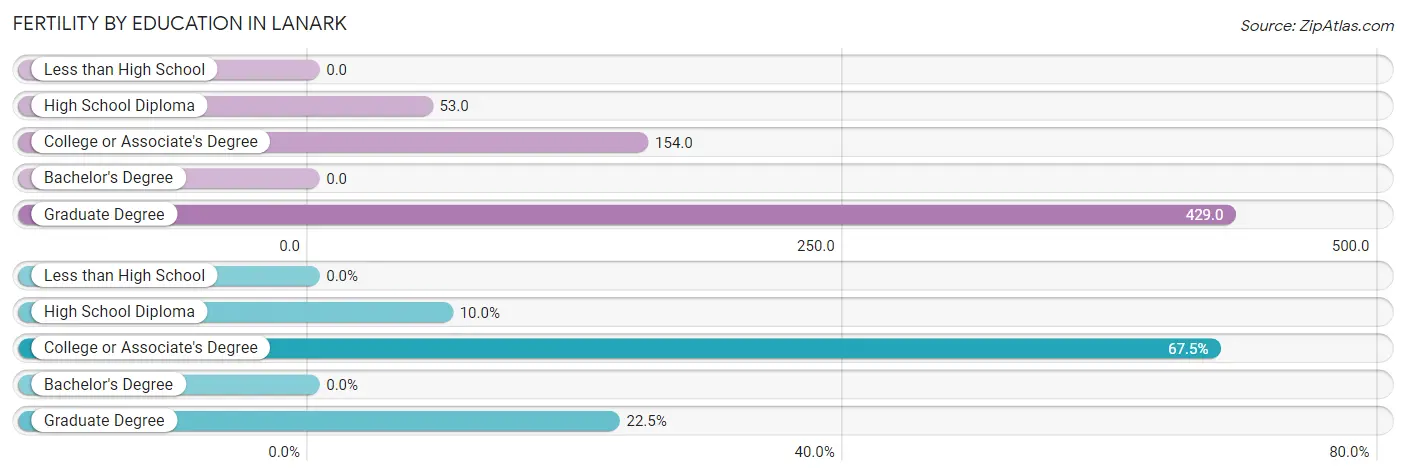
| Educational Attainment | Women with Births | Births / 1,000 Women |
| Less than High School | 0 (0.0%) | 0.0 |
| High School Diploma | 4 (10.0%) | 53.0 |
| College or Associate's Degree | 27 (67.5%) | 154.0 |
| Bachelor's Degree | 0 (0.0%) | 0.0 |
| Graduate Degree | 9 (22.5%) | 429.0 |
| Total | 40 (100.0%) | 122.0 |
Fertility by Education by Marriage Status in Lanark
35.0% of women with births in Lanark are unmarried. Women with the educational attainment of high school diploma are most likely to be married with 100.0% of them married at childbirth, while women with the educational attainment of college or associate's degree are least likely to be married with 51.8% of them unmarried at childbirth.
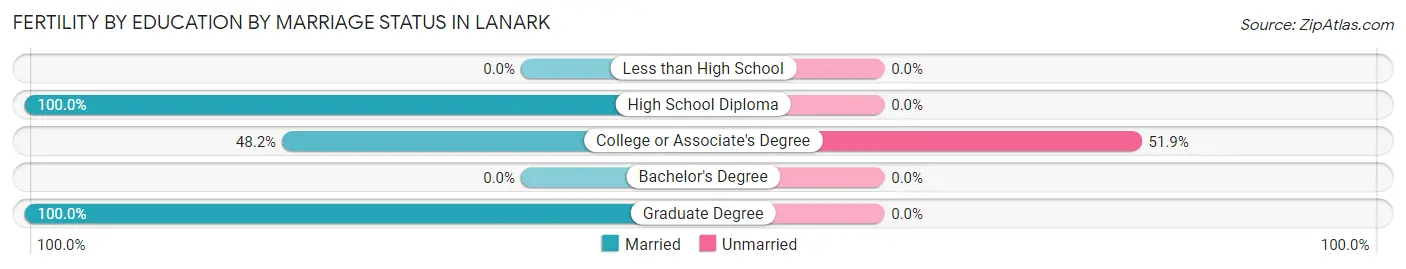
| Educational Attainment | Married | Unmarried |
| Less than High School | 0 (0.0%) | 0 (0.0%) |
| High School Diploma | 4 (100.0%) | 0 (0.0%) |
| College or Associate's Degree | 13 (48.1%) | 14 (51.8%) |
| Bachelor's Degree | 0 (0.0%) | 0 (0.0%) |
| Graduate Degree | 9 (100.0%) | 0 (0.0%) |
| Total | 26 (65.0%) | 14 (35.0%) |
Employment Characteristics in Lanark
Employment by Class of Employer in Lanark
Among the 776 employed individuals in Lanark, private company employees (488 | 62.9%), not-for-profit organizations (91 | 11.7%), and local government employees (77 | 9.9%) make up the most common classes of employment.
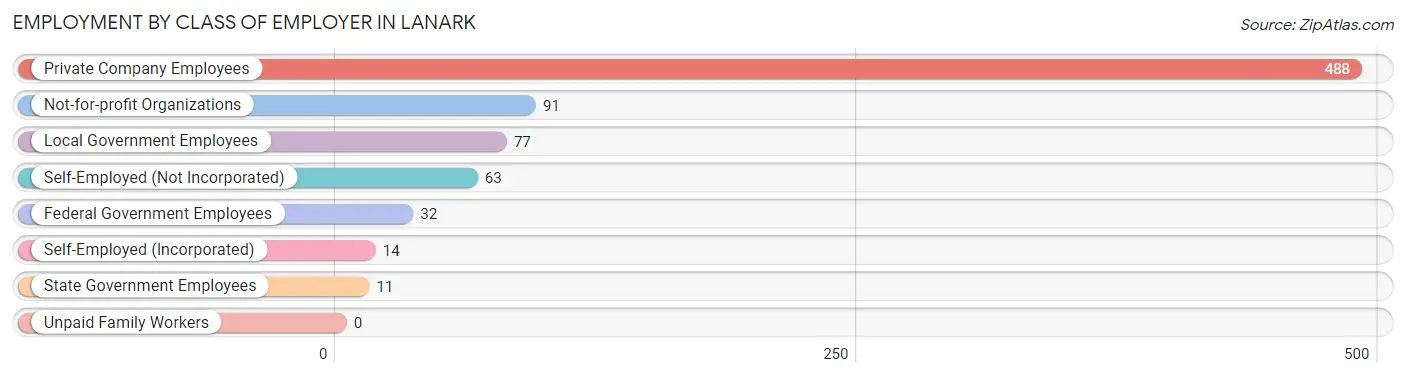
| Employer Class | # Employees | % Employees |
| Private Company Employees | 488 | 62.9% |
| Self-Employed (Incorporated) | 14 | 1.8% |
| Self-Employed (Not Incorporated) | 63 | 8.1% |
| Not-for-profit Organizations | 91 | 11.7% |
| Local Government Employees | 77 | 9.9% |
| State Government Employees | 11 | 1.4% |
| Federal Government Employees | 32 | 4.1% |
| Unpaid Family Workers | 0 | 0.0% |
| Total | 776 | 100.0% |
Employment Status by Age in Lanark
According to the labor force statistics for Lanark, out of the total population over 16 years of age (1,200), 69.3% or 832 individuals are in the labor force, with 4.0% or 33 of them unemployed. The age group with the highest labor force participation rate is 25 to 29 years, with 93.9% or 77 individuals in the labor force. Within the labor force, the 45 to 54 years age range has the highest percentage of unemployed individuals, with 9.5% or 14 of them being unemployed.
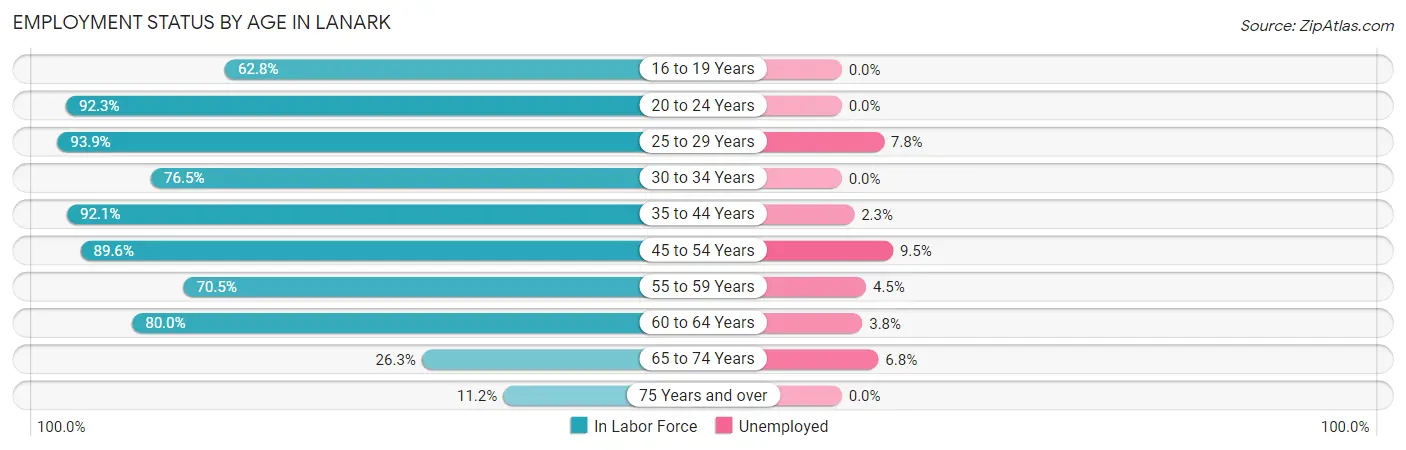
| Age Bracket | In Labor Force | Unemployed |
| 16 to 19 Years | 27 (62.8%) | 0 (0.0%) |
| 20 to 24 Years | 155 (92.3%) | 0 (0.0%) |
| 25 to 29 Years | 77 (93.9%) | 6 (7.8%) |
| 30 to 34 Years | 26 (76.5%) | 0 (0.0%) |
| 35 to 44 Years | 220 (92.1%) | 5 (2.3%) |
| 45 to 54 Years | 147 (89.6%) | 14 (9.5%) |
| 55 to 59 Years | 67 (70.5%) | 3 (4.5%) |
| 60 to 64 Years | 52 (80.0%) | 2 (3.8%) |
| 65 to 74 Years | 44 (26.3%) | 3 (6.8%) |
| 75 Years and over | 16 (11.2%) | 0 (0.0%) |
| Total | 832 (69.3%) | 33 (4.0%) |
Employment Status by Educational Attainment in Lanark
According to labor force statistics for Lanark, 86.7% of individuals (589) out of the total population between 25 and 64 years of age (679) are in the labor force, with 5.1% or 30 of them being unemployed. The group with the highest labor force participation rate are those with the educational attainment of bachelor's degree or higher, with 89.7% or 105 individuals in the labor force. Within the labor force, individuals with high school diploma education have the highest percentage of unemployment, with 10.6% or 22 of them being unemployed.
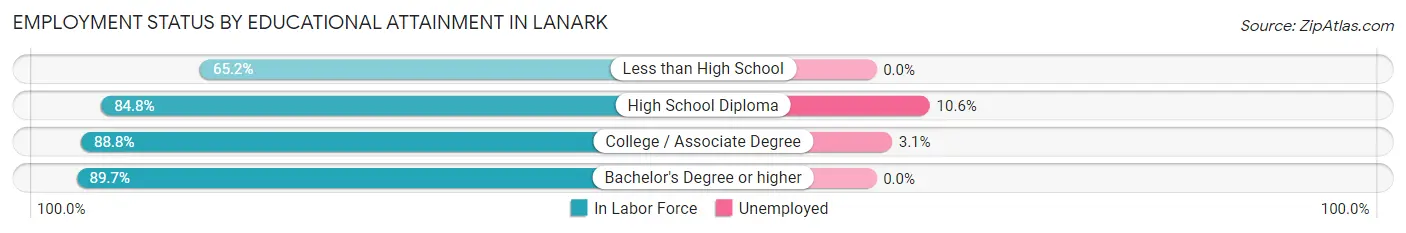
| Educational Attainment | In Labor Force | Unemployed |
| Less than High School | 15 (65.2%) | 0 (0.0%) |
| High School Diploma | 207 (84.8%) | 26 (10.6%) |
| College / Associate Degree | 262 (88.8%) | 9 (3.1%) |
| Bachelor's Degree or higher | 105 (89.7%) | 0 (0.0%) |
| Total | 589 (86.7%) | 35 (5.1%) |
Employment Occupations by Sex in Lanark
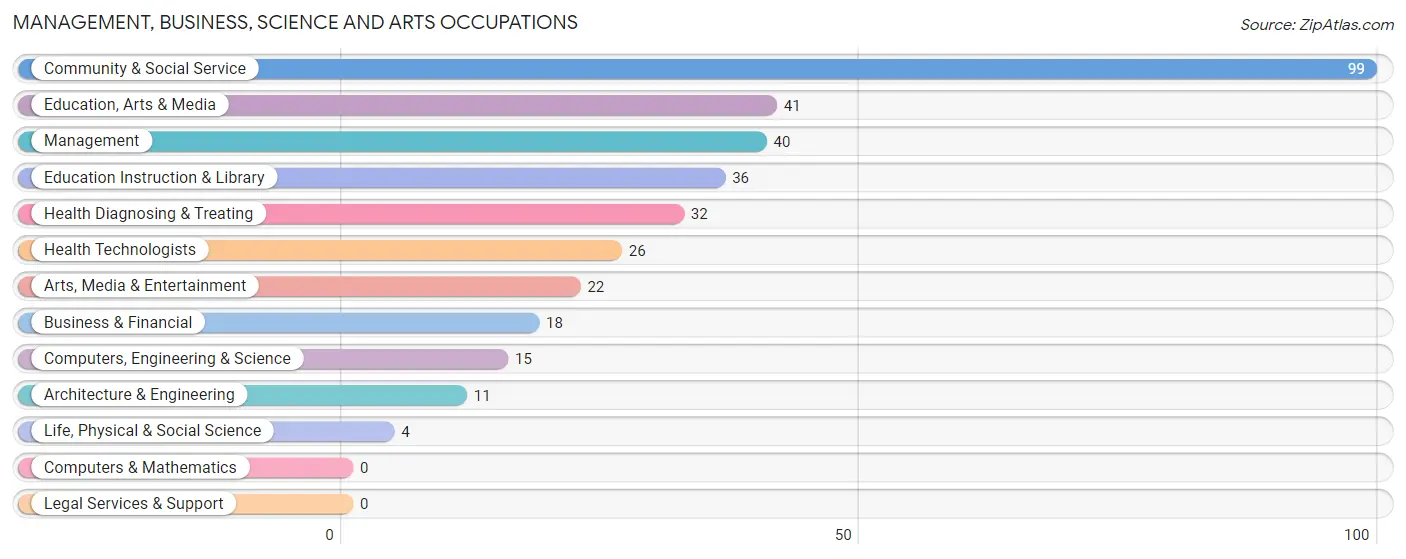
Management, Business, Science and Arts Occupations
The most common Management, Business, Science and Arts occupations in Lanark are Community & Social Service (99 | 12.6%), Education, Arts & Media (41 | 5.2%), Management (40 | 5.1%), Education Instruction & Library (36 | 4.6%), and Health Diagnosing & Treating (32 | 4.1%).
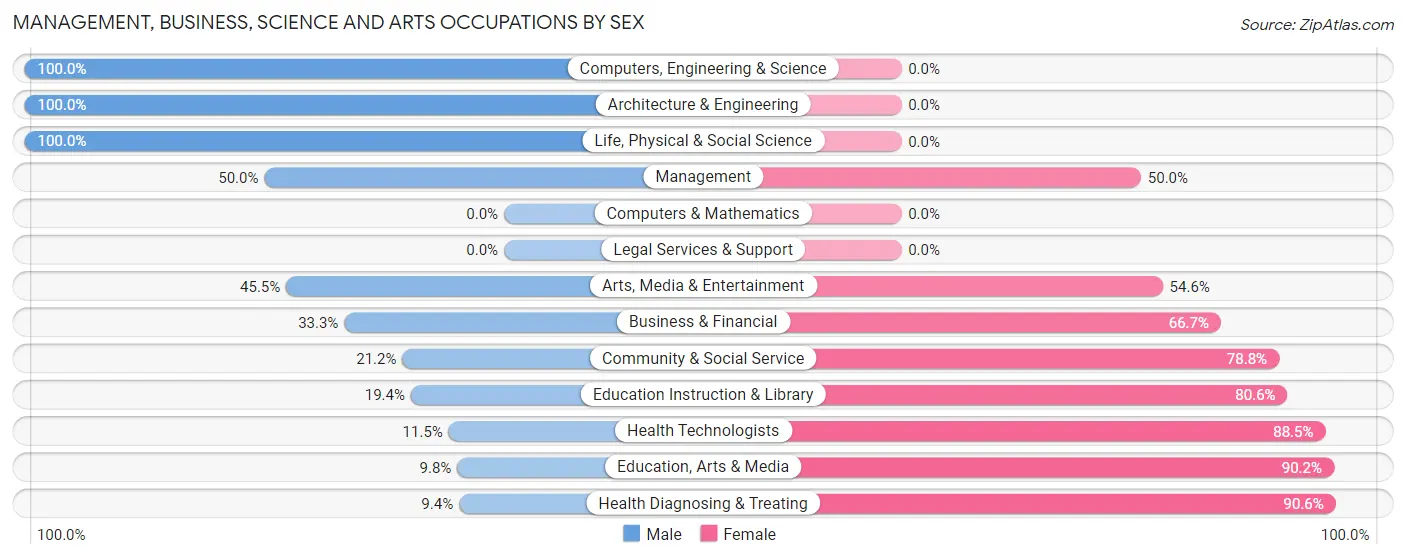
Management, Business, Science and Arts Occupations by Sex
Within the Management, Business, Science and Arts occupations in Lanark, the most male-oriented occupations are Computers, Engineering & Science (100.0%), Architecture & Engineering (100.0%), and Life, Physical & Social Science (100.0%), while the most female-oriented occupations are Health Diagnosing & Treating (90.6%), Education, Arts & Media (90.2%), and Health Technologists (88.5%).
| Occupation | Male | Female |
| Management | 20 (50.0%) | 20 (50.0%) |
| Business & Financial | 6 (33.3%) | 12 (66.7%) |
| Computers, Engineering & Science | 15 (100.0%) | 0 (0.0%) |
| Computers & Mathematics | 0 (0.0%) | 0 (0.0%) |
| Architecture & Engineering | 11 (100.0%) | 0 (0.0%) |
| Life, Physical & Social Science | 4 (100.0%) | 0 (0.0%) |
| Community & Social Service | 21 (21.2%) | 78 (78.8%) |
| Education, Arts & Media | 4 (9.8%) | 37 (90.2%) |
| Legal Services & Support | 0 (0.0%) | 0 (0.0%) |
| Education Instruction & Library | 7 (19.4%) | 29 (80.6%) |
| Arts, Media & Entertainment | 10 (45.5%) | 12 (54.5%) |
| Health Diagnosing & Treating | 3 (9.4%) | 29 (90.6%) |
| Health Technologists | 3 (11.5%) | 23 (88.5%) |
| Total (Category) | 65 (31.9%) | 139 (68.1%) |
| Total (Overall) | 443 (56.6%) | 340 (43.4%) |
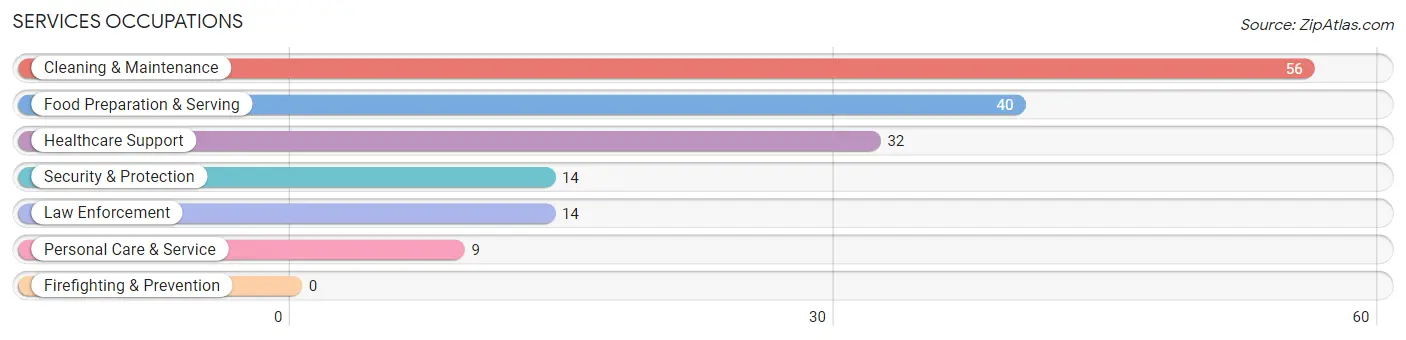
Services Occupations
The most common Services occupations in Lanark are Cleaning & Maintenance (56 | 7.1%), Food Preparation & Serving (40 | 5.1%), Healthcare Support (32 | 4.1%), Security & Protection (14 | 1.8%), and Law Enforcement (14 | 1.8%).
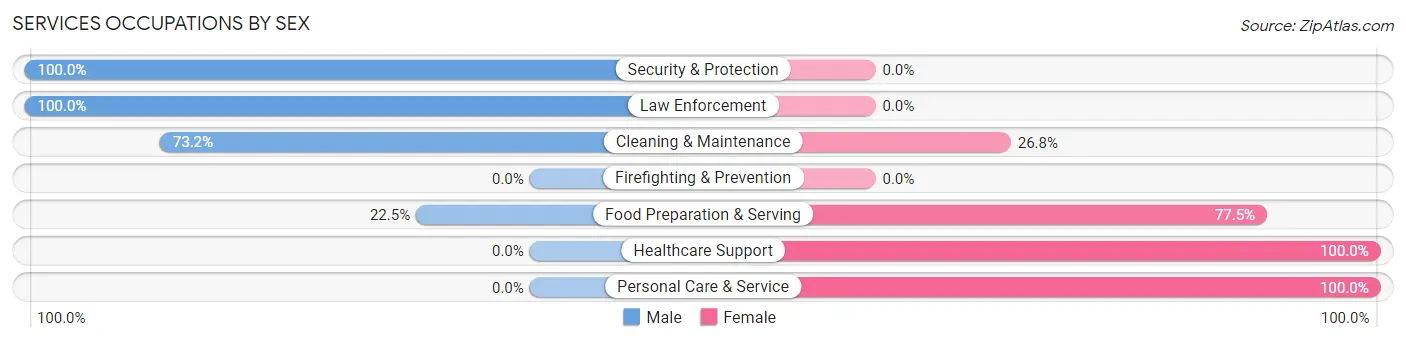
Services Occupations by Sex
Within the Services occupations in Lanark, the most male-oriented occupations are Security & Protection (100.0%), Law Enforcement (100.0%), and Cleaning & Maintenance (73.2%), while the most female-oriented occupations are Healthcare Support (100.0%), Personal Care & Service (100.0%), and Food Preparation & Serving (77.5%).
| Occupation | Male | Female |
| Healthcare Support | 0 (0.0%) | 32 (100.0%) |
| Security & Protection | 14 (100.0%) | 0 (0.0%) |
| Firefighting & Prevention | 0 (0.0%) | 0 (0.0%) |
| Law Enforcement | 14 (100.0%) | 0 (0.0%) |
| Food Preparation & Serving | 9 (22.5%) | 31 (77.5%) |
| Cleaning & Maintenance | 41 (73.2%) | 15 (26.8%) |
| Personal Care & Service | 0 (0.0%) | 9 (100.0%) |
| Total (Category) | 64 (42.4%) | 87 (57.6%) |
| Total (Overall) | 443 (56.6%) | 340 (43.4%) |
Sales and Office Occupations
The most common Sales and Office occupations in Lanark are Office & Administration (63 | 8.1%), and Sales & Related (46 | 5.9%).

Sales and Office Occupations by Sex

| Occupation | Male | Female |
| Sales & Related | 40 (87.0%) | 6 (13.0%) |
| Office & Administration | 2 (3.2%) | 61 (96.8%) |
| Total (Category) | 42 (38.5%) | 67 (61.5%) |
| Total (Overall) | 443 (56.6%) | 340 (43.4%) |
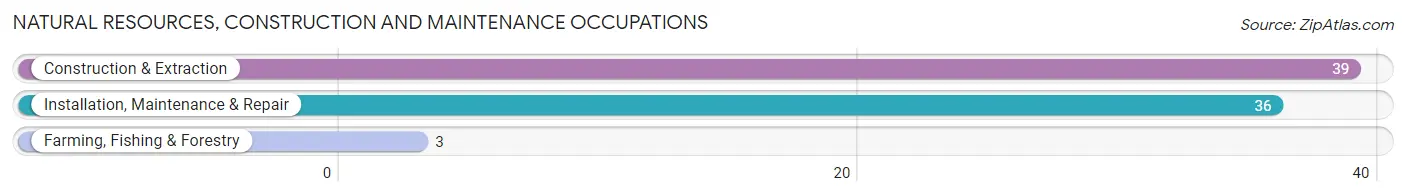
Natural Resources, Construction and Maintenance Occupations
The most common Natural Resources, Construction and Maintenance occupations in Lanark are Construction & Extraction (39 | 5.0%), Installation, Maintenance & Repair (36 | 4.6%), and Farming, Fishing & Forestry (3 | 0.4%).
Natural Resources, Construction and Maintenance Occupations by Sex
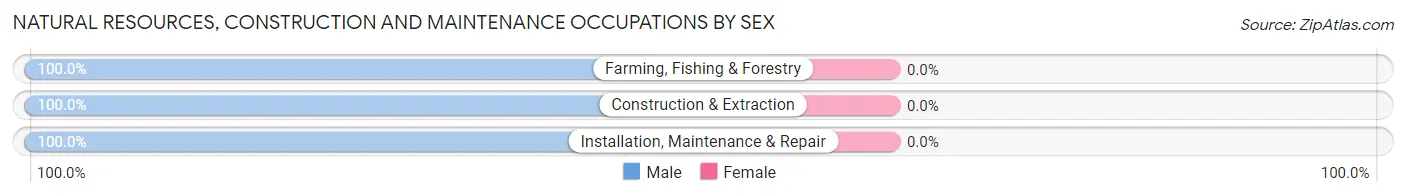
| Occupation | Male | Female |
| Farming, Fishing & Forestry | 3 (100.0%) | 0 (0.0%) |
| Construction & Extraction | 39 (100.0%) | 0 (0.0%) |
| Installation, Maintenance & Repair | 36 (100.0%) | 0 (0.0%) |
| Total (Category) | 78 (100.0%) | 0 (0.0%) |
| Total (Overall) | 443 (56.6%) | 340 (43.4%) |
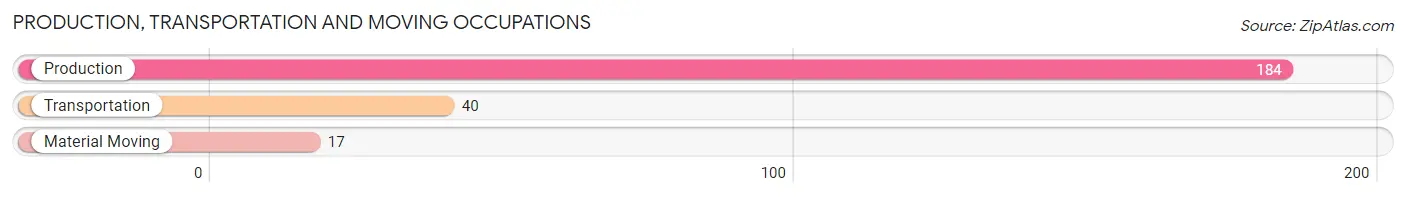
Production, Transportation and Moving Occupations
The most common Production, Transportation and Moving occupations in Lanark are Production (184 | 23.5%), Transportation (40 | 5.1%), and Material Moving (17 | 2.2%).
Production, Transportation and Moving Occupations by Sex
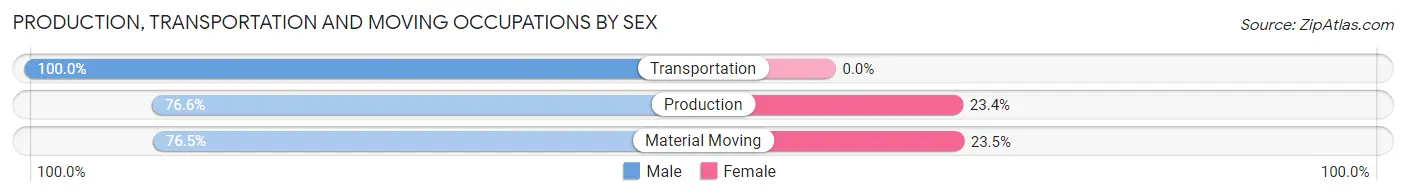
| Occupation | Male | Female |
| Production | 141 (76.6%) | 43 (23.4%) |
| Transportation | 40 (100.0%) | 0 (0.0%) |
| Material Moving | 13 (76.5%) | 4 (23.5%) |
| Total (Category) | 194 (80.5%) | 47 (19.5%) |
| Total (Overall) | 443 (56.6%) | 340 (43.4%) |
Employment Industries by Sex in Lanark
Employment Industries in Lanark
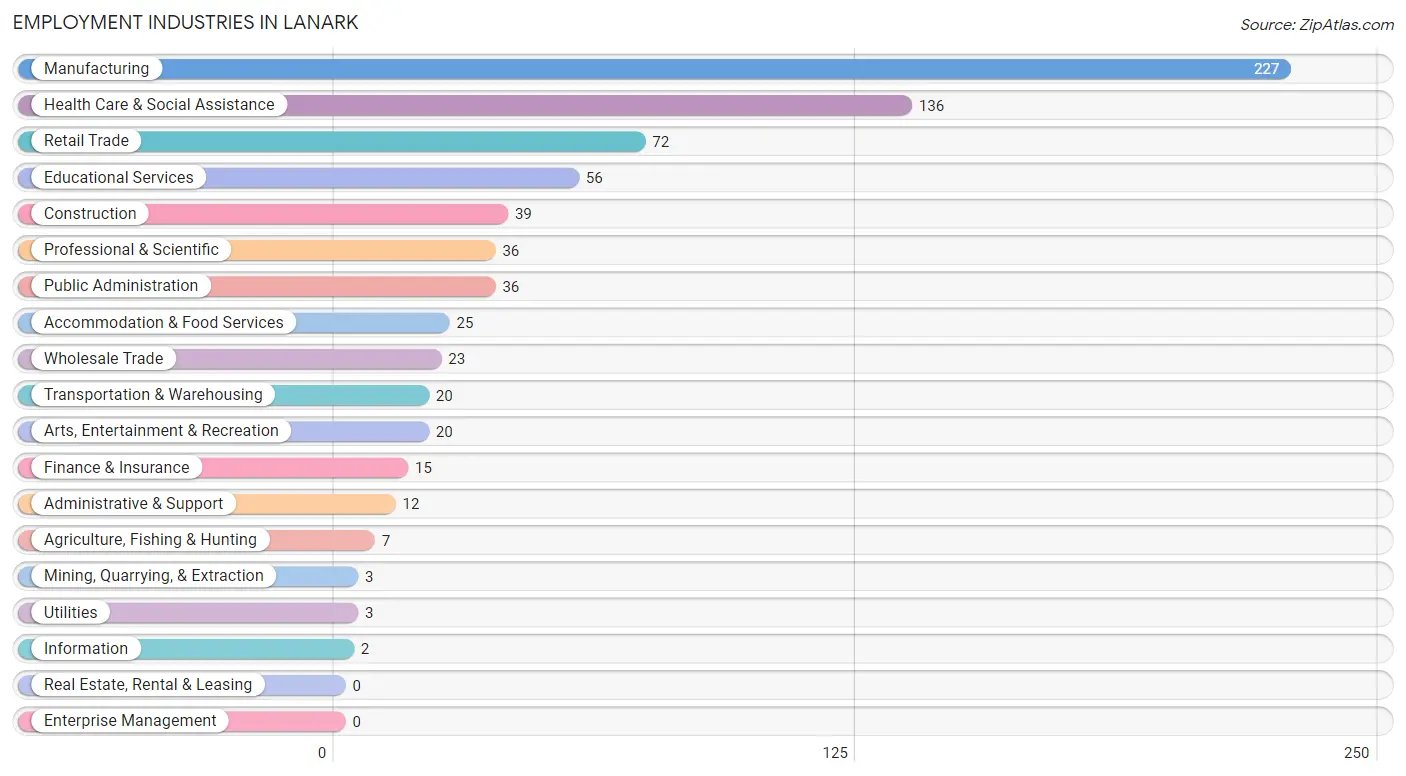
The major employment industries in Lanark include Manufacturing (227 | 29.0%), Health Care & Social Assistance (136 | 17.4%), Retail Trade (72 | 9.2%), Educational Services (56 | 7.1%), and Construction (39 | 5.0%).
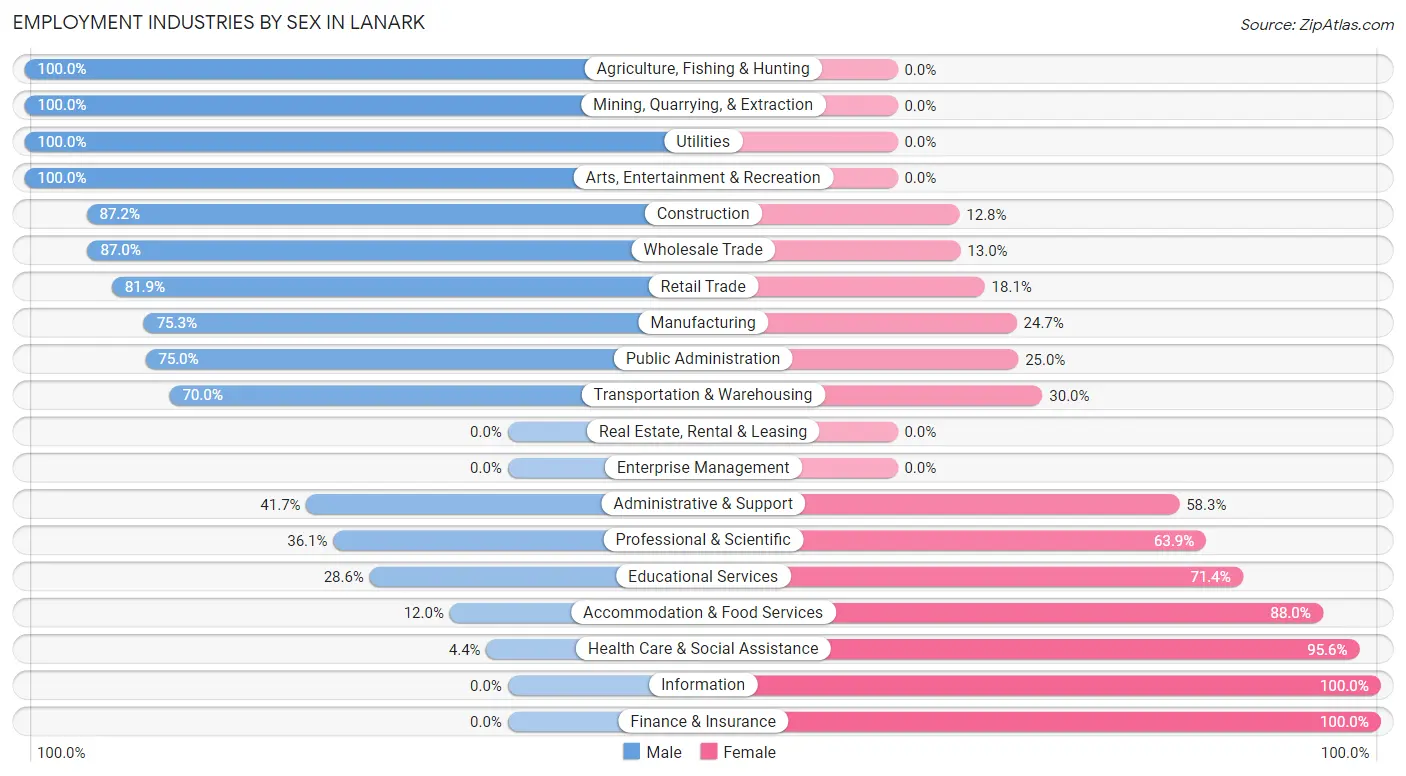
Employment Industries by Sex in Lanark
The Lanark industries that see more men than women are Agriculture, Fishing & Hunting (100.0%), Mining, Quarrying, & Extraction (100.0%), and Utilities (100.0%), whereas the industries that tend to have a higher number of women are Information (100.0%), Finance & Insurance (100.0%), and Health Care & Social Assistance (95.6%).
| Industry | Male | Female |
| Agriculture, Fishing & Hunting | 7 (100.0%) | 0 (0.0%) |
| Mining, Quarrying, & Extraction | 3 (100.0%) | 0 (0.0%) |
| Construction | 34 (87.2%) | 5 (12.8%) |
| Manufacturing | 171 (75.3%) | 56 (24.7%) |
| Wholesale Trade | 20 (87.0%) | 3 (13.0%) |
| Retail Trade | 59 (81.9%) | 13 (18.1%) |
| Transportation & Warehousing | 14 (70.0%) | 6 (30.0%) |
| Utilities | 3 (100.0%) | 0 (0.0%) |
| Information | 0 (0.0%) | 2 (100.0%) |
| Finance & Insurance | 0 (0.0%) | 15 (100.0%) |
| Real Estate, Rental & Leasing | 0 (0.0%) | 0 (0.0%) |
| Professional & Scientific | 13 (36.1%) | 23 (63.9%) |
| Enterprise Management | 0 (0.0%) | 0 (0.0%) |
| Administrative & Support | 5 (41.7%) | 7 (58.3%) |
| Educational Services | 16 (28.6%) | 40 (71.4%) |
| Health Care & Social Assistance | 6 (4.4%) | 130 (95.6%) |
| Arts, Entertainment & Recreation | 20 (100.0%) | 0 (0.0%) |
| Accommodation & Food Services | 3 (12.0%) | 22 (88.0%) |
| Public Administration | 27 (75.0%) | 9 (25.0%) |
| Total | 443 (56.6%) | 340 (43.4%) |
Education in Lanark
School Enrollment in Lanark
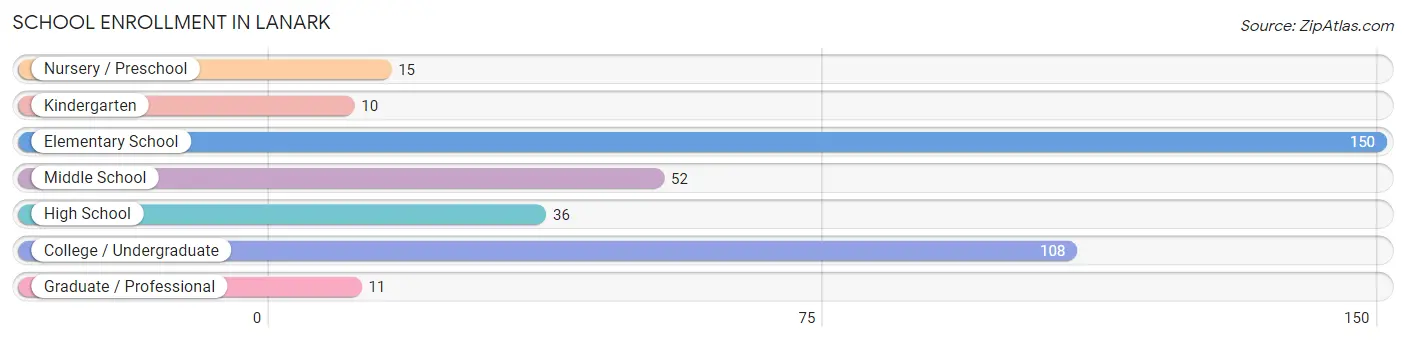
The most common levels of schooling among the 382 students in Lanark are elementary school (150 | 39.3%), college / undergraduate (108 | 28.3%), and middle school (52 | 13.6%).
| School Level | # Students | % Students |
| Nursery / Preschool | 15 | 3.9% |
| Kindergarten | 10 | 2.6% |
| Elementary School | 150 | 39.3% |
| Middle School | 52 | 13.6% |
| High School | 36 | 9.4% |
| College / Undergraduate | 108 | 28.3% |
| Graduate / Professional | 11 | 2.9% |
| Total | 382 | 100.0% |
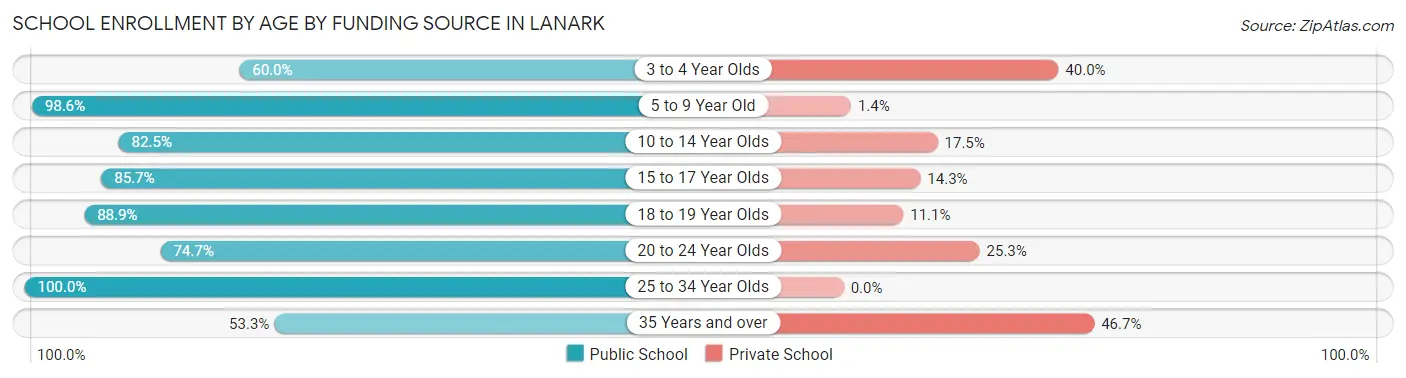
School Enrollment by Age by Funding Source in Lanark
Out of a total of 382 students who are enrolled in schools in Lanark, 54 (14.1%) attend a private institution, while the remaining 328 (85.9%) are enrolled in public schools. The age group of 35 years and over has the highest likelihood of being enrolled in private schools, with 7 (46.7% in the age bracket) enrolled. Conversely, the age group of 25 to 34 year olds has the lowest likelihood of being enrolled in a private school, with 7 (100.0% in the age bracket) attending a public institution.
| Age Bracket | Public School | Private School |
| 3 to 4 Year Olds | 9 (60.0%) | 6 (40.0%) |
| 5 to 9 Year Old | 145 (98.6%) | 2 (1.4%) |
| 10 to 14 Year Olds | 66 (82.5%) | 14 (17.5%) |
| 15 to 17 Year Olds | 18 (85.7%) | 3 (14.3%) |
| 18 to 19 Year Olds | 16 (88.9%) | 2 (11.1%) |
| 20 to 24 Year Olds | 59 (74.7%) | 20 (25.3%) |
| 25 to 34 Year Olds | 7 (100.0%) | 0 (0.0%) |
| 35 Years and over | 8 (53.3%) | 7 (46.7%) |
| Total | 328 (85.9%) | 54 (14.1%) |
Educational Attainment by Field of Study in Lanark
Education (54 | 32.7%), science & technology (26 | 15.8%), business (17 | 10.3%), bio, nature & agricultural (14 | 8.5%), and psychology (11 | 6.7%) are the most common fields of study among 165 individuals in Lanark who have obtained a bachelor's degree or higher.
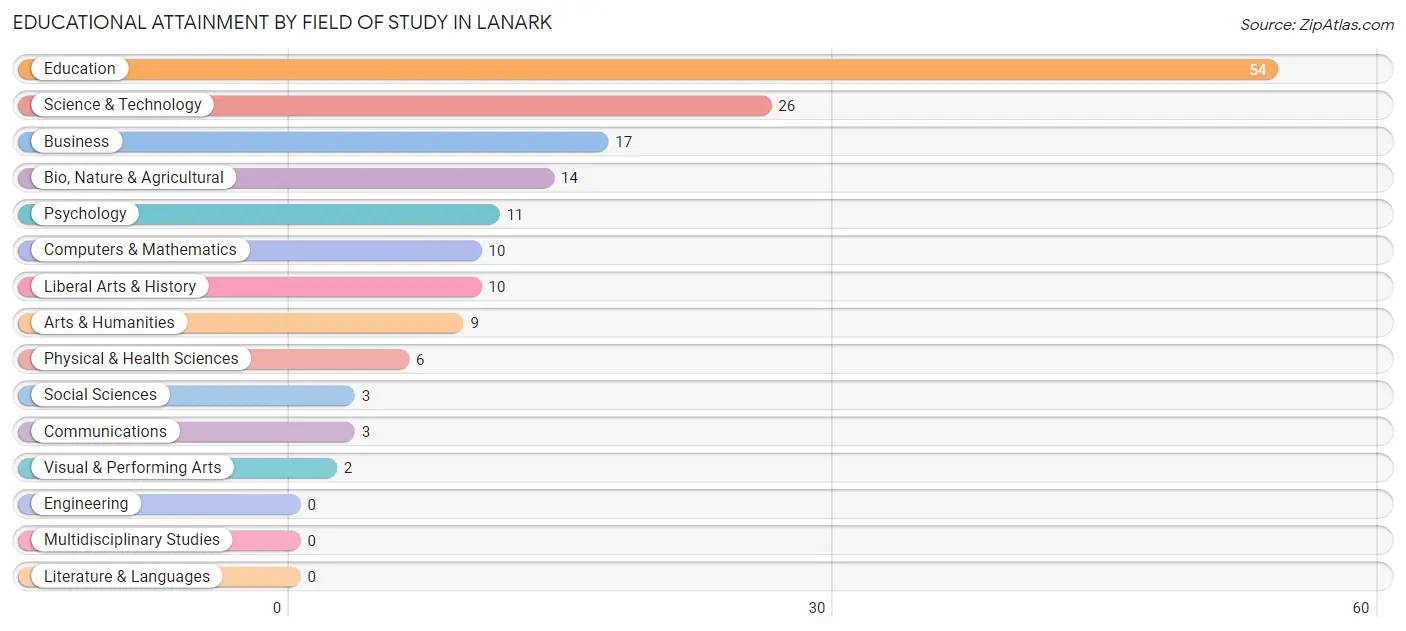
| Field of Study | # Graduates | % Graduates |
| Computers & Mathematics | 10 | 6.1% |
| Bio, Nature & Agricultural | 14 | 8.5% |
| Physical & Health Sciences | 6 | 3.6% |
| Psychology | 11 | 6.7% |
| Social Sciences | 3 | 1.8% |
| Engineering | 0 | 0.0% |
| Multidisciplinary Studies | 0 | 0.0% |
| Science & Technology | 26 | 15.8% |
| Business | 17 | 10.3% |
| Education | 54 | 32.7% |
| Literature & Languages | 0 | 0.0% |
| Liberal Arts & History | 10 | 6.1% |
| Visual & Performing Arts | 2 | 1.2% |
| Communications | 3 | 1.8% |
| Arts & Humanities | 9 | 5.4% |
| Total | 165 | 100.0% |
Transportation & Commute in Lanark
Vehicle Availability by Sex in Lanark
The most prevalent vehicle ownership categories in Lanark are males with 2 vehicles (258, accounting for 57.1%) and females with 2 vehicles (173, making up 80.9%).
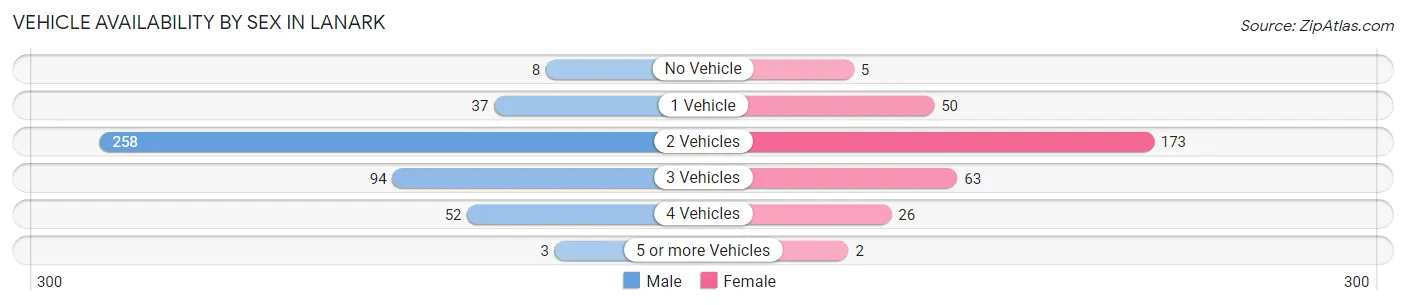
| Vehicles Available | Male | Female |
| No Vehicle | 8 (1.8%) | 5 (1.6%) |
| 1 Vehicle | 37 (8.2%) | 50 (15.7%) |
| 2 Vehicles | 258 (57.1%) | 173 (54.2%) |
| 3 Vehicles | 94 (20.8%) | 63 (19.8%) |
| 4 Vehicles | 52 (11.5%) | 26 (8.2%) |
| 5 or more Vehicles | 3 (0.7%) | 2 (0.6%) |
| Total | 452 (100.0%) | 319 (100.0%) |
Commute Time in Lanark
The most frequently occuring commute durations in Lanark are 30 to 34 minutes (113 commuters, 14.9%), less than 5 minutes (103 commuters, 13.6%), and 35 to 39 minutes (91 commuters, 12.0%).
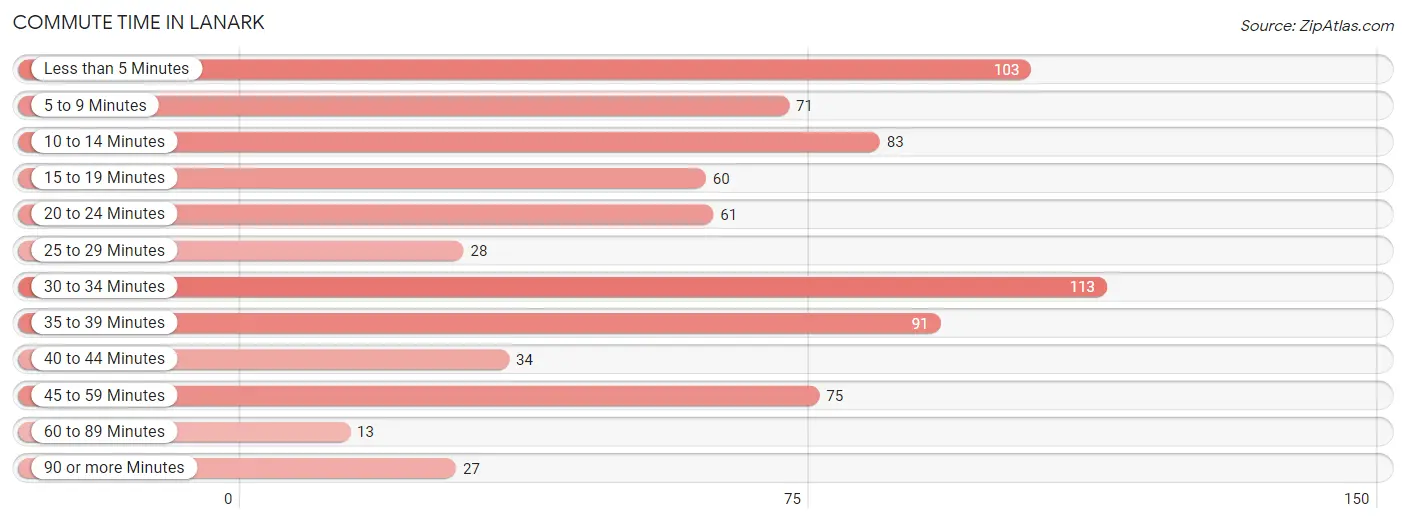
| Commute Time | # Commuters | % Commuters |
| Less than 5 Minutes | 103 | 13.6% |
| 5 to 9 Minutes | 71 | 9.3% |
| 10 to 14 Minutes | 83 | 10.9% |
| 15 to 19 Minutes | 60 | 7.9% |
| 20 to 24 Minutes | 61 | 8.0% |
| 25 to 29 Minutes | 28 | 3.7% |
| 30 to 34 Minutes | 113 | 14.9% |
| 35 to 39 Minutes | 91 | 12.0% |
| 40 to 44 Minutes | 34 | 4.5% |
| 45 to 59 Minutes | 75 | 9.9% |
| 60 to 89 Minutes | 13 | 1.7% |
| 90 or more Minutes | 27 | 3.6% |
Commute Time by Sex in Lanark
The most common commute times in Lanark are 35 to 39 minutes (85 commuters, 19.0%) for males and 30 to 34 minutes (54 commuters, 17.4%) for females.
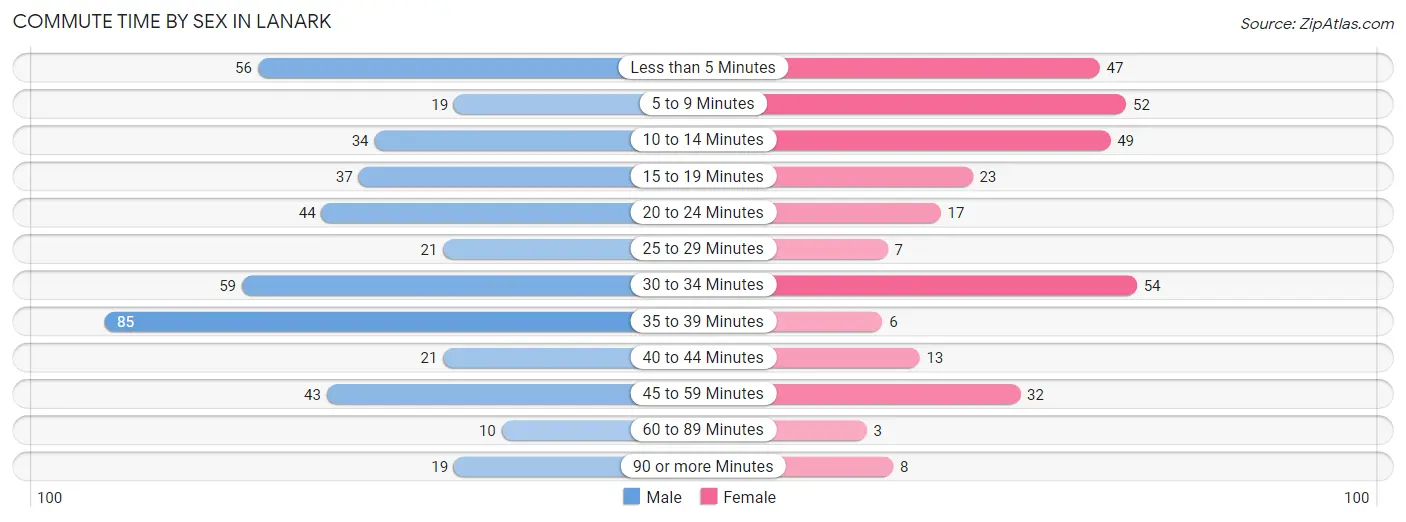
| Commute Time | Male | Female |
| Less than 5 Minutes | 56 (12.5%) | 47 (15.1%) |
| 5 to 9 Minutes | 19 (4.2%) | 52 (16.7%) |
| 10 to 14 Minutes | 34 (7.6%) | 49 (15.8%) |
| 15 to 19 Minutes | 37 (8.3%) | 23 (7.4%) |
| 20 to 24 Minutes | 44 (9.8%) | 17 (5.5%) |
| 25 to 29 Minutes | 21 (4.7%) | 7 (2.2%) |
| 30 to 34 Minutes | 59 (13.2%) | 54 (17.4%) |
| 35 to 39 Minutes | 85 (19.0%) | 6 (1.9%) |
| 40 to 44 Minutes | 21 (4.7%) | 13 (4.2%) |
| 45 to 59 Minutes | 43 (9.6%) | 32 (10.3%) |
| 60 to 89 Minutes | 10 (2.2%) | 3 (1.0%) |
| 90 or more Minutes | 19 (4.2%) | 8 (2.6%) |
Time of Departure to Work by Sex in Lanark
The most frequent times of departure to work in Lanark are 6:00 AM to 6:29 AM (92, 20.5%) for males and 8:00 AM to 8:29 AM (81, 26.1%) for females.
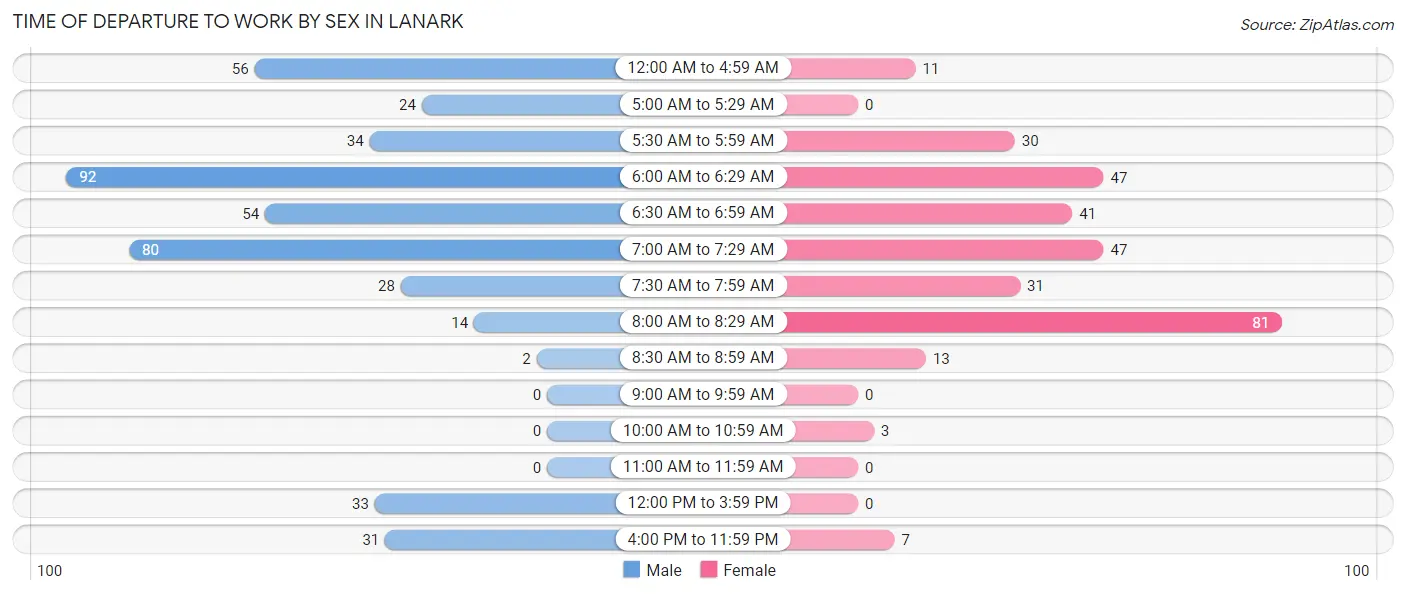
| Time of Departure | Male | Female |
| 12:00 AM to 4:59 AM | 56 (12.5%) | 11 (3.5%) |
| 5:00 AM to 5:29 AM | 24 (5.4%) | 0 (0.0%) |
| 5:30 AM to 5:59 AM | 34 (7.6%) | 30 (9.7%) |
| 6:00 AM to 6:29 AM | 92 (20.5%) | 47 (15.1%) |
| 6:30 AM to 6:59 AM | 54 (12.0%) | 41 (13.2%) |
| 7:00 AM to 7:29 AM | 80 (17.9%) | 47 (15.1%) |
| 7:30 AM to 7:59 AM | 28 (6.2%) | 31 (10.0%) |
| 8:00 AM to 8:29 AM | 14 (3.1%) | 81 (26.1%) |
| 8:30 AM to 8:59 AM | 2 (0.4%) | 13 (4.2%) |
| 9:00 AM to 9:59 AM | 0 (0.0%) | 0 (0.0%) |
| 10:00 AM to 10:59 AM | 0 (0.0%) | 3 (1.0%) |
| 11:00 AM to 11:59 AM | 0 (0.0%) | 0 (0.0%) |
| 12:00 PM to 3:59 PM | 33 (7.4%) | 0 (0.0%) |
| 4:00 PM to 11:59 PM | 31 (6.9%) | 7 (2.2%) |
| Total | 448 (100.0%) | 311 (100.0%) |
Housing Occupancy in Lanark
Occupancy by Ownership in Lanark
Of the total 652 dwellings in Lanark, owner-occupied units account for 512 (78.5%), while renter-occupied units make up 140 (21.5%).
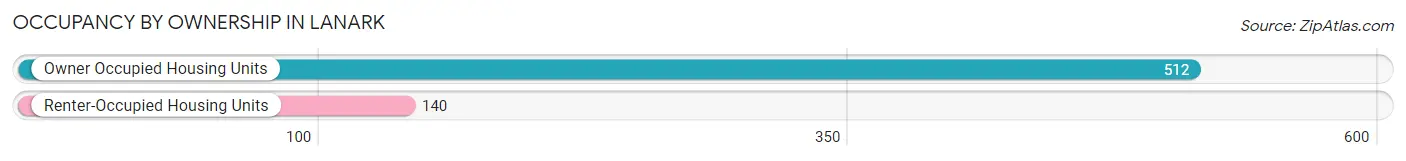
| Occupancy | # Housing Units | % Housing Units |
| Owner Occupied Housing Units | 512 | 78.5% |
| Renter-Occupied Housing Units | 140 | 21.5% |
| Total Occupied Housing Units | 652 | 100.0% |
Occupancy by Household Size in Lanark
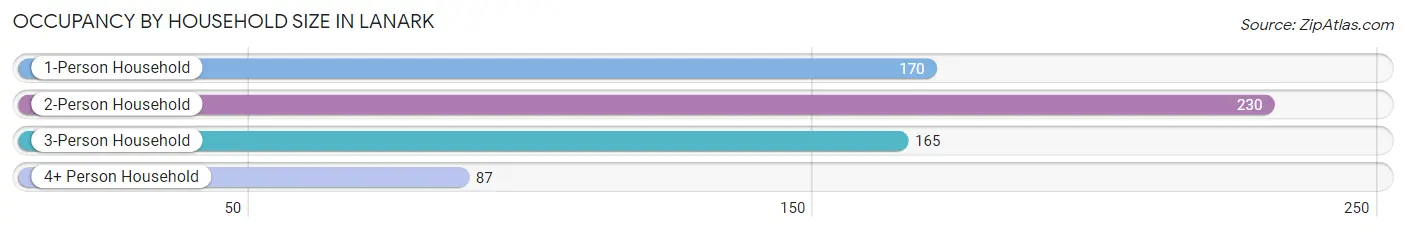
| Household Size | # Housing Units | % Housing Units |
| 1-Person Household | 170 | 26.1% |
| 2-Person Household | 230 | 35.3% |
| 3-Person Household | 165 | 25.3% |
| 4+ Person Household | 87 | 13.3% |
| Total Housing Units | 652 | 100.0% |
Occupancy by Ownership by Household Size in Lanark
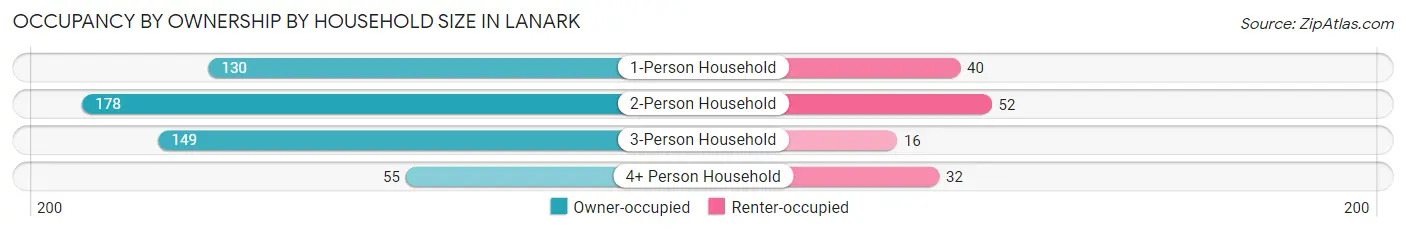
| Household Size | Owner-occupied | Renter-occupied |
| 1-Person Household | 130 (76.5%) | 40 (23.5%) |
| 2-Person Household | 178 (77.4%) | 52 (22.6%) |
| 3-Person Household | 149 (90.3%) | 16 (9.7%) |
| 4+ Person Household | 55 (63.2%) | 32 (36.8%) |
| Total Housing Units | 512 (78.5%) | 140 (21.5%) |
Occupancy by Educational Attainment in Lanark
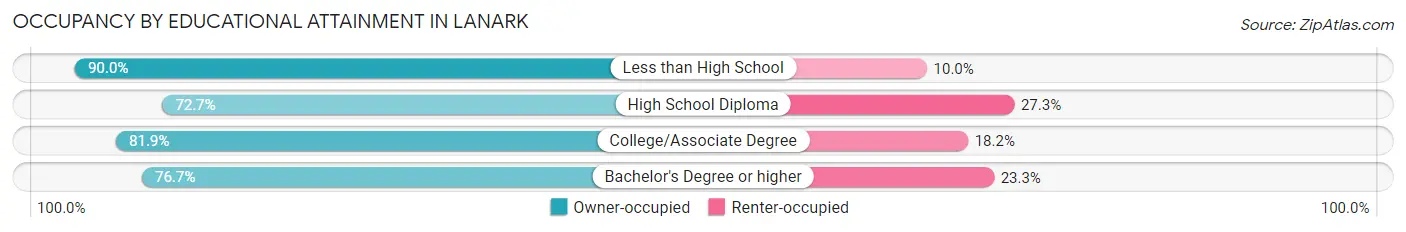
| Household Size | Owner-occupied | Renter-occupied |
| Less than High School | 27 (90.0%) | 3 (10.0%) |
| High School Diploma | 149 (72.7%) | 56 (27.3%) |
| College/Associate Degree | 257 (81.9%) | 57 (18.1%) |
| Bachelor's Degree or higher | 79 (76.7%) | 24 (23.3%) |
Occupancy by Age of Householder in Lanark
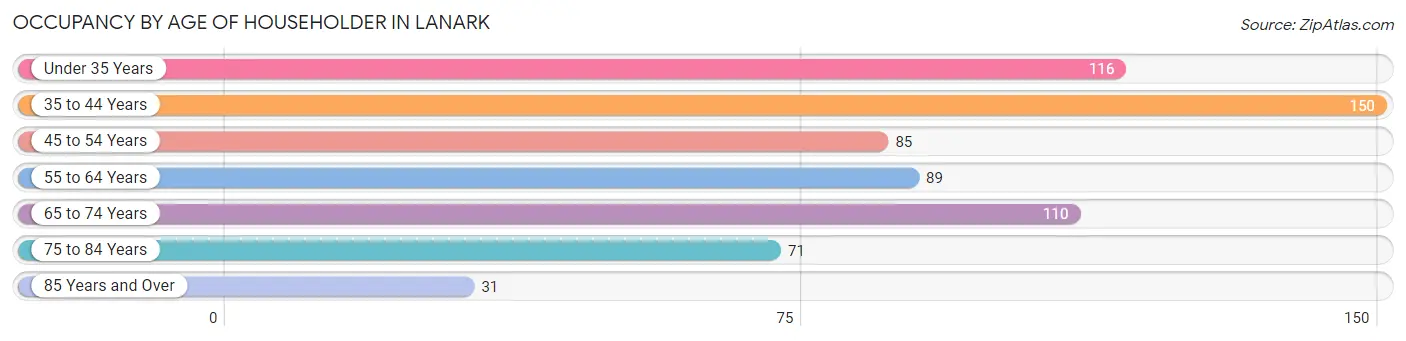
| Age Bracket | # Households | % Households |
| Under 35 Years | 116 | 17.8% |
| 35 to 44 Years | 150 | 23.0% |
| 45 to 54 Years | 85 | 13.0% |
| 55 to 64 Years | 89 | 13.7% |
| 65 to 74 Years | 110 | 16.9% |
| 75 to 84 Years | 71 | 10.9% |
| 85 Years and Over | 31 | 4.8% |
| Total | 652 | 100.0% |
Housing Finances in Lanark
Median Income by Occupancy in Lanark
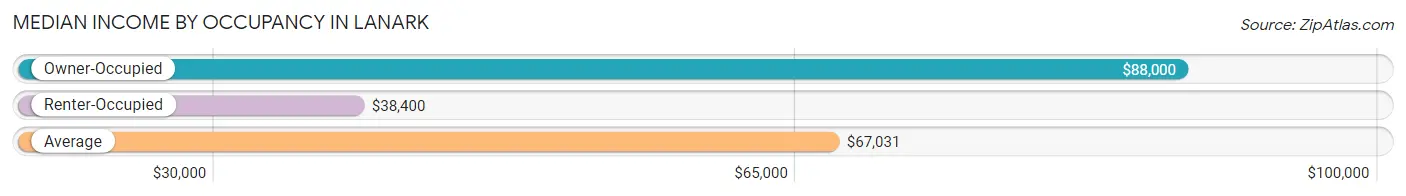
| Occupancy Type | # Households | Median Income |
| Owner-Occupied | 512 (78.5%) | $88,000 |
| Renter-Occupied | 140 (21.5%) | $38,400 |
| Average | 652 (100.0%) | $67,031 |
Occupancy by Householder Income Bracket in Lanark
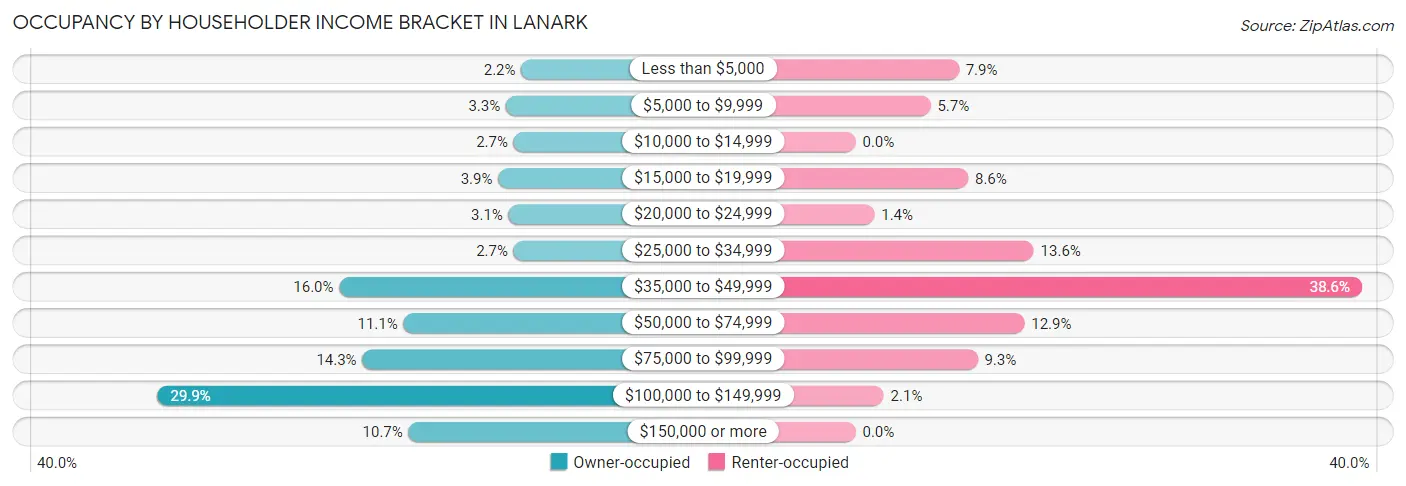
| Income Bracket | Owner-occupied | Renter-occupied |
| Less than $5,000 | 11 (2.1%) | 11 (7.9%) |
| $5,000 to $9,999 | 17 (3.3%) | 8 (5.7%) |
| $10,000 to $14,999 | 14 (2.7%) | 0 (0.0%) |
| $15,000 to $19,999 | 20 (3.9%) | 12 (8.6%) |
| $20,000 to $24,999 | 16 (3.1%) | 2 (1.4%) |
| $25,000 to $34,999 | 14 (2.7%) | 19 (13.6%) |
| $35,000 to $49,999 | 82 (16.0%) | 54 (38.6%) |
| $50,000 to $74,999 | 57 (11.1%) | 18 (12.9%) |
| $75,000 to $99,999 | 73 (14.3%) | 13 (9.3%) |
| $100,000 to $149,999 | 153 (29.9%) | 3 (2.1%) |
| $150,000 or more | 55 (10.7%) | 0 (0.0%) |
| Total | 512 (100.0%) | 140 (100.0%) |
Monthly Housing Cost Tiers in Lanark
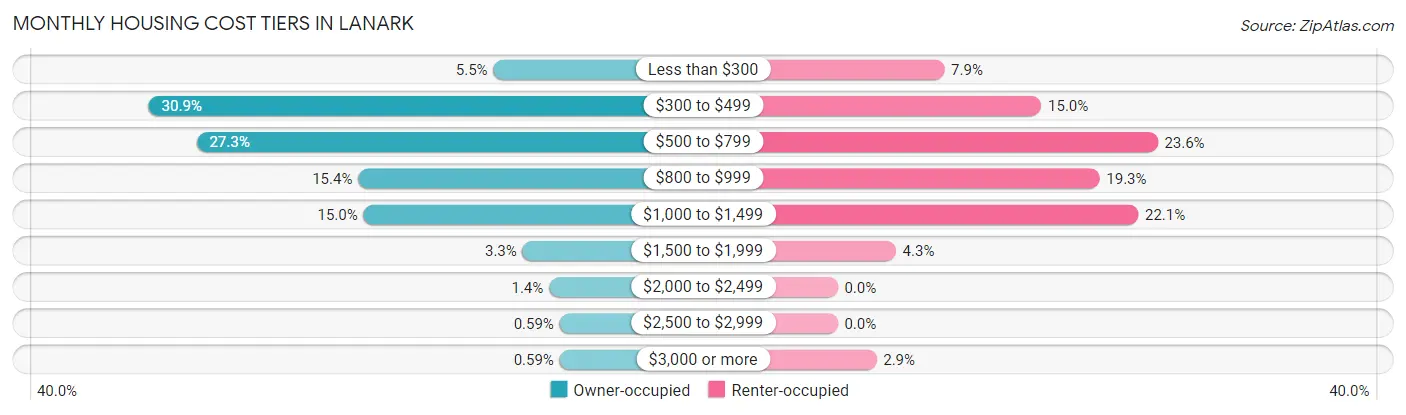
| Monthly Cost | Owner-occupied | Renter-occupied |
| Less than $300 | 28 (5.5%) | 11 (7.9%) |
| $300 to $499 | 158 (30.9%) | 21 (15.0%) |
| $500 to $799 | 140 (27.3%) | 33 (23.6%) |
| $800 to $999 | 79 (15.4%) | 27 (19.3%) |
| $1,000 to $1,499 | 77 (15.0%) | 31 (22.1%) |
| $1,500 to $1,999 | 17 (3.3%) | 6 (4.3%) |
| $2,000 to $2,499 | 7 (1.4%) | 0 (0.0%) |
| $2,500 to $2,999 | 3 (0.6%) | 0 (0.0%) |
| $3,000 or more | 3 (0.6%) | 4 (2.9%) |
| Total | 512 (100.0%) | 140 (100.0%) |
Physical Housing Characteristics in Lanark
Housing Structures in Lanark
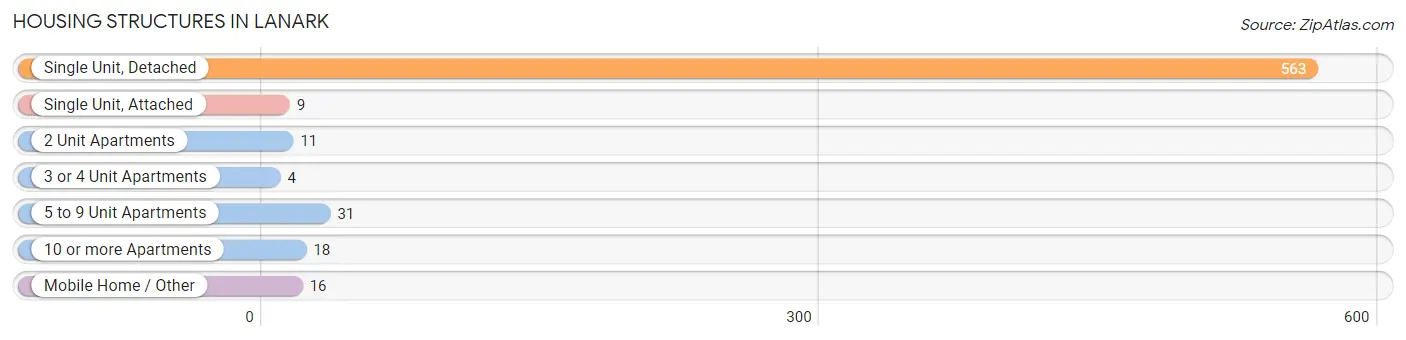
| Structure Type | # Housing Units | % Housing Units |
| Single Unit, Detached | 563 | 86.4% |
| Single Unit, Attached | 9 | 1.4% |
| 2 Unit Apartments | 11 | 1.7% |
| 3 or 4 Unit Apartments | 4 | 0.6% |
| 5 to 9 Unit Apartments | 31 | 4.8% |
| 10 or more Apartments | 18 | 2.8% |
| Mobile Home / Other | 16 | 2.5% |
| Total | 652 | 100.0% |
Housing Structures by Occupancy in Lanark
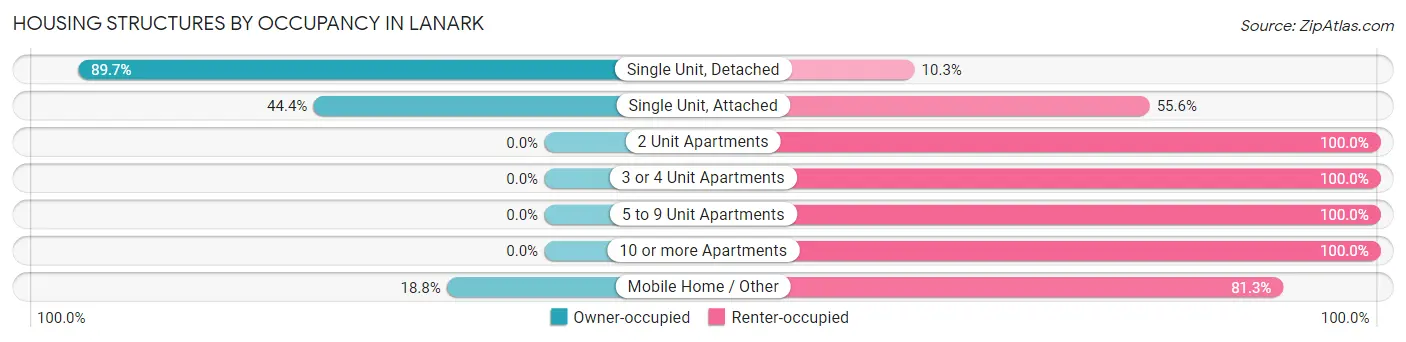
| Structure Type | Owner-occupied | Renter-occupied |
| Single Unit, Detached | 505 (89.7%) | 58 (10.3%) |
| Single Unit, Attached | 4 (44.4%) | 5 (55.6%) |
| 2 Unit Apartments | 0 (0.0%) | 11 (100.0%) |
| 3 or 4 Unit Apartments | 0 (0.0%) | 4 (100.0%) |
| 5 to 9 Unit Apartments | 0 (0.0%) | 31 (100.0%) |
| 10 or more Apartments | 0 (0.0%) | 18 (100.0%) |
| Mobile Home / Other | 3 (18.8%) | 13 (81.2%) |
| Total | 512 (78.5%) | 140 (21.5%) |
Housing Structures by Number of Rooms in Lanark
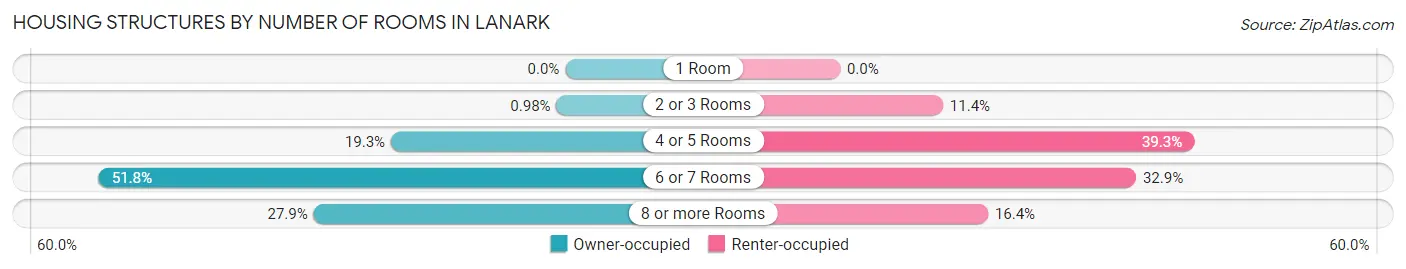
| Number of Rooms | Owner-occupied | Renter-occupied |
| 1 Room | 0 (0.0%) | 0 (0.0%) |
| 2 or 3 Rooms | 5 (1.0%) | 16 (11.4%) |
| 4 or 5 Rooms | 99 (19.3%) | 55 (39.3%) |
| 6 or 7 Rooms | 265 (51.8%) | 46 (32.9%) |
| 8 or more Rooms | 143 (27.9%) | 23 (16.4%) |
| Total | 512 (100.0%) | 140 (100.0%) |
Housing Structure by Heating Type in Lanark
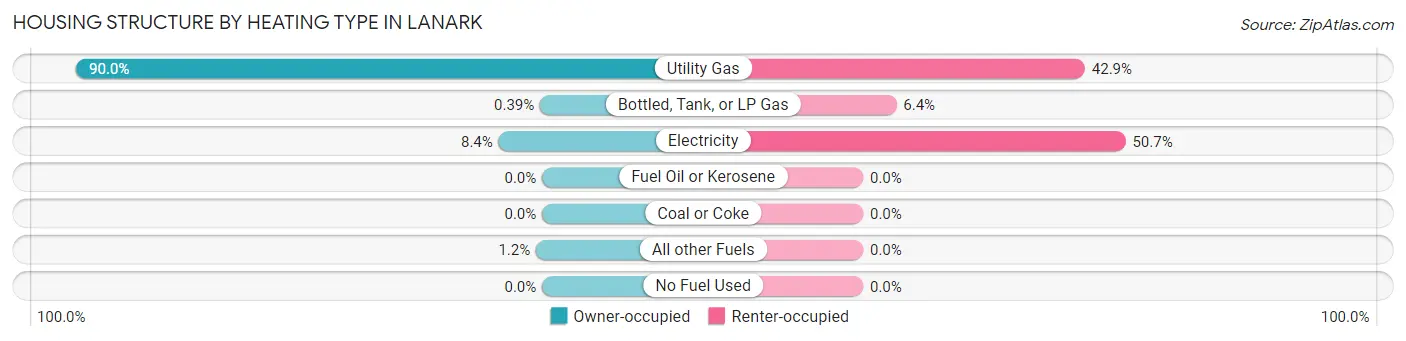
| Heating Type | Owner-occupied | Renter-occupied |
| Utility Gas | 461 (90.0%) | 60 (42.9%) |
| Bottled, Tank, or LP Gas | 2 (0.4%) | 9 (6.4%) |
| Electricity | 43 (8.4%) | 71 (50.7%) |
| Fuel Oil or Kerosene | 0 (0.0%) | 0 (0.0%) |
| Coal or Coke | 0 (0.0%) | 0 (0.0%) |
| All other Fuels | 6 (1.2%) | 0 (0.0%) |
| No Fuel Used | 0 (0.0%) | 0 (0.0%) |
| Total | 512 (100.0%) | 140 (100.0%) |
Household Vehicle Usage in Lanark
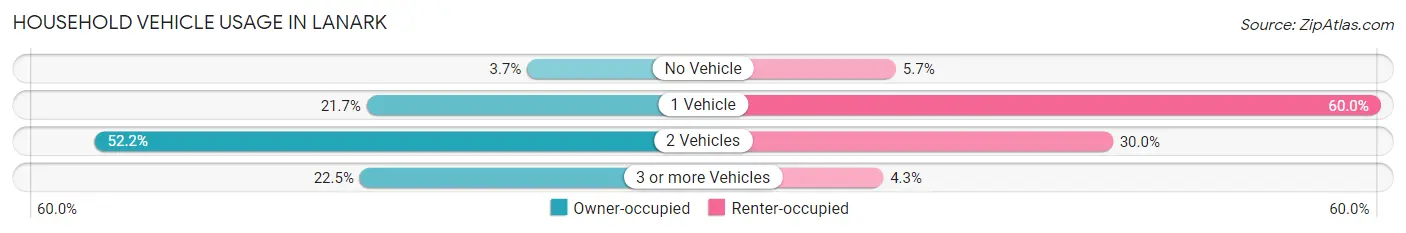
| Vehicles per Household | Owner-occupied | Renter-occupied |
| No Vehicle | 19 (3.7%) | 8 (5.7%) |
| 1 Vehicle | 111 (21.7%) | 84 (60.0%) |
| 2 Vehicles | 267 (52.1%) | 42 (30.0%) |
| 3 or more Vehicles | 115 (22.5%) | 6 (4.3%) |
| Total | 512 (100.0%) | 140 (100.0%) |
Real Estate & Mortgages in Lanark
Real Estate and Mortgage Overview in Lanark
| Characteristic | Without Mortgage | With Mortgage |
| Housing Units | 281 | 231 |
| Median Property Value | $92,400 | $97,300 |
| Median Household Income | $52,212 | $24 |
| Monthly Housing Costs | $447 | $3 |
| Real Estate Taxes | $1,700 | $3 |
Property Value by Mortgage Status in Lanark
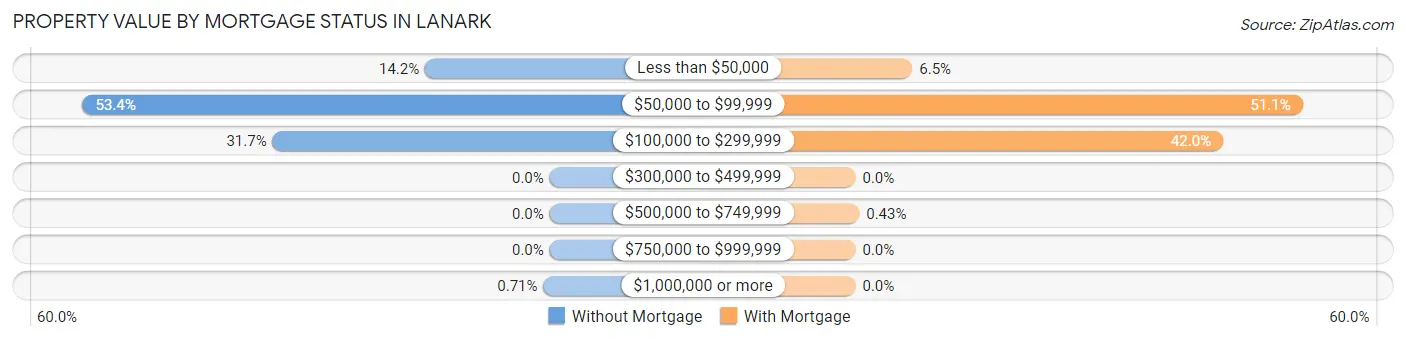
| Property Value | Without Mortgage | With Mortgage |
| Less than $50,000 | 40 (14.2%) | 15 (6.5%) |
| $50,000 to $99,999 | 150 (53.4%) | 118 (51.1%) |
| $100,000 to $299,999 | 89 (31.7%) | 97 (42.0%) |
| $300,000 to $499,999 | 0 (0.0%) | 0 (0.0%) |
| $500,000 to $749,999 | 0 (0.0%) | 1 (0.4%) |
| $750,000 to $999,999 | 0 (0.0%) | 0 (0.0%) |
| $1,000,000 or more | 2 (0.7%) | 0 (0.0%) |
| Total | 281 (100.0%) | 231 (100.0%) |
Household Income by Mortgage Status in Lanark
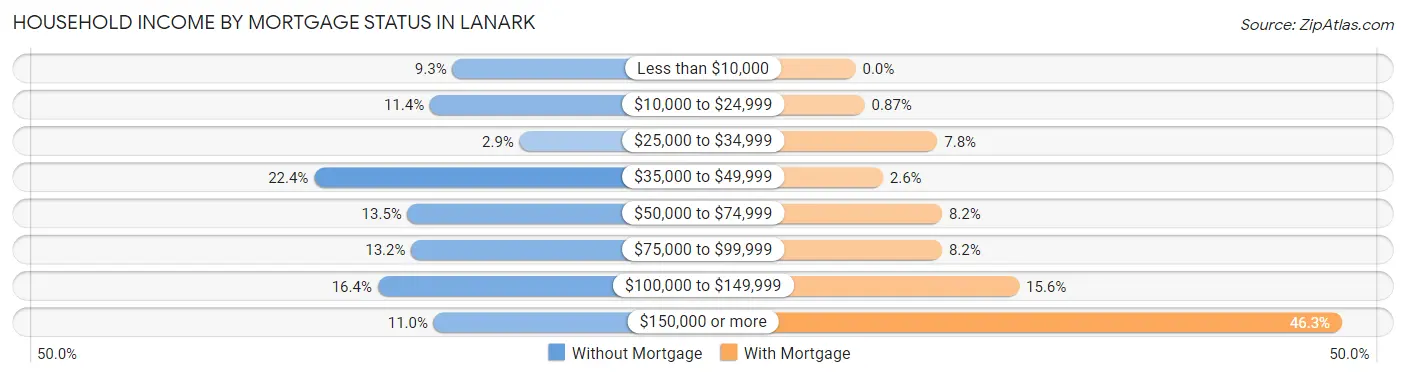
| Household Income | Without Mortgage | With Mortgage |
| Less than $10,000 | 26 (9.2%) | 0 (0.0%) |
| $10,000 to $24,999 | 32 (11.4%) | 2 (0.9%) |
| $25,000 to $34,999 | 8 (2.9%) | 18 (7.8%) |
| $35,000 to $49,999 | 63 (22.4%) | 6 (2.6%) |
| $50,000 to $74,999 | 38 (13.5%) | 19 (8.2%) |
| $75,000 to $99,999 | 37 (13.2%) | 19 (8.2%) |
| $100,000 to $149,999 | 46 (16.4%) | 36 (15.6%) |
| $150,000 or more | 31 (11.0%) | 107 (46.3%) |
| Total | 281 (100.0%) | 231 (100.0%) |
Property Value to Household Income Ratio in Lanark
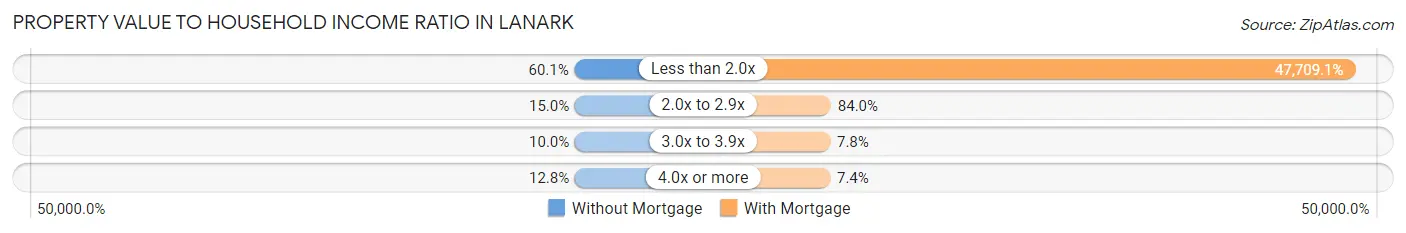
| Value-to-Income Ratio | Without Mortgage | With Mortgage |
| Less than 2.0x | 169 (60.1%) | 110,208 (47,709.1%) |
| 2.0x to 2.9x | 42 (14.9%) | 194 (84.0%) |
| 3.0x to 3.9x | 28 (10.0%) | 18 (7.8%) |
| 4.0x or more | 36 (12.8%) | 17 (7.4%) |
| Total | 281 (100.0%) | 231 (100.0%) |
Real Estate Taxes by Mortgage Status in Lanark
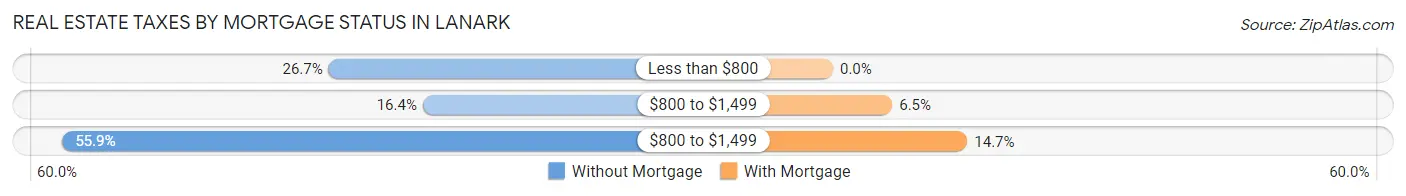
| Property Taxes | Without Mortgage | With Mortgage |
| Less than $800 | 75 (26.7%) | 0 (0.0%) |
| $800 to $1,499 | 46 (16.4%) | 15 (6.5%) |
| $800 to $1,499 | 157 (55.9%) | 34 (14.7%) |
| Total | 281 (100.0%) | 231 (100.0%) |
Health & Disability in Lanark
Health Insurance Coverage by Age in Lanark
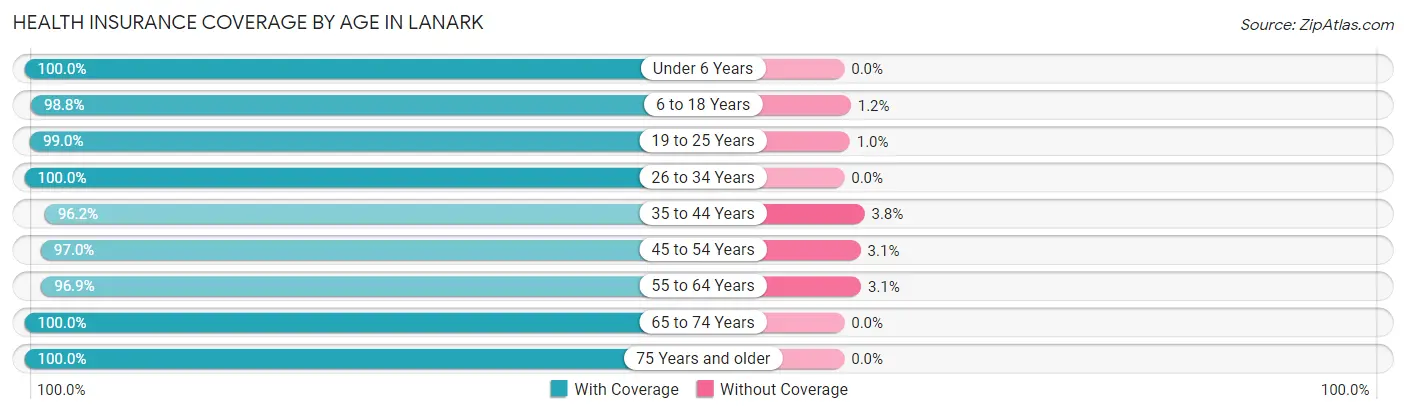
| Age Bracket | With Coverage | Without Coverage |
| Under 6 Years | 125 (100.0%) | 0 (0.0%) |
| 6 to 18 Years | 244 (98.8%) | 3 (1.2%) |
| 19 to 25 Years | 195 (99.0%) | 2 (1.0%) |
| 26 to 34 Years | 96 (100.0%) | 0 (0.0%) |
| 35 to 44 Years | 230 (96.2%) | 9 (3.8%) |
| 45 to 54 Years | 159 (97.0%) | 5 (3.0%) |
| 55 to 64 Years | 155 (96.9%) | 5 (3.1%) |
| 65 to 74 Years | 167 (100.0%) | 0 (0.0%) |
| 75 Years and older | 143 (100.0%) | 0 (0.0%) |
| Total | 1,514 (98.4%) | 24 (1.6%) |
Health Insurance Coverage by Citizenship Status in Lanark
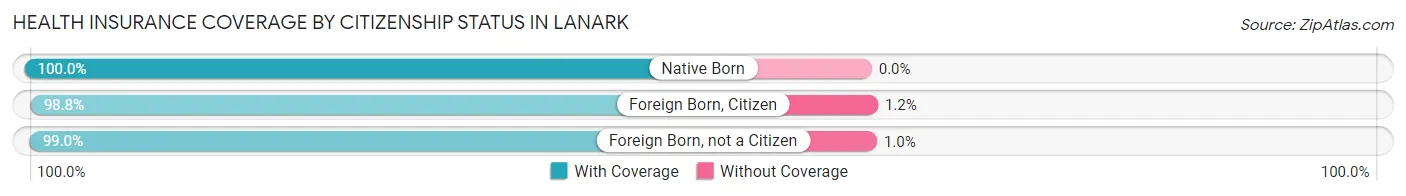
| Citizenship Status | With Coverage | Without Coverage |
| Native Born | 125 (100.0%) | 0 (0.0%) |
| Foreign Born, Citizen | 244 (98.8%) | 3 (1.2%) |
| Foreign Born, not a Citizen | 195 (99.0%) | 2 (1.0%) |
Health Insurance Coverage by Household Income in Lanark
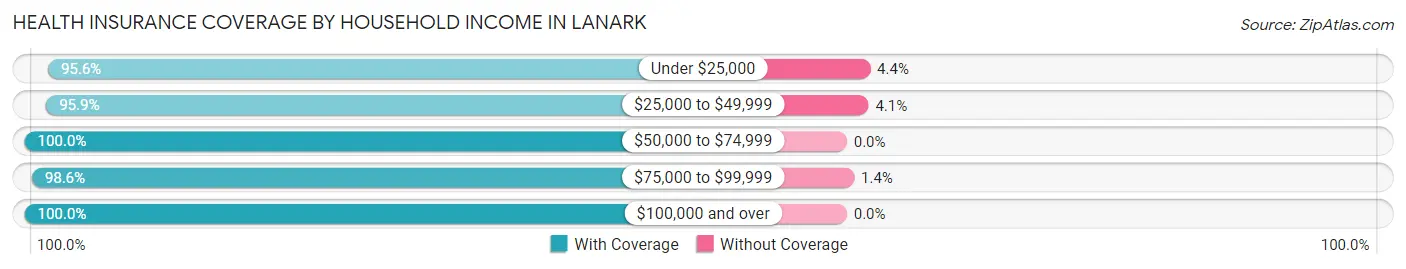
| Household Income | With Coverage | Without Coverage |
| Under $25,000 | 153 (95.6%) | 7 (4.4%) |
| $25,000 to $49,999 | 331 (95.9%) | 14 (4.1%) |
| $50,000 to $74,999 | 201 (100.0%) | 0 (0.0%) |
| $75,000 to $99,999 | 216 (98.6%) | 3 (1.4%) |
| $100,000 and over | 599 (100.0%) | 0 (0.0%) |
Public vs Private Health Insurance Coverage by Age in Lanark
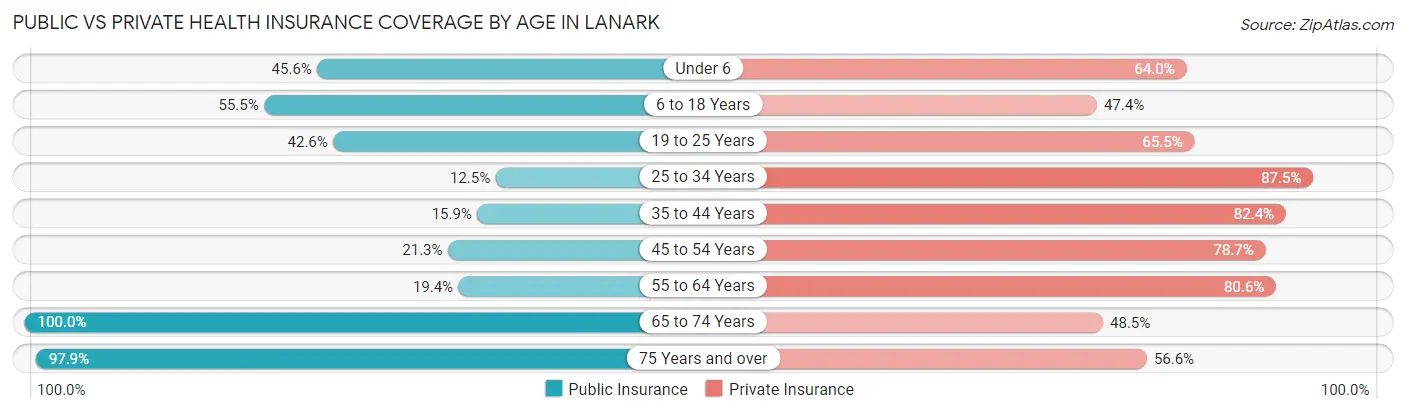
| Age Bracket | Public Insurance | Private Insurance |
| Under 6 | 57 (45.6%) | 80 (64.0%) |
| 6 to 18 Years | 137 (55.5%) | 117 (47.4%) |
| 19 to 25 Years | 84 (42.6%) | 129 (65.5%) |
| 25 to 34 Years | 12 (12.5%) | 84 (87.5%) |
| 35 to 44 Years | 38 (15.9%) | 197 (82.4%) |
| 45 to 54 Years | 35 (21.3%) | 129 (78.7%) |
| 55 to 64 Years | 31 (19.4%) | 129 (80.6%) |
| 65 to 74 Years | 167 (100.0%) | 81 (48.5%) |
| 75 Years and over | 140 (97.9%) | 81 (56.6%) |
| Total | 701 (45.6%) | 1,027 (66.8%) |
Disability Status by Sex by Age in Lanark
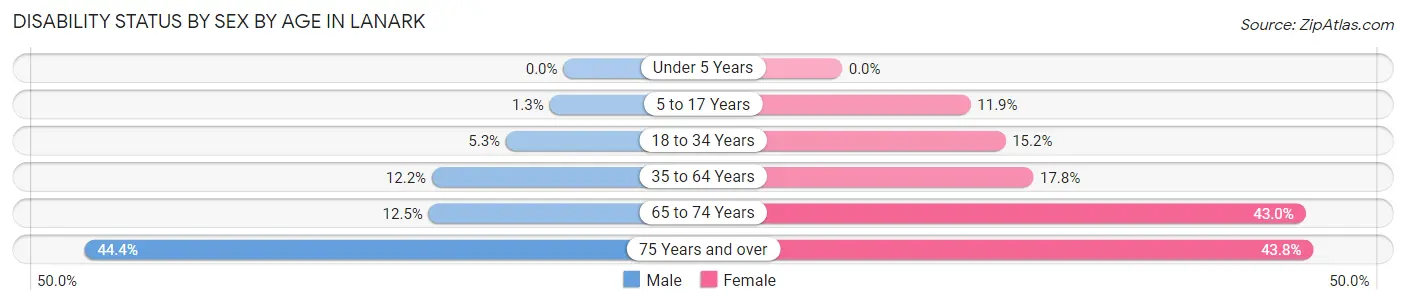
| Age Bracket | Male | Female |
| Under 5 Years | 0 (0.0%) | 0 (0.0%) |
| 5 to 17 Years | 2 (1.3%) | 13 (11.9%) |
| 18 to 34 Years | 8 (5.3%) | 22 (15.2%) |
| 35 to 64 Years | 35 (12.2%) | 49 (17.7%) |
| 65 to 74 Years | 11 (12.5%) | 34 (43.0%) |
| 75 Years and over | 28 (44.4%) | 35 (43.8%) |
Disability Class by Sex by Age in Lanark
Disability Class: Hearing Difficulty
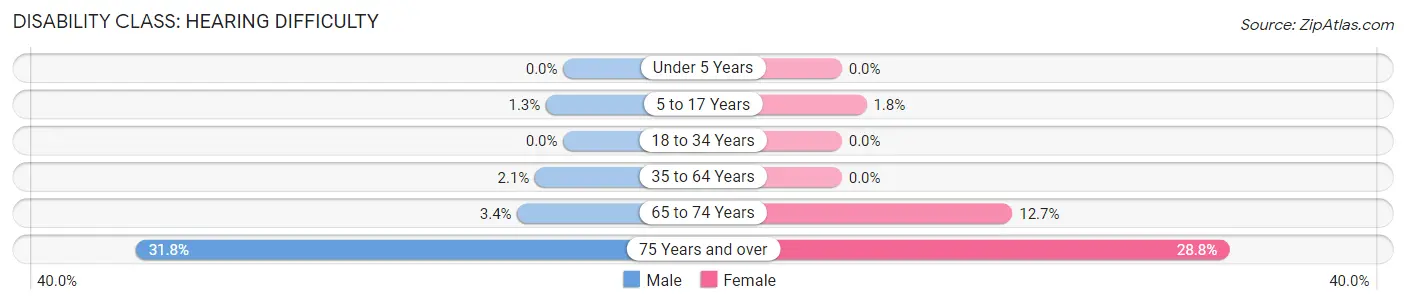
| Age Bracket | Male | Female |
| Under 5 Years | 0 (0.0%) | 0 (0.0%) |
| 5 to 17 Years | 2 (1.3%) | 2 (1.8%) |
| 18 to 34 Years | 0 (0.0%) | 0 (0.0%) |
| 35 to 64 Years | 6 (2.1%) | 0 (0.0%) |
| 65 to 74 Years | 3 (3.4%) | 10 (12.7%) |
| 75 Years and over | 20 (31.8%) | 23 (28.7%) |
Disability Class: Vision Difficulty
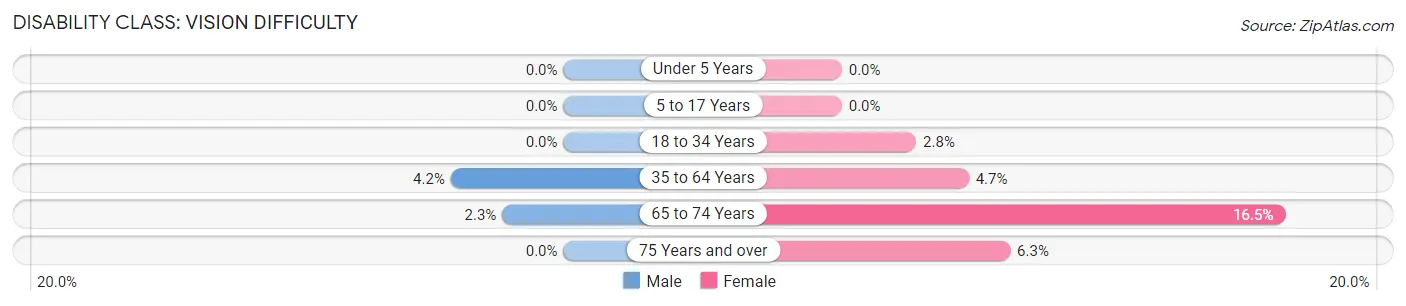
| Age Bracket | Male | Female |
| Under 5 Years | 0 (0.0%) | 0 (0.0%) |
| 5 to 17 Years | 0 (0.0%) | 0 (0.0%) |
| 18 to 34 Years | 0 (0.0%) | 4 (2.8%) |
| 35 to 64 Years | 12 (4.2%) | 13 (4.7%) |
| 65 to 74 Years | 2 (2.3%) | 13 (16.5%) |
| 75 Years and over | 0 (0.0%) | 5 (6.2%) |
Disability Class: Cognitive Difficulty
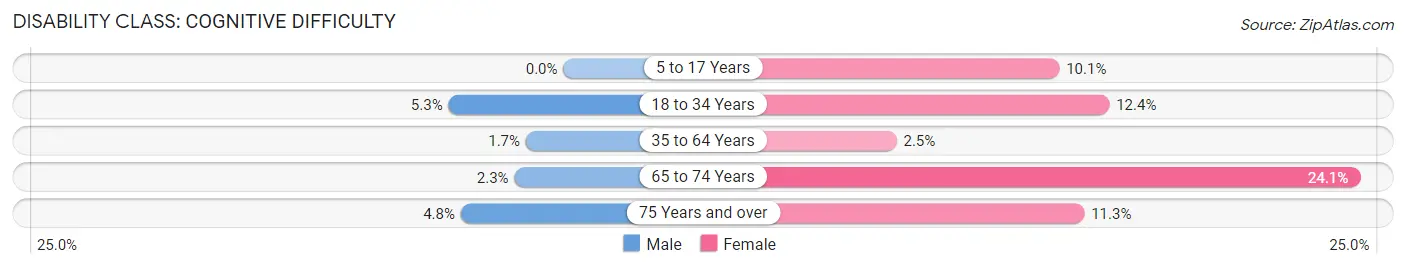
| Age Bracket | Male | Female |
| 5 to 17 Years | 0 (0.0%) | 11 (10.1%) |
| 18 to 34 Years | 8 (5.3%) | 18 (12.4%) |
| 35 to 64 Years | 5 (1.7%) | 7 (2.5%) |
| 65 to 74 Years | 2 (2.3%) | 19 (24.0%) |
| 75 Years and over | 3 (4.8%) | 9 (11.3%) |
Disability Class: Ambulatory Difficulty
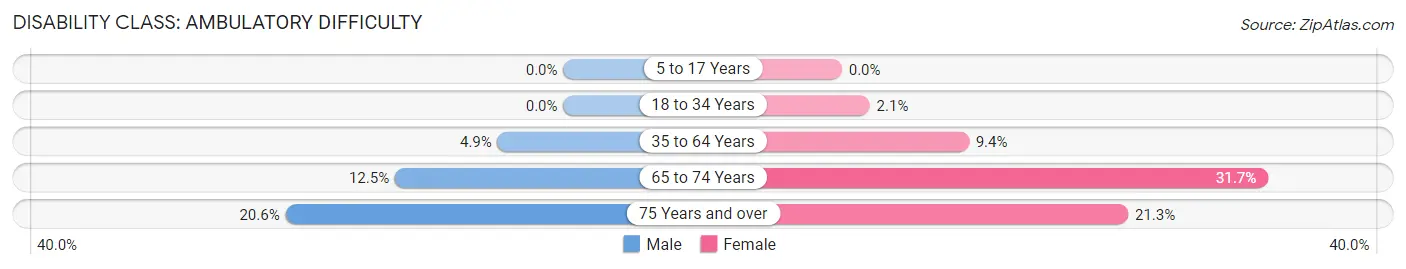
| Age Bracket | Male | Female |
| 5 to 17 Years | 0 (0.0%) | 0 (0.0%) |
| 18 to 34 Years | 0 (0.0%) | 3 (2.1%) |
| 35 to 64 Years | 14 (4.9%) | 26 (9.4%) |
| 65 to 74 Years | 11 (12.5%) | 25 (31.7%) |
| 75 Years and over | 13 (20.6%) | 17 (21.2%) |
Disability Class: Self-Care Difficulty
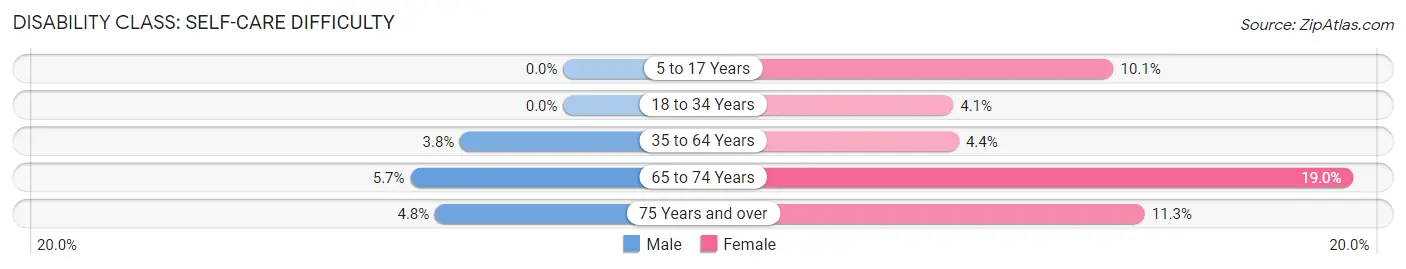
| Age Bracket | Male | Female |
| 5 to 17 Years | 0 (0.0%) | 11 (10.1%) |
| 18 to 34 Years | 0 (0.0%) | 6 (4.1%) |
| 35 to 64 Years | 11 (3.8%) | 12 (4.3%) |
| 65 to 74 Years | 5 (5.7%) | 15 (19.0%) |
| 75 Years and over | 3 (4.8%) | 9 (11.3%) |
Technology Access in Lanark
Computing Device Access in Lanark
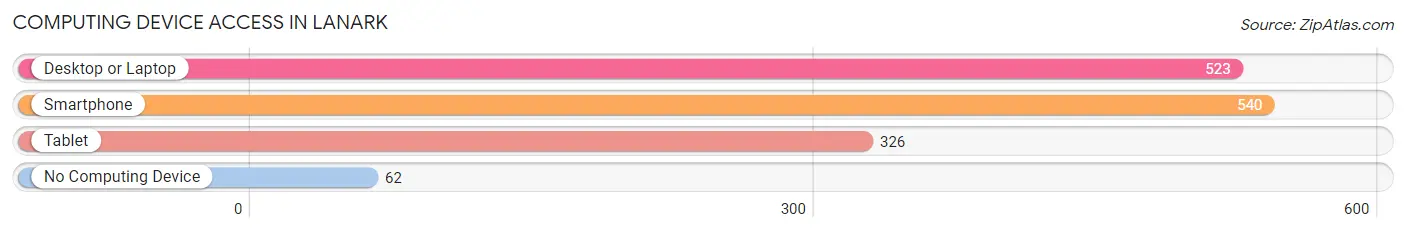
| Device Type | # Households | % Households |
| Desktop or Laptop | 523 | 80.2% |
| Smartphone | 540 | 82.8% |
| Tablet | 326 | 50.0% |
| No Computing Device | 62 | 9.5% |
| Total | 652 | 100.0% |
Internet Access in Lanark
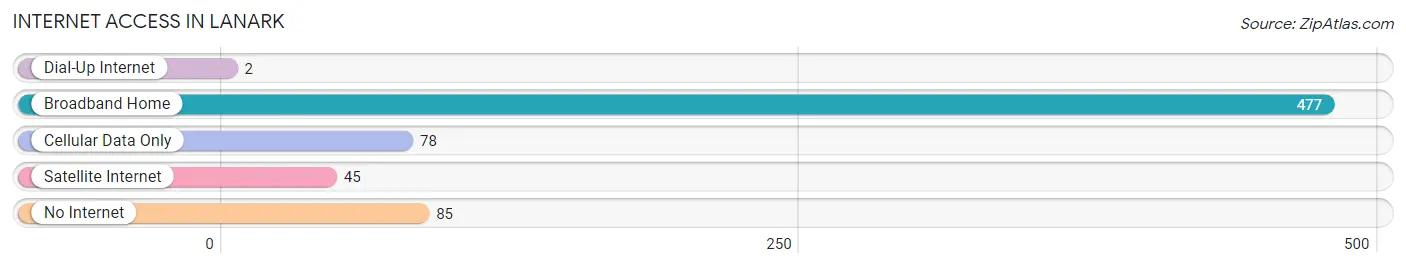
| Internet Type | # Households | % Households |
| Dial-Up Internet | 2 | 0.3% |
| Broadband Home | 477 | 73.2% |
| Cellular Data Only | 78 | 12.0% |
| Satellite Internet | 45 | 6.9% |
| No Internet | 85 | 13.0% |
| Total | 652 | 100.0% |
Lanark Summary
Lanark is a small city located in Carroll County, Illinois, United States. It is situated on the banks of the Mississippi River, approximately 40 miles west of Rockford. The population was 1,845 at the 2010 census.
History
Lanark was founded in 1837 by a group of settlers from Scotland. The town was named after the city of Lanark in Scotland. The first settlers were mostly farmers, and the town quickly grew to become a thriving agricultural center. The first post office was established in 1839, and the first school was built in 1841.
In 1845, the first railroad line was built through Lanark, connecting it to the larger cities of Chicago and St. Louis. This allowed for the growth of the town, and by the late 19th century, Lanark had become a major shipping center for the surrounding area.
In the early 20th century, Lanark began to decline as the railroad industry shifted away from the area. The population decreased, and the town became a quiet, rural community. In the late 20th century, Lanark began to experience a resurgence as a tourist destination. The town is now home to several antique shops, restaurants, and other attractions.
Geography
Lanark is located at 42°14'25" North, 89°59'45" West (42.240278, -89.995833). According to the 2010 census, the city has a total area of 1.2 square miles (3.1 km2), all land.
The city is situated on the banks of the Mississippi River, and is surrounded by rolling hills and farmland. The city is located approximately 40 miles west of Rockford, and is accessible via Interstate 88.
Economy
Lanark's economy is largely based on agriculture and tourism. The city is home to several antique shops, restaurants, and other attractions. The city is also home to several manufacturing companies, including a plastics factory and a metal fabrication plant.
Demographics
As of the 2010 census, there were 1,845 people, 745 households, and 486 families residing in the city. The population density was 1,539.2 people per square mile (593.3/km2). There were 817 housing units at an average density of 681.7 per square mile (263.3/km2). The racial makeup of the city was 97.2% White, 0.3% African American, 0.2% Native American, 0.2% Asian, 0.1% Pacific Islander, 0.7% from other races, and 1.3% from two or more races. Hispanic or Latino of any race were 2.2% of the population.
There were 745 households, out of which 30.2% had children under the age of 18 living with them, 48.2% were married couples living together, 11.7% had a female householder with no husband present, and 35.3% were non-families. 30.2% of all households were made up of individuals, and 14.2% had someone living alone who was 65 years of age or older. The average household size was 2.45 and the average family size was 3.04.
In the city, the population was spread out, with 25.7% under the age of 18, 8.2% from 18 to 24, 27.2% from 25 to 44, 22.2% from 45 to 64, and 16.7% who were 65 years of age or older. The median age was 37 years. For every 100 females, there were 93.2 males. For every 100 females age 18 and over, there were 88.3 males.
The median income for a household in the city was $37,500, and the median income for a family was $45,000. Males had a median income of $31,250 versus $21,250 for females. The per capita income for the city was $17,845. About 6.2% of families and 8.2% of the population were below the poverty line, including 10.2% of those under age 18 and 8.3% of those age 65 or over.
Common Questions
What is Per Capita Income in Lanark?
Per Capita income in Lanark is $32,643.
What is the Median Family Income in Lanark?
Median Family Income in Lanark is $93,194.
What is the Median Household income in Lanark?
Median Household Income in Lanark is $67,031.
What is Income or Wage Gap in Lanark?
Income or Wage Gap in Lanark is 39.5%.
Women in Lanark earn 60.5 cents for every dollar earned by a man.
What is Inequality or Gini Index in Lanark?
Inequality or Gini Index in Lanark is 0.39.
What is the Total Population of Lanark?
Total Population of Lanark is 1,553.
What is the Total Male Population of Lanark?
Total Male Population of Lanark is 819.
What is the Total Female Population of Lanark?
Total Female Population of Lanark is 734.
What is the Ratio of Males per 100 Females in Lanark?
There are 111.58 Males per 100 Females in Lanark.
What is the Ratio of Females per 100 Males in Lanark?
There are 89.62 Females per 100 Males in Lanark.
What is the Median Population Age in Lanark?
Median Population Age in Lanark is 38.7 Years.
What is the Average Family Size in Lanark
Average Family Size in Lanark is 2.8 People.
What is the Average Household Size in Lanark
Average Household Size in Lanark is 2.4 People.
How Large is the Labor Force in Lanark?
There are 832 People in the Labor Forcein in Lanark.
What is the Percentage of People in the Labor Force in Lanark?
69.3% of People are in the Labor Force in Lanark.
What is the Unemployment Rate in Lanark?
Unemployment Rate in Lanark is 4.0%.