Detroit, IL Map & Demographics
Detroit Map
Detroit Overview
$23,704
PER CAPITA INCOME
0.42
INEQUALITY / GINI INDEX
27
TOTAL POPULATION
18
MALE POPULATION
9
FEMALE POPULATION
200.00
MALES / 100 FEMALES
50.00
FEMALES / 100 MALES
57.4
MEDIAN AGE
2.6
AVG FAMILY SIZE
2.5
AVG HOUSEHOLD SIZE
13
LABOR FORCE [ PEOPLE ]
48.1%
PERCENT IN LABOR FORCE
Detroit Area Codes
Income in Detroit
Income Overview in Detroit
| Characteristic | Number | Measure |
| Per Capita Income | 27 | $23,704 |
| Median Family Income | 10 | $0 |
| Mean Family Income | 10 | $46,430 |
| Median Household Income | 11 | $0 |
| Mean Household Income | 11 | $46,709 |
| Income Deficit | 10 | $0 |
| Wage / Income Gap (%) | 27 | 0.00% |
| Wage / Income Gap ($) | 27 | 100.00¢ per $1 |
| Gini / Inequality Index | 27 | 0.42 |
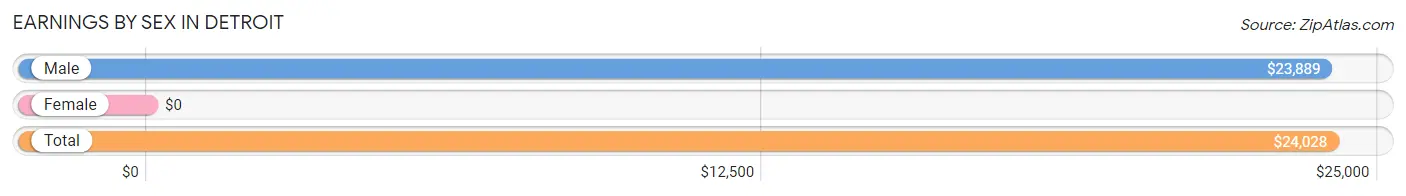
Earnings by Sex in Detroit
| Sex | Number | Average Earnings |
| Male | 12 (92.3%) | $23,889 |
| Female | 1 (7.7%) | $0 |
| Total | 13 (100.0%) | $24,028 |
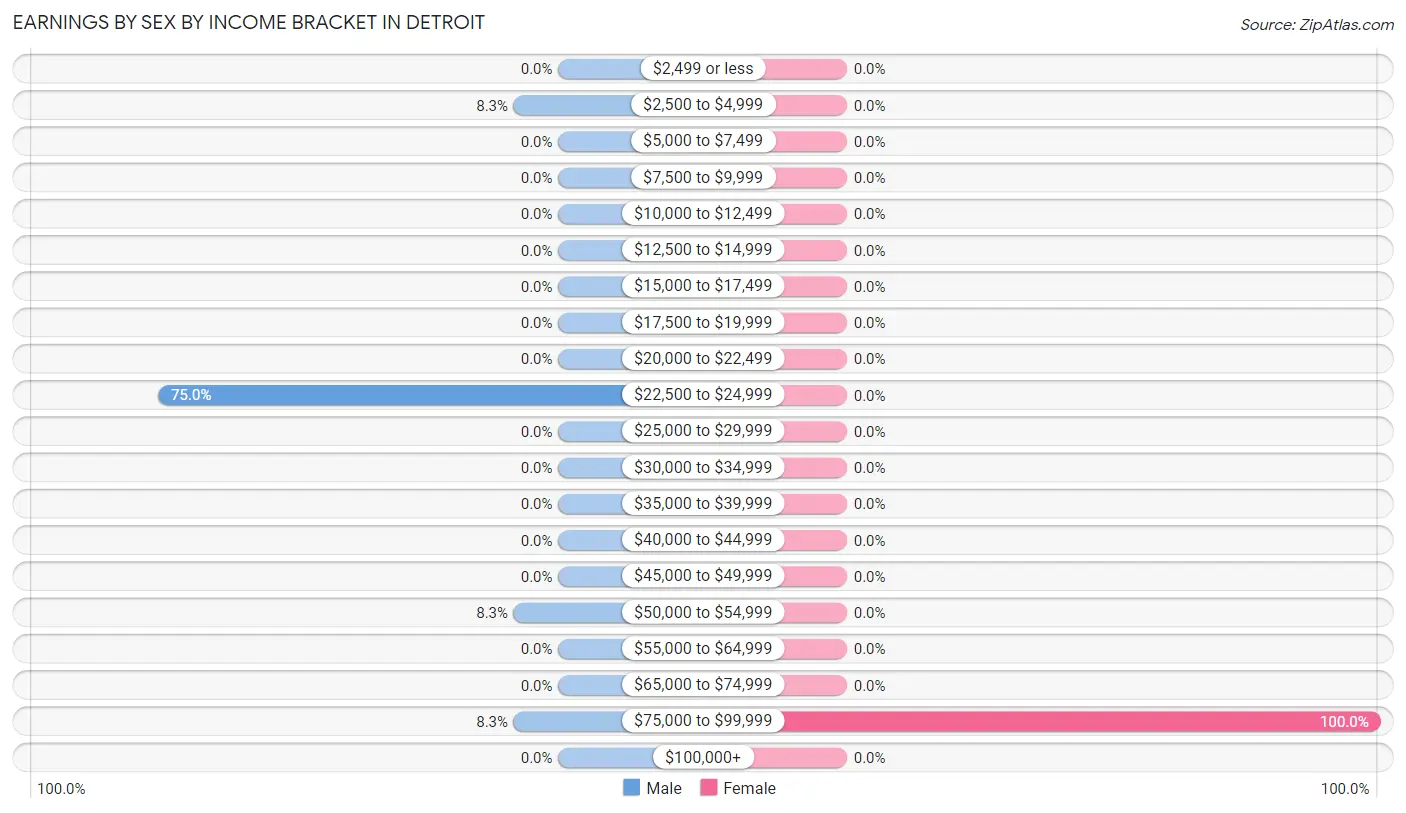
Earnings by Sex by Income Bracket in Detroit
The most common earnings brackets in Detroit are $22,500 to $24,999 for men (9 | 75.0%) and $75,000 to $99,999 for women (1 | 100.0%).
| Income | Male | Female |
| $2,499 or less | 0 (0.0%) | 0 (0.0%) |
| $2,500 to $4,999 | 1 (8.3%) | 0 (0.0%) |
| $5,000 to $7,499 | 0 (0.0%) | 0 (0.0%) |
| $7,500 to $9,999 | 0 (0.0%) | 0 (0.0%) |
| $10,000 to $12,499 | 0 (0.0%) | 0 (0.0%) |
| $12,500 to $14,999 | 0 (0.0%) | 0 (0.0%) |
| $15,000 to $17,499 | 0 (0.0%) | 0 (0.0%) |
| $17,500 to $19,999 | 0 (0.0%) | 0 (0.0%) |
| $20,000 to $22,499 | 0 (0.0%) | 0 (0.0%) |
| $22,500 to $24,999 | 9 (75.0%) | 0 (0.0%) |
| $25,000 to $29,999 | 0 (0.0%) | 0 (0.0%) |
| $30,000 to $34,999 | 0 (0.0%) | 0 (0.0%) |
| $35,000 to $39,999 | 0 (0.0%) | 0 (0.0%) |
| $40,000 to $44,999 | 0 (0.0%) | 0 (0.0%) |
| $45,000 to $49,999 | 0 (0.0%) | 0 (0.0%) |
| $50,000 to $54,999 | 1 (8.3%) | 0 (0.0%) |
| $55,000 to $64,999 | 0 (0.0%) | 0 (0.0%) |
| $65,000 to $74,999 | 0 (0.0%) | 0 (0.0%) |
| $75,000 to $99,999 | 1 (8.3%) | 1 (100.0%) |
| $100,000+ | 0 (0.0%) | 0 (0.0%) |
| Total | 12 (100.0%) | 1 (100.0%) |
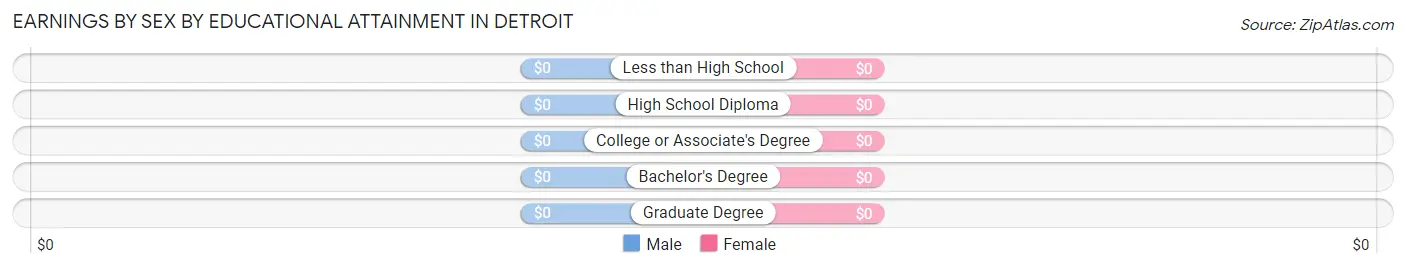
Earnings by Sex by Educational Attainment in Detroit
| Educational Attainment | Male Income | Female Income |
| Less than High School | - | - |
| High School Diploma | - | - |
| College or Associate's Degree | - | - |
| Bachelor's Degree | - | - |
| Graduate Degree | - | - |
| Total | $23,889 | $0 |
Family Income in Detroit
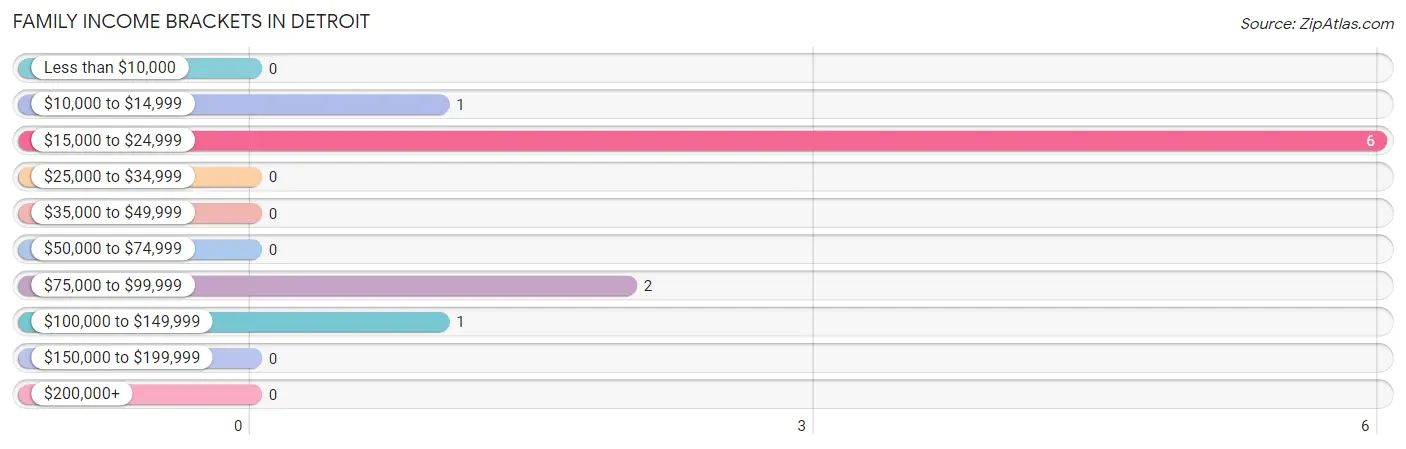
Family Income Brackets in Detroit
According to the Detroit family income data, there are 6 families falling into the $15,000 to $24,999 income range, which is the most common income bracket and makes up 60.0% of all families.
| Income Bracket | # Families | % Families |
| Less than $10,000 | 0 | 0.0% |
| $10,000 to $14,999 | 1 | 10.0% |
| $15,000 to $24,999 | 6 | 60.0% |
| $25,000 to $34,999 | 0 | 0.0% |
| $35,000 to $49,999 | 0 | 0.0% |
| $50,000 to $74,999 | 0 | 0.0% |
| $75,000 to $99,999 | 2 | 20.0% |
| $100,000 to $149,999 | 1 | 10.0% |
| $150,000 to $199,999 | 0 | 0.0% |
| $200,000+ | 0 | 0.0% |
Family Income by Famaliy Size in Detroit
| Income Bracket | # Families | Median Income |
| 2-Person Families | 10 (100.0%) | $0 |
| 3-Person Families | 0 (0.0%) | $0 |
| 4-Person Families | 0 (0.0%) | $0 |
| 5-Person Families | 0 (0.0%) | $0 |
| 6-Person Families | 0 (0.0%) | $0 |
| 7+ Person Families | 0 (0.0%) | $0 |
| Total | 10 (100.0%) | $0 |
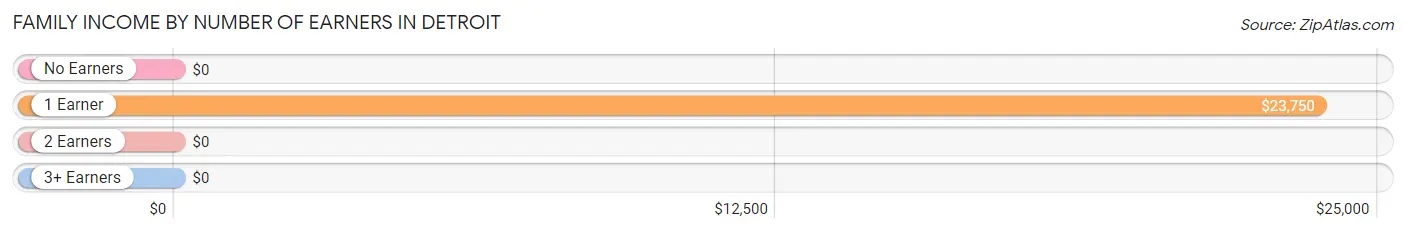
Family Income by Number of Earners in Detroit
| Number of Earners | # Families | Median Income |
| No Earners | 2 (20.0%) | $0 |
| 1 Earner | 7 (70.0%) | $23,750 |
| 2 Earners | 1 (10.0%) | $0 |
| 3+ Earners | 0 (0.0%) | $0 |
| Total | 10 (100.0%) | $0 |
Household Income in Detroit
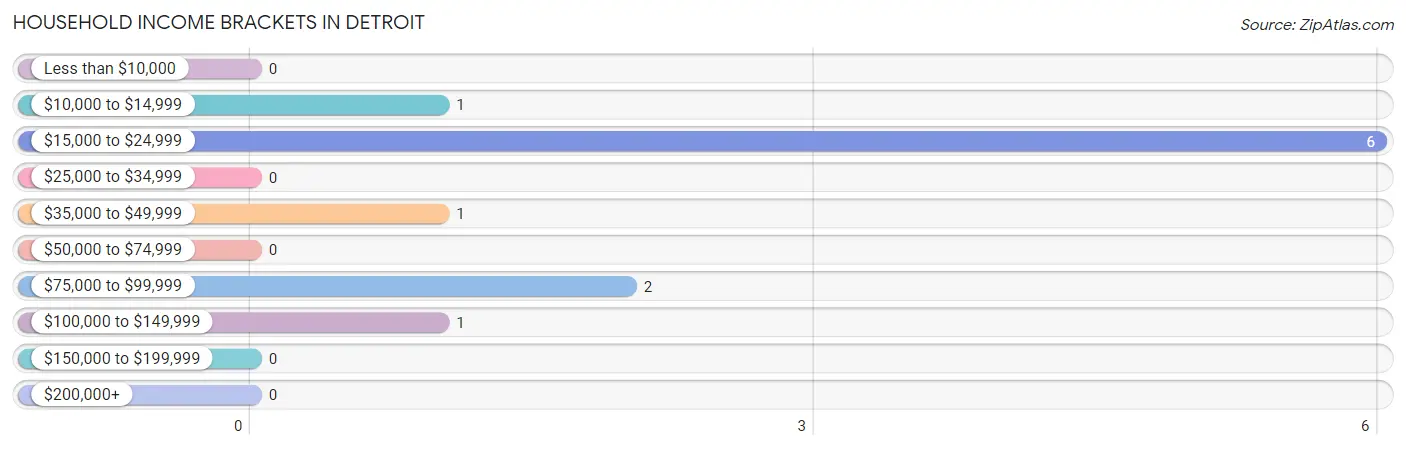
Household Income Brackets in Detroit
With 6 households falling in the category, the $15,000 to $24,999 income range is the most frequent in Detroit, accounting for 54.5% of all households.
| Income Bracket | # Households | % Households |
| Less than $10,000 | 0 | 0.0% |
| $10,000 to $14,999 | 1 | 9.1% |
| $15,000 to $24,999 | 6 | 54.5% |
| $25,000 to $34,999 | 0 | 0.0% |
| $35,000 to $49,999 | 1 | 9.1% |
| $50,000 to $74,999 | 0 | 0.0% |
| $75,000 to $99,999 | 2 | 18.2% |
| $100,000 to $149,999 | 1 | 9.1% |
| $150,000 to $199,999 | 0 | 0.0% |
| $200,000+ | 0 | 0.0% |
Household Income by Householder Age in Detroit
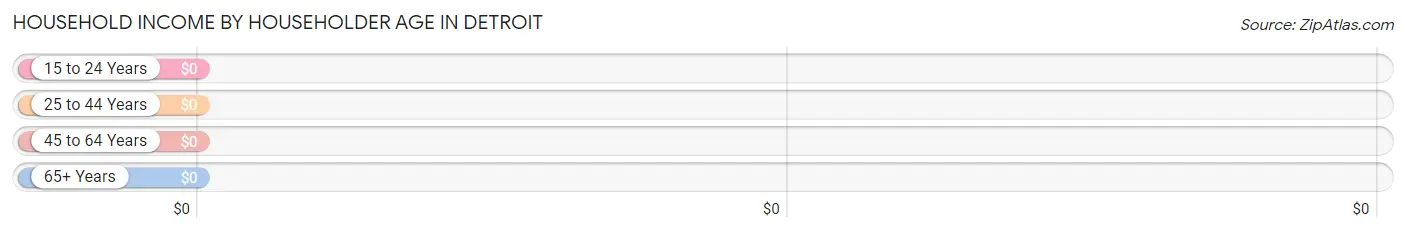
| Income Bracket | # Households | Median Income |
| 15 to 24 Years | 0 (0.0%) | $0 |
| 25 to 44 Years | 1 (9.1%) | $0 |
| 45 to 64 Years | 7 (63.6%) | $0 |
| 65+ Years | 3 (27.3%) | $0 |
| Total | 11 (100.0%) | $0 |
Poverty in Detroit
Income Below Poverty by Sex and Age in Detroit
With 27.8% poverty level for males and 11.1% for females among the residents of Detroit, 25 to 34 year old males and 65 to 74 year old females are the most vulnerable to poverty, with 4 males (100.0%) and 1 females (50.0%) in their respective age groups living below the poverty level.
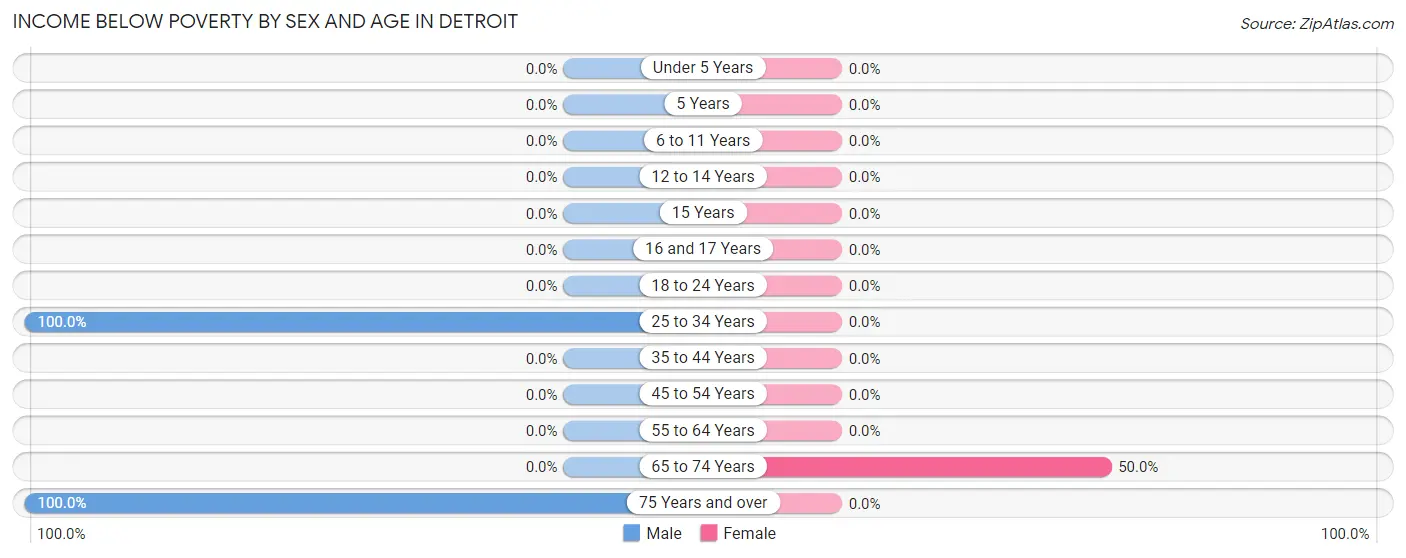
| Age Bracket | Male | Female |
| Under 5 Years | 0 (0.0%) | 0 (0.0%) |
| 5 Years | 0 (0.0%) | 0 (0.0%) |
| 6 to 11 Years | 0 (0.0%) | 0 (0.0%) |
| 12 to 14 Years | 0 (0.0%) | 0 (0.0%) |
| 15 Years | 0 (0.0%) | 0 (0.0%) |
| 16 and 17 Years | 0 (0.0%) | 0 (0.0%) |
| 18 to 24 Years | 0 (0.0%) | 0 (0.0%) |
| 25 to 34 Years | 4 (100.0%) | 0 (0.0%) |
| 35 to 44 Years | 0 (0.0%) | 0 (0.0%) |
| 45 to 54 Years | 0 (0.0%) | 0 (0.0%) |
| 55 to 64 Years | 0 (0.0%) | 0 (0.0%) |
| 65 to 74 Years | 0 (0.0%) | 1 (50.0%) |
| 75 Years and over | 1 (100.0%) | 0 (0.0%) |
| Total | 5 (27.8%) | 1 (11.1%) |
Income Above Poverty by Sex and Age in Detroit
According to the poverty statistics in Detroit, males aged 55 to 64 years and females aged 45 to 54 years are the age groups that are most secure financially, with 100.0% of males and 100.0% of females in these age groups living above the poverty line.
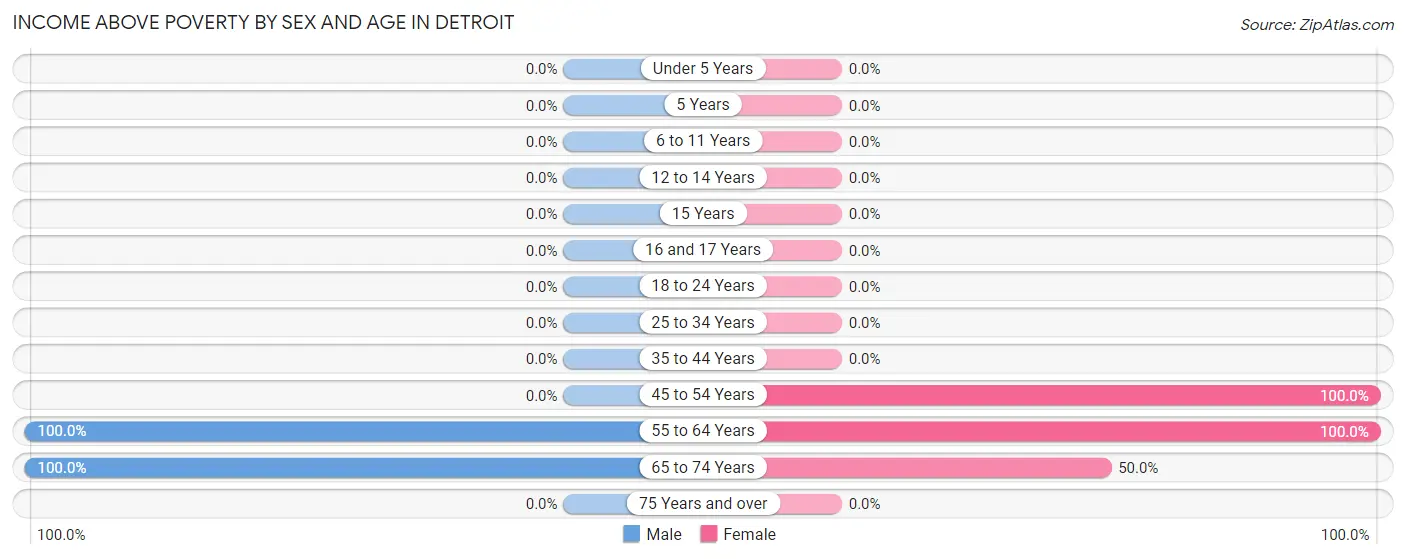
| Age Bracket | Male | Female |
| Under 5 Years | 0 (0.0%) | 0 (0.0%) |
| 5 Years | 0 (0.0%) | 0 (0.0%) |
| 6 to 11 Years | 0 (0.0%) | 0 (0.0%) |
| 12 to 14 Years | 0 (0.0%) | 0 (0.0%) |
| 15 Years | 0 (0.0%) | 0 (0.0%) |
| 16 and 17 Years | 0 (0.0%) | 0 (0.0%) |
| 18 to 24 Years | 0 (0.0%) | 0 (0.0%) |
| 25 to 34 Years | 0 (0.0%) | 0 (0.0%) |
| 35 to 44 Years | 0 (0.0%) | 0 (0.0%) |
| 45 to 54 Years | 0 (0.0%) | 5 (100.0%) |
| 55 to 64 Years | 11 (100.0%) | 2 (100.0%) |
| 65 to 74 Years | 2 (100.0%) | 1 (50.0%) |
| 75 Years and over | 0 (0.0%) | 0 (0.0%) |
| Total | 13 (72.2%) | 8 (88.9%) |
Income Below Poverty Among Married-Couple Families in Detroit
The poverty statistics for married-couple families in Detroit show that 11.1% or 1 of the total 9 families live below the poverty line. Families with no children have the highest poverty rate of 11.1%, comprising of 1 families. On the other hand, families with no children have the lowest poverty rate of 11.1%, which includes 1 families.
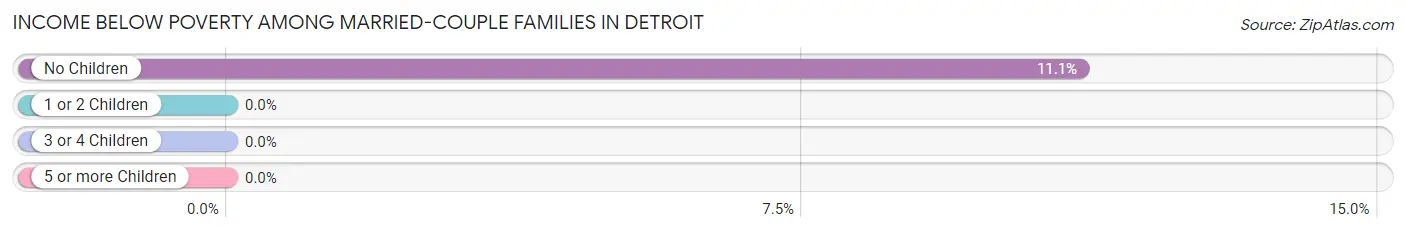
| Children | Above Poverty | Below Poverty |
| No Children | 8 (88.9%) | 1 (11.1%) |
| 1 or 2 Children | 0 (0.0%) | 0 (0.0%) |
| 3 or 4 Children | 0 (0.0%) | 0 (0.0%) |
| 5 or more Children | 0 (0.0%) | 0 (0.0%) |
| Total | 8 (88.9%) | 1 (11.1%) |
Income Below Poverty Among Single-Parent Households in Detroit
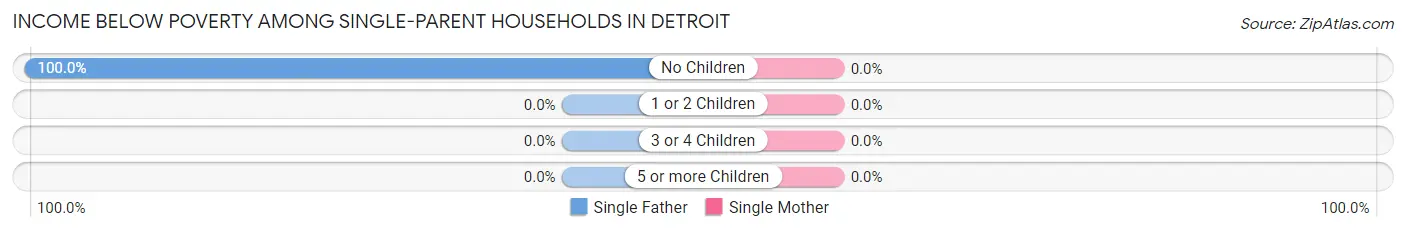
| Children | Single Father | Single Mother |
| No Children | 1 (100.0%) | 0 (0.0%) |
| 1 or 2 Children | 0 (0.0%) | 0 (0.0%) |
| 3 or 4 Children | 0 (0.0%) | 0 (0.0%) |
| 5 or more Children | 0 (0.0%) | 0 (0.0%) |
| Total | 1 (100.0%) | 0 (0.0%) |
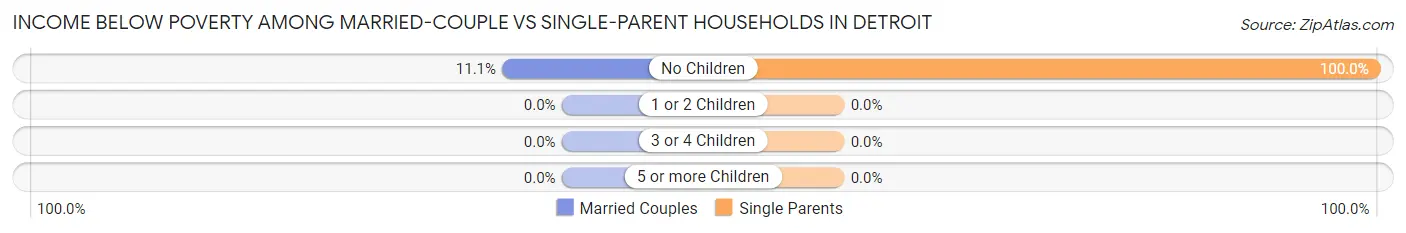
Income Below Poverty Among Married-Couple vs Single-Parent Households in Detroit
The poverty data for Detroit shows that 1 of the married-couple family households (11.1%) and 1 of the single-parent households (100.0%) are living below the poverty level. Within the married-couple family households, those with no children have the highest poverty rate, with 1 households (11.1%) falling below the poverty line. Among the single-parent households, those with no children have the highest poverty rate, with 1 household (100.0%) living below poverty.
| Children | Married-Couple Families | Single-Parent Households |
| No Children | 1 (11.1%) | 1 (100.0%) |
| 1 or 2 Children | 0 (0.0%) | 0 (0.0%) |
| 3 or 4 Children | 0 (0.0%) | 0 (0.0%) |
| 5 or more Children | 0 (0.0%) | 0 (0.0%) |
| Total | 1 (11.1%) | 1 (100.0%) |
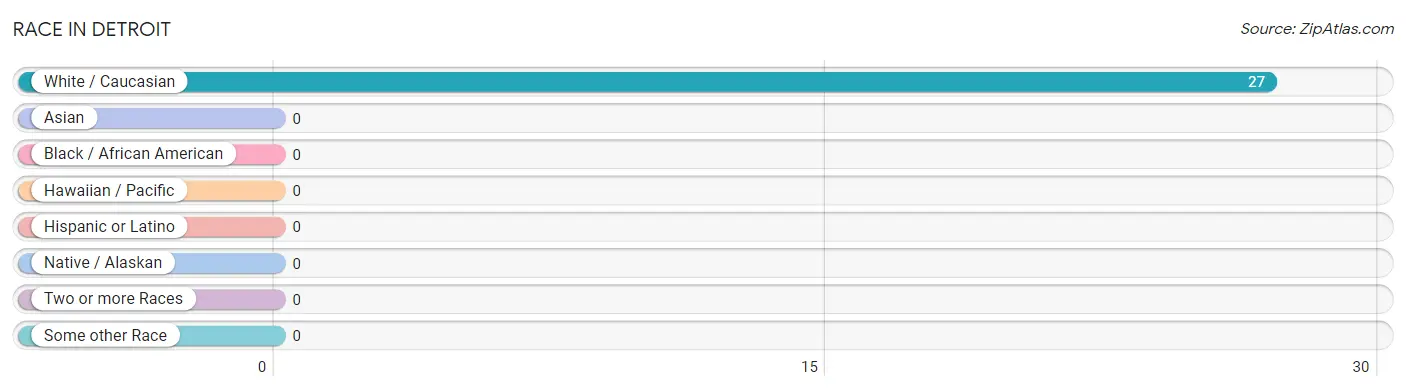
Race in Detroit
The most populous races in Detroit are , and White / Caucasian (27 | 100.0%).
| Race | # Population | % Population |
| Asian | 0 | 0.0% |
| Black / African American | 0 | 0.0% |
| Hawaiian / Pacific | 0 | 0.0% |
| Hispanic or Latino | 0 | 0.0% |
| Native / Alaskan | 0 | 0.0% |
| White / Caucasian | 27 | 100.0% |
| Two or more Races | 0 | 0.0% |
| Some other Race | 0 | 0.0% |
| Total | 27 | 100.0% |
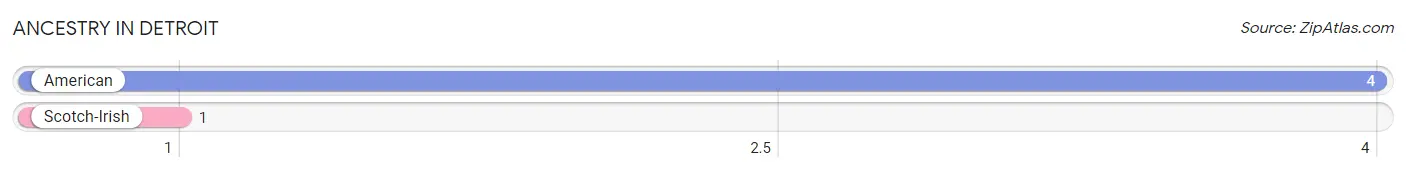
Ancestry in Detroit
The most populous ancestries reported in Detroit are American (4 | 14.8%), and Scotch-Irish (1 | 3.7%), together accounting for 18.5% of all Detroit residents.
| Ancestry | # Population | % Population |
| American | 4 | 14.8% |
| Scotch-Irish | 1 | 3.7% | View All 2 Rows |
Immigrants in Detroit

| Immigration Origin | # Population | % Population | View All 0 Rows |
Sex and Age in Detroit
Sex and Age in Detroit
The most populous age groups in Detroit are 55 to 59 Years (10 | 55.6%) for men and 50 to 54 Years (5 | 55.6%) for women.
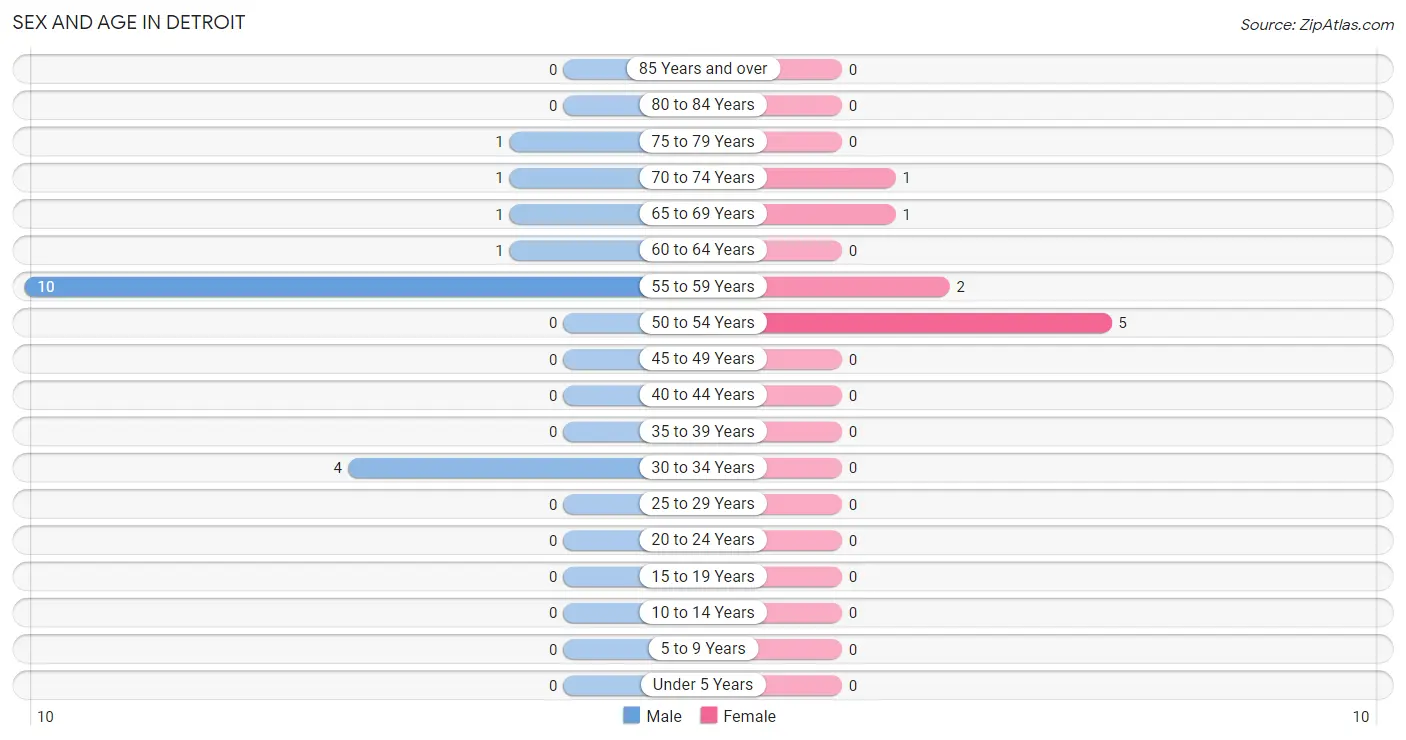
| Age Bracket | Male | Female |
| Under 5 Years | 0 (0.0%) | 0 (0.0%) |
| 5 to 9 Years | 0 (0.0%) | 0 (0.0%) |
| 10 to 14 Years | 0 (0.0%) | 0 (0.0%) |
| 15 to 19 Years | 0 (0.0%) | 0 (0.0%) |
| 20 to 24 Years | 0 (0.0%) | 0 (0.0%) |
| 25 to 29 Years | 0 (0.0%) | 0 (0.0%) |
| 30 to 34 Years | 4 (22.2%) | 0 (0.0%) |
| 35 to 39 Years | 0 (0.0%) | 0 (0.0%) |
| 40 to 44 Years | 0 (0.0%) | 0 (0.0%) |
| 45 to 49 Years | 0 (0.0%) | 0 (0.0%) |
| 50 to 54 Years | 0 (0.0%) | 5 (55.6%) |
| 55 to 59 Years | 10 (55.6%) | 2 (22.2%) |
| 60 to 64 Years | 1 (5.6%) | 0 (0.0%) |
| 65 to 69 Years | 1 (5.6%) | 1 (11.1%) |
| 70 to 74 Years | 1 (5.6%) | 1 (11.1%) |
| 75 to 79 Years | 1 (5.6%) | 0 (0.0%) |
| 80 to 84 Years | 0 (0.0%) | 0 (0.0%) |
| 85 Years and over | 0 (0.0%) | 0 (0.0%) |
| Total | 18 (100.0%) | 9 (100.0%) |
Families and Households in Detroit
Median Family Size in Detroit
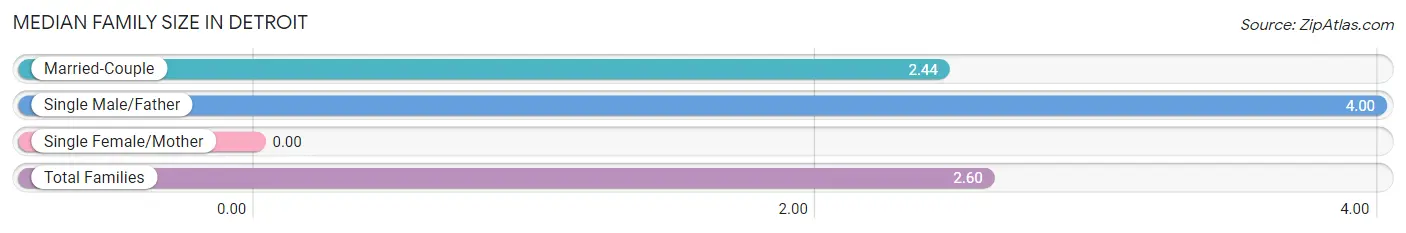
| Family Type | # Families | Family Size |
| Married-Couple | 9 (90.0%) | 2.44 |
| Single Male/Father | 1 (10.0%) | 4.00 |
| Single Female/Mother | 0 (0.0%) | - |
| Total Families | 10 (100.0%) | 2.60 |
Median Household Size in Detroit
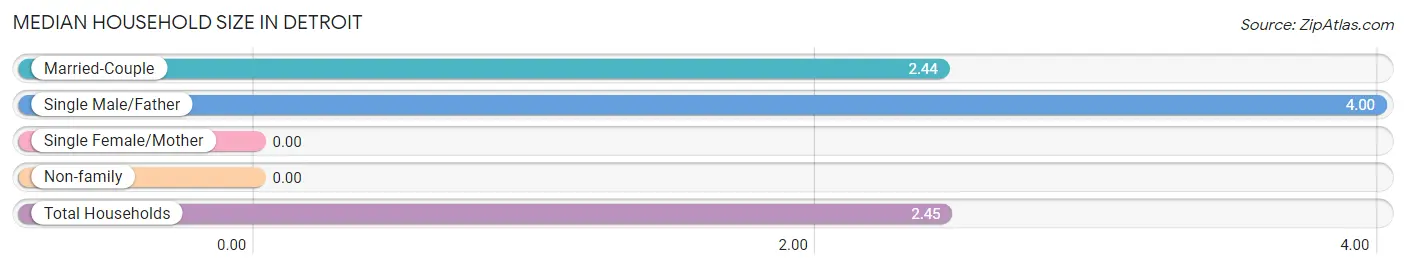
| Household Type | # Households | Household Size |
| Married-Couple | 9 (81.8%) | 2.44 |
| Single Male/Father | 1 (9.1%) | 4.00 |
| Single Female/Mother | 0 (0.0%) | - |
| Non-family | 1 (9.1%) | - |
| Total Households | 11 (100.0%) | 2.45 |
Household Size by Marriage Status in Detroit
Out of a total of 11 households in Detroit, 10 (90.9%) are family households, while 1 (9.1%) are nonfamily households. The most numerous type of family households are 2-person households, comprising 10, and the most common type of nonfamily households are 1-person households, comprising 1.
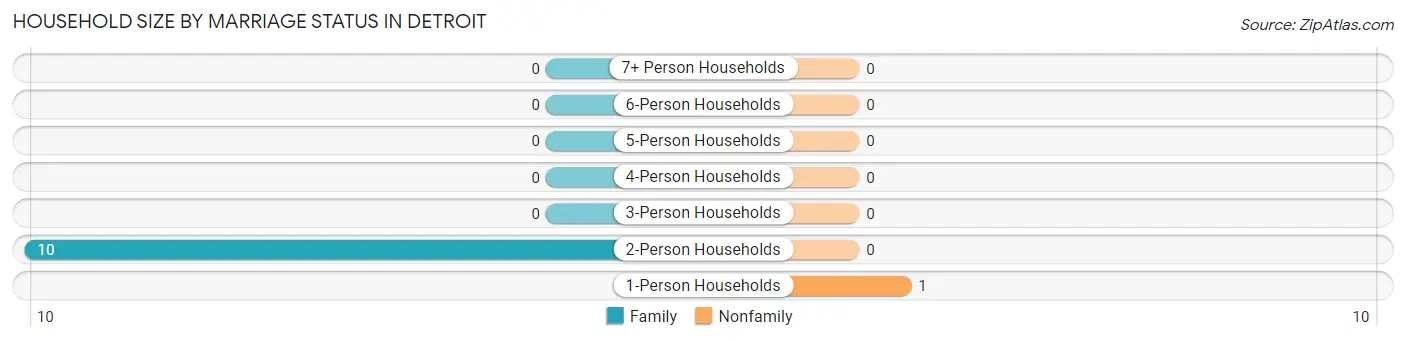
| Household Size | Family Households | Nonfamily Households |
| 1-Person Households | - | 1 (9.1%) |
| 2-Person Households | 10 (90.9%) | 0 (0.0%) |
| 3-Person Households | 0 (0.0%) | 0 (0.0%) |
| 4-Person Households | 0 (0.0%) | 0 (0.0%) |
| 5-Person Households | 0 (0.0%) | 0 (0.0%) |
| 6-Person Households | 0 (0.0%) | 0 (0.0%) |
| 7+ Person Households | 0 (0.0%) | 0 (0.0%) |
| Total | 10 (90.9%) | 1 (9.1%) |
Female Fertility in Detroit
Fertility by Age in Detroit
| Age Bracket | Women with Births | Births / 1,000 Women |
| 15 to 19 years | 0 (0.0%) | 0.0 |
| 20 to 34 years | 0 (0.0%) | 0.0 |
| 35 to 50 years | 0 (0.0%) | 0.0 |
| Total | 0 (0.0%) | 0.0 |
Fertility by Age by Marriage Status in Detroit
| Age Bracket | Married | Unmarried |
| 15 to 19 years | 0 (0.0%) | 0 (0.0%) |
| 20 to 34 years | 0 (0.0%) | 0 (0.0%) |
| 35 to 50 years | 0 (0.0%) | 0 (0.0%) |
| Total | 0 (0.0%) | 0 (0.0%) |
Fertility by Education in Detroit
| Educational Attainment | Women with Births | Births / 1,000 Women |
| Less than High School | 0 (0.0%) | 0.0 |
| High School Diploma | 0 (0.0%) | 0.0 |
| College or Associate's Degree | 0 (0.0%) | 0.0 |
| Bachelor's Degree | 0 (0.0%) | 0.0 |
| Graduate Degree | 0 (0.0%) | 0.0 |
| Total | 0 (0.0%) | 0.0 |
Fertility by Education by Marriage Status in Detroit
| Educational Attainment | Married | Unmarried |
| Less than High School | 0 (0.0%) | 0 (0.0%) |
| High School Diploma | 0 (0.0%) | 0 (0.0%) |
| College or Associate's Degree | 0 (0.0%) | 0 (0.0%) |
| Bachelor's Degree | 0 (0.0%) | 0 (0.0%) |
| Graduate Degree | 0 (0.0%) | 0 (0.0%) |
| Total | 0 (0.0%) | 0 (0.0%) |
Employment Characteristics in Detroit
Employment by Class of Employer in Detroit
Among the 13 employed individuals in Detroit, self-employed (not incorporated) (10 | 76.9%), private company employees (2 | 15.4%), and state government employees (1 | 7.7%) make up the most common classes of employment.
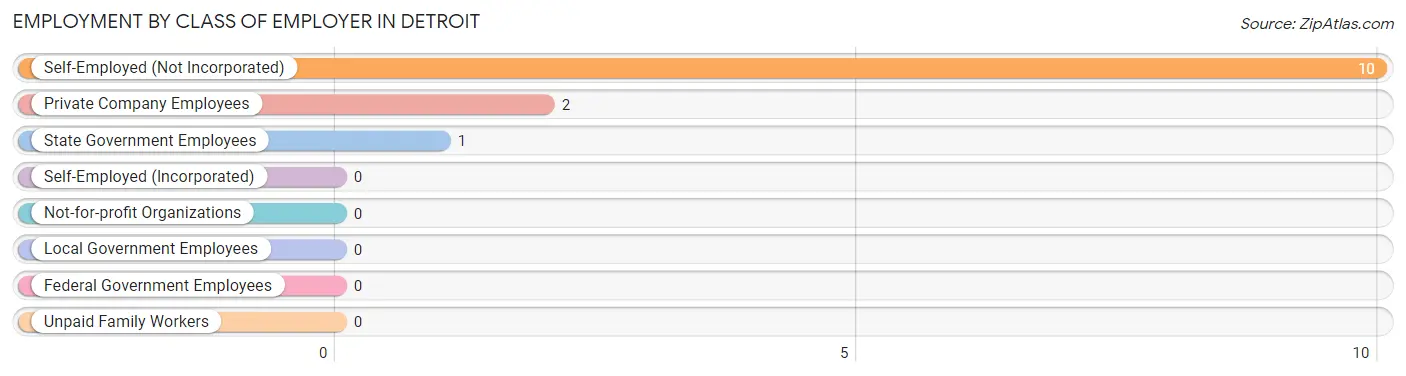
| Employer Class | # Employees | % Employees |
| Private Company Employees | 2 | 15.4% |
| Self-Employed (Incorporated) | 0 | 0.0% |
| Self-Employed (Not Incorporated) | 10 | 76.9% |
| Not-for-profit Organizations | 0 | 0.0% |
| Local Government Employees | 0 | 0.0% |
| State Government Employees | 1 | 7.7% |
| Federal Government Employees | 0 | 0.0% |
| Unpaid Family Workers | 0 | 0.0% |
| Total | 13 | 100.0% |
Employment Status by Age in Detroit
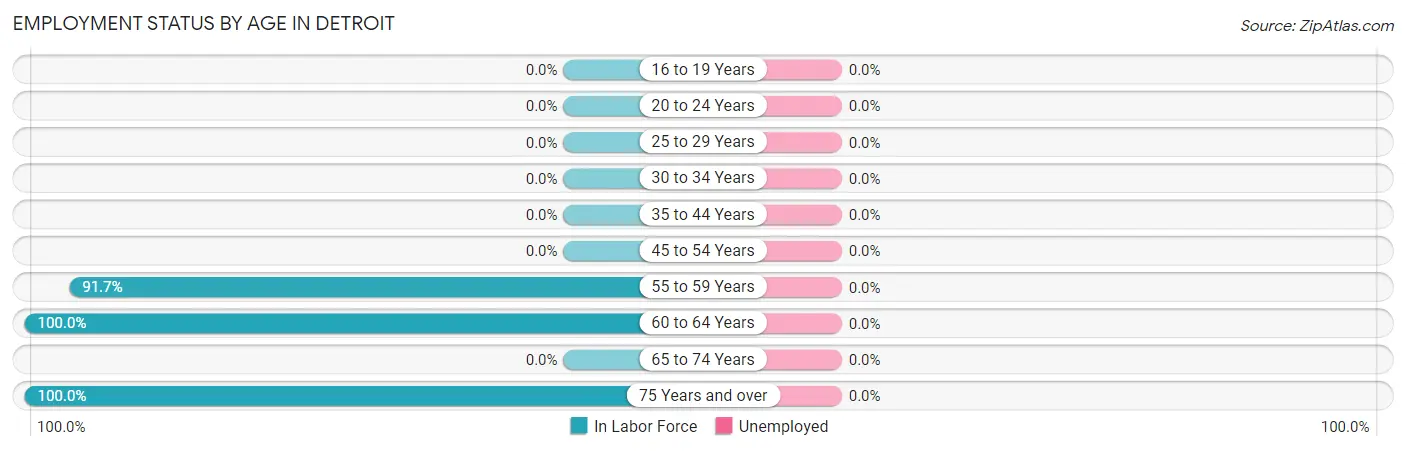
| Age Bracket | In Labor Force | Unemployed |
| 16 to 19 Years | 0 (0.0%) | 0 (0.0%) |
| 20 to 24 Years | 0 (0.0%) | 0 (0.0%) |
| 25 to 29 Years | 0 (0.0%) | 0 (0.0%) |
| 30 to 34 Years | 0 (0.0%) | 0 (0.0%) |
| 35 to 44 Years | 0 (0.0%) | 0 (0.0%) |
| 45 to 54 Years | 0 (0.0%) | 0 (0.0%) |
| 55 to 59 Years | 11 (91.7%) | 0 (0.0%) |
| 60 to 64 Years | 1 (100.0%) | 0 (0.0%) |
| 65 to 74 Years | 0 (0.0%) | 0 (0.0%) |
| 75 Years and over | 1 (100.0%) | 0 (0.0%) |
| Total | 13 (48.1%) | 0 (0.0%) |
Employment Status by Educational Attainment in Detroit
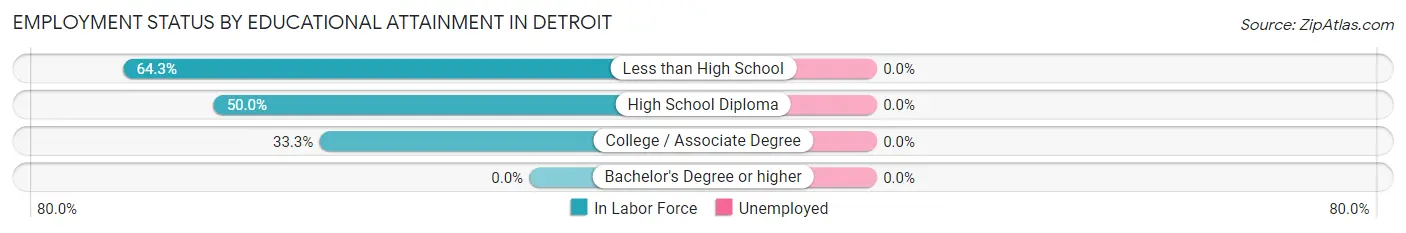
| Educational Attainment | In Labor Force | Unemployed |
| Less than High School | 9 (64.3%) | 0 (0.0%) |
| High School Diploma | 1 (50.0%) | 0 (0.0%) |
| College / Associate Degree | 2 (33.3%) | 0 (0.0%) |
| Bachelor's Degree or higher | 0 (0.0%) | 0 (0.0%) |
| Total | 12 (54.5%) | 0 (0.0%) |
Employment Occupations by Sex in Detroit
Management, Business, Science and Arts Occupations
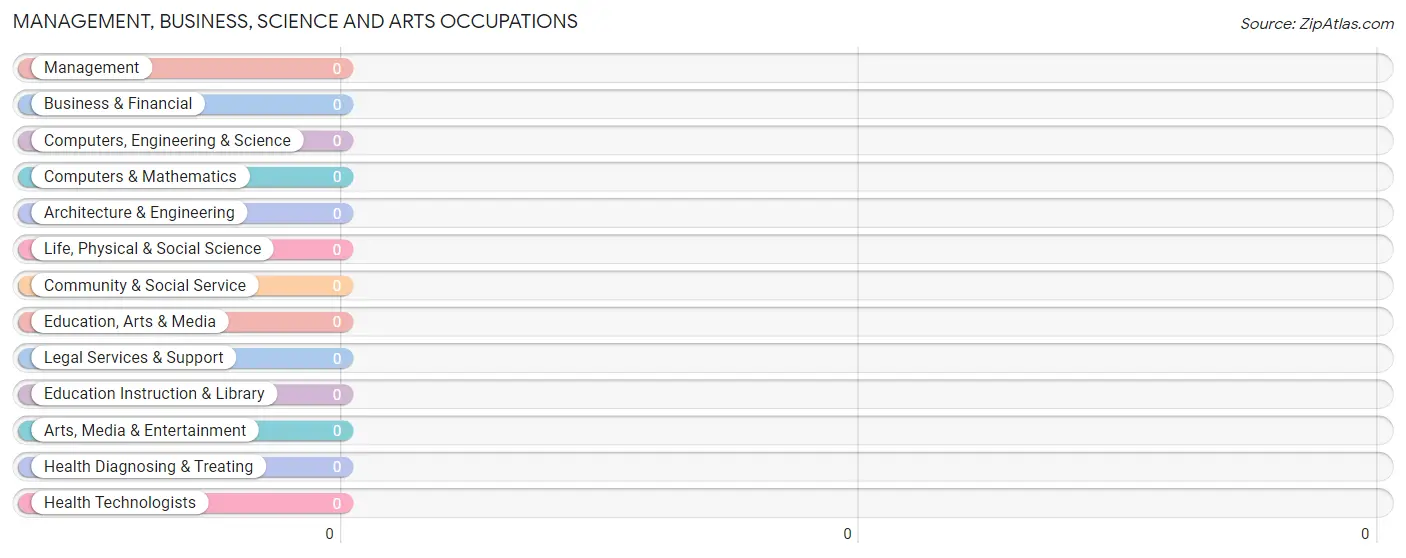
Management, Business, Science and Arts Occupations by Sex
| Occupation | Male | Female |
| Management | 0 (0.0%) | 0 (0.0%) |
| Business & Financial | 0 (0.0%) | 0 (0.0%) |
| Computers, Engineering & Science | 0 (0.0%) | 0 (0.0%) |
| Computers & Mathematics | 0 (0.0%) | 0 (0.0%) |
| Architecture & Engineering | 0 (0.0%) | 0 (0.0%) |
| Life, Physical & Social Science | 0 (0.0%) | 0 (0.0%) |
| Community & Social Service | 0 (0.0%) | 0 (0.0%) |
| Education, Arts & Media | 0 (0.0%) | 0 (0.0%) |
| Legal Services & Support | 0 (0.0%) | 0 (0.0%) |
| Education Instruction & Library | 0 (0.0%) | 0 (0.0%) |
| Arts, Media & Entertainment | 0 (0.0%) | 0 (0.0%) |
| Health Diagnosing & Treating | 0 (0.0%) | 0 (0.0%) |
| Health Technologists | 0 (0.0%) | 0 (0.0%) |
| Total (Category) | 0 (0.0%) | 0 (0.0%) |
| Total (Overall) | 12 (92.3%) | 1 (7.7%) |
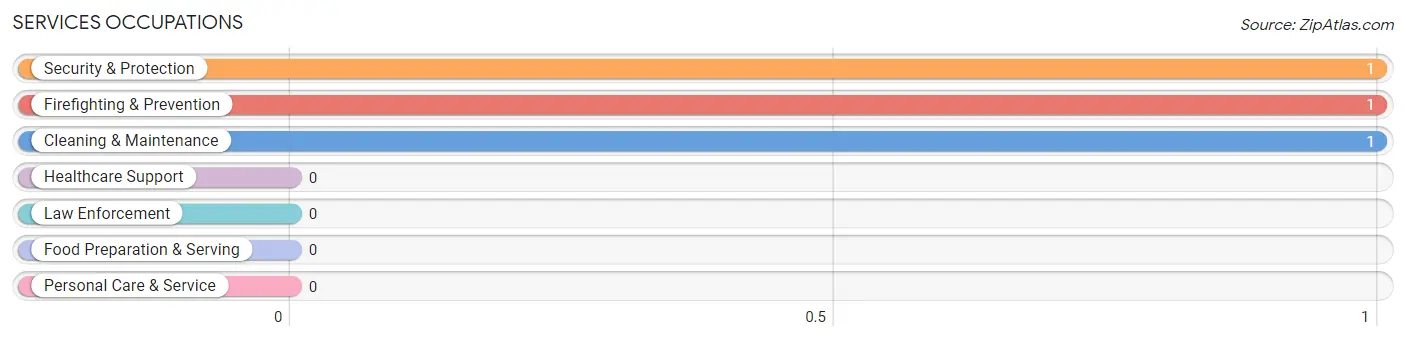
Services Occupations
The most common Services occupations in Detroit are Security & Protection (1 | 7.7%), Firefighting & Prevention (1 | 7.7%), and Cleaning & Maintenance (1 | 7.7%).
Services Occupations by Sex
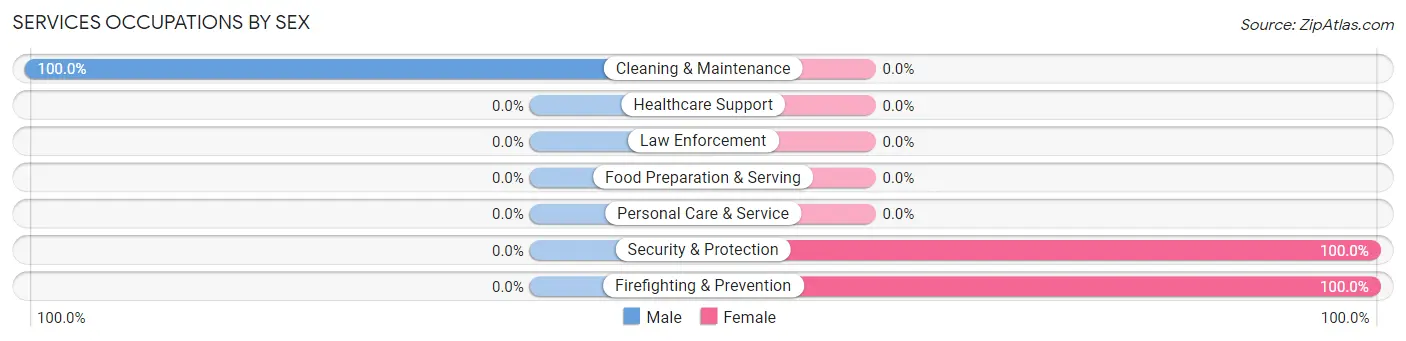
| Occupation | Male | Female |
| Healthcare Support | 0 (0.0%) | 0 (0.0%) |
| Security & Protection | 0 (0.0%) | 1 (100.0%) |
| Firefighting & Prevention | 0 (0.0%) | 1 (100.0%) |
| Law Enforcement | 0 (0.0%) | 0 (0.0%) |
| Food Preparation & Serving | 0 (0.0%) | 0 (0.0%) |
| Cleaning & Maintenance | 1 (100.0%) | 0 (0.0%) |
| Personal Care & Service | 0 (0.0%) | 0 (0.0%) |
| Total (Category) | 1 (50.0%) | 1 (50.0%) |
| Total (Overall) | 12 (92.3%) | 1 (7.7%) |
Sales and Office Occupations

Sales and Office Occupations by Sex

| Occupation | Male | Female |
| Sales & Related | 0 (0.0%) | 0 (0.0%) |
| Office & Administration | 0 (0.0%) | 0 (0.0%) |
| Total (Category) | 0 (0.0%) | 0 (0.0%) |
| Total (Overall) | 12 (92.3%) | 1 (7.7%) |
Natural Resources, Construction and Maintenance Occupations
The most common Natural Resources, Construction and Maintenance occupations in Detroit are Construction & Extraction (10 | 76.9%), and Farming, Fishing & Forestry (1 | 7.7%).
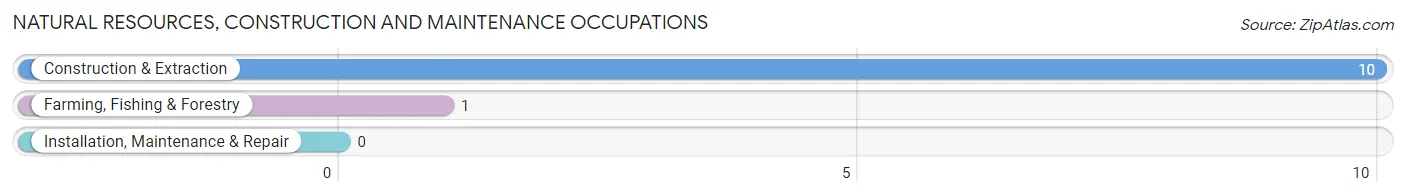
Natural Resources, Construction and Maintenance Occupations by Sex

| Occupation | Male | Female |
| Farming, Fishing & Forestry | 1 (100.0%) | 0 (0.0%) |
| Construction & Extraction | 10 (100.0%) | 0 (0.0%) |
| Installation, Maintenance & Repair | 0 (0.0%) | 0 (0.0%) |
| Total (Category) | 11 (100.0%) | 0 (0.0%) |
| Total (Overall) | 12 (92.3%) | 1 (7.7%) |
Production, Transportation and Moving Occupations
Production, Transportation and Moving Occupations by Sex
| Occupation | Male | Female |
| Production | 0 (0.0%) | 0 (0.0%) |
| Transportation | 0 (0.0%) | 0 (0.0%) |
| Material Moving | 0 (0.0%) | 0 (0.0%) |
| Total (Category) | 0 (0.0%) | 0 (0.0%) |
| Total (Overall) | 12 (92.3%) | 1 (7.7%) |
Employment Industries by Sex in Detroit
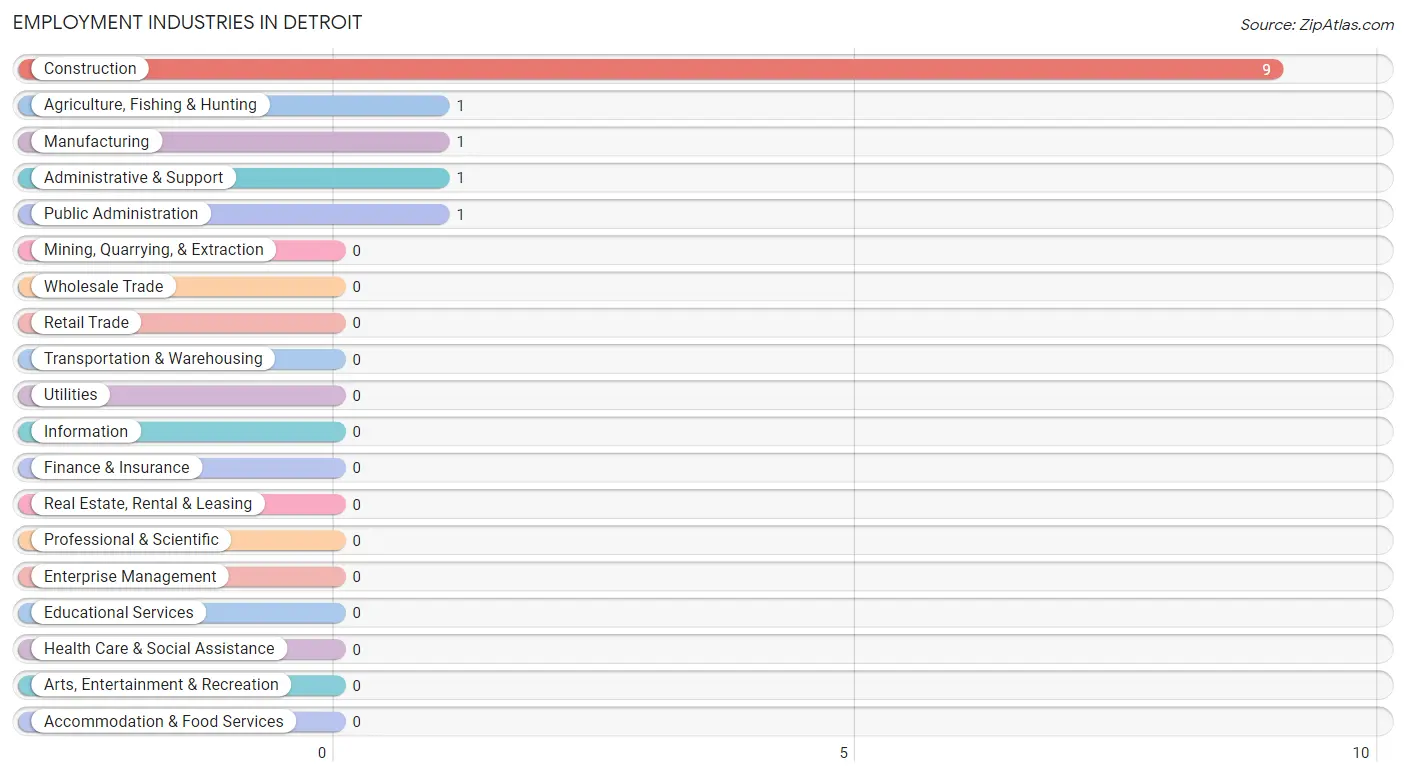
Employment Industries in Detroit
The major employment industries in Detroit include Construction (9 | 69.2%), Agriculture, Fishing & Hunting (1 | 7.7%), Manufacturing (1 | 7.7%), Administrative & Support (1 | 7.7%), and Public Administration (1 | 7.7%).
Employment Industries by Sex in Detroit
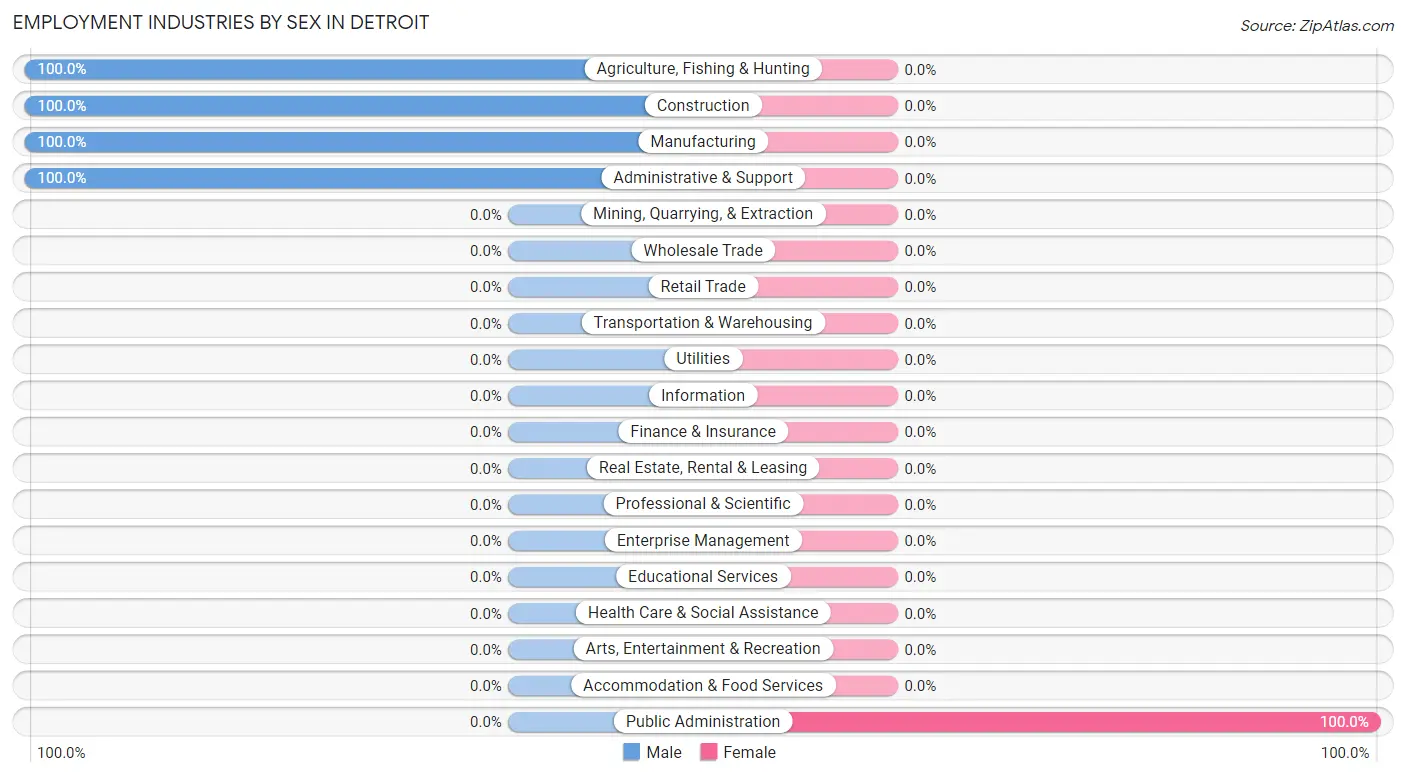
| Industry | Male | Female |
| Agriculture, Fishing & Hunting | 1 (100.0%) | 0 (0.0%) |
| Mining, Quarrying, & Extraction | 0 (0.0%) | 0 (0.0%) |
| Construction | 9 (100.0%) | 0 (0.0%) |
| Manufacturing | 1 (100.0%) | 0 (0.0%) |
| Wholesale Trade | 0 (0.0%) | 0 (0.0%) |
| Retail Trade | 0 (0.0%) | 0 (0.0%) |
| Transportation & Warehousing | 0 (0.0%) | 0 (0.0%) |
| Utilities | 0 (0.0%) | 0 (0.0%) |
| Information | 0 (0.0%) | 0 (0.0%) |
| Finance & Insurance | 0 (0.0%) | 0 (0.0%) |
| Real Estate, Rental & Leasing | 0 (0.0%) | 0 (0.0%) |
| Professional & Scientific | 0 (0.0%) | 0 (0.0%) |
| Enterprise Management | 0 (0.0%) | 0 (0.0%) |
| Administrative & Support | 1 (100.0%) | 0 (0.0%) |
| Educational Services | 0 (0.0%) | 0 (0.0%) |
| Health Care & Social Assistance | 0 (0.0%) | 0 (0.0%) |
| Arts, Entertainment & Recreation | 0 (0.0%) | 0 (0.0%) |
| Accommodation & Food Services | 0 (0.0%) | 0 (0.0%) |
| Public Administration | 0 (0.0%) | 1 (100.0%) |
| Total | 12 (92.3%) | 1 (7.7%) |
Education in Detroit
School Enrollment in Detroit
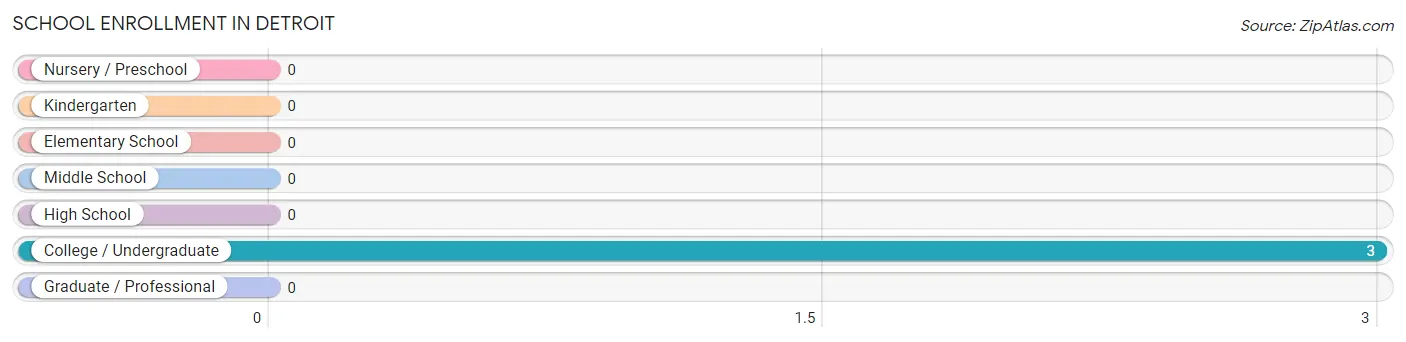
| School Level | # Students | % Students |
| Nursery / Preschool | 0 | 0.0% |
| Kindergarten | 0 | 0.0% |
| Elementary School | 0 | 0.0% |
| Middle School | 0 | 0.0% |
| High School | 0 | 0.0% |
| College / Undergraduate | 3 | 100.0% |
| Graduate / Professional | 0 | 0.0% |
| Total | 3 | 100.0% |
School Enrollment by Age by Funding Source in Detroit
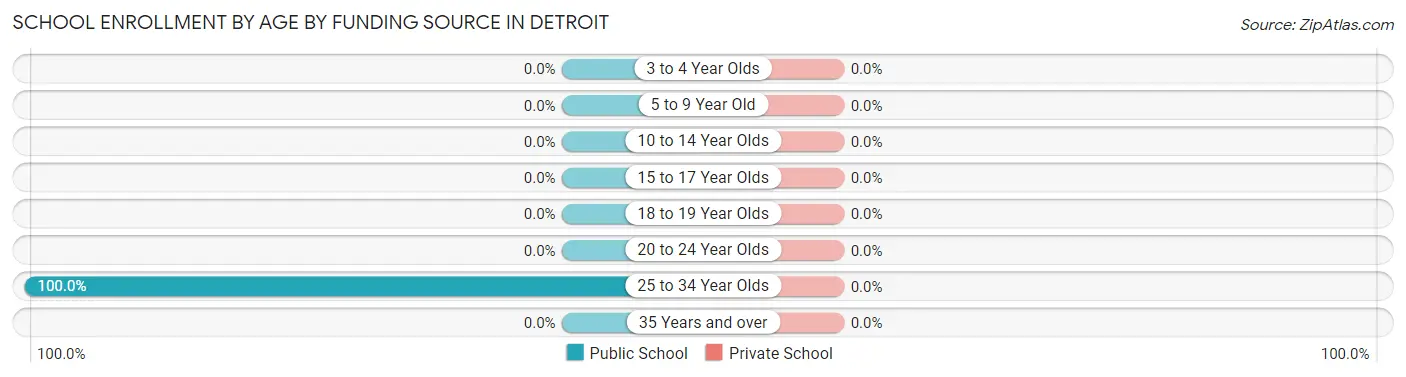
| Age Bracket | Public School | Private School |
| 3 to 4 Year Olds | 0 (0.0%) | 0 (0.0%) |
| 5 to 9 Year Old | 0 (0.0%) | 0 (0.0%) |
| 10 to 14 Year Olds | 0 (0.0%) | 0 (0.0%) |
| 15 to 17 Year Olds | 0 (0.0%) | 0 (0.0%) |
| 18 to 19 Year Olds | 0 (0.0%) | 0 (0.0%) |
| 20 to 24 Year Olds | 0 (0.0%) | 0 (0.0%) |
| 25 to 34 Year Olds | 3 (100.0%) | 0 (0.0%) |
| 35 Years and over | 0 (0.0%) | 0 (0.0%) |
| Total | 3 (100.0%) | 0 (0.0%) |
Educational Attainment by Field of Study in Detroit
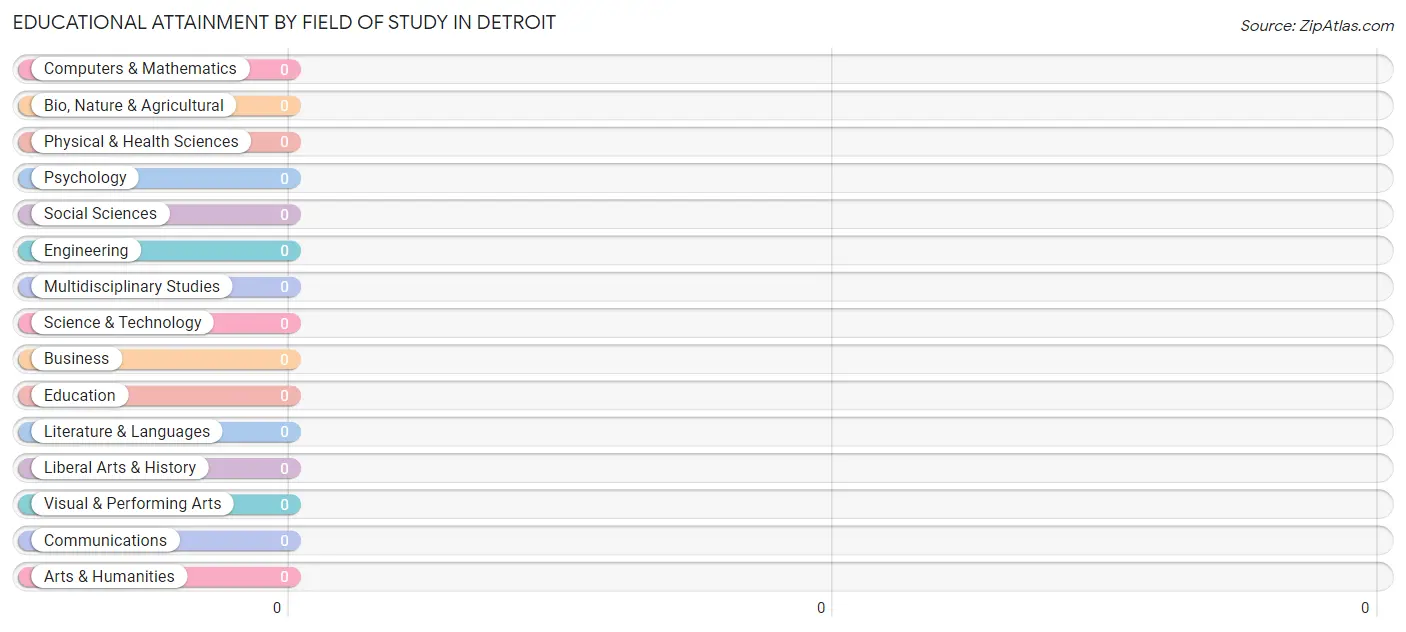
| Field of Study | # Graduates | % Graduates |
| Computers & Mathematics | 0 | 0.0% |
| Bio, Nature & Agricultural | 0 | 0.0% |
| Physical & Health Sciences | 0 | 0.0% |
| Psychology | 0 | 0.0% |
| Social Sciences | 0 | 0.0% |
| Engineering | 0 | 0.0% |
| Multidisciplinary Studies | 0 | 0.0% |
| Science & Technology | 0 | 0.0% |
| Business | 0 | 0.0% |
| Education | 0 | 0.0% |
| Literature & Languages | 0 | 0.0% |
| Liberal Arts & History | 0 | 0.0% |
| Visual & Performing Arts | 0 | 0.0% |
| Communications | 0 | 0.0% |
| Arts & Humanities | 0 | 0.0% |
| Total | 0 | 0.0% |
Transportation & Commute in Detroit
Vehicle Availability by Sex in Detroit
The most prevalent vehicle ownership categories in Detroit are males with 2 vehicles (11, accounting for 91.7%) and females with 2 vehicles (0, making up 1,100.0%).
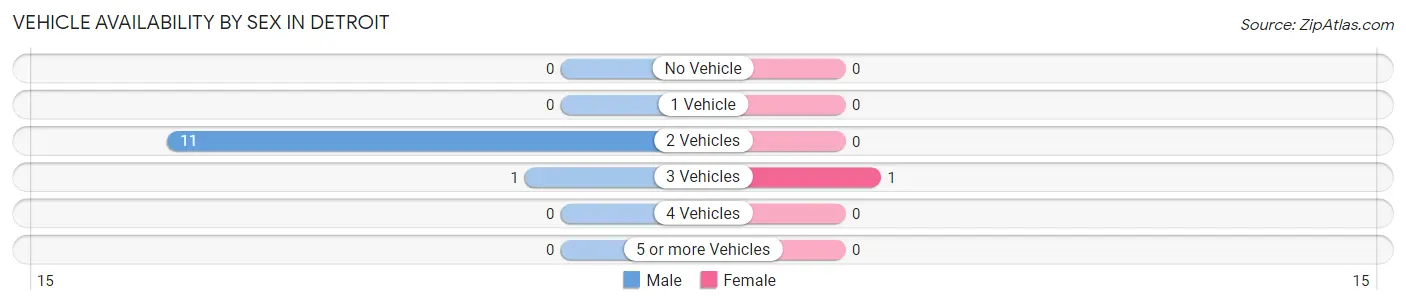
| Vehicles Available | Male | Female |
| No Vehicle | 0 (0.0%) | 0 (0.0%) |
| 1 Vehicle | 0 (0.0%) | 0 (0.0%) |
| 2 Vehicles | 11 (91.7%) | 0 (0.0%) |
| 3 Vehicles | 1 (8.3%) | 1 (100.0%) |
| 4 Vehicles | 0 (0.0%) | 0 (0.0%) |
| 5 or more Vehicles | 0 (0.0%) | 0 (0.0%) |
| Total | 12 (100.0%) | 1 (100.0%) |
Commute Time in Detroit
The most frequently occuring commute durations in Detroit are 40 to 44 minutes (9 commuters, 69.2%), 15 to 19 minutes (1 commuters, 7.7%), and 25 to 29 minutes (1 commuters, 7.7%).
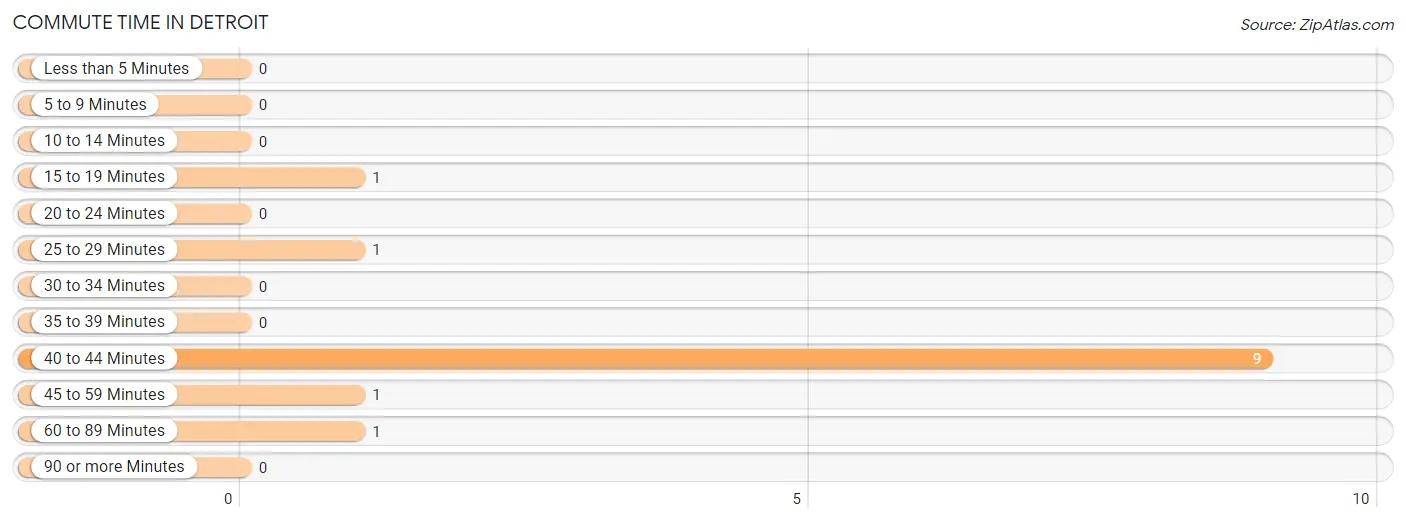
| Commute Time | # Commuters | % Commuters |
| Less than 5 Minutes | 0 | 0.0% |
| 5 to 9 Minutes | 0 | 0.0% |
| 10 to 14 Minutes | 0 | 0.0% |
| 15 to 19 Minutes | 1 | 7.7% |
| 20 to 24 Minutes | 0 | 0.0% |
| 25 to 29 Minutes | 1 | 7.7% |
| 30 to 34 Minutes | 0 | 0.0% |
| 35 to 39 Minutes | 0 | 0.0% |
| 40 to 44 Minutes | 9 | 69.2% |
| 45 to 59 Minutes | 1 | 7.7% |
| 60 to 89 Minutes | 1 | 7.7% |
| 90 or more Minutes | 0 | 0.0% |
Commute Time by Sex in Detroit
The most common commute times in Detroit are 40 to 44 minutes (9 commuters, 75.0%) for males and 45 to 59 minutes (1 commuters, 100.0%) for females.
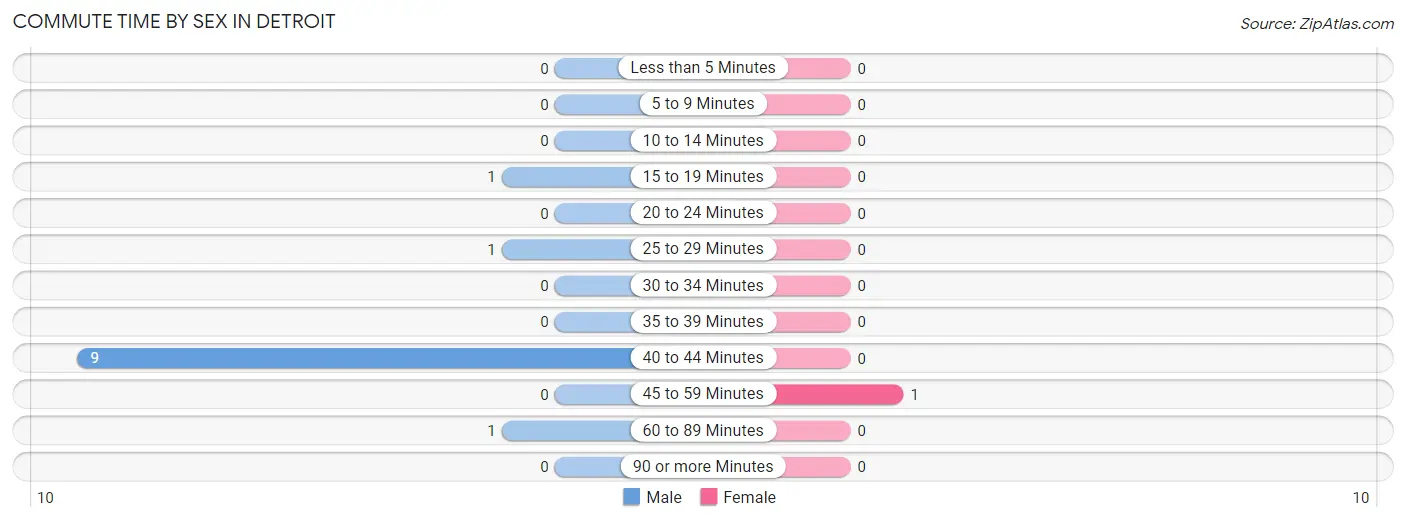
| Commute Time | Male | Female |
| Less than 5 Minutes | 0 (0.0%) | 0 (0.0%) |
| 5 to 9 Minutes | 0 (0.0%) | 0 (0.0%) |
| 10 to 14 Minutes | 0 (0.0%) | 0 (0.0%) |
| 15 to 19 Minutes | 1 (8.3%) | 0 (0.0%) |
| 20 to 24 Minutes | 0 (0.0%) | 0 (0.0%) |
| 25 to 29 Minutes | 1 (8.3%) | 0 (0.0%) |
| 30 to 34 Minutes | 0 (0.0%) | 0 (0.0%) |
| 35 to 39 Minutes | 0 (0.0%) | 0 (0.0%) |
| 40 to 44 Minutes | 9 (75.0%) | 0 (0.0%) |
| 45 to 59 Minutes | 0 (0.0%) | 1 (100.0%) |
| 60 to 89 Minutes | 1 (8.3%) | 0 (0.0%) |
| 90 or more Minutes | 0 (0.0%) | 0 (0.0%) |
Time of Departure to Work by Sex in Detroit
The most frequent times of departure to work in Detroit are 12:00 AM to 4:59 AM (10, 83.3%) for males and 5:30 AM to 5:59 AM (1, 100.0%) for females.
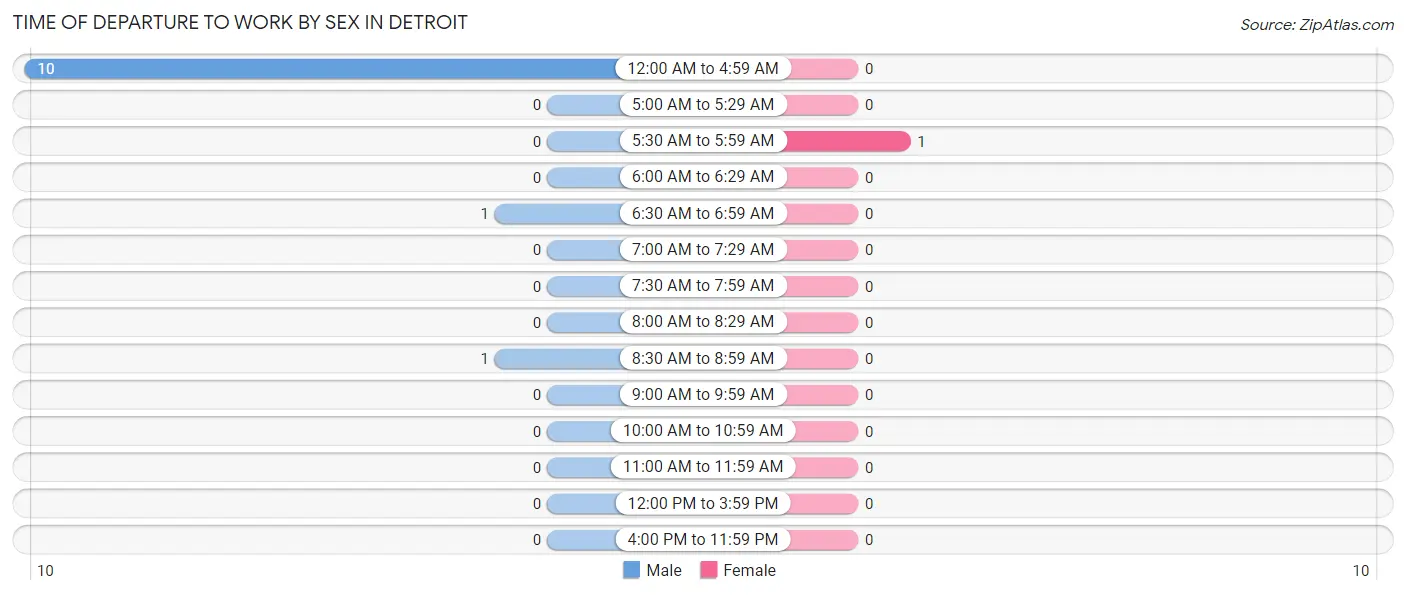
| Time of Departure | Male | Female |
| 12:00 AM to 4:59 AM | 10 (83.3%) | 0 (0.0%) |
| 5:00 AM to 5:29 AM | 0 (0.0%) | 0 (0.0%) |
| 5:30 AM to 5:59 AM | 0 (0.0%) | 1 (100.0%) |
| 6:00 AM to 6:29 AM | 0 (0.0%) | 0 (0.0%) |
| 6:30 AM to 6:59 AM | 1 (8.3%) | 0 (0.0%) |
| 7:00 AM to 7:29 AM | 0 (0.0%) | 0 (0.0%) |
| 7:30 AM to 7:59 AM | 0 (0.0%) | 0 (0.0%) |
| 8:00 AM to 8:29 AM | 0 (0.0%) | 0 (0.0%) |
| 8:30 AM to 8:59 AM | 1 (8.3%) | 0 (0.0%) |
| 9:00 AM to 9:59 AM | 0 (0.0%) | 0 (0.0%) |
| 10:00 AM to 10:59 AM | 0 (0.0%) | 0 (0.0%) |
| 11:00 AM to 11:59 AM | 0 (0.0%) | 0 (0.0%) |
| 12:00 PM to 3:59 PM | 0 (0.0%) | 0 (0.0%) |
| 4:00 PM to 11:59 PM | 0 (0.0%) | 0 (0.0%) |
| Total | 12 (100.0%) | 1 (100.0%) |
Housing Occupancy in Detroit
Occupancy by Ownership in Detroit
Of the total 11 dwellings in Detroit, owner-occupied units account for 11 (100.0%), while renter-occupied units make up 0 (0.0%).
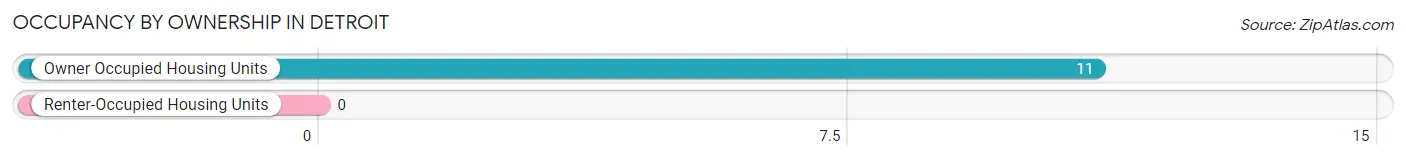
| Occupancy | # Housing Units | % Housing Units |
| Owner Occupied Housing Units | 11 | 100.0% |
| Renter-Occupied Housing Units | 0 | 0.0% |
| Total Occupied Housing Units | 11 | 100.0% |
Occupancy by Household Size in Detroit
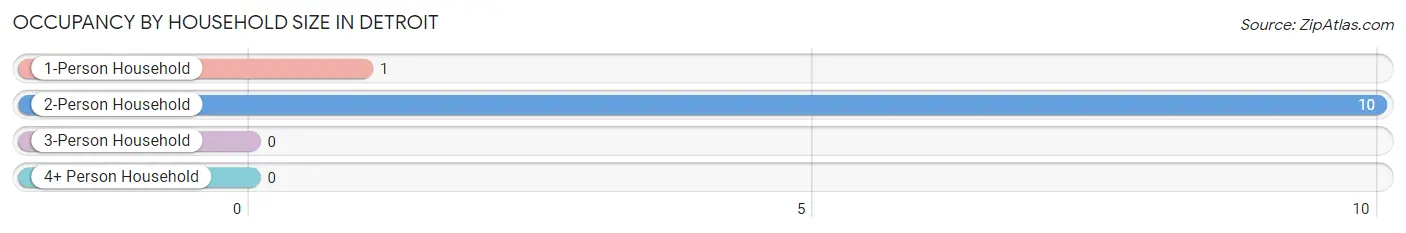
| Household Size | # Housing Units | % Housing Units |
| 1-Person Household | 1 | 9.1% |
| 2-Person Household | 10 | 90.9% |
| 3-Person Household | 0 | 0.0% |
| 4+ Person Household | 0 | 0.0% |
| Total Housing Units | 11 | 100.0% |
Occupancy by Ownership by Household Size in Detroit
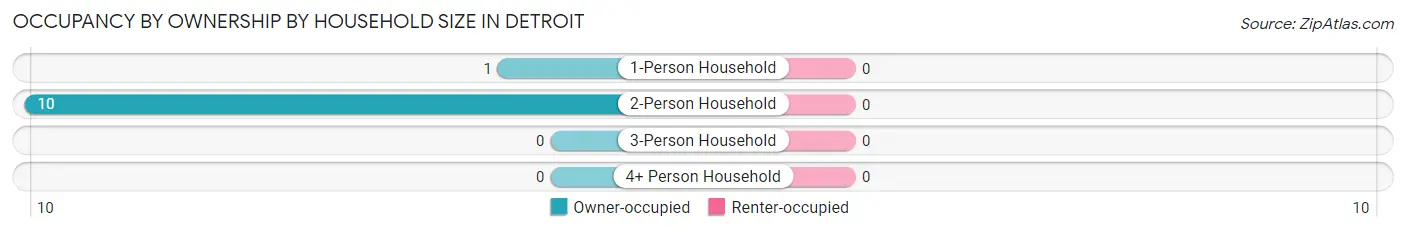
| Household Size | Owner-occupied | Renter-occupied |
| 1-Person Household | 1 (100.0%) | 0 (0.0%) |
| 2-Person Household | 10 (100.0%) | 0 (0.0%) |
| 3-Person Household | 0 (0.0%) | 0 (0.0%) |
| 4+ Person Household | 0 (0.0%) | 0 (0.0%) |
| Total Housing Units | 11 (100.0%) | 0 (0.0%) |
Occupancy by Educational Attainment in Detroit
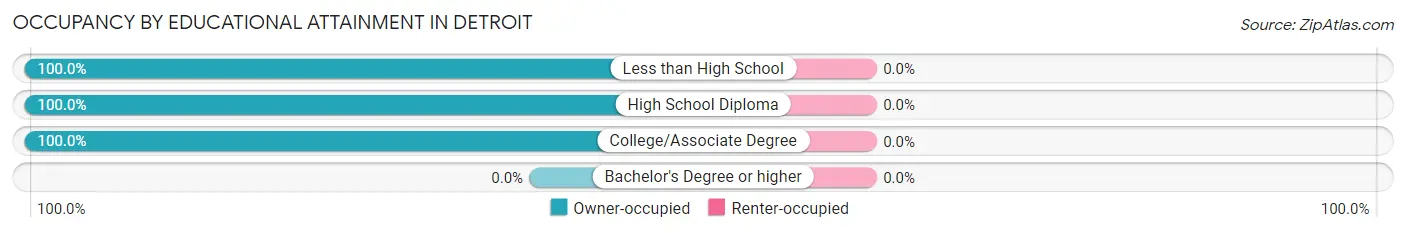
| Household Size | Owner-occupied | Renter-occupied |
| Less than High School | 5 (100.0%) | 0 (0.0%) |
| High School Diploma | 4 (100.0%) | 0 (0.0%) |
| College/Associate Degree | 2 (100.0%) | 0 (0.0%) |
| Bachelor's Degree or higher | 0 (0.0%) | 0 (0.0%) |
Occupancy by Age of Householder in Detroit
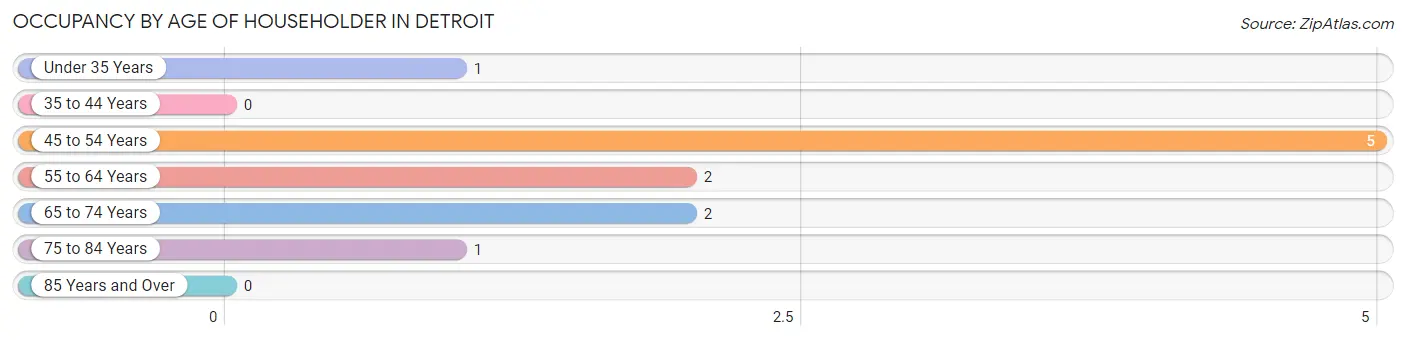
| Age Bracket | # Households | % Households |
| Under 35 Years | 1 | 9.1% |
| 35 to 44 Years | 0 | 0.0% |
| 45 to 54 Years | 5 | 45.5% |
| 55 to 64 Years | 2 | 18.2% |
| 65 to 74 Years | 2 | 18.2% |
| 75 to 84 Years | 1 | 9.1% |
| 85 Years and Over | 0 | 0.0% |
| Total | 11 | 100.0% |
Housing Finances in Detroit
Median Income by Occupancy in Detroit
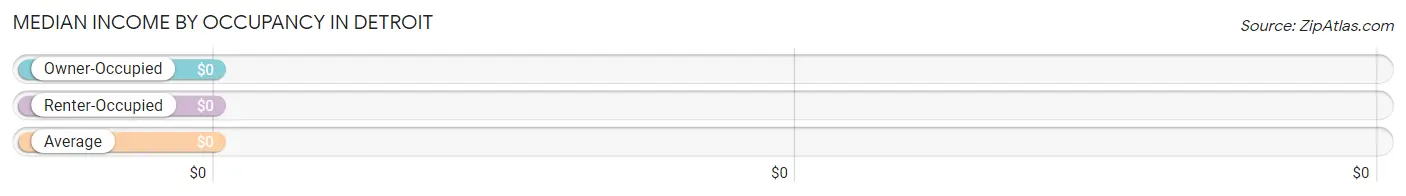
| Occupancy Type | # Households | Median Income |
| Owner-Occupied | 11 (100.0%) | $0 |
| Renter-Occupied | 0 (0.0%) | $0 |
| Average | 11 (100.0%) | $0 |
Occupancy by Householder Income Bracket in Detroit
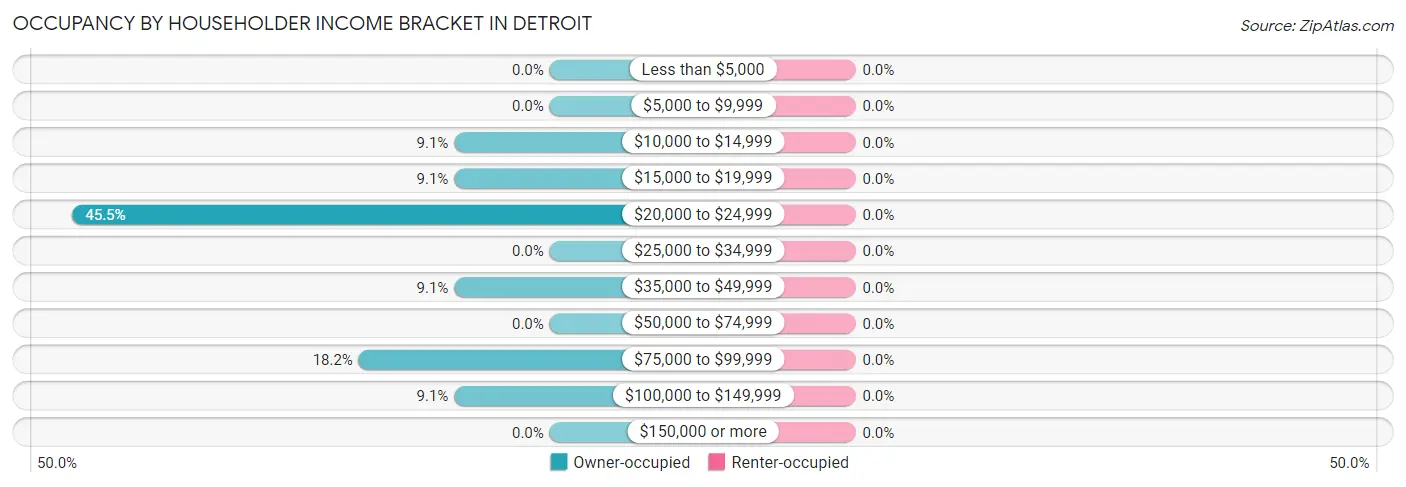
| Income Bracket | Owner-occupied | Renter-occupied |
| Less than $5,000 | 0 (0.0%) | 0 (0.0%) |
| $5,000 to $9,999 | 0 (0.0%) | 0 (0.0%) |
| $10,000 to $14,999 | 1 (9.1%) | 0 (0.0%) |
| $15,000 to $19,999 | 1 (9.1%) | 0 (0.0%) |
| $20,000 to $24,999 | 5 (45.5%) | 0 (0.0%) |
| $25,000 to $34,999 | 0 (0.0%) | 0 (0.0%) |
| $35,000 to $49,999 | 1 (9.1%) | 0 (0.0%) |
| $50,000 to $74,999 | 0 (0.0%) | 0 (0.0%) |
| $75,000 to $99,999 | 2 (18.2%) | 0 (0.0%) |
| $100,000 to $149,999 | 1 (9.1%) | 0 (0.0%) |
| $150,000 or more | 0 (0.0%) | 0 (0.0%) |
| Total | 11 (100.0%) | 0 (0.0%) |
Monthly Housing Cost Tiers in Detroit
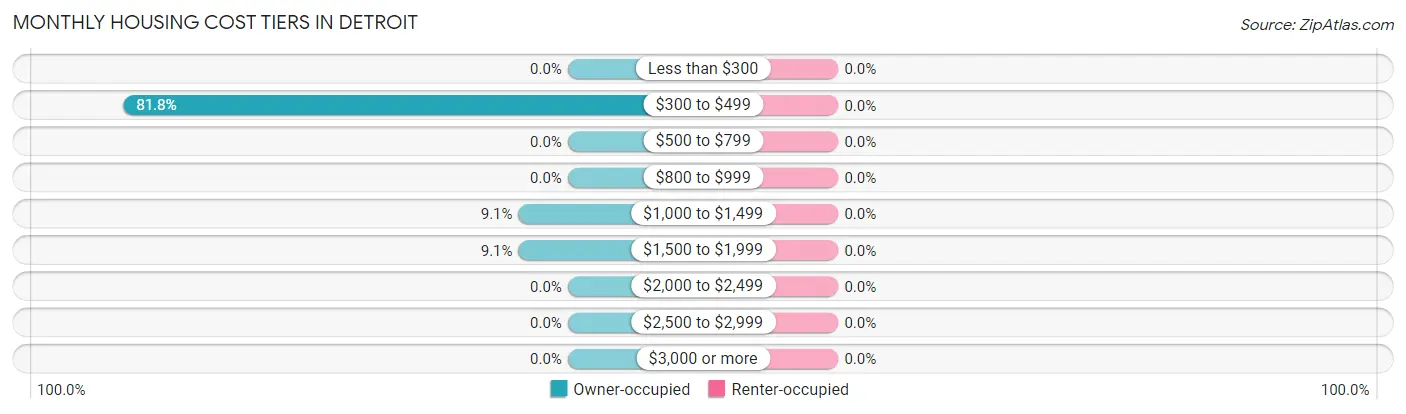
| Monthly Cost | Owner-occupied | Renter-occupied |
| Less than $300 | 0 (0.0%) | 0 (0.0%) |
| $300 to $499 | 9 (81.8%) | 0 (0.0%) |
| $500 to $799 | 0 (0.0%) | 0 (0.0%) |
| $800 to $999 | 0 (0.0%) | 0 (0.0%) |
| $1,000 to $1,499 | 1 (9.1%) | 0 (0.0%) |
| $1,500 to $1,999 | 1 (9.1%) | 0 (0.0%) |
| $2,000 to $2,499 | 0 (0.0%) | 0 (0.0%) |
| $2,500 to $2,999 | 0 (0.0%) | 0 (0.0%) |
| $3,000 or more | 0 (0.0%) | 0 (0.0%) |
| Total | 11 (100.0%) | 0 (0.0%) |
Physical Housing Characteristics in Detroit
Housing Structures in Detroit
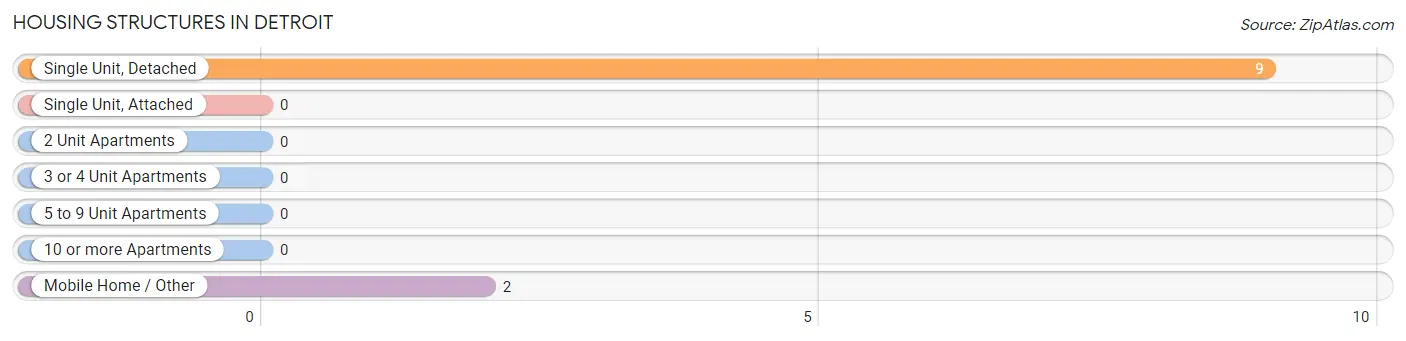
| Structure Type | # Housing Units | % Housing Units |
| Single Unit, Detached | 9 | 81.8% |
| Single Unit, Attached | 0 | 0.0% |
| 2 Unit Apartments | 0 | 0.0% |
| 3 or 4 Unit Apartments | 0 | 0.0% |
| 5 to 9 Unit Apartments | 0 | 0.0% |
| 10 or more Apartments | 0 | 0.0% |
| Mobile Home / Other | 2 | 18.2% |
| Total | 11 | 100.0% |
Housing Structures by Occupancy in Detroit
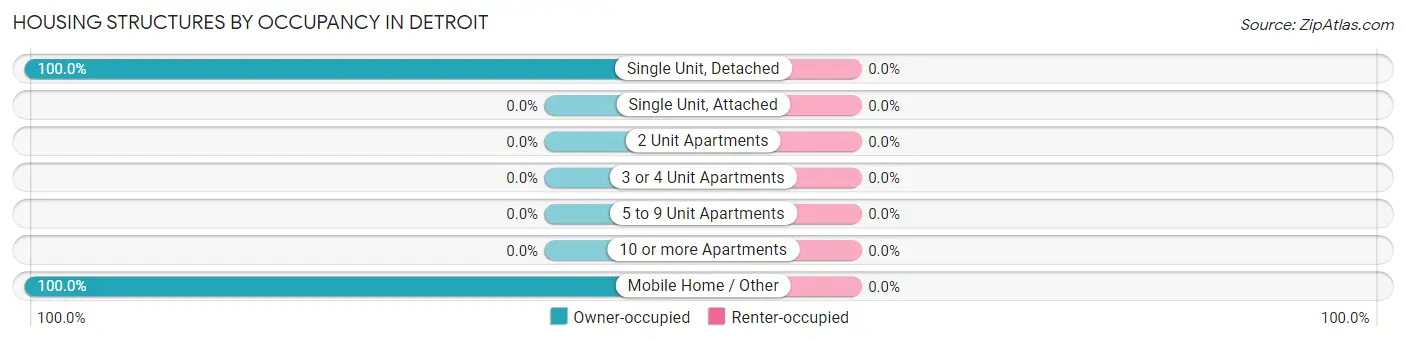
| Structure Type | Owner-occupied | Renter-occupied |
| Single Unit, Detached | 9 (100.0%) | 0 (0.0%) |
| Single Unit, Attached | 0 (0.0%) | 0 (0.0%) |
| 2 Unit Apartments | 0 (0.0%) | 0 (0.0%) |
| 3 or 4 Unit Apartments | 0 (0.0%) | 0 (0.0%) |
| 5 to 9 Unit Apartments | 0 (0.0%) | 0 (0.0%) |
| 10 or more Apartments | 0 (0.0%) | 0 (0.0%) |
| Mobile Home / Other | 2 (100.0%) | 0 (0.0%) |
| Total | 11 (100.0%) | 0 (0.0%) |
Housing Structures by Number of Rooms in Detroit
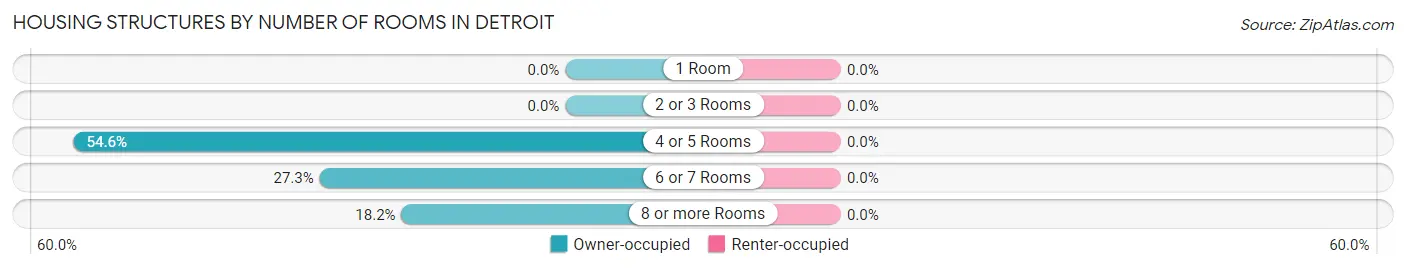
| Number of Rooms | Owner-occupied | Renter-occupied |
| 1 Room | 0 (0.0%) | 0 (0.0%) |
| 2 or 3 Rooms | 0 (0.0%) | 0 (0.0%) |
| 4 or 5 Rooms | 6 (54.5%) | 0 (0.0%) |
| 6 or 7 Rooms | 3 (27.3%) | 0 (0.0%) |
| 8 or more Rooms | 2 (18.2%) | 0 (0.0%) |
| Total | 11 (100.0%) | 0 (0.0%) |
Housing Structure by Heating Type in Detroit
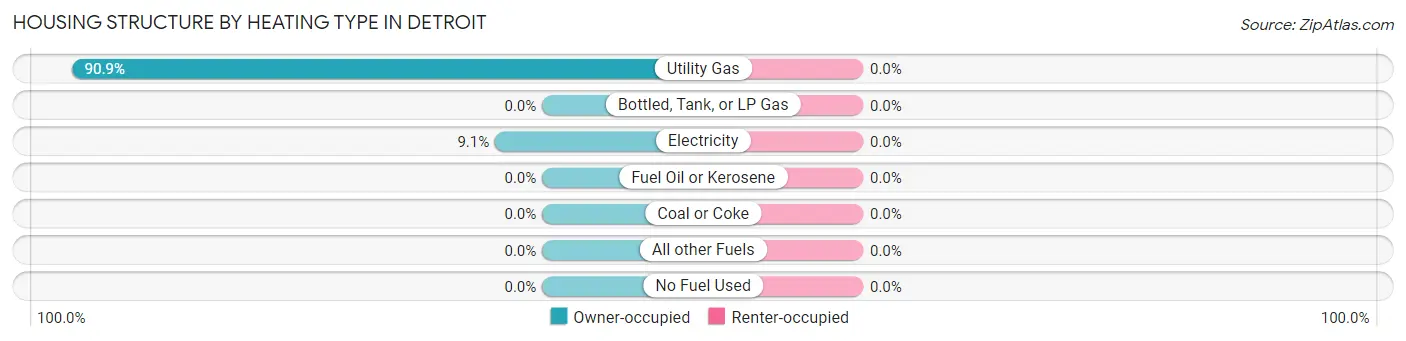
| Heating Type | Owner-occupied | Renter-occupied |
| Utility Gas | 10 (90.9%) | 0 (0.0%) |
| Bottled, Tank, or LP Gas | 0 (0.0%) | 0 (0.0%) |
| Electricity | 1 (9.1%) | 0 (0.0%) |
| Fuel Oil or Kerosene | 0 (0.0%) | 0 (0.0%) |
| Coal or Coke | 0 (0.0%) | 0 (0.0%) |
| All other Fuels | 0 (0.0%) | 0 (0.0%) |
| No Fuel Used | 0 (0.0%) | 0 (0.0%) |
| Total | 11 (100.0%) | 0 (0.0%) |
Household Vehicle Usage in Detroit
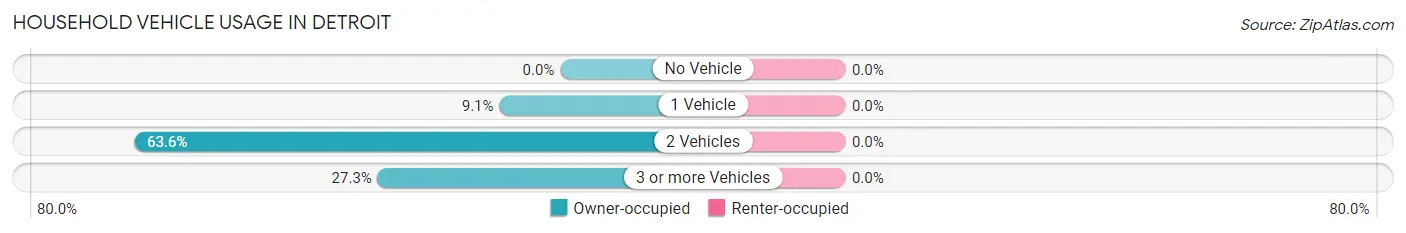
| Vehicles per Household | Owner-occupied | Renter-occupied |
| No Vehicle | 0 (0.0%) | 0 (0.0%) |
| 1 Vehicle | 1 (9.1%) | 0 (0.0%) |
| 2 Vehicles | 7 (63.6%) | 0 (0.0%) |
| 3 or more Vehicles | 3 (27.3%) | 0 (0.0%) |
| Total | 11 (100.0%) | 0 (0.0%) |
Real Estate & Mortgages in Detroit
Real Estate and Mortgage Overview in Detroit
| Characteristic | Without Mortgage | With Mortgage |
| Housing Units | 9 | 2 |
| Median Property Value | $65,000 | $0 |
| Median Household Income | $23,750 | $0 |
| Monthly Housing Costs | $444 | $0 |
| Real Estate Taxes | - | - |
Property Value by Mortgage Status in Detroit
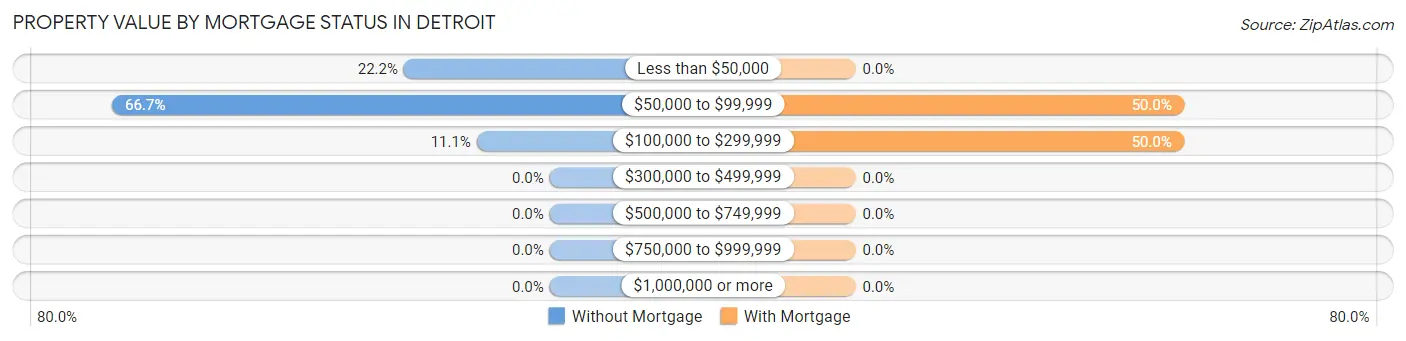
| Property Value | Without Mortgage | With Mortgage |
| Less than $50,000 | 2 (22.2%) | 0 (0.0%) |
| $50,000 to $99,999 | 6 (66.7%) | 1 (50.0%) |
| $100,000 to $299,999 | 1 (11.1%) | 1 (50.0%) |
| $300,000 to $499,999 | 0 (0.0%) | 0 (0.0%) |
| $500,000 to $749,999 | 0 (0.0%) | 0 (0.0%) |
| $750,000 to $999,999 | 0 (0.0%) | 0 (0.0%) |
| $1,000,000 or more | 0 (0.0%) | 0 (0.0%) |
| Total | 9 (100.0%) | 2 (100.0%) |
Household Income by Mortgage Status in Detroit
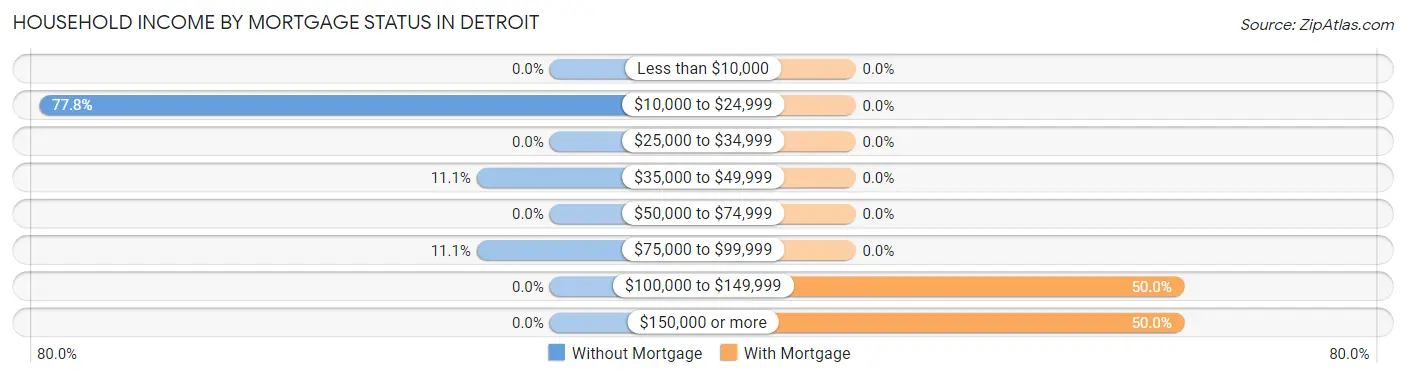
| Household Income | Without Mortgage | With Mortgage |
| Less than $10,000 | 0 (0.0%) | 0 (0.0%) |
| $10,000 to $24,999 | 7 (77.8%) | 0 (0.0%) |
| $25,000 to $34,999 | 0 (0.0%) | 0 (0.0%) |
| $35,000 to $49,999 | 1 (11.1%) | 0 (0.0%) |
| $50,000 to $74,999 | 0 (0.0%) | 0 (0.0%) |
| $75,000 to $99,999 | 1 (11.1%) | 0 (0.0%) |
| $100,000 to $149,999 | 0 (0.0%) | 1 (50.0%) |
| $150,000 or more | 0 (0.0%) | 1 (50.0%) |
| Total | 9 (100.0%) | 2 (100.0%) |
Property Value to Household Income Ratio in Detroit
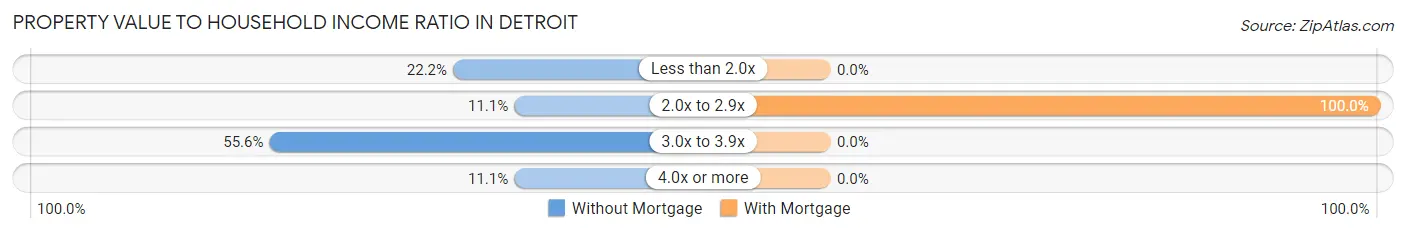
| Value-to-Income Ratio | Without Mortgage | With Mortgage |
| Less than 2.0x | 2 (22.2%) | 0 (0.0%) |
| 2.0x to 2.9x | 1 (11.1%) | 2 (100.0%) |
| 3.0x to 3.9x | 5 (55.6%) | 0 (0.0%) |
| 4.0x or more | 1 (11.1%) | 0 (0.0%) |
| Total | 9 (100.0%) | 2 (100.0%) |
Real Estate Taxes by Mortgage Status in Detroit
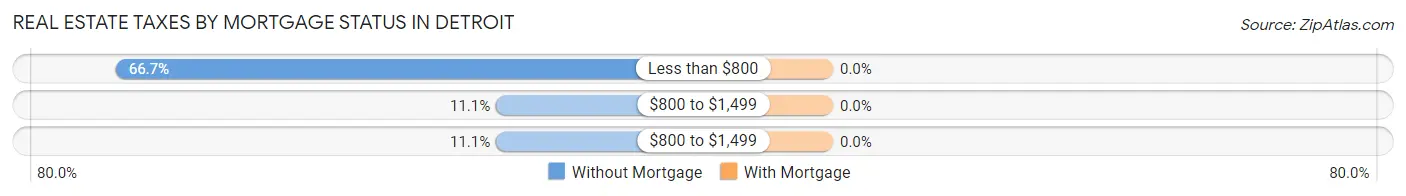
| Property Taxes | Without Mortgage | With Mortgage |
| Less than $800 | 6 (66.7%) | 0 (0.0%) |
| $800 to $1,499 | 1 (11.1%) | 0 (0.0%) |
| $800 to $1,499 | 1 (11.1%) | 0 (0.0%) |
| Total | 9 (100.0%) | 2 (100.0%) |
Health & Disability in Detroit
Health Insurance Coverage by Age in Detroit
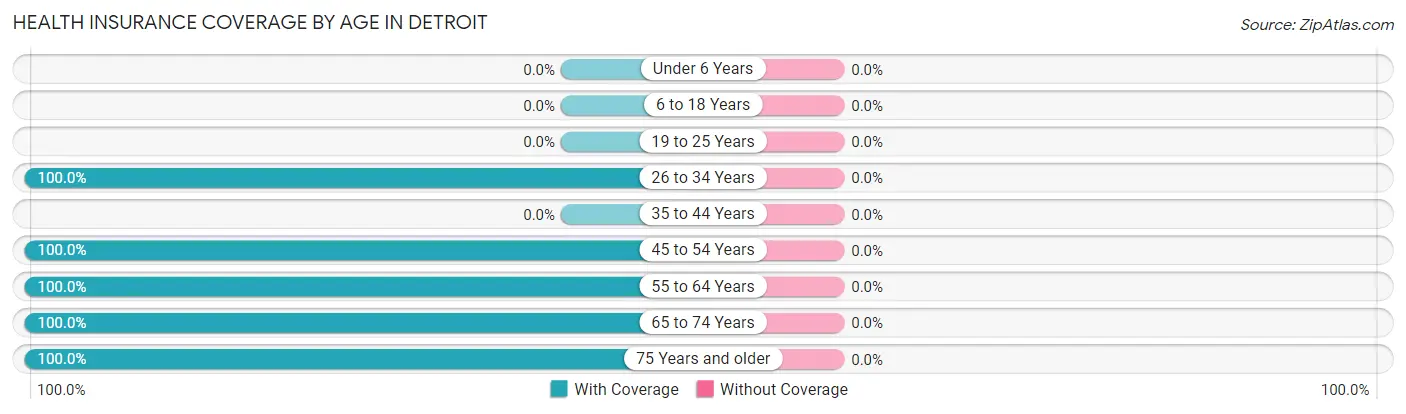
| Age Bracket | With Coverage | Without Coverage |
| Under 6 Years | 0 (0.0%) | 0 (0.0%) |
| 6 to 18 Years | 0 (0.0%) | 0 (0.0%) |
| 19 to 25 Years | 0 (0.0%) | 0 (0.0%) |
| 26 to 34 Years | 4 (100.0%) | 0 (0.0%) |
| 35 to 44 Years | 0 (0.0%) | 0 (0.0%) |
| 45 to 54 Years | 5 (100.0%) | 0 (0.0%) |
| 55 to 64 Years | 13 (100.0%) | 0 (0.0%) |
| 65 to 74 Years | 4 (100.0%) | 0 (0.0%) |
| 75 Years and older | 1 (100.0%) | 0 (0.0%) |
| Total | 27 (100.0%) | 0 (0.0%) |
Health Insurance Coverage by Citizenship Status in Detroit
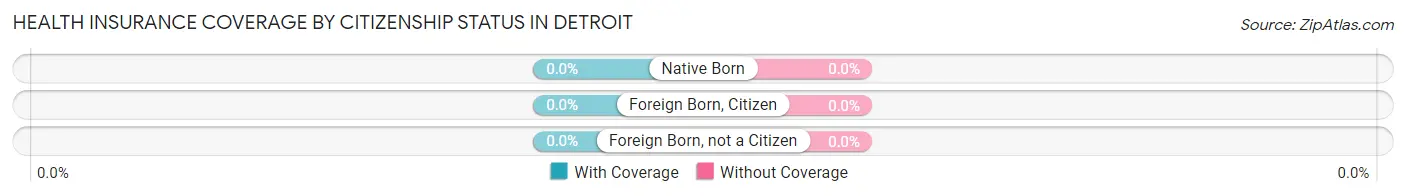
| Citizenship Status | With Coverage | Without Coverage |
| Native Born | 0 (0.0%) | 0 (0.0%) |
| Foreign Born, Citizen | 0 (0.0%) | 0 (0.0%) |
| Foreign Born, not a Citizen | 0 (0.0%) | 0 (0.0%) |
Health Insurance Coverage by Household Income in Detroit
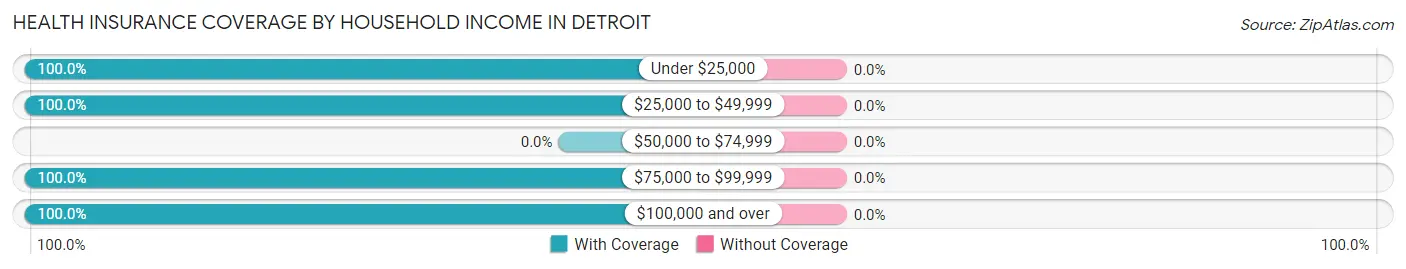
| Household Income | With Coverage | Without Coverage |
| Under $25,000 | 20 (100.0%) | 0 (0.0%) |
| $25,000 to $49,999 | 1 (100.0%) | 0 (0.0%) |
| $50,000 to $74,999 | 0 (0.0%) | 0 (0.0%) |
| $75,000 to $99,999 | 4 (100.0%) | 0 (0.0%) |
| $100,000 and over | 2 (100.0%) | 0 (0.0%) |
Public vs Private Health Insurance Coverage by Age in Detroit
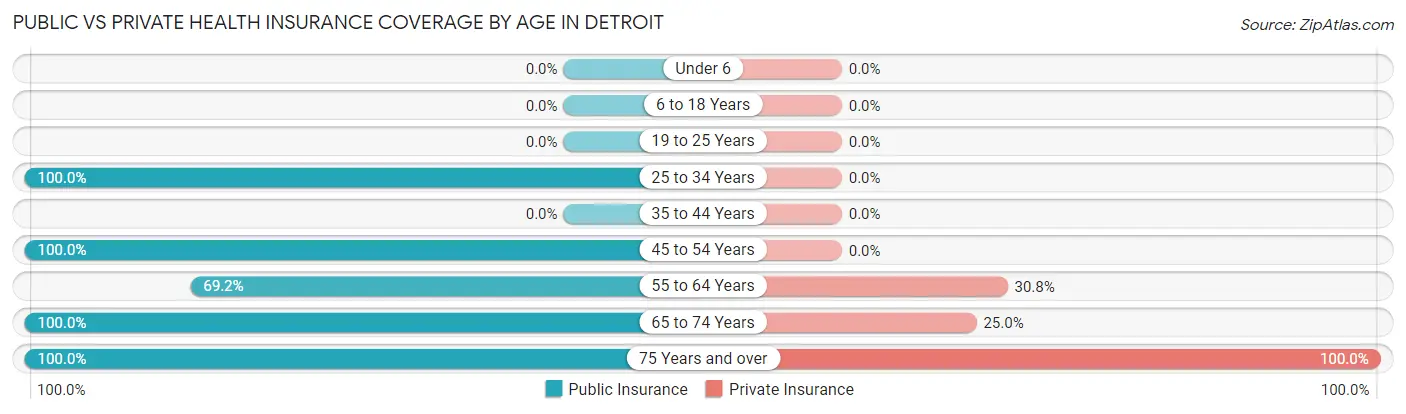
| Age Bracket | Public Insurance | Private Insurance |
| Under 6 | 0 (0.0%) | 0 (0.0%) |
| 6 to 18 Years | 0 (0.0%) | 0 (0.0%) |
| 19 to 25 Years | 0 (0.0%) | 0 (0.0%) |
| 25 to 34 Years | 4 (100.0%) | 0 (0.0%) |
| 35 to 44 Years | 0 (0.0%) | 0 (0.0%) |
| 45 to 54 Years | 5 (100.0%) | 0 (0.0%) |
| 55 to 64 Years | 9 (69.2%) | 4 (30.8%) |
| 65 to 74 Years | 4 (100.0%) | 1 (25.0%) |
| 75 Years and over | 1 (100.0%) | 1 (100.0%) |
| Total | 23 (85.2%) | 6 (22.2%) |
Disability Status by Sex by Age in Detroit
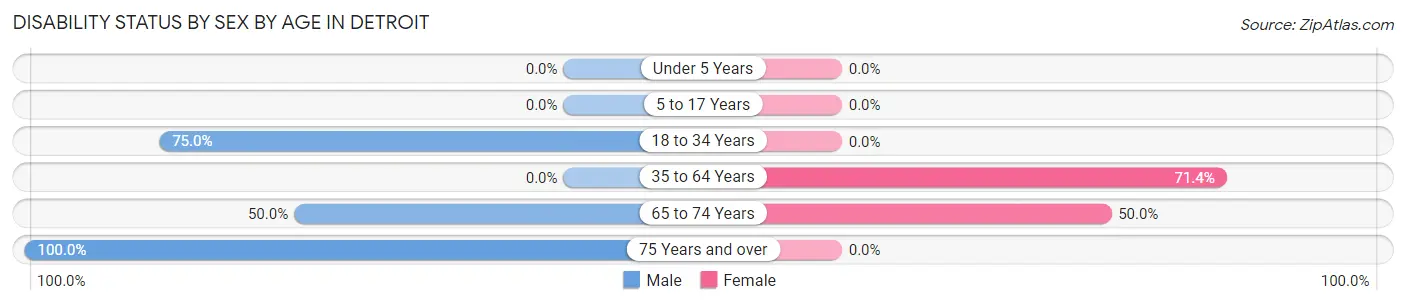
| Age Bracket | Male | Female |
| Under 5 Years | 0 (0.0%) | 0 (0.0%) |
| 5 to 17 Years | 0 (0.0%) | 0 (0.0%) |
| 18 to 34 Years | 3 (75.0%) | 0 (0.0%) |
| 35 to 64 Years | 0 (0.0%) | 5 (71.4%) |
| 65 to 74 Years | 1 (50.0%) | 1 (50.0%) |
| 75 Years and over | 1 (100.0%) | 0 (0.0%) |
Disability Class by Sex by Age in Detroit
Disability Class: Hearing Difficulty
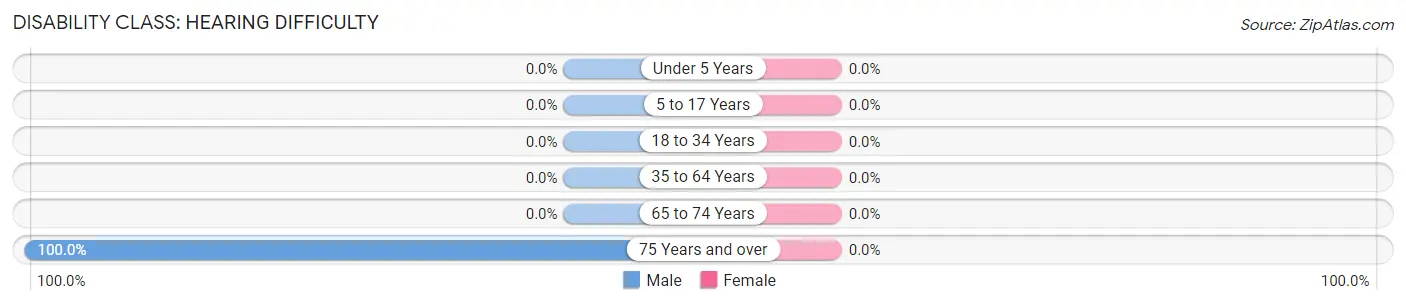
| Age Bracket | Male | Female |
| Under 5 Years | 0 (0.0%) | 0 (0.0%) |
| 5 to 17 Years | 0 (0.0%) | 0 (0.0%) |
| 18 to 34 Years | 0 (0.0%) | 0 (0.0%) |
| 35 to 64 Years | 0 (0.0%) | 0 (0.0%) |
| 65 to 74 Years | 0 (0.0%) | 0 (0.0%) |
| 75 Years and over | 1 (100.0%) | 0 (0.0%) |
Disability Class: Vision Difficulty
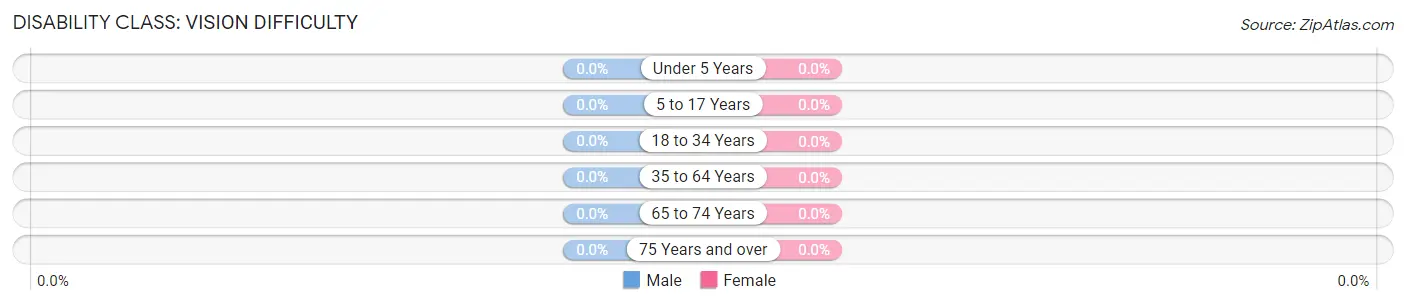
| Age Bracket | Male | Female |
| Under 5 Years | 0 (0.0%) | 0 (0.0%) |
| 5 to 17 Years | 0 (0.0%) | 0 (0.0%) |
| 18 to 34 Years | 0 (0.0%) | 0 (0.0%) |
| 35 to 64 Years | 0 (0.0%) | 0 (0.0%) |
| 65 to 74 Years | 0 (0.0%) | 0 (0.0%) |
| 75 Years and over | 0 (0.0%) | 0 (0.0%) |
Disability Class: Cognitive Difficulty
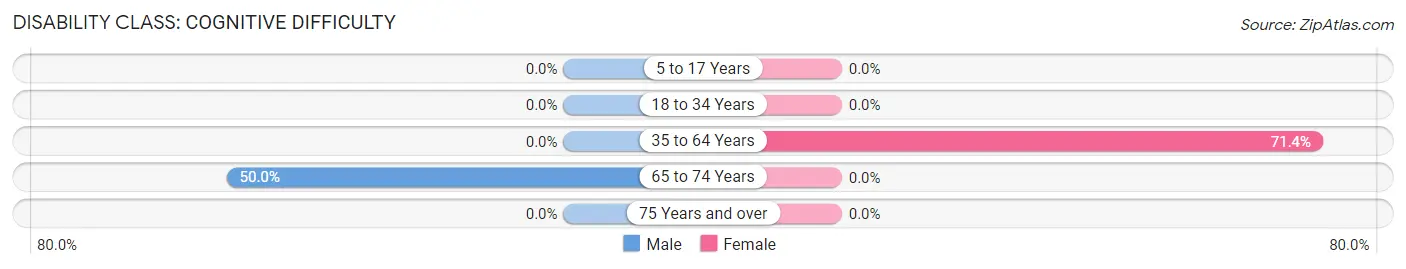
| Age Bracket | Male | Female |
| 5 to 17 Years | 0 (0.0%) | 0 (0.0%) |
| 18 to 34 Years | 0 (0.0%) | 0 (0.0%) |
| 35 to 64 Years | 0 (0.0%) | 5 (71.4%) |
| 65 to 74 Years | 1 (50.0%) | 0 (0.0%) |
| 75 Years and over | 0 (0.0%) | 0 (0.0%) |
Disability Class: Ambulatory Difficulty
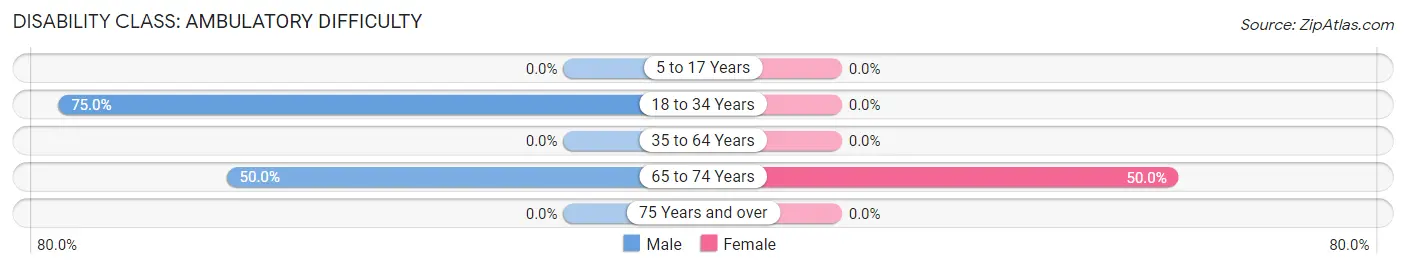
| Age Bracket | Male | Female |
| 5 to 17 Years | 0 (0.0%) | 0 (0.0%) |
| 18 to 34 Years | 3 (75.0%) | 0 (0.0%) |
| 35 to 64 Years | 0 (0.0%) | 0 (0.0%) |
| 65 to 74 Years | 1 (50.0%) | 1 (50.0%) |
| 75 Years and over | 0 (0.0%) | 0 (0.0%) |
Disability Class: Self-Care Difficulty
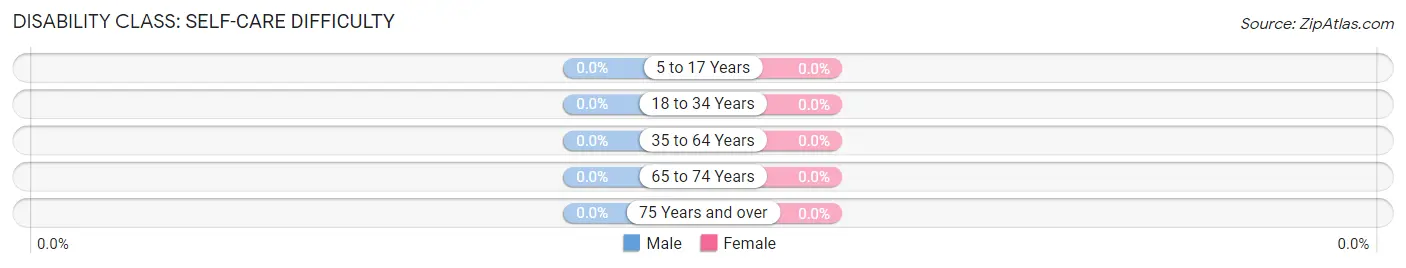
| Age Bracket | Male | Female |
| 5 to 17 Years | 0 (0.0%) | 0 (0.0%) |
| 18 to 34 Years | 0 (0.0%) | 0 (0.0%) |
| 35 to 64 Years | 0 (0.0%) | 0 (0.0%) |
| 65 to 74 Years | 0 (0.0%) | 0 (0.0%) |
| 75 Years and over | 0 (0.0%) | 0 (0.0%) |
Technology Access in Detroit
Computing Device Access in Detroit
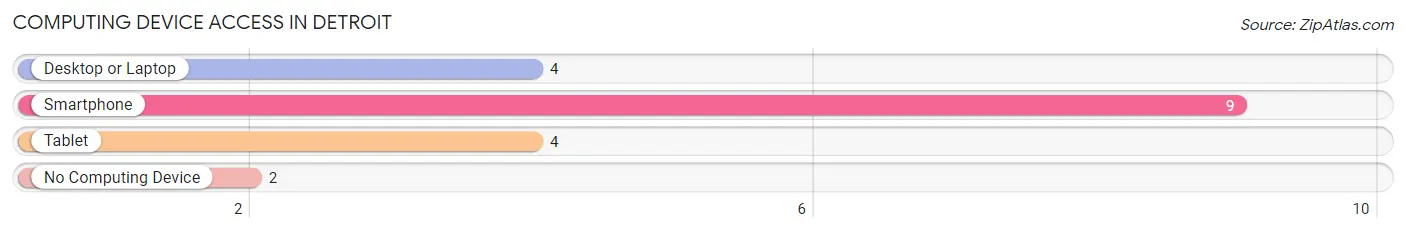
| Device Type | # Households | % Households |
| Desktop or Laptop | 4 | 36.4% |
| Smartphone | 9 | 81.8% |
| Tablet | 4 | 36.4% |
| No Computing Device | 2 | 18.2% |
| Total | 11 | 100.0% |
Internet Access in Detroit
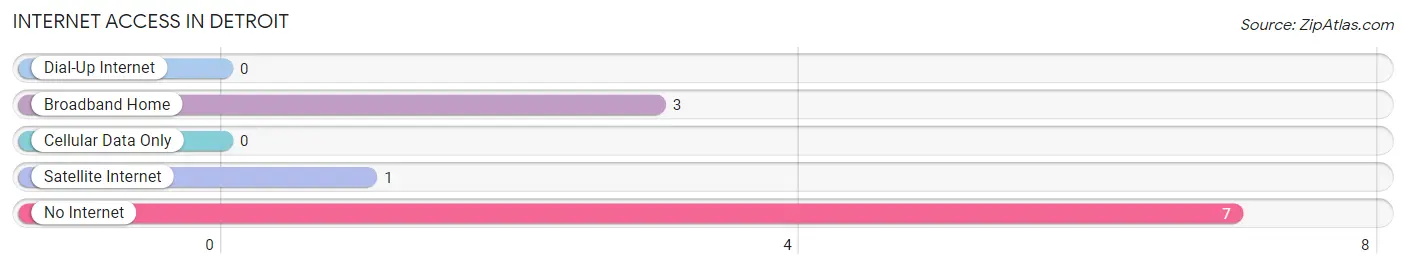
| Internet Type | # Households | % Households |
| Dial-Up Internet | 0 | 0.0% |
| Broadband Home | 3 | 27.3% |
| Cellular Data Only | 0 | 0.0% |
| Satellite Internet | 1 | 9.1% |
| No Internet | 7 | 63.6% |
| Total | 11 | 100.0% |
Detroit Summary
Detroit, Michigan is a major city located in the Midwestern United States. It is the largest city in the state of Michigan and the second-largest city in the Midwest, behind Chicago. Detroit is the county seat of Wayne County and is located on the Detroit River, which connects Lake Erie to Lake St. Clair. Detroit is a major port city and is home to the Detroit-Windsor Tunnel, the only international border crossing between the United States and Canada.
Detroit is a major center for industry, finance, and culture. It is home to several Fortune 500 companies, including General Motors, Ford Motor Company, and Quicken Loans. Detroit is also home to several major universities, including the University of Michigan, Wayne State University, and the University of Detroit Mercy.
Geography
Detroit is located in southeastern Michigan, on the Detroit River, which connects Lake Erie to Lake St. Clair. The city is situated on the Detroit Plateau, a flat area of land that is surrounded by the Great Lakes. Detroit is bordered by the cities of Dearborn, Hamtramck, and Highland Park to the west, and by the cities of Grosse Pointe, Grosse Pointe Farms, and Grosse Pointe Park to the east.
The city of Detroit covers an area of 138.8 square miles, with a population of 951,270 as of the 2020 census. The city is divided into seven major districts: Downtown, Midtown, Eastside, Westside, Southwest, Northwest, and North End.
History
The area that is now Detroit was first settled by French fur traders in the late 17th century. The city was founded in 1701 by Antoine de la Mothe Cadillac, a French explorer and fur trader. The city was named after the Detroit River, which was named after the French word for “strait”.
In the 19th century, Detroit became an important industrial center, with the construction of the Detroit-Windsor Tunnel in 1855 connecting the city to Canada. The city was also the site of the Ford Motor Company’s first automobile assembly plant in 1903.
In the 20th century, Detroit experienced a period of rapid growth and industrialization, becoming a major center for the automotive industry. The city was also the site of the 1967 Detroit riots, which resulted in the death of 43 people and the destruction of over 2,000 buildings.
Economy
Detroit is a major center for industry, finance, and culture. It is home to several Fortune 500 companies, including General Motors, Ford Motor Company, and Quicken Loans. The city is also home to several major universities, including the University of Michigan, Wayne State University, and the University of Detroit Mercy.
The city’s economy is largely based on the automotive industry, with the Detroit Three (General Motors, Ford, and Chrysler) accounting for a large portion of the city’s economic output. Other major industries in the city include finance, healthcare, and tourism.
Demographics
As of the 2020 census, the population of Detroit was 951,270. The city is majority African American, with a population that is 79.7% Black or African American, 14.3% White, 2.2% Asian, and 1.7% Hispanic or Latino. The median household income in Detroit is $31,945, and the median home value is $45,000.
Conclusion
Detroit is a major city located in the Midwestern United States. It is the largest city in the state of Michigan and the second-largest city in the Midwest, behind Chicago. Detroit is a major center for industry, finance, and culture, and is home to several Fortune 500 companies and major universities. The city’s economy is largely based on the automotive industry, with the Detroit Three accounting for a large portion of the city’s economic output. The population of Detroit is majority African American, with a population that is 79.7% Black or African American, 14.3% White, 2.2% Asian, and 1.7% Hispanic or Latino.
Common Questions
What is Per Capita Income in Detroit?
Per Capita income in Detroit is $23,704.
What is Inequality or Gini Index in Detroit?
Inequality or Gini Index in Detroit is 0.42.
What is the Total Population of Detroit?
Total Population of Detroit is 27.
What is the Total Male Population of Detroit?
Total Male Population of Detroit is 18.
What is the Total Female Population of Detroit?
Total Female Population of Detroit is 9.
What is the Ratio of Males per 100 Females in Detroit?
There are 200.00 Males per 100 Females in Detroit.
What is the Ratio of Females per 100 Males in Detroit?
There are 50.00 Females per 100 Males in Detroit.
What is the Median Population Age in Detroit?
Median Population Age in Detroit is 57.4 Years.
What is the Average Family Size in Detroit
Average Family Size in Detroit is 2.6 People.
What is the Average Household Size in Detroit
Average Household Size in Detroit is 2.5 People.
How Large is the Labor Force in Detroit?
There are 13 People in the Labor Forcein in Detroit.
What is the Percentage of People in the Labor Force in Detroit?
48.1% of People are in the Labor Force in Detroit.