Heyworth, IL Map & Demographics
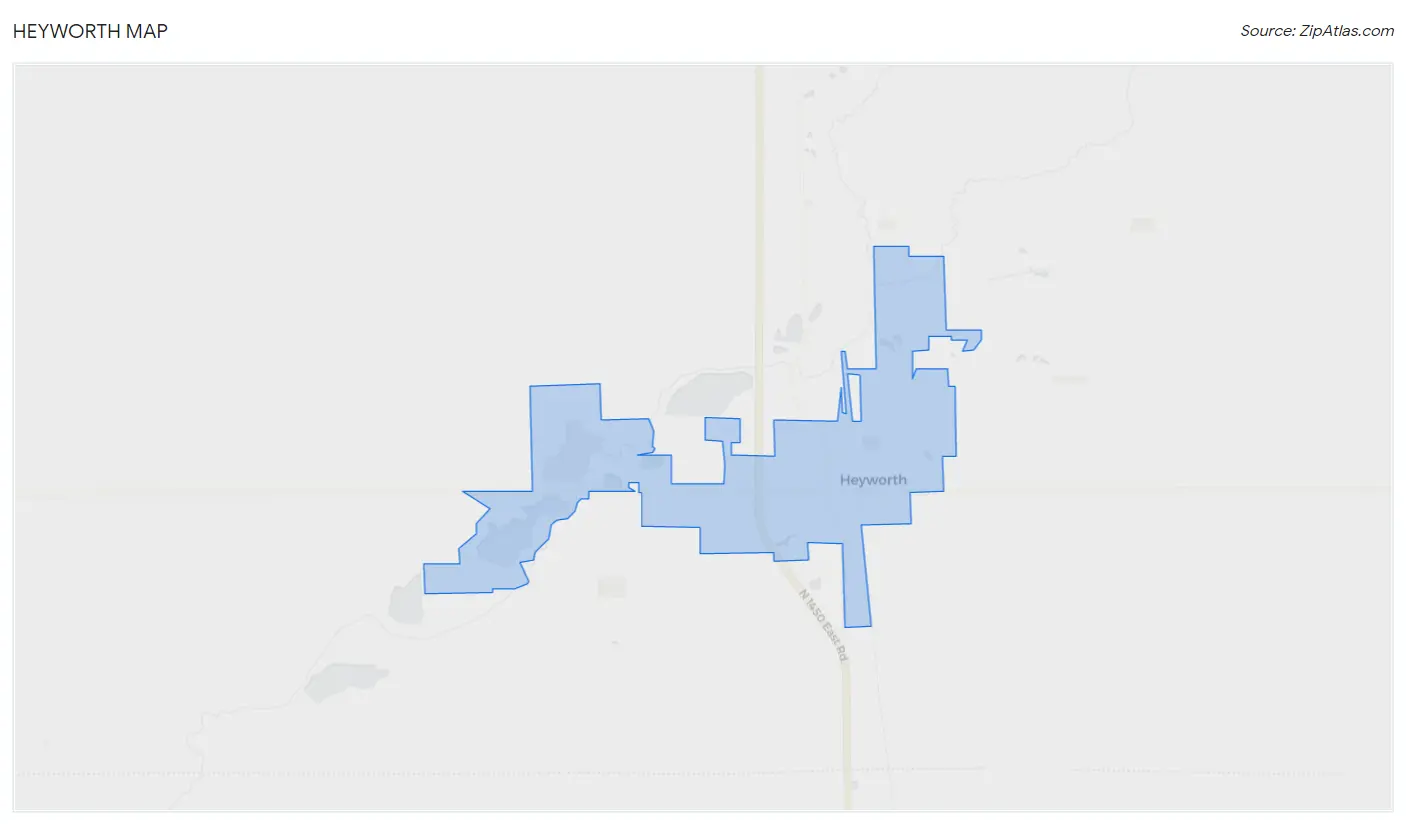
Heyworth Map
Heyworth Overview
$33,350
PER CAPITA INCOME
$97,938
AVG FAMILY INCOME
$83,462
AVG HOUSEHOLD INCOME
27.7%
WAGE / INCOME GAP [ % ]
72.3¢/ $1
WAGE / INCOME GAP [ $ ]
0.41
INEQUALITY / GINI INDEX
2,725
TOTAL POPULATION
1,239
MALE POPULATION
1,486
FEMALE POPULATION
83.38
MALES / 100 FEMALES
119.94
FEMALES / 100 MALES
40.2
MEDIAN AGE
3.3
AVG FAMILY SIZE
2.8
AVG HOUSEHOLD SIZE
1,232
LABOR FORCE [ PEOPLE ]
60.9%
PERCENT IN LABOR FORCE
2.7%
UNEMPLOYMENT RATE
Heyworth Zip Codes
Heyworth Area Codes
Income in Heyworth
Income Overview in Heyworth
Per Capita Income in Heyworth is $33,350, while median incomes of families and households are $97,938 and $83,462 respectively.
| Characteristic | Number | Measure |
| Per Capita Income | 2,725 | $33,350 |
| Median Family Income | 725 | $97,938 |
| Mean Family Income | 725 | $107,076 |
| Median Household Income | 978 | $83,462 |
| Mean Household Income | 978 | $92,621 |
| Income Deficit | 725 | $0 |
| Wage / Income Gap (%) | 2,725 | 27.68% |
| Wage / Income Gap ($) | 2,725 | 72.32¢ per $1 |
| Gini / Inequality Index | 2,725 | 0.41 |
Earnings by Sex in Heyworth
Average Earnings in Heyworth are $55,000, $63,620 for men and $46,012 for women, a difference of 27.7%.
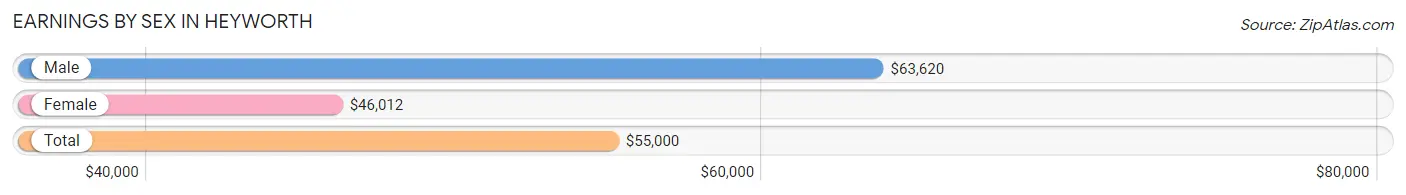
| Sex | Number | Average Earnings |
| Male | 633 (49.6%) | $63,620 |
| Female | 643 (50.4%) | $46,012 |
| Total | 1,276 (100.0%) | $55,000 |
Earnings by Sex by Income Bracket in Heyworth
The most common earnings brackets in Heyworth are $100,000+ for men (125 | 19.8%) and $100,000+ for women (70 | 10.9%).
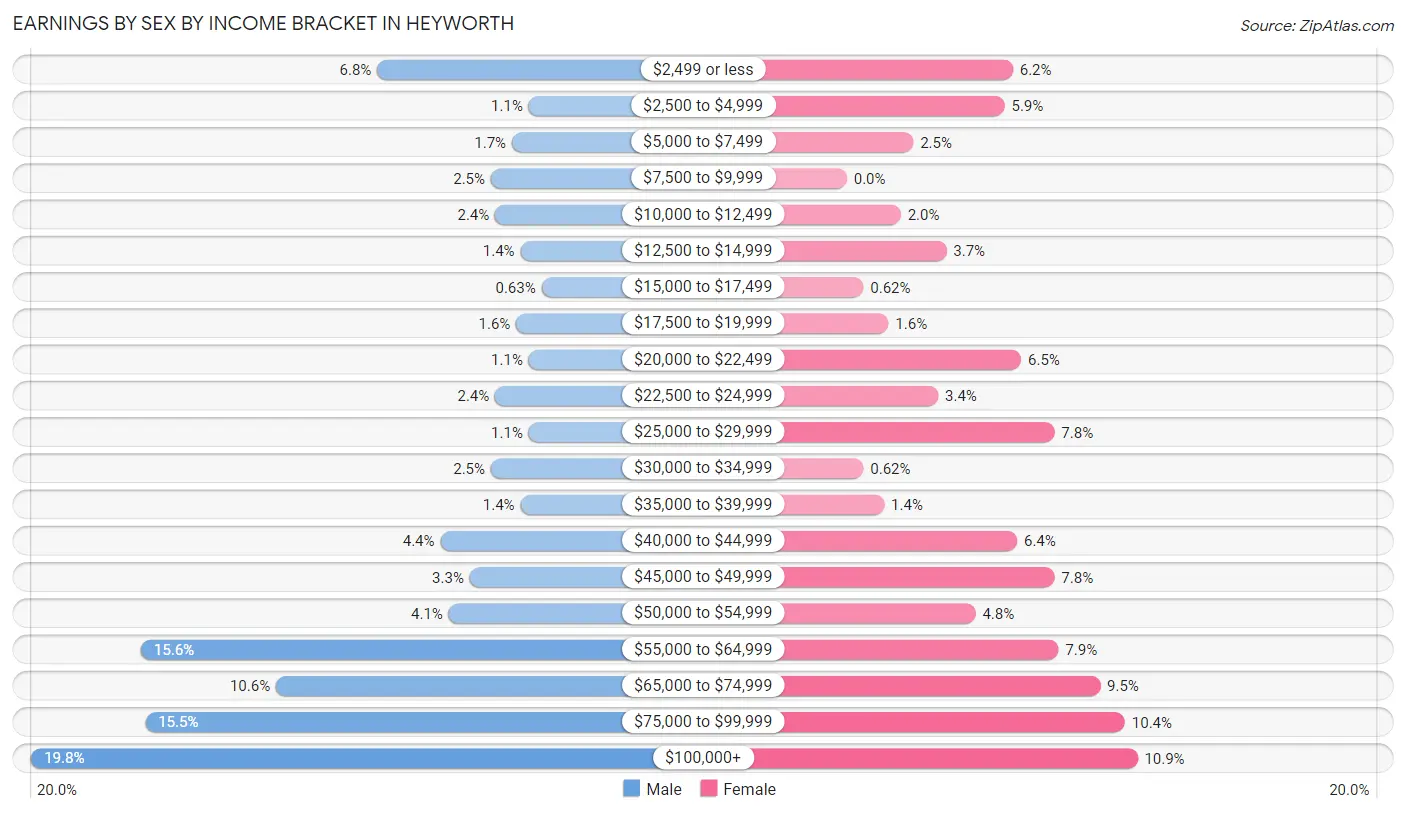
| Income | Male | Female |
| $2,499 or less | 43 (6.8%) | 40 (6.2%) |
| $2,500 to $4,999 | 7 (1.1%) | 38 (5.9%) |
| $5,000 to $7,499 | 11 (1.7%) | 16 (2.5%) |
| $7,500 to $9,999 | 16 (2.5%) | 0 (0.0%) |
| $10,000 to $12,499 | 15 (2.4%) | 13 (2.0%) |
| $12,500 to $14,999 | 9 (1.4%) | 24 (3.7%) |
| $15,000 to $17,499 | 4 (0.6%) | 4 (0.6%) |
| $17,500 to $19,999 | 10 (1.6%) | 10 (1.6%) |
| $20,000 to $22,499 | 7 (1.1%) | 42 (6.5%) |
| $22,500 to $24,999 | 15 (2.4%) | 22 (3.4%) |
| $25,000 to $29,999 | 7 (1.1%) | 50 (7.8%) |
| $30,000 to $34,999 | 16 (2.5%) | 4 (0.6%) |
| $35,000 to $39,999 | 9 (1.4%) | 9 (1.4%) |
| $40,000 to $44,999 | 28 (4.4%) | 41 (6.4%) |
| $45,000 to $49,999 | 21 (3.3%) | 50 (7.8%) |
| $50,000 to $54,999 | 26 (4.1%) | 31 (4.8%) |
| $55,000 to $64,999 | 99 (15.6%) | 51 (7.9%) |
| $65,000 to $74,999 | 67 (10.6%) | 61 (9.5%) |
| $75,000 to $99,999 | 98 (15.5%) | 67 (10.4%) |
| $100,000+ | 125 (19.8%) | 70 (10.9%) |
| Total | 633 (100.0%) | 643 (100.0%) |
Earnings by Sex by Educational Attainment in Heyworth
Average earnings in Heyworth are $66,184 for men and $50,800 for women, a difference of 23.2%. Men with an educational attainment of graduate degree enjoy the highest average annual earnings of $105,000, while those with high school diploma education earn the least with $62,639. Women with an educational attainment of graduate degree earn the most with the average annual earnings of $91,250, while those with high school diploma education have the smallest earnings of $40,625.
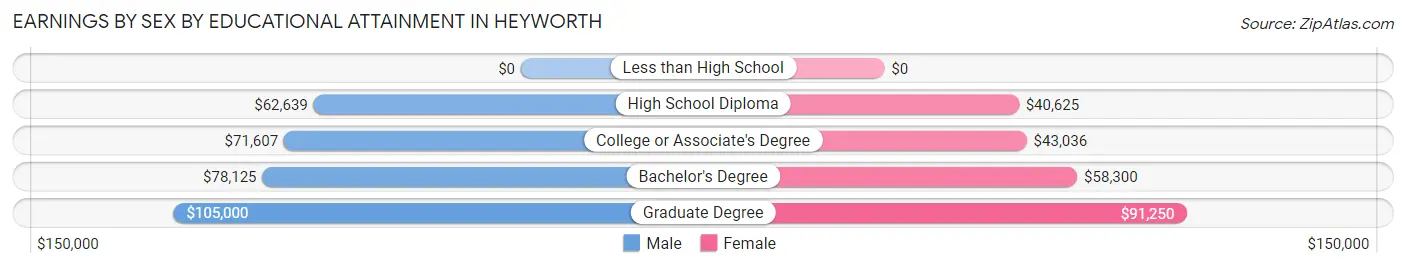
| Educational Attainment | Male Income | Female Income |
| Less than High School | - | - |
| High School Diploma | $62,639 | $40,625 |
| College or Associate's Degree | $71,607 | $43,036 |
| Bachelor's Degree | $78,125 | $58,300 |
| Graduate Degree | $105,000 | $91,250 |
| Total | $66,184 | $50,800 |
Family Income in Heyworth
Family Income Brackets in Heyworth
According to the Heyworth family income data, there are 184 families falling into the $100,000 to $149,999 income range, which is the most common income bracket and makes up 25.4% of all families. Conversely, the $15,000 to $24,999 income bracket is the least frequent group with only 9 families (1.2%) belonging to this category.
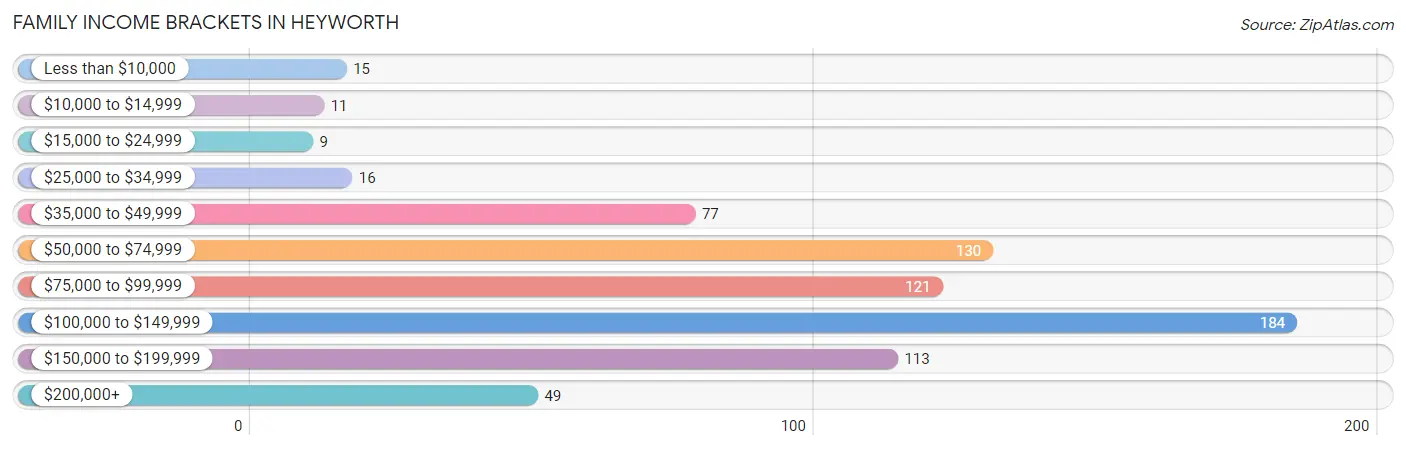
| Income Bracket | # Families | % Families |
| Less than $10,000 | 15 | 2.1% |
| $10,000 to $14,999 | 11 | 1.5% |
| $15,000 to $24,999 | 9 | 1.2% |
| $25,000 to $34,999 | 16 | 2.2% |
| $35,000 to $49,999 | 77 | 10.6% |
| $50,000 to $74,999 | 130 | 17.9% |
| $75,000 to $99,999 | 121 | 16.7% |
| $100,000 to $149,999 | 184 | 25.4% |
| $150,000 to $199,999 | 113 | 15.6% |
| $200,000+ | 49 | 6.8% |
Family Income by Famaliy Size in Heyworth
6-person families (30 | 4.1%) account for the highest median family income in Heyworth with $150,000 per family, while 3-person families (140 | 19.3%) have the highest median income of $37,381 per family member.
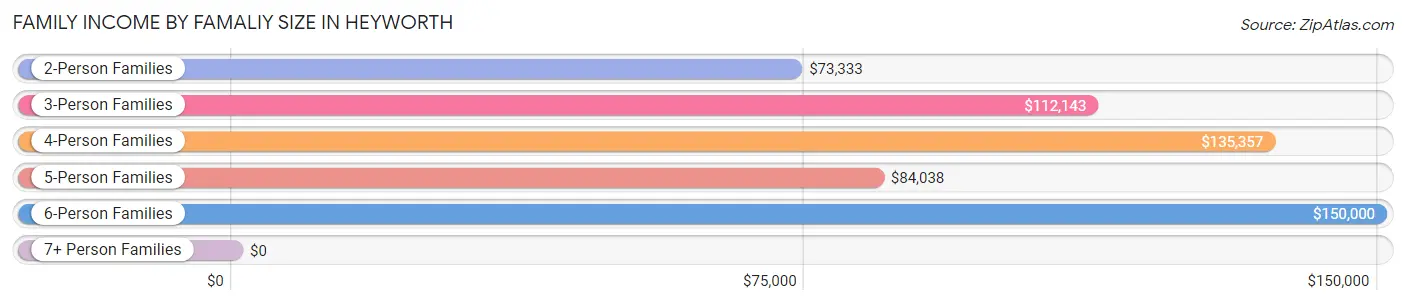
| Income Bracket | # Families | Median Income |
| 2-Person Families | 324 (44.7%) | $73,333 |
| 3-Person Families | 140 (19.3%) | $112,143 |
| 4-Person Families | 124 (17.1%) | $135,357 |
| 5-Person Families | 104 (14.3%) | $84,038 |
| 6-Person Families | 30 (4.1%) | $150,000 |
| 7+ Person Families | 3 (0.4%) | $0 |
| Total | 725 (100.0%) | $97,938 |
Family Income by Number of Earners in Heyworth
The median family income in Heyworth is $97,938, with families comprising 2 earners (325) having the highest median family income of $132,841, while families with no earners (126) have the lowest median family income of $47,625, accounting for 44.8% and 17.4% of families, respectively.
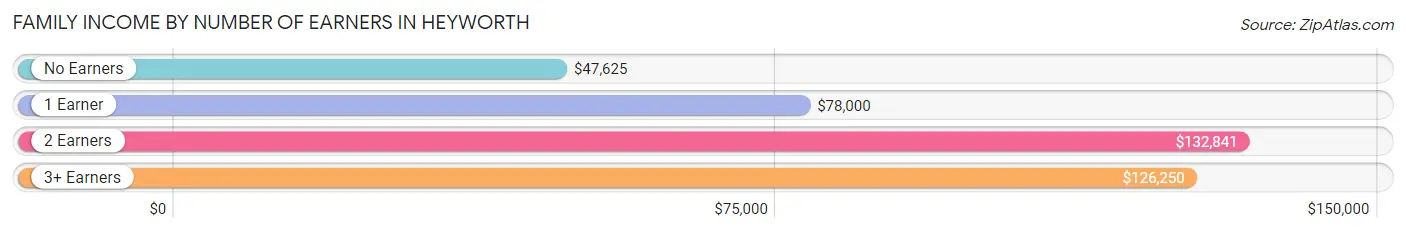
| Number of Earners | # Families | Median Income |
| No Earners | 126 (17.4%) | $47,625 |
| 1 Earner | 196 (27.0%) | $78,000 |
| 2 Earners | 325 (44.8%) | $132,841 |
| 3+ Earners | 78 (10.8%) | $126,250 |
| Total | 725 (100.0%) | $97,938 |
Household Income in Heyworth
Household Income Brackets in Heyworth
With 184 households falling in the category, the $100,000 to $149,999 income range is the most frequent in Heyworth, accounting for 18.8% of all households. In contrast, only 16 households (1.6%) fall into the $15,000 to $24,999 income bracket, making it the least populous group.
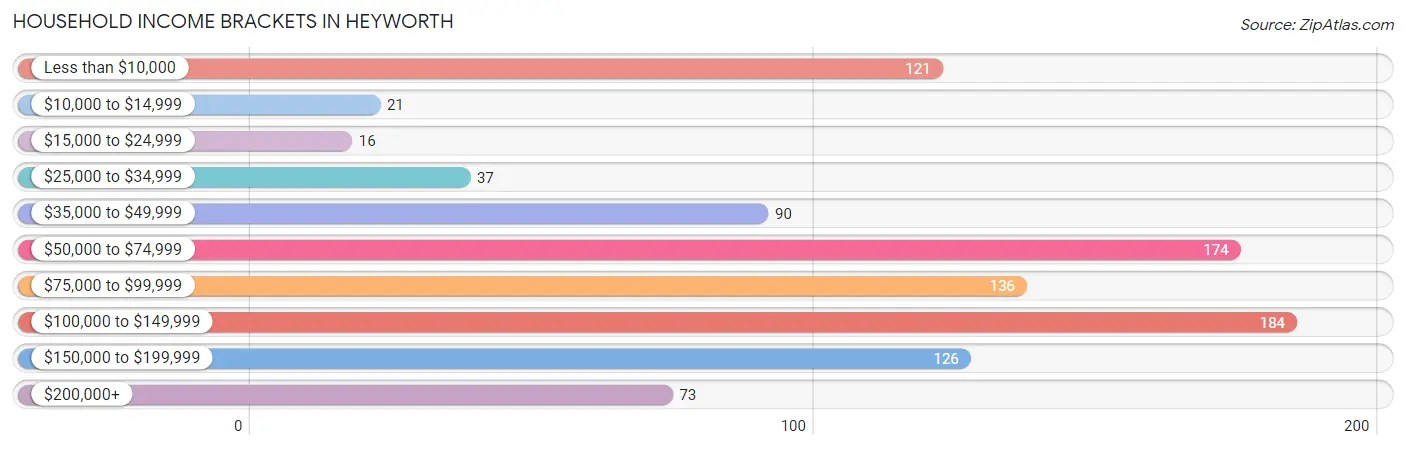
| Income Bracket | # Households | % Households |
| Less than $10,000 | 121 | 12.4% |
| $10,000 to $14,999 | 21 | 2.1% |
| $15,000 to $24,999 | 16 | 1.6% |
| $25,000 to $34,999 | 37 | 3.8% |
| $35,000 to $49,999 | 90 | 9.2% |
| $50,000 to $74,999 | 174 | 17.8% |
| $75,000 to $99,999 | 136 | 13.9% |
| $100,000 to $149,999 | 184 | 18.8% |
| $150,000 to $199,999 | 126 | 12.9% |
| $200,000+ | 73 | 7.5% |
Household Income by Householder Age in Heyworth
The median household income in Heyworth is $83,462, with the highest median household income of $104,904 found in the 25 to 44 years age bracket for the primary householder. A total of 323 households (33.0%) fall into this category.
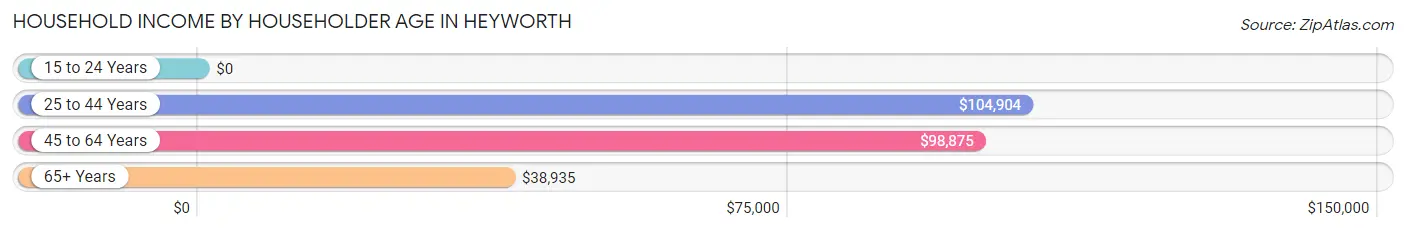
| Income Bracket | # Households | Median Income |
| 15 to 24 Years | 0 (0.0%) | $0 |
| 25 to 44 Years | 323 (33.0%) | $104,904 |
| 45 to 64 Years | 344 (35.2%) | $98,875 |
| 65+ Years | 311 (31.8%) | $38,935 |
| Total | 978 (100.0%) | $83,462 |
Poverty in Heyworth
Income Below Poverty by Sex and Age in Heyworth
With 5.4% poverty level for males and 12.0% for females among the residents of Heyworth, 45 to 54 year old males and 75 year old and over females are the most vulnerable to poverty, with 28 males (15.6%) and 67 females (55.8%) in their respective age groups living below the poverty level.
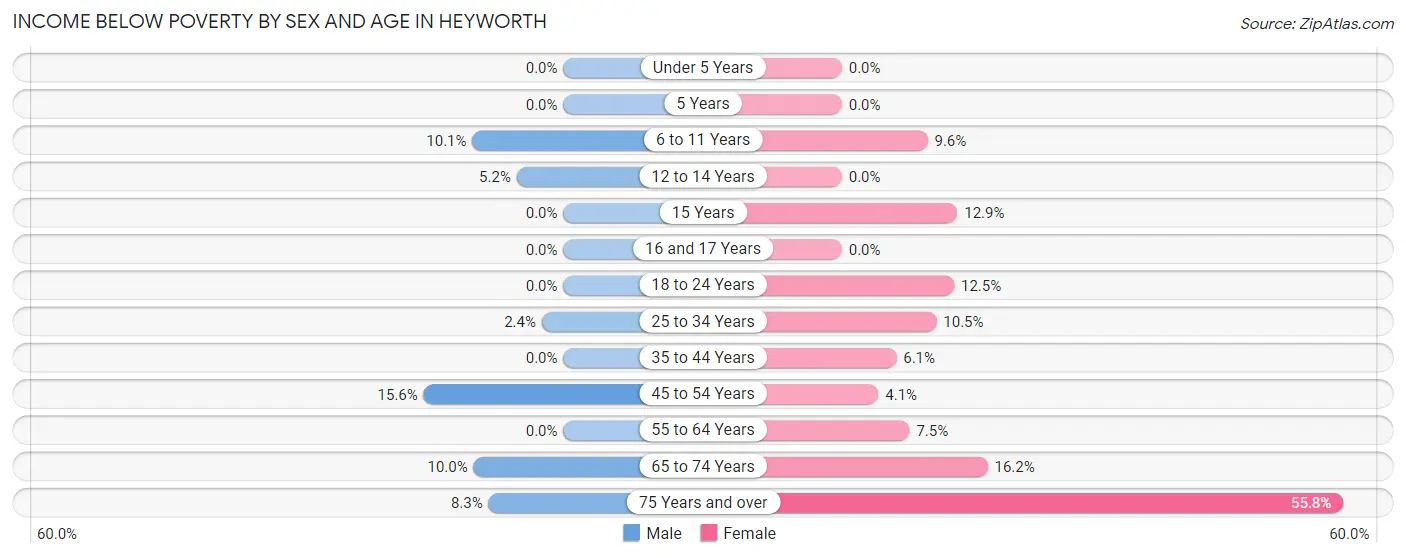
| Age Bracket | Male | Female |
| Under 5 Years | 0 (0.0%) | 0 (0.0%) |
| 5 Years | 0 (0.0%) | 0 (0.0%) |
| 6 to 11 Years | 16 (10.1%) | 17 (9.6%) |
| 12 to 14 Years | 4 (5.2%) | 0 (0.0%) |
| 15 Years | 0 (0.0%) | 9 (12.9%) |
| 16 and 17 Years | 0 (0.0%) | 0 (0.0%) |
| 18 to 24 Years | 0 (0.0%) | 13 (12.5%) |
| 25 to 34 Years | 3 (2.4%) | 10 (10.5%) |
| 35 to 44 Years | 0 (0.0%) | 15 (6.1%) |
| 45 to 54 Years | 28 (15.6%) | 5 (4.1%) |
| 55 to 64 Years | 0 (0.0%) | 15 (7.5%) |
| 65 to 74 Years | 11 (10.0%) | 25 (16.2%) |
| 75 Years and over | 5 (8.3%) | 67 (55.8%) |
| Total | 67 (5.4%) | 176 (12.0%) |
Income Above Poverty by Sex and Age in Heyworth
According to the poverty statistics in Heyworth, males aged under 5 years and females aged under 5 years are the age groups that are most secure financially, with 100.0% of males and 100.0% of females in these age groups living above the poverty line.
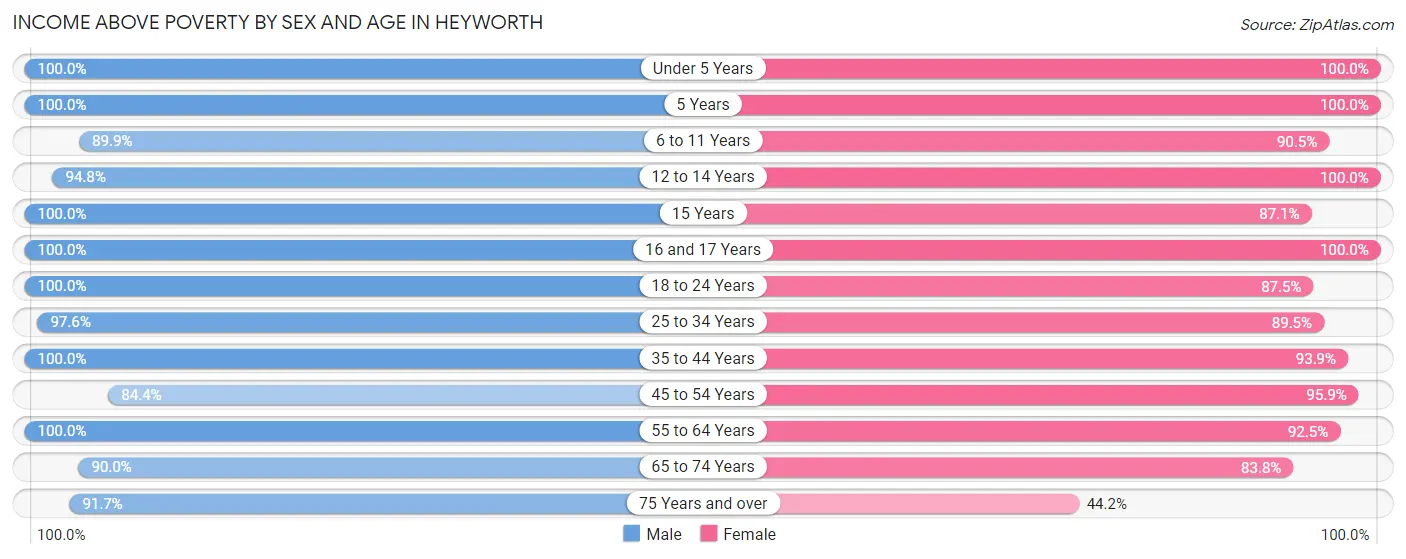
| Age Bracket | Male | Female |
| Under 5 Years | 50 (100.0%) | 38 (100.0%) |
| 5 Years | 12 (100.0%) | 21 (100.0%) |
| 6 to 11 Years | 142 (89.9%) | 161 (90.4%) |
| 12 to 14 Years | 73 (94.8%) | 60 (100.0%) |
| 15 Years | 19 (100.0%) | 61 (87.1%) |
| 16 and 17 Years | 46 (100.0%) | 62 (100.0%) |
| 18 to 24 Years | 85 (100.0%) | 91 (87.5%) |
| 25 to 34 Years | 122 (97.6%) | 85 (89.5%) |
| 35 to 44 Years | 153 (100.0%) | 232 (93.9%) |
| 45 to 54 Years | 152 (84.4%) | 118 (95.9%) |
| 55 to 64 Years | 160 (100.0%) | 184 (92.5%) |
| 65 to 74 Years | 99 (90.0%) | 129 (83.8%) |
| 75 Years and over | 55 (91.7%) | 53 (44.2%) |
| Total | 1,168 (94.6%) | 1,295 (88.0%) |
Income Below Poverty Among Married-Couple Families in Heyworth
The poverty statistics for married-couple families in Heyworth show that 2.4% or 14 of the total 597 families live below the poverty line. Families with 3 or 4 children have the highest poverty rate of 12.8%, comprising of 11 families. On the other hand, families with no children have the lowest poverty rate of 0.0%, which includes 0 families.
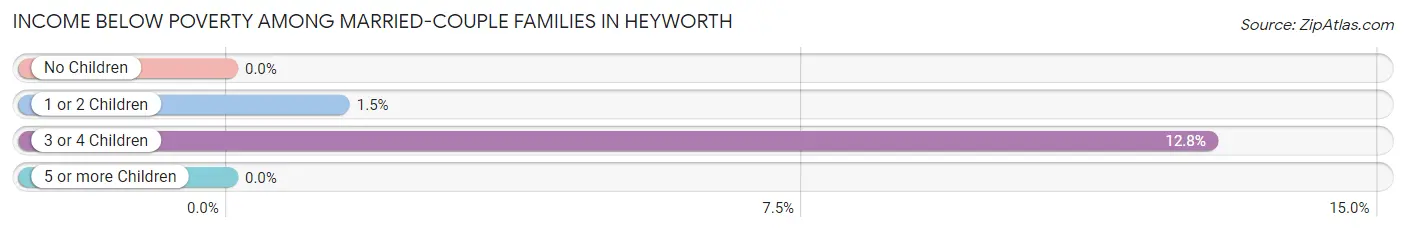
| Children | Above Poverty | Below Poverty |
| No Children | 303 (100.0%) | 0 (0.0%) |
| 1 or 2 Children | 202 (98.5%) | 3 (1.5%) |
| 3 or 4 Children | 75 (87.2%) | 11 (12.8%) |
| 5 or more Children | 3 (100.0%) | 0 (0.0%) |
| Total | 583 (97.7%) | 14 (2.4%) |
Income Below Poverty Among Single-Parent Households in Heyworth
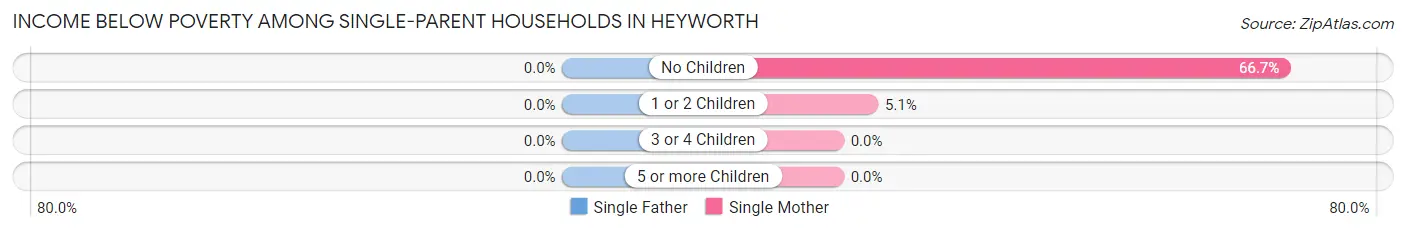
| Children | Single Father | Single Mother |
| No Children | 0 (0.0%) | 16 (66.7%) |
| 1 or 2 Children | 0 (0.0%) | 4 (5.1%) |
| 3 or 4 Children | 0 (0.0%) | 0 (0.0%) |
| 5 or more Children | 0 (0.0%) | 0 (0.0%) |
| Total | 0 (0.0%) | 20 (19.6%) |
Income Below Poverty Among Married-Couple vs Single-Parent Households in Heyworth
The poverty data for Heyworth shows that 14 of the married-couple family households (2.4%) and 20 of the single-parent households (15.6%) are living below the poverty level. Within the married-couple family households, those with 3 or 4 children have the highest poverty rate, with 11 households (12.8%) falling below the poverty line. Among the single-parent households, those with no children have the highest poverty rate, with 16 household (57.1%) living below poverty.
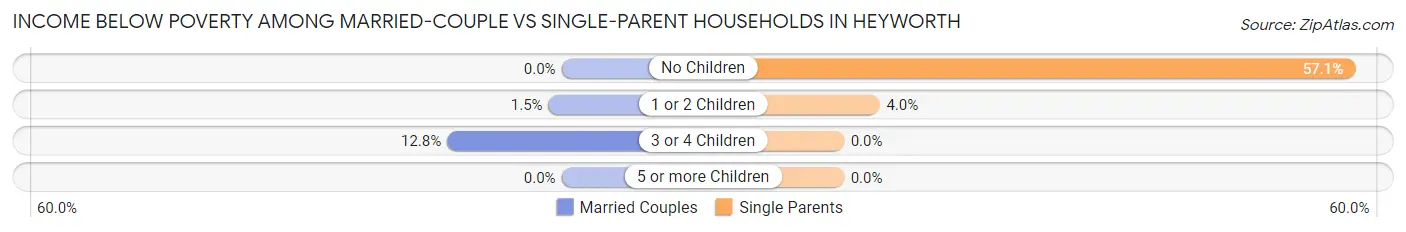
| Children | Married-Couple Families | Single-Parent Households |
| No Children | 0 (0.0%) | 16 (57.1%) |
| 1 or 2 Children | 3 (1.5%) | 4 (4.0%) |
| 3 or 4 Children | 11 (12.8%) | 0 (0.0%) |
| 5 or more Children | 0 (0.0%) | 0 (0.0%) |
| Total | 14 (2.4%) | 20 (15.6%) |
Race in Heyworth
The most populous races in Heyworth are White / Caucasian (2,605 | 95.6%), Hispanic or Latino (152 | 5.6%), and Two or more Races (66 | 2.4%).
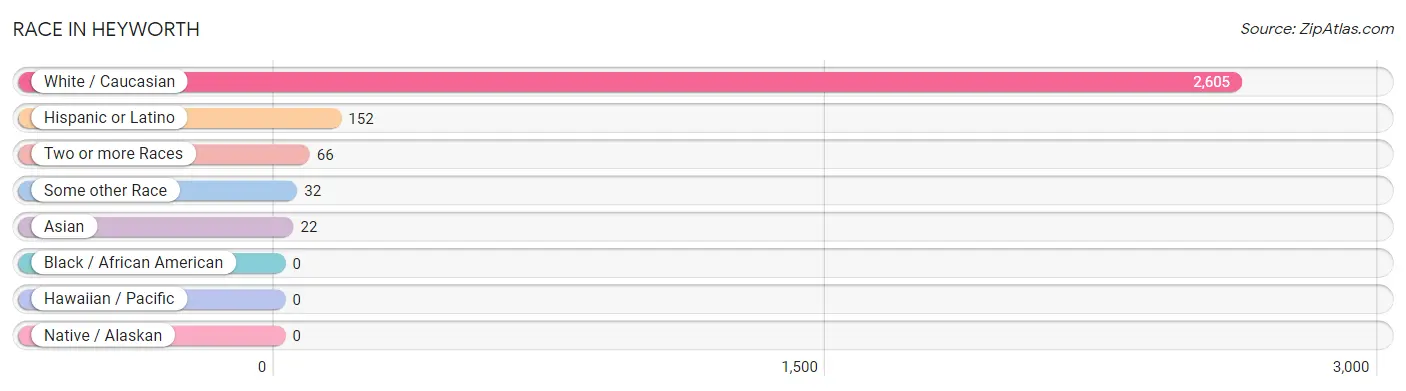
| Race | # Population | % Population |
| Asian | 22 | 0.8% |
| Black / African American | 0 | 0.0% |
| Hawaiian / Pacific | 0 | 0.0% |
| Hispanic or Latino | 152 | 5.6% |
| Native / Alaskan | 0 | 0.0% |
| White / Caucasian | 2,605 | 95.6% |
| Two or more Races | 66 | 2.4% |
| Some other Race | 32 | 1.2% |
| Total | 2,725 | 100.0% |
Ancestry in Heyworth
The most populous ancestries reported in Heyworth are German (767 | 28.1%), Irish (508 | 18.6%), English (443 | 16.3%), American (188 | 6.9%), and Mexican (133 | 4.9%), together accounting for 74.8% of all Heyworth residents.
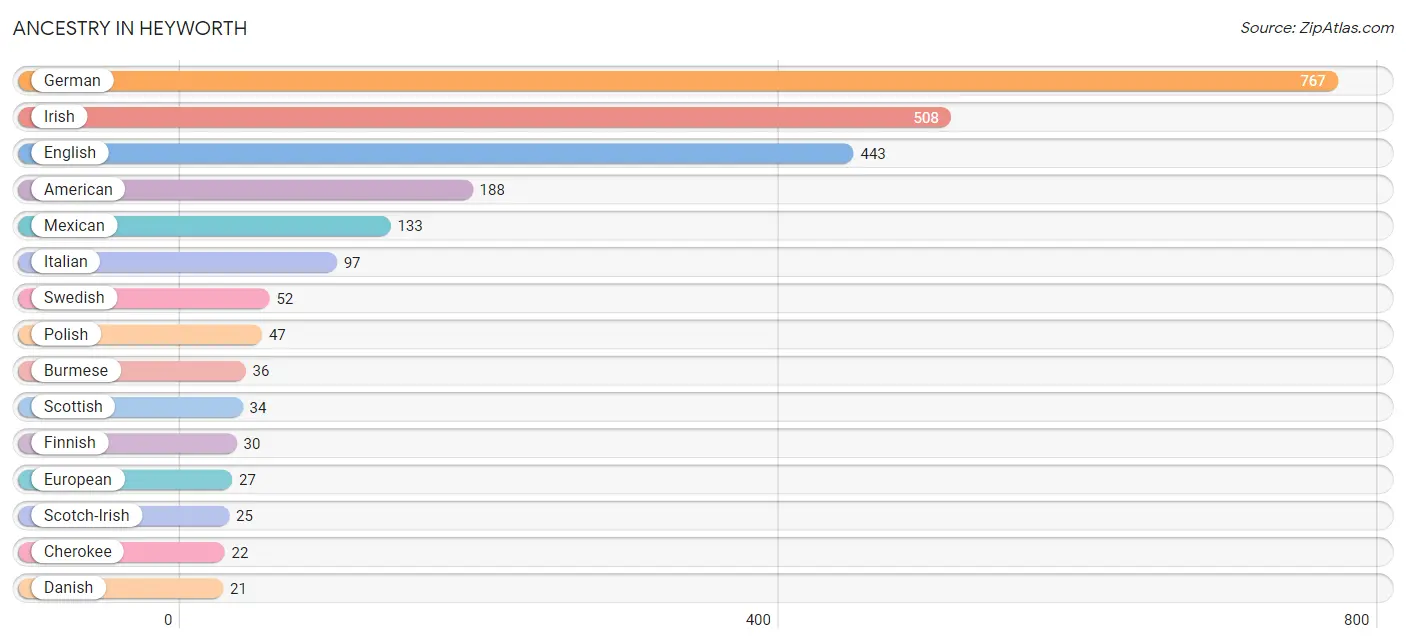
| Ancestry | # Population | % Population |
| American | 188 | 6.9% |
| Arab | 6 | 0.2% |
| Bolivian | 14 | 0.5% |
| British | 15 | 0.5% |
| Burmese | 36 | 1.3% |
| Cherokee | 22 | 0.8% |
| Choctaw | 6 | 0.2% |
| Croatian | 4 | 0.2% |
| Cuban | 5 | 0.2% |
| Czech | 4 | 0.2% |
| Danish | 21 | 0.8% |
| Dutch | 6 | 0.2% |
| Eastern European | 5 | 0.2% |
| English | 443 | 16.3% |
| European | 27 | 1.0% |
| Finnish | 30 | 1.1% |
| French | 3 | 0.1% |
| French Canadian | 5 | 0.2% |
| German | 767 | 28.1% |
| Hungarian | 7 | 0.3% |
| Indian (Asian) | 10 | 0.4% |
| Irish | 508 | 18.6% |
| Italian | 97 | 3.6% |
| Lebanese | 6 | 0.2% |
| Lithuanian | 9 | 0.3% |
| Mexican | 133 | 4.9% |
| Northern European | 5 | 0.2% |
| Norwegian | 7 | 0.3% |
| Pennsylvania German | 10 | 0.4% |
| Polish | 47 | 1.7% |
| Russian | 5 | 0.2% |
| Scotch-Irish | 25 | 0.9% |
| Scottish | 34 | 1.3% |
| Slovak | 15 | 0.5% |
| South American | 14 | 0.5% |
| Swedish | 52 | 1.9% |
| Welsh | 3 | 0.1% |
| Yugoslavian | 12 | 0.4% | View All 38 Rows |
Immigrants in Heyworth
The most numerous immigrant groups reported in Heyworth came from Asia (22 | 0.8%), Central America (19 | 0.7%), Latin America (19 | 0.7%), Mexico (19 | 0.7%), and South Central Asia (12 | 0.4%), together accounting for 3.3% of all Heyworth residents.
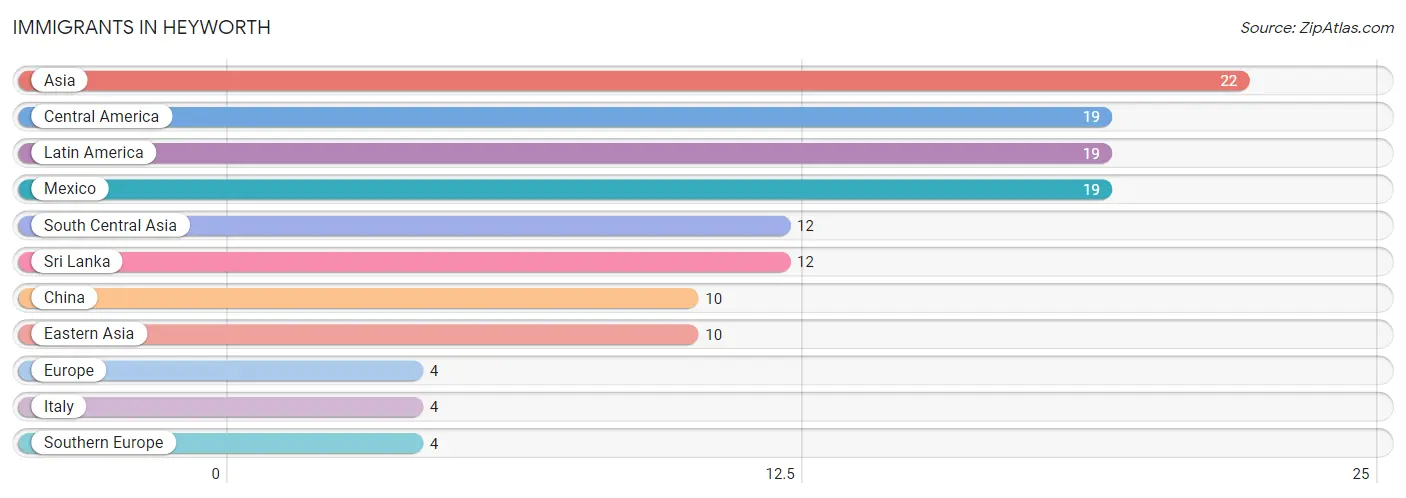
| Immigration Origin | # Population | % Population |
| Asia | 22 | 0.8% |
| Central America | 19 | 0.7% |
| China | 10 | 0.4% |
| Eastern Asia | 10 | 0.4% |
| Europe | 4 | 0.2% |
| Italy | 4 | 0.2% |
| Latin America | 19 | 0.7% |
| Mexico | 19 | 0.7% |
| South Central Asia | 12 | 0.4% |
| Southern Europe | 4 | 0.2% |
| Sri Lanka | 12 | 0.4% | View All 11 Rows |
Sex and Age in Heyworth
Sex and Age in Heyworth
The most populous age groups in Heyworth are 10 to 14 Years (149 | 12.0%) for men and 40 to 44 Years (165 | 11.1%) for women.
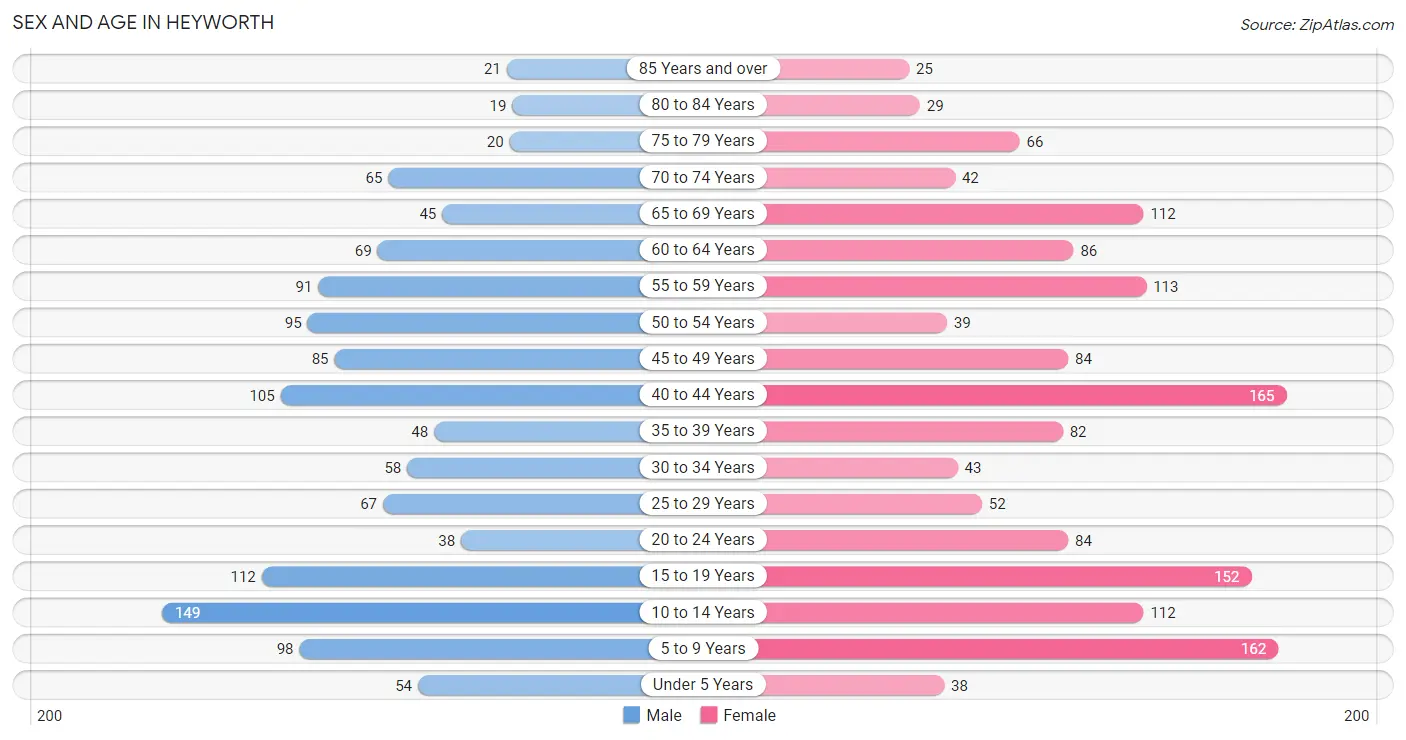
| Age Bracket | Male | Female |
| Under 5 Years | 54 (4.4%) | 38 (2.6%) |
| 5 to 9 Years | 98 (7.9%) | 162 (10.9%) |
| 10 to 14 Years | 149 (12.0%) | 112 (7.5%) |
| 15 to 19 Years | 112 (9.0%) | 152 (10.2%) |
| 20 to 24 Years | 38 (3.1%) | 84 (5.7%) |
| 25 to 29 Years | 67 (5.4%) | 52 (3.5%) |
| 30 to 34 Years | 58 (4.7%) | 43 (2.9%) |
| 35 to 39 Years | 48 (3.9%) | 82 (5.5%) |
| 40 to 44 Years | 105 (8.5%) | 165 (11.1%) |
| 45 to 49 Years | 85 (6.9%) | 84 (5.7%) |
| 50 to 54 Years | 95 (7.7%) | 39 (2.6%) |
| 55 to 59 Years | 91 (7.3%) | 113 (7.6%) |
| 60 to 64 Years | 69 (5.6%) | 86 (5.8%) |
| 65 to 69 Years | 45 (3.6%) | 112 (7.5%) |
| 70 to 74 Years | 65 (5.2%) | 42 (2.8%) |
| 75 to 79 Years | 20 (1.6%) | 66 (4.4%) |
| 80 to 84 Years | 19 (1.5%) | 29 (1.9%) |
| 85 Years and over | 21 (1.7%) | 25 (1.7%) |
| Total | 1,239 (100.0%) | 1,486 (100.0%) |
Families and Households in Heyworth
Median Family Size in Heyworth
The median family size in Heyworth is 3.31 persons per family, with married-couple families (597 | 82.3%) accounting for the largest median family size of 3.37 persons per family. On the other hand, single male/father families (26 | 3.6%) represent the smallest median family size with 2.08 persons per family.
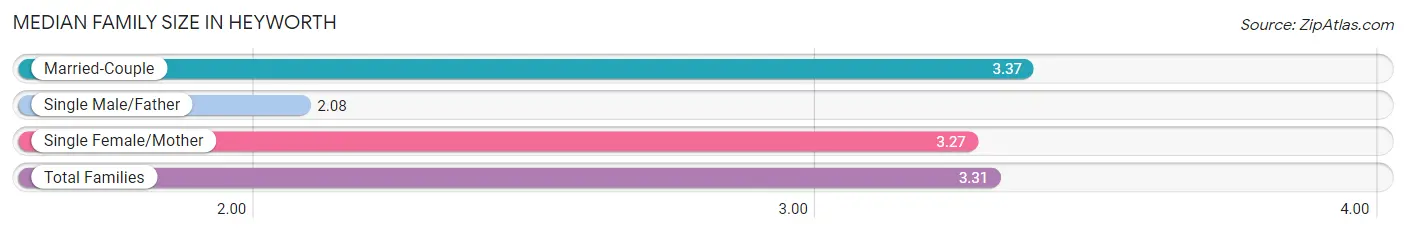
| Family Type | # Families | Family Size |
| Married-Couple | 597 (82.3%) | 3.37 |
| Single Male/Father | 26 (3.6%) | 2.08 |
| Single Female/Mother | 102 (14.1%) | 3.27 |
| Total Families | 725 (100.0%) | 3.31 |
Median Household Size in Heyworth
The median household size in Heyworth is 2.79 persons per household, with single female/mother households (102 | 10.4%) accounting for the largest median household size of 3.46 persons per household. non-family households (253 | 25.9%) represent the smallest median household size with 1.17 persons per household.
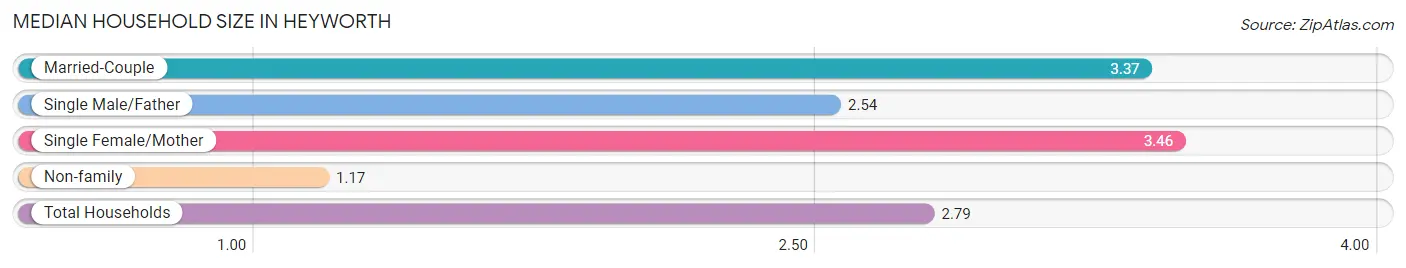
| Household Type | # Households | Household Size |
| Married-Couple | 597 (61.0%) | 3.37 |
| Single Male/Father | 26 (2.7%) | 2.54 |
| Single Female/Mother | 102 (10.4%) | 3.46 |
| Non-family | 253 (25.9%) | 1.17 |
| Total Households | 978 (100.0%) | 2.79 |
Household Size by Marriage Status in Heyworth
Out of a total of 978 households in Heyworth, 725 (74.1%) are family households, while 253 (25.9%) are nonfamily households. The most numerous type of family households are 2-person households, comprising 308, and the most common type of nonfamily households are 1-person households, comprising 213.
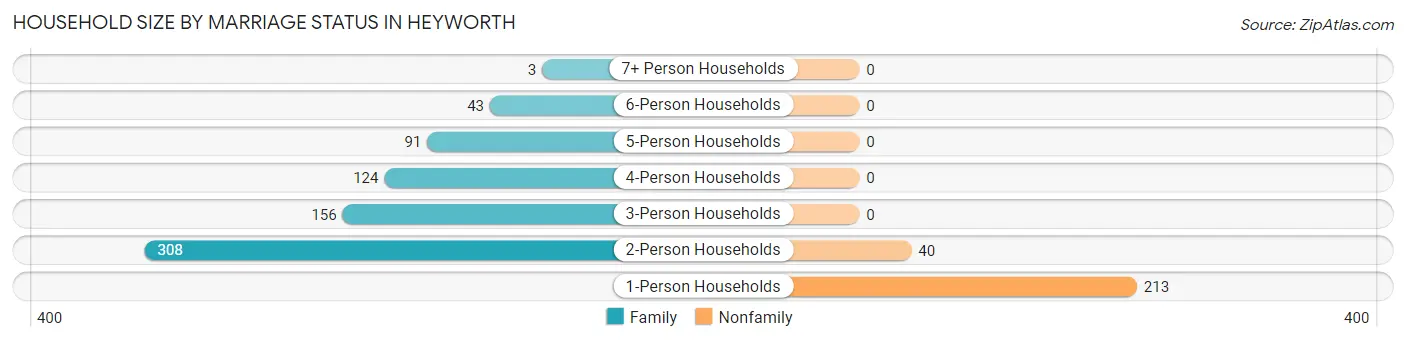
| Household Size | Family Households | Nonfamily Households |
| 1-Person Households | - | 213 (21.8%) |
| 2-Person Households | 308 (31.5%) | 40 (4.1%) |
| 3-Person Households | 156 (16.0%) | 0 (0.0%) |
| 4-Person Households | 124 (12.7%) | 0 (0.0%) |
| 5-Person Households | 91 (9.3%) | 0 (0.0%) |
| 6-Person Households | 43 (4.4%) | 0 (0.0%) |
| 7+ Person Households | 3 (0.3%) | 0 (0.0%) |
| Total | 725 (74.1%) | 253 (25.9%) |
Female Fertility in Heyworth
Fertility by Age in Heyworth
Average fertility rate in Heyworth is 54.0 births per 1,000 women. Women in the age bracket of 20 to 34 years have the highest fertility rate with 184.0 births per 1,000 women. Women in the age bracket of 20 to 34 years acount for 91.7% of all women with births.
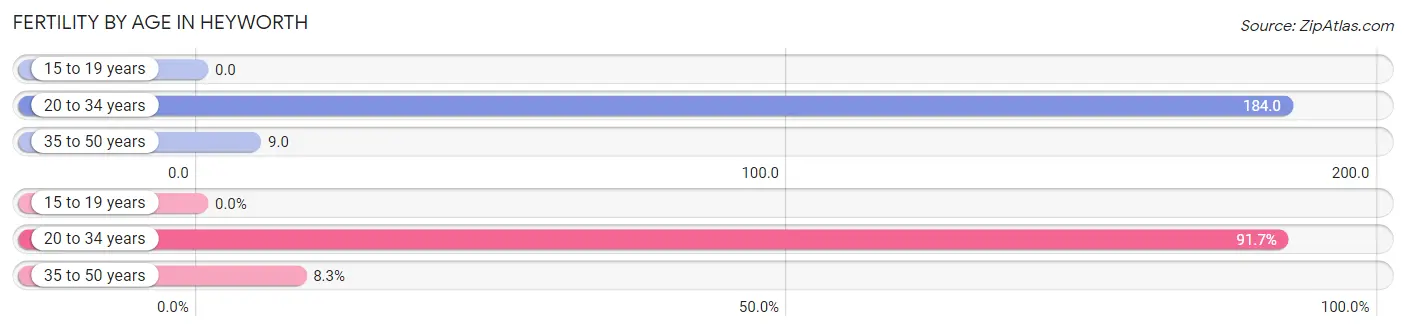
| Age Bracket | Women with Births | Births / 1,000 Women |
| 15 to 19 years | 0 (0.0%) | 0.0 |
| 20 to 34 years | 33 (91.7%) | 184.0 |
| 35 to 50 years | 3 (8.3%) | 9.0 |
| Total | 36 (100.0%) | 54.0 |
Fertility by Age by Marriage Status in Heyworth
25.0% of women with births (36) in Heyworth are married. The highest percentage of unmarried women with births falls into 20 to 34 years age bracket with 81.8% of them unmarried at the time of birth, while the lowest percentage of unmarried women with births belong to 35 to 50 years age bracket with 0.0% of them unmarried.
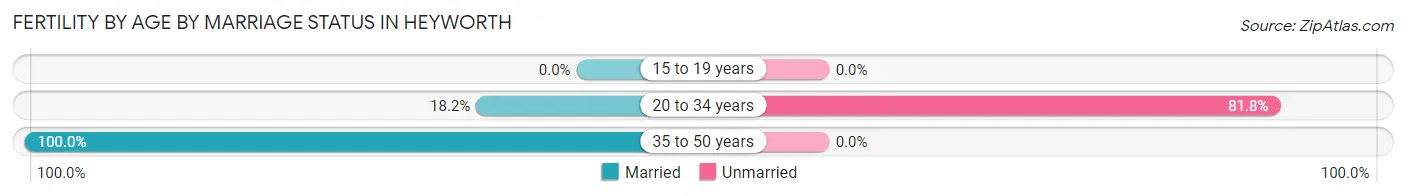
| Age Bracket | Married | Unmarried |
| 15 to 19 years | 0 (0.0%) | 0 (0.0%) |
| 20 to 34 years | 6 (18.2%) | 27 (81.8%) |
| 35 to 50 years | 3 (100.0%) | 0 (0.0%) |
| Total | 9 (25.0%) | 27 (75.0%) |
Fertility by Education in Heyworth
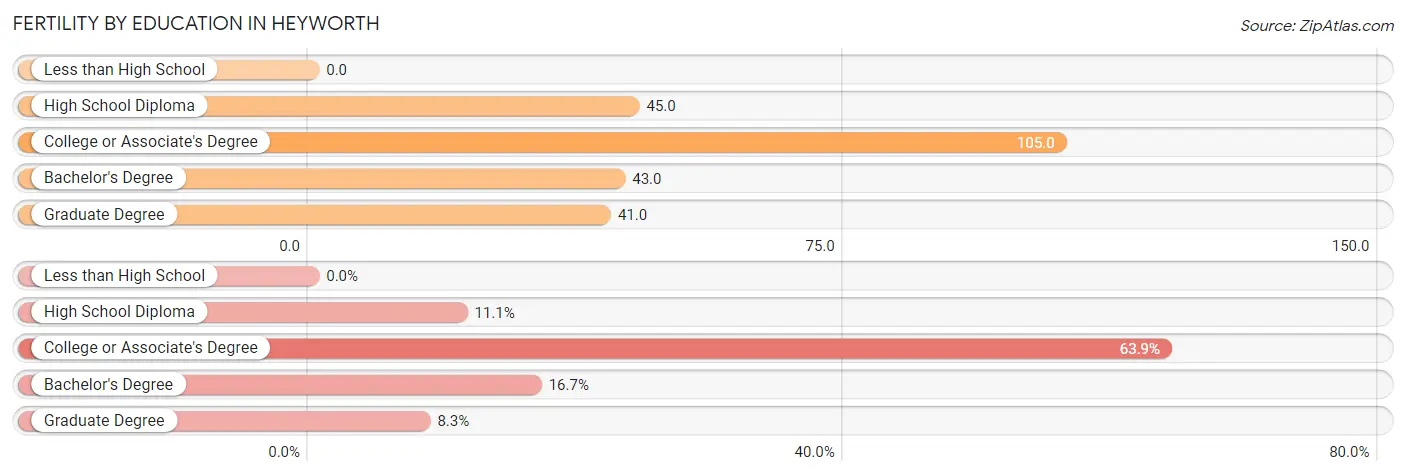
| Educational Attainment | Women with Births | Births / 1,000 Women |
| Less than High School | 0 (0.0%) | 0.0 |
| High School Diploma | 4 (11.1%) | 45.0 |
| College or Associate's Degree | 23 (63.9%) | 105.0 |
| Bachelor's Degree | 6 (16.7%) | 43.0 |
| Graduate Degree | 3 (8.3%) | 41.0 |
| Total | 36 (100.0%) | 54.0 |
Fertility by Education by Marriage Status in Heyworth
75.0% of women with births in Heyworth are unmarried. Women with the educational attainment of graduate degree are most likely to be married with 100.0% of them married at childbirth, while women with the educational attainment of high school diploma are least likely to be married with 100.0% of them unmarried at childbirth.
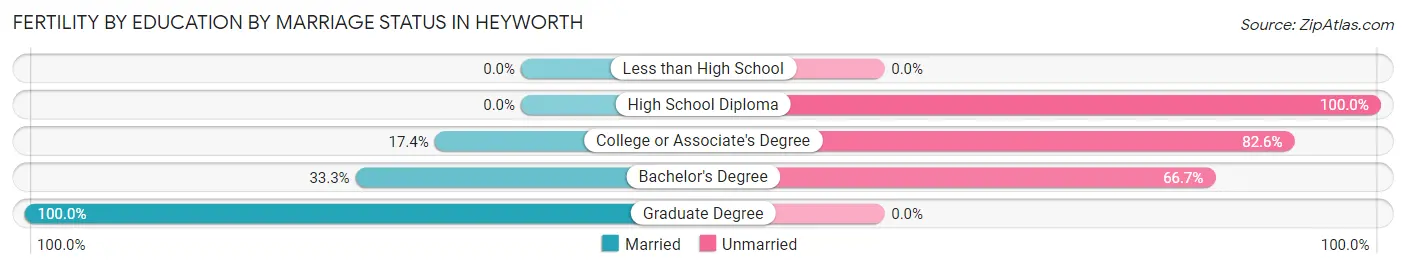
| Educational Attainment | Married | Unmarried |
| Less than High School | 0 (0.0%) | 0 (0.0%) |
| High School Diploma | 0 (0.0%) | 4 (100.0%) |
| College or Associate's Degree | 4 (17.4%) | 19 (82.6%) |
| Bachelor's Degree | 2 (33.3%) | 4 (66.7%) |
| Graduate Degree | 3 (100.0%) | 0 (0.0%) |
| Total | 9 (25.0%) | 27 (75.0%) |
Employment Characteristics in Heyworth
Employment by Class of Employer in Heyworth
Among the 1,196 employed individuals in Heyworth, private company employees (824 | 68.9%), local government employees (154 | 12.9%), and not-for-profit organizations (98 | 8.2%) make up the most common classes of employment.
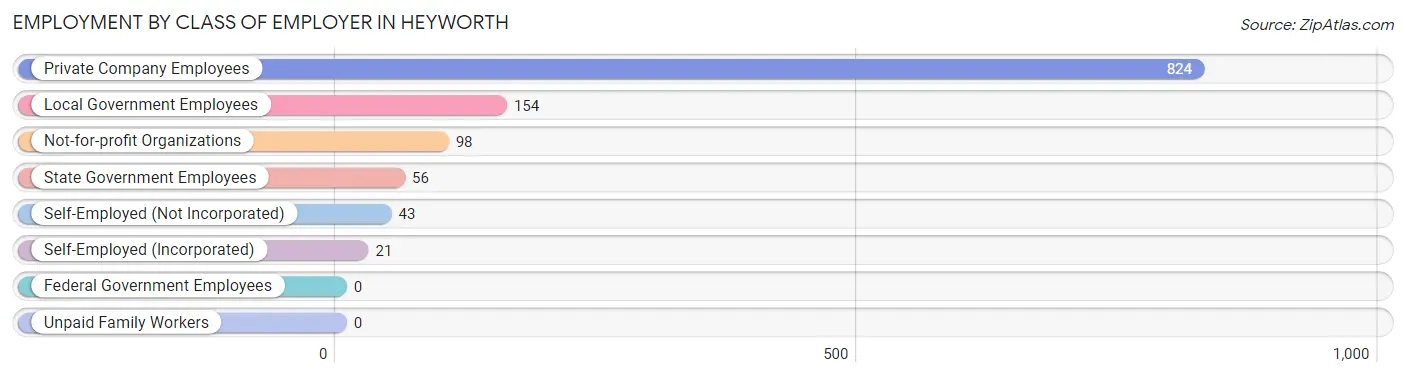
| Employer Class | # Employees | % Employees |
| Private Company Employees | 824 | 68.9% |
| Self-Employed (Incorporated) | 21 | 1.8% |
| Self-Employed (Not Incorporated) | 43 | 3.6% |
| Not-for-profit Organizations | 98 | 8.2% |
| Local Government Employees | 154 | 12.9% |
| State Government Employees | 56 | 4.7% |
| Federal Government Employees | 0 | 0.0% |
| Unpaid Family Workers | 0 | 0.0% |
| Total | 1,196 | 100.0% |
Employment Status by Age in Heyworth
According to the labor force statistics for Heyworth, out of the total population over 16 years of age (2,023), 60.9% or 1,232 individuals are in the labor force, with 2.7% or 33 of them unemployed. The age group with the highest labor force participation rate is 35 to 44 years, with 91.5% or 366 individuals in the labor force. Within the labor force, the 16 to 19 years age range has the highest percentage of unemployed individuals, with 17.3% or 14 of them being unemployed.
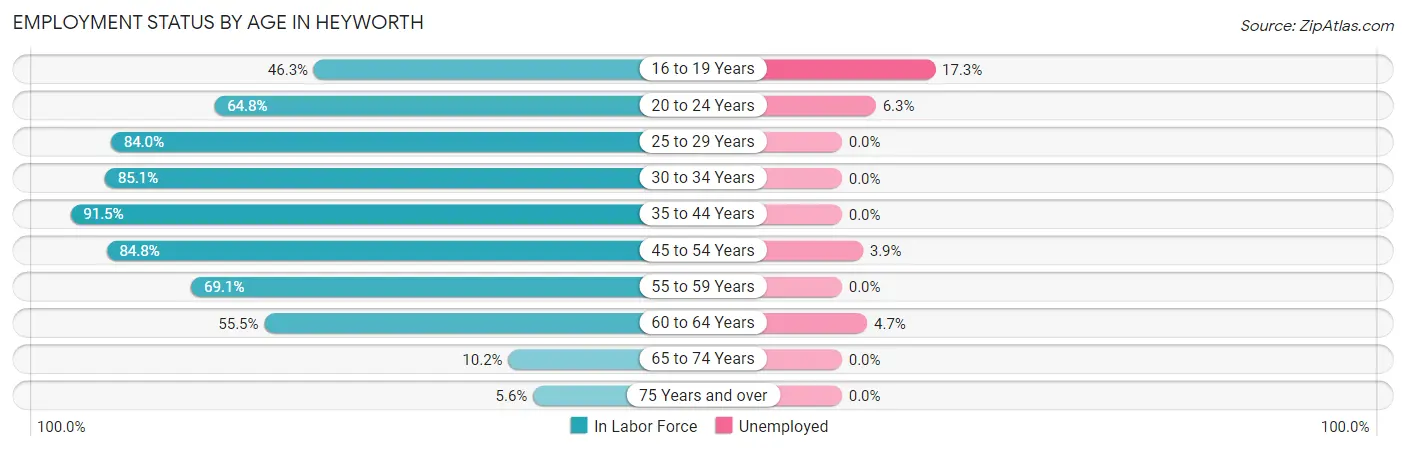
| Age Bracket | In Labor Force | Unemployed |
| 16 to 19 Years | 81 (46.3%) | 14 (17.3%) |
| 20 to 24 Years | 79 (64.8%) | 5 (6.3%) |
| 25 to 29 Years | 100 (84.0%) | 0 (0.0%) |
| 30 to 34 Years | 86 (85.1%) | 0 (0.0%) |
| 35 to 44 Years | 366 (91.5%) | 0 (0.0%) |
| 45 to 54 Years | 257 (84.8%) | 10 (3.9%) |
| 55 to 59 Years | 141 (69.1%) | 0 (0.0%) |
| 60 to 64 Years | 86 (55.5%) | 4 (4.7%) |
| 65 to 74 Years | 27 (10.2%) | 0 (0.0%) |
| 75 Years and over | 10 (5.6%) | 0 (0.0%) |
| Total | 1,232 (60.9%) | 33 (2.7%) |
Employment Status by Educational Attainment in Heyworth
According to labor force statistics for Heyworth, 80.8% of individuals (1,036) out of the total population between 25 and 64 years of age (1,282) are in the labor force, with 1.4% or 15 of them being unemployed. The group with the highest labor force participation rate are those with the educational attainment of college / associate degree, with 86.8% or 349 individuals in the labor force. Within the labor force, individuals with less than high school education have the highest percentage of unemployment, with 35.7% or 10 of them being unemployed.
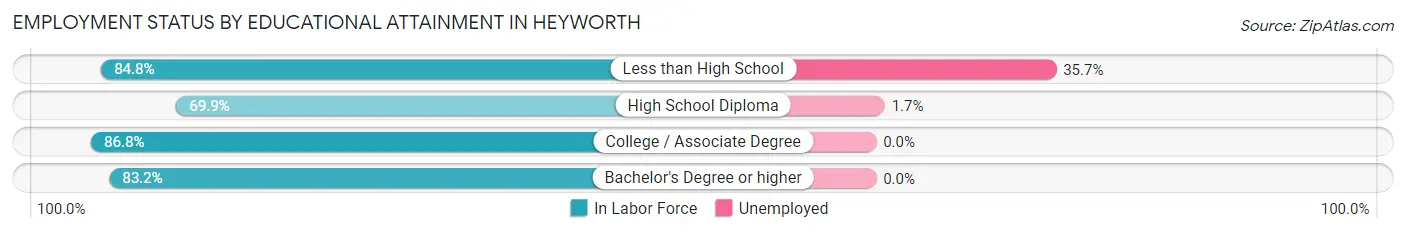
| Educational Attainment | In Labor Force | Unemployed |
| Less than High School | 28 (84.8%) | 12 (35.7%) |
| High School Diploma | 239 (69.9%) | 6 (1.7%) |
| College / Associate Degree | 349 (86.8%) | 0 (0.0%) |
| Bachelor's Degree or higher | 420 (83.2%) | 0 (0.0%) |
| Total | 1,036 (80.8%) | 18 (1.4%) |
Employment Occupations by Sex in Heyworth
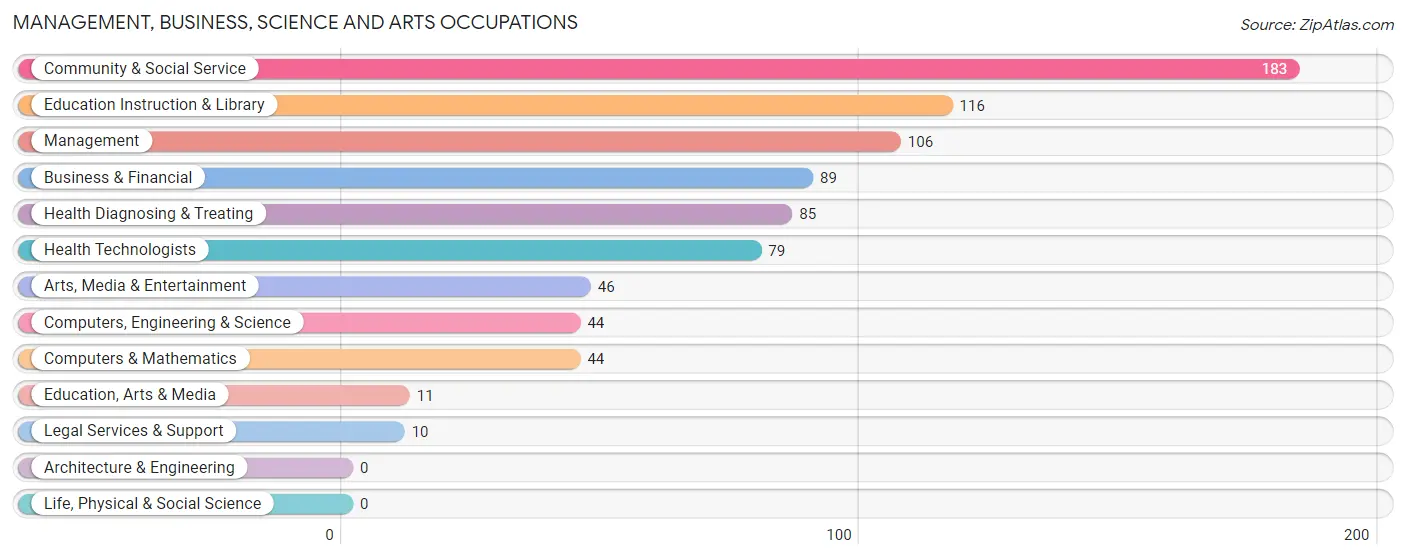
Management, Business, Science and Arts Occupations
The most common Management, Business, Science and Arts occupations in Heyworth are Community & Social Service (183 | 15.2%), Education Instruction & Library (116 | 9.7%), Management (106 | 8.8%), Business & Financial (89 | 7.4%), and Health Diagnosing & Treating (85 | 7.1%).
Management, Business, Science and Arts Occupations by Sex
Within the Management, Business, Science and Arts occupations in Heyworth, the most male-oriented occupations are Arts, Media & Entertainment (100.0%), Management (81.1%), and Computers, Engineering & Science (63.6%), while the most female-oriented occupations are Legal Services & Support (100.0%), Education Instruction & Library (78.4%), and Health Diagnosing & Treating (68.2%).
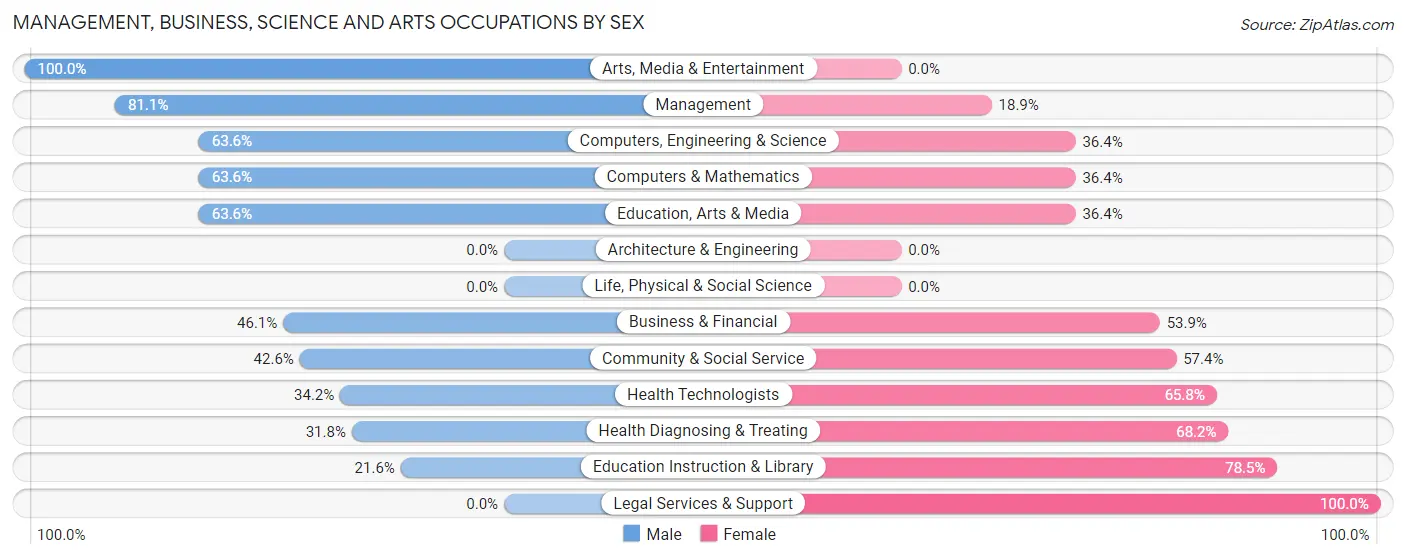
| Occupation | Male | Female |
| Management | 86 (81.1%) | 20 (18.9%) |
| Business & Financial | 41 (46.1%) | 48 (53.9%) |
| Computers, Engineering & Science | 28 (63.6%) | 16 (36.4%) |
| Computers & Mathematics | 28 (63.6%) | 16 (36.4%) |
| Architecture & Engineering | 0 (0.0%) | 0 (0.0%) |
| Life, Physical & Social Science | 0 (0.0%) | 0 (0.0%) |
| Community & Social Service | 78 (42.6%) | 105 (57.4%) |
| Education, Arts & Media | 7 (63.6%) | 4 (36.4%) |
| Legal Services & Support | 0 (0.0%) | 10 (100.0%) |
| Education Instruction & Library | 25 (21.5%) | 91 (78.4%) |
| Arts, Media & Entertainment | 46 (100.0%) | 0 (0.0%) |
| Health Diagnosing & Treating | 27 (31.8%) | 58 (68.2%) |
| Health Technologists | 27 (34.2%) | 52 (65.8%) |
| Total (Category) | 260 (51.3%) | 247 (48.7%) |
| Total (Overall) | 589 (49.1%) | 611 (50.9%) |
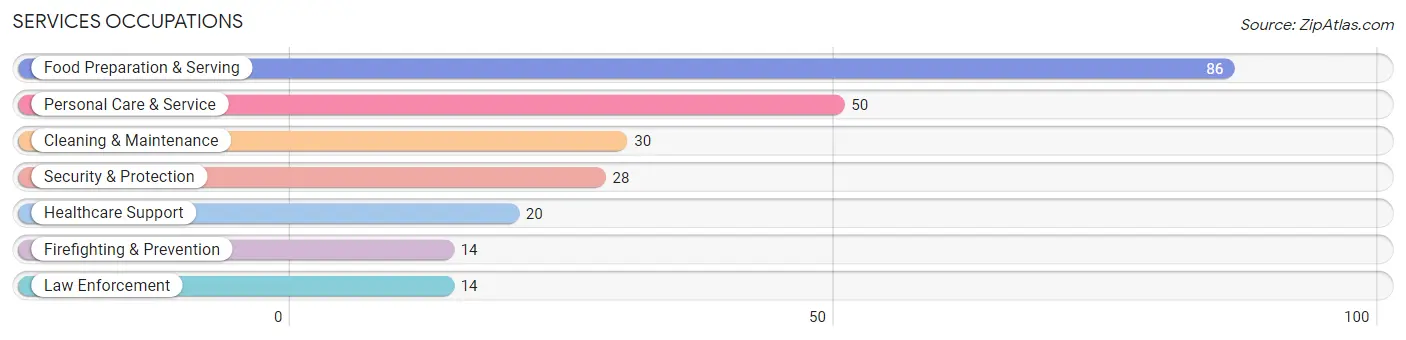
Services Occupations
The most common Services occupations in Heyworth are Food Preparation & Serving (86 | 7.2%), Personal Care & Service (50 | 4.2%), Cleaning & Maintenance (30 | 2.5%), Security & Protection (28 | 2.3%), and Healthcare Support (20 | 1.7%).
Services Occupations by Sex
Within the Services occupations in Heyworth, the most male-oriented occupations are Security & Protection (100.0%), Firefighting & Prevention (100.0%), and Law Enforcement (100.0%), while the most female-oriented occupations are Healthcare Support (100.0%), Personal Care & Service (86.0%), and Food Preparation & Serving (76.7%).
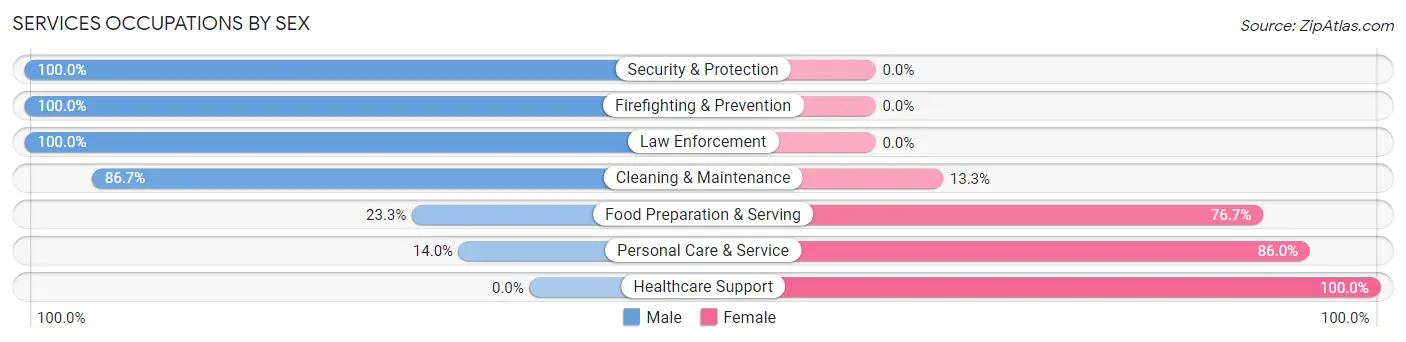
| Occupation | Male | Female |
| Healthcare Support | 0 (0.0%) | 20 (100.0%) |
| Security & Protection | 28 (100.0%) | 0 (0.0%) |
| Firefighting & Prevention | 14 (100.0%) | 0 (0.0%) |
| Law Enforcement | 14 (100.0%) | 0 (0.0%) |
| Food Preparation & Serving | 20 (23.3%) | 66 (76.7%) |
| Cleaning & Maintenance | 26 (86.7%) | 4 (13.3%) |
| Personal Care & Service | 7 (14.0%) | 43 (86.0%) |
| Total (Category) | 81 (37.9%) | 133 (62.2%) |
| Total (Overall) | 589 (49.1%) | 611 (50.9%) |
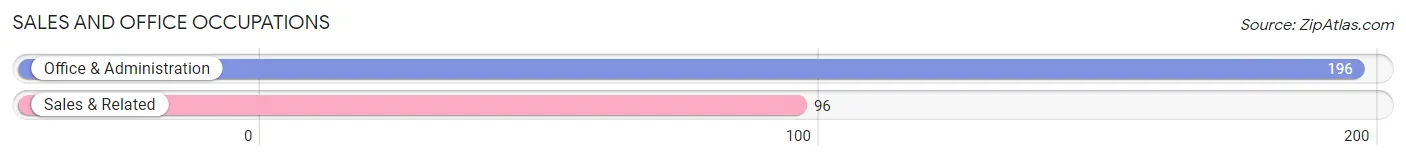
Sales and Office Occupations
The most common Sales and Office occupations in Heyworth are Office & Administration (196 | 16.3%), and Sales & Related (96 | 8.0%).
Sales and Office Occupations by Sex
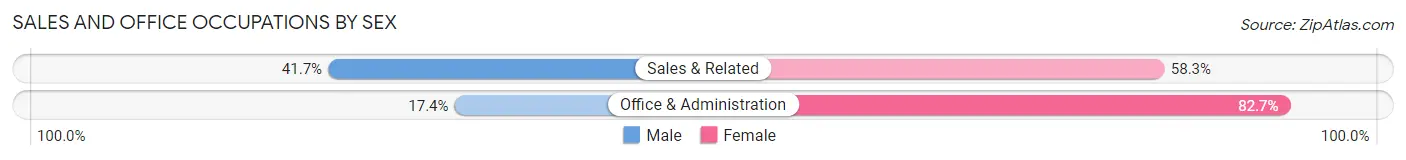
| Occupation | Male | Female |
| Sales & Related | 40 (41.7%) | 56 (58.3%) |
| Office & Administration | 34 (17.3%) | 162 (82.7%) |
| Total (Category) | 74 (25.3%) | 218 (74.7%) |
| Total (Overall) | 589 (49.1%) | 611 (50.9%) |
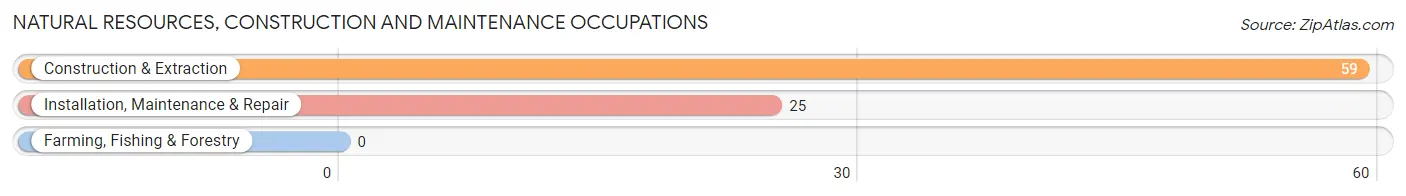
Natural Resources, Construction and Maintenance Occupations
The most common Natural Resources, Construction and Maintenance occupations in Heyworth are Construction & Extraction (59 | 4.9%), and Installation, Maintenance & Repair (25 | 2.1%).
Natural Resources, Construction and Maintenance Occupations by Sex
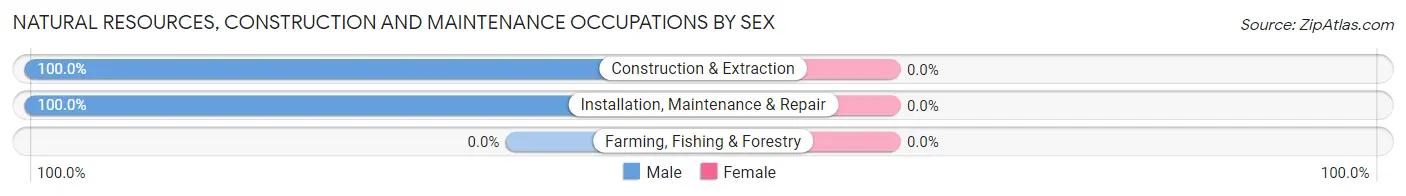
| Occupation | Male | Female |
| Farming, Fishing & Forestry | 0 (0.0%) | 0 (0.0%) |
| Construction & Extraction | 59 (100.0%) | 0 (0.0%) |
| Installation, Maintenance & Repair | 25 (100.0%) | 0 (0.0%) |
| Total (Category) | 84 (100.0%) | 0 (0.0%) |
| Total (Overall) | 589 (49.1%) | 611 (50.9%) |
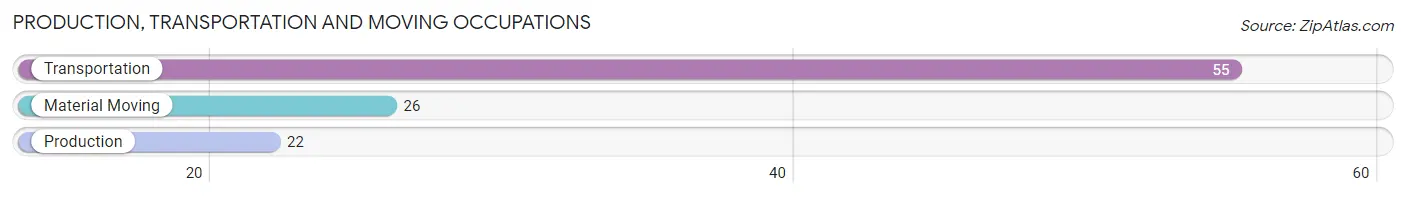
Production, Transportation and Moving Occupations
The most common Production, Transportation and Moving occupations in Heyworth are Transportation (55 | 4.6%), Material Moving (26 | 2.2%), and Production (22 | 1.8%).
Production, Transportation and Moving Occupations by Sex
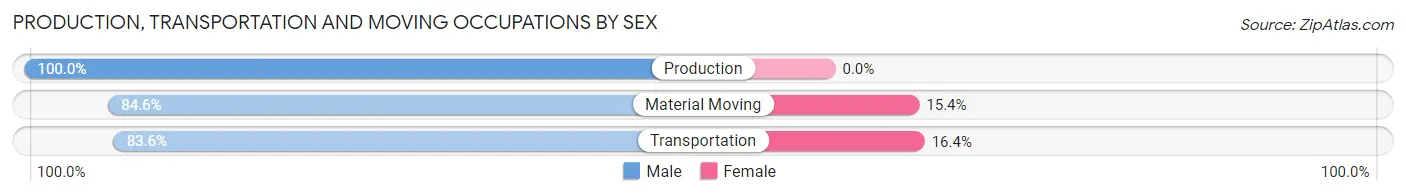
| Occupation | Male | Female |
| Production | 22 (100.0%) | 0 (0.0%) |
| Transportation | 46 (83.6%) | 9 (16.4%) |
| Material Moving | 22 (84.6%) | 4 (15.4%) |
| Total (Category) | 90 (87.4%) | 13 (12.6%) |
| Total (Overall) | 589 (49.1%) | 611 (50.9%) |
Employment Industries by Sex in Heyworth
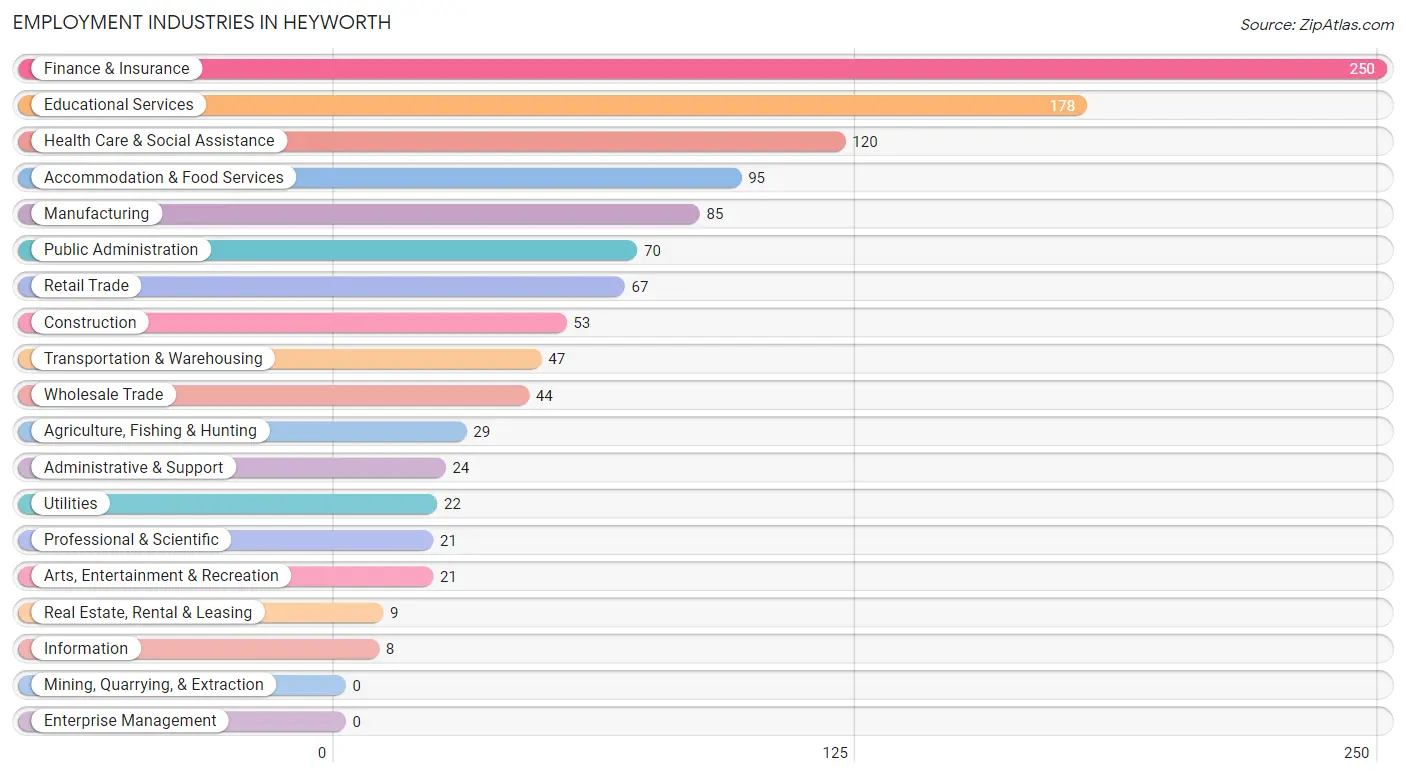
Employment Industries in Heyworth
The major employment industries in Heyworth include Finance & Insurance (250 | 20.8%), Educational Services (178 | 14.8%), Health Care & Social Assistance (120 | 10.0%), Accommodation & Food Services (95 | 7.9%), and Manufacturing (85 | 7.1%).
Employment Industries by Sex in Heyworth
The Heyworth industries that see more men than women are Arts, Entertainment & Recreation (100.0%), Construction (96.2%), and Utilities (86.4%), whereas the industries that tend to have a higher number of women are Real Estate, Rental & Leasing (100.0%), Educational Services (75.8%), and Accommodation & Food Services (72.6%).
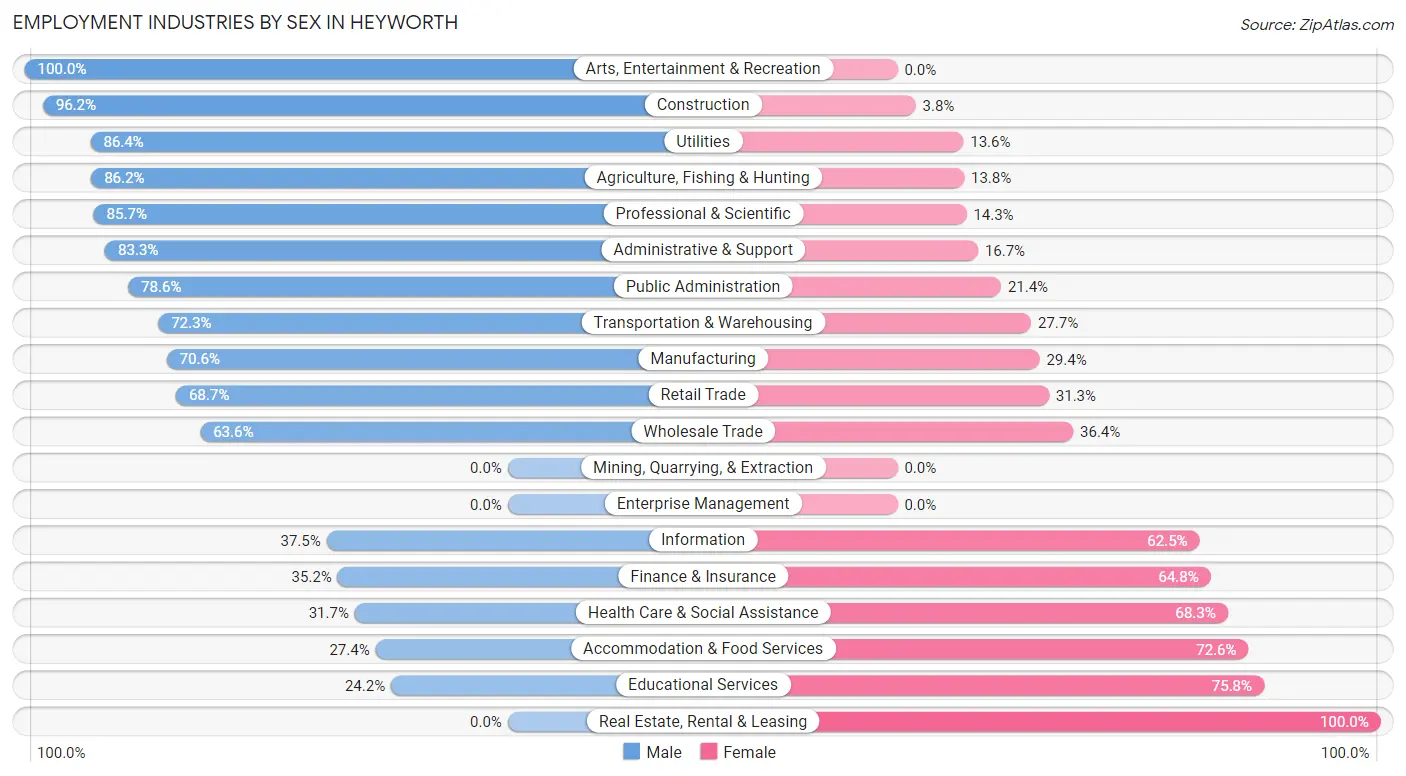
| Industry | Male | Female |
| Agriculture, Fishing & Hunting | 25 (86.2%) | 4 (13.8%) |
| Mining, Quarrying, & Extraction | 0 (0.0%) | 0 (0.0%) |
| Construction | 51 (96.2%) | 2 (3.8%) |
| Manufacturing | 60 (70.6%) | 25 (29.4%) |
| Wholesale Trade | 28 (63.6%) | 16 (36.4%) |
| Retail Trade | 46 (68.7%) | 21 (31.3%) |
| Transportation & Warehousing | 34 (72.3%) | 13 (27.7%) |
| Utilities | 19 (86.4%) | 3 (13.6%) |
| Information | 3 (37.5%) | 5 (62.5%) |
| Finance & Insurance | 88 (35.2%) | 162 (64.8%) |
| Real Estate, Rental & Leasing | 0 (0.0%) | 9 (100.0%) |
| Professional & Scientific | 18 (85.7%) | 3 (14.3%) |
| Enterprise Management | 0 (0.0%) | 0 (0.0%) |
| Administrative & Support | 20 (83.3%) | 4 (16.7%) |
| Educational Services | 43 (24.2%) | 135 (75.8%) |
| Health Care & Social Assistance | 38 (31.7%) | 82 (68.3%) |
| Arts, Entertainment & Recreation | 21 (100.0%) | 0 (0.0%) |
| Accommodation & Food Services | 26 (27.4%) | 69 (72.6%) |
| Public Administration | 55 (78.6%) | 15 (21.4%) |
| Total | 589 (49.1%) | 611 (50.9%) |
Education in Heyworth
School Enrollment in Heyworth
The most common levels of schooling among the 875 students in Heyworth are elementary school (246 | 28.1%), high school (232 | 26.5%), and middle school (227 | 25.9%).
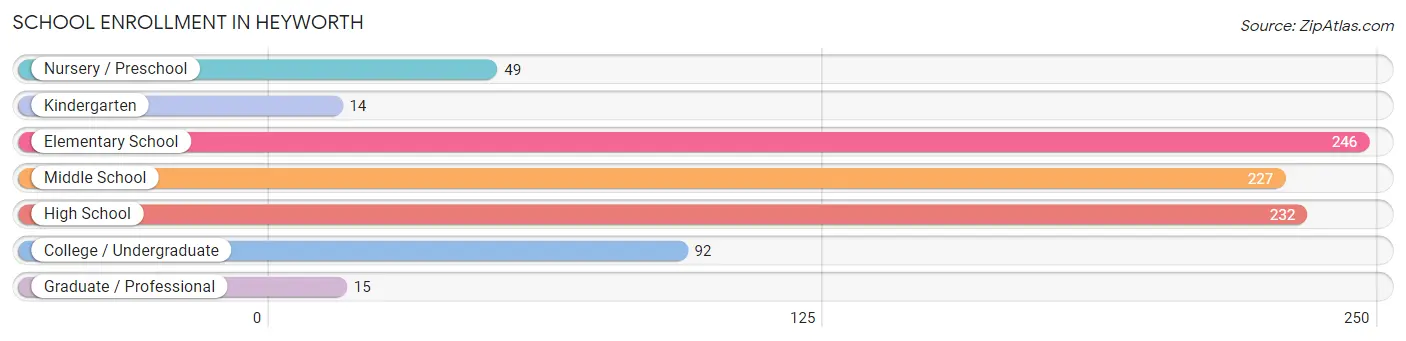
| School Level | # Students | % Students |
| Nursery / Preschool | 49 | 5.6% |
| Kindergarten | 14 | 1.6% |
| Elementary School | 246 | 28.1% |
| Middle School | 227 | 25.9% |
| High School | 232 | 26.5% |
| College / Undergraduate | 92 | 10.5% |
| Graduate / Professional | 15 | 1.7% |
| Total | 875 | 100.0% |
School Enrollment by Age by Funding Source in Heyworth
Out of a total of 875 students who are enrolled in schools in Heyworth, 84 (9.6%) attend a private institution, while the remaining 791 (90.4%) are enrolled in public schools. The age group of 18 to 19 year olds has the highest likelihood of being enrolled in private schools, with 13 (22.8% in the age bracket) enrolled. Conversely, the age group of 20 to 24 year olds has the lowest likelihood of being enrolled in a private school, with 49 (100.0% in the age bracket) attending a public institution.
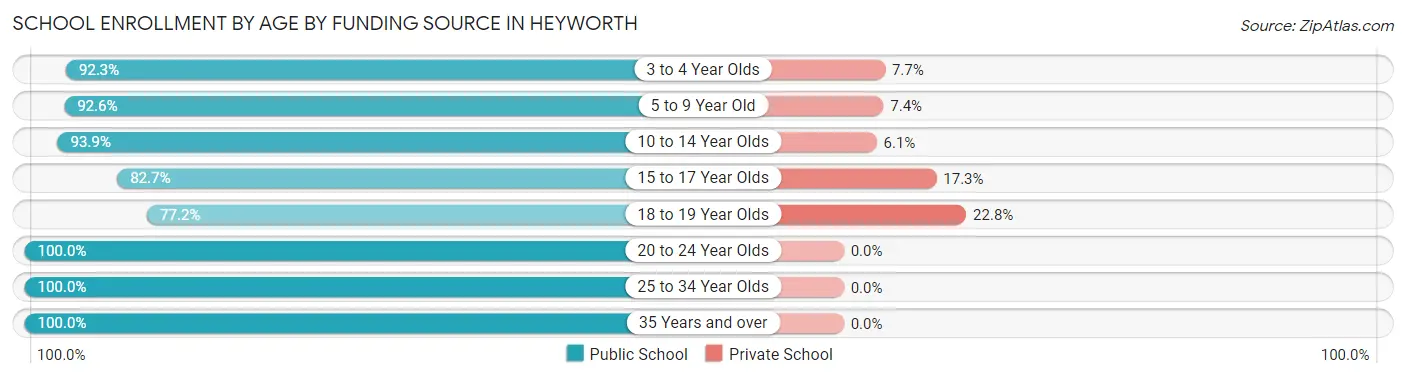
| Age Bracket | Public School | Private School |
| 3 to 4 Year Olds | 24 (92.3%) | 2 (7.7%) |
| 5 to 9 Year Old | 238 (92.6%) | 19 (7.4%) |
| 10 to 14 Year Olds | 245 (93.9%) | 16 (6.1%) |
| 15 to 17 Year Olds | 163 (82.7%) | 34 (17.3%) |
| 18 to 19 Year Olds | 44 (77.2%) | 13 (22.8%) |
| 20 to 24 Year Olds | 49 (100.0%) | 0 (0.0%) |
| 25 to 34 Year Olds | 9 (100.0%) | 0 (0.0%) |
| 35 Years and over | 19 (100.0%) | 0 (0.0%) |
| Total | 791 (90.4%) | 84 (9.6%) |
Educational Attainment by Field of Study in Heyworth
Science & technology (131 | 20.5%), business (120 | 18.8%), education (99 | 15.5%), bio, nature & agricultural (57 | 8.9%), and arts & humanities (57 | 8.9%) are the most common fields of study among 639 individuals in Heyworth who have obtained a bachelor's degree or higher.
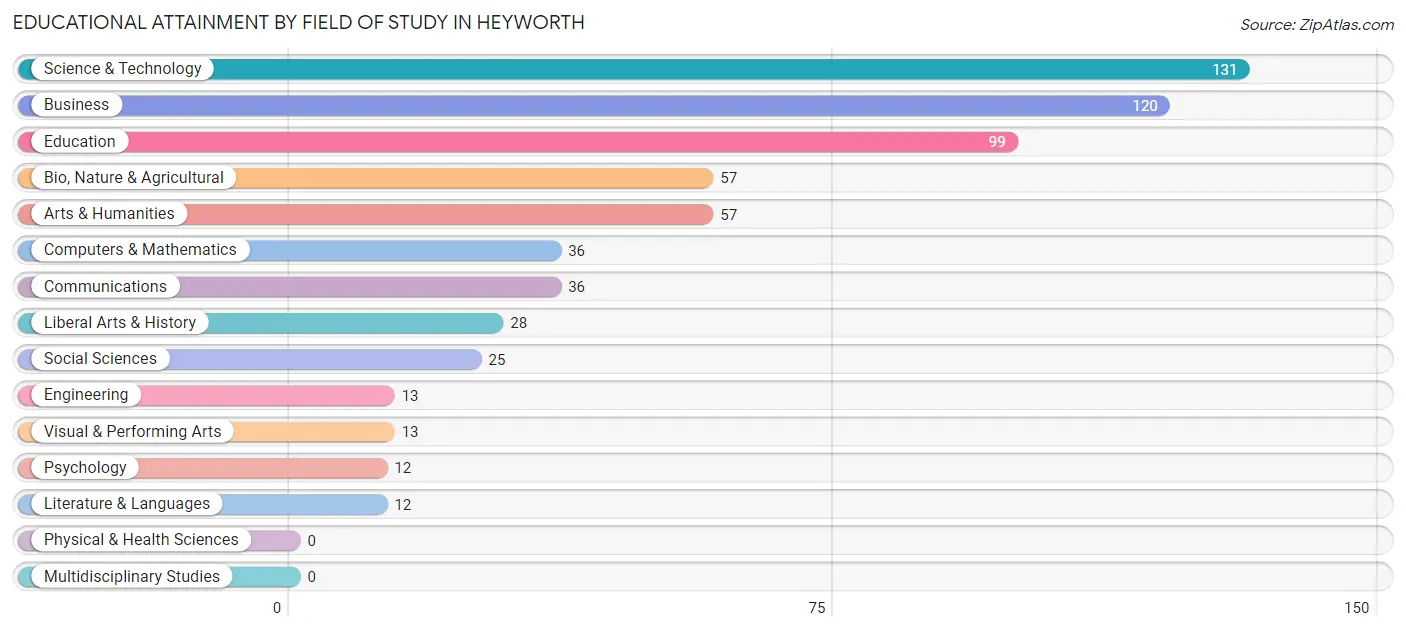
| Field of Study | # Graduates | % Graduates |
| Computers & Mathematics | 36 | 5.6% |
| Bio, Nature & Agricultural | 57 | 8.9% |
| Physical & Health Sciences | 0 | 0.0% |
| Psychology | 12 | 1.9% |
| Social Sciences | 25 | 3.9% |
| Engineering | 13 | 2.0% |
| Multidisciplinary Studies | 0 | 0.0% |
| Science & Technology | 131 | 20.5% |
| Business | 120 | 18.8% |
| Education | 99 | 15.5% |
| Literature & Languages | 12 | 1.9% |
| Liberal Arts & History | 28 | 4.4% |
| Visual & Performing Arts | 13 | 2.0% |
| Communications | 36 | 5.6% |
| Arts & Humanities | 57 | 8.9% |
| Total | 639 | 100.0% |
Transportation & Commute in Heyworth
Vehicle Availability by Sex in Heyworth
The most prevalent vehicle ownership categories in Heyworth are males with 2 vehicles (230, accounting for 39.3%) and females with 2 vehicles (189, making up 37.6%).
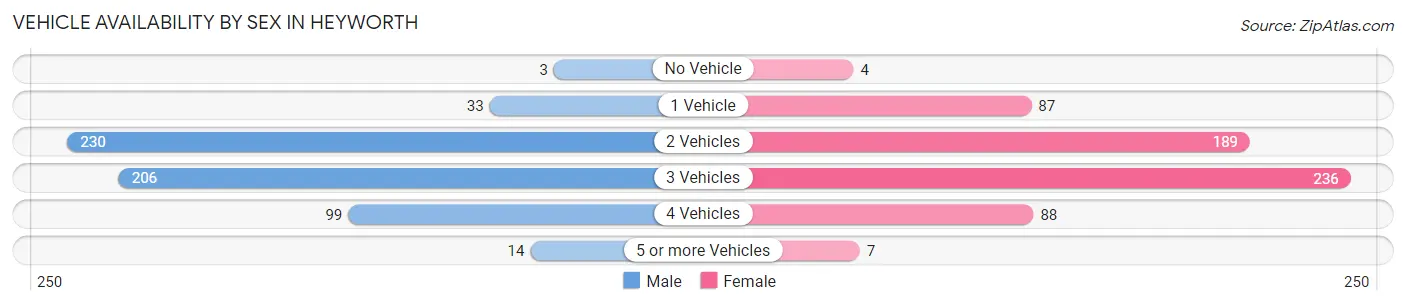
| Vehicles Available | Male | Female |
| No Vehicle | 3 (0.5%) | 4 (0.6%) |
| 1 Vehicle | 33 (5.6%) | 87 (14.2%) |
| 2 Vehicles | 230 (39.3%) | 189 (30.9%) |
| 3 Vehicles | 206 (35.2%) | 236 (38.6%) |
| 4 Vehicles | 99 (16.9%) | 88 (14.4%) |
| 5 or more Vehicles | 14 (2.4%) | 7 (1.1%) |
| Total | 585 (100.0%) | 611 (100.0%) |
Commute Time in Heyworth
The most frequently occuring commute durations in Heyworth are 20 to 24 minutes (362 commuters, 34.0%), 15 to 19 minutes (141 commuters, 13.2%), and 25 to 29 minutes (120 commuters, 11.3%).
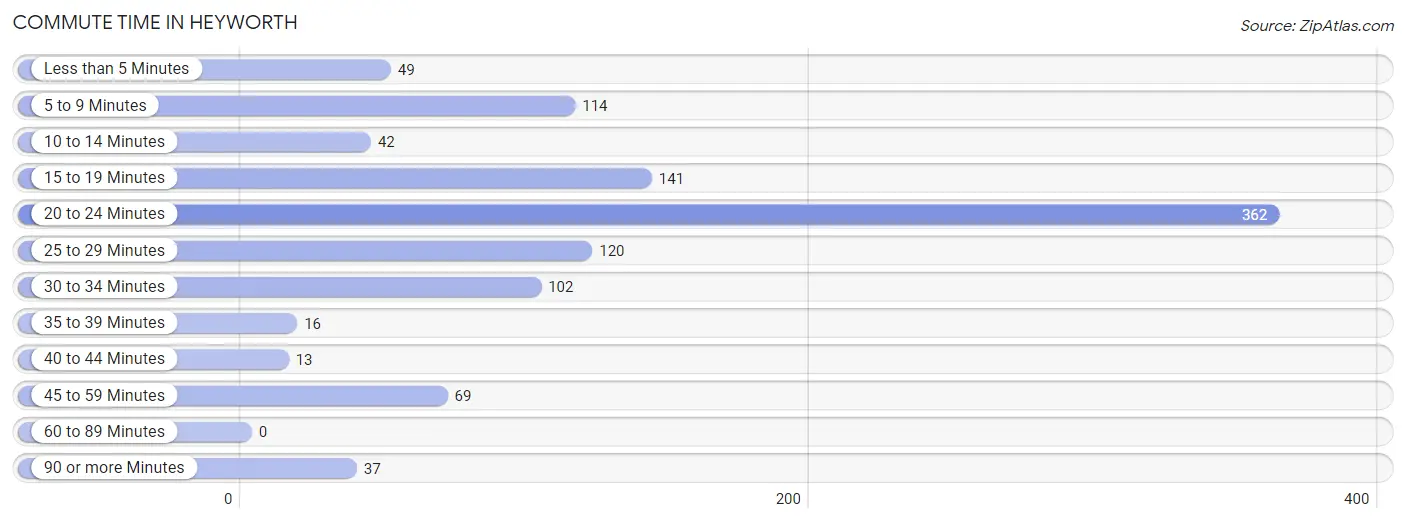
| Commute Time | # Commuters | % Commuters |
| Less than 5 Minutes | 49 | 4.6% |
| 5 to 9 Minutes | 114 | 10.7% |
| 10 to 14 Minutes | 42 | 3.9% |
| 15 to 19 Minutes | 141 | 13.2% |
| 20 to 24 Minutes | 362 | 34.0% |
| 25 to 29 Minutes | 120 | 11.3% |
| 30 to 34 Minutes | 102 | 9.6% |
| 35 to 39 Minutes | 16 | 1.5% |
| 40 to 44 Minutes | 13 | 1.2% |
| 45 to 59 Minutes | 69 | 6.5% |
| 60 to 89 Minutes | 0 | 0.0% |
| 90 or more Minutes | 37 | 3.5% |
Commute Time by Sex in Heyworth
The most common commute times in Heyworth are 20 to 24 minutes (151 commuters, 28.0%) for males and 20 to 24 minutes (211 commuters, 40.1%) for females.
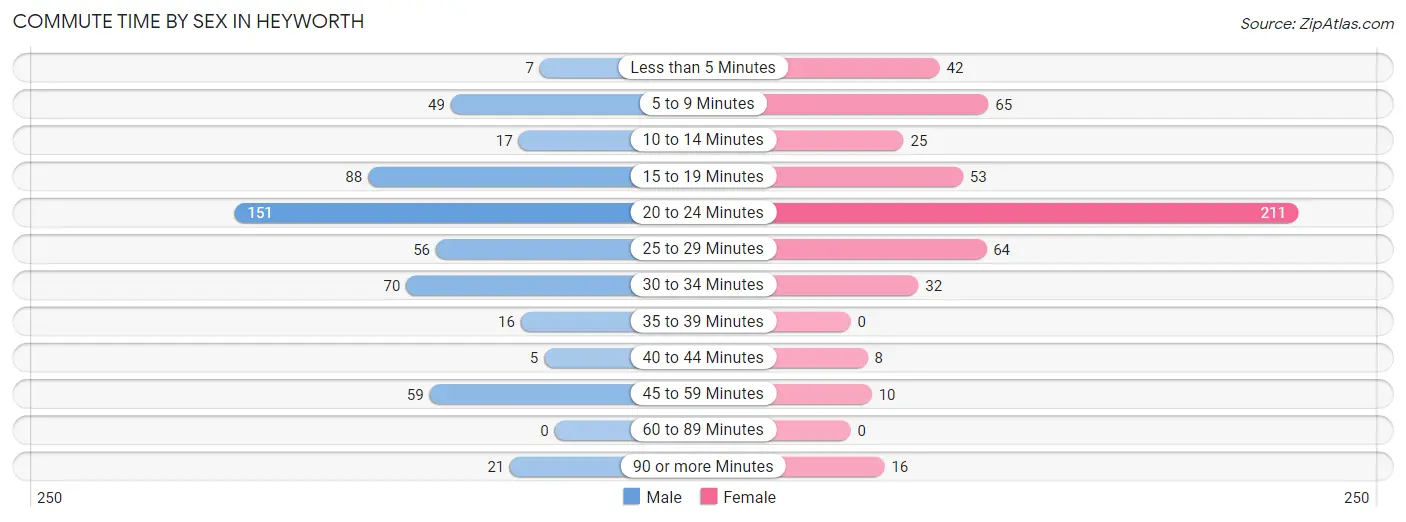
| Commute Time | Male | Female |
| Less than 5 Minutes | 7 (1.3%) | 42 (8.0%) |
| 5 to 9 Minutes | 49 (9.1%) | 65 (12.4%) |
| 10 to 14 Minutes | 17 (3.2%) | 25 (4.8%) |
| 15 to 19 Minutes | 88 (16.3%) | 53 (10.1%) |
| 20 to 24 Minutes | 151 (28.0%) | 211 (40.1%) |
| 25 to 29 Minutes | 56 (10.4%) | 64 (12.2%) |
| 30 to 34 Minutes | 70 (13.0%) | 32 (6.1%) |
| 35 to 39 Minutes | 16 (3.0%) | 0 (0.0%) |
| 40 to 44 Minutes | 5 (0.9%) | 8 (1.5%) |
| 45 to 59 Minutes | 59 (11.0%) | 10 (1.9%) |
| 60 to 89 Minutes | 0 (0.0%) | 0 (0.0%) |
| 90 or more Minutes | 21 (3.9%) | 16 (3.0%) |
Time of Departure to Work by Sex in Heyworth
The most frequent times of departure to work in Heyworth are 6:00 AM to 6:29 AM (99, 18.4%) for males and 7:00 AM to 7:29 AM (145, 27.6%) for females.
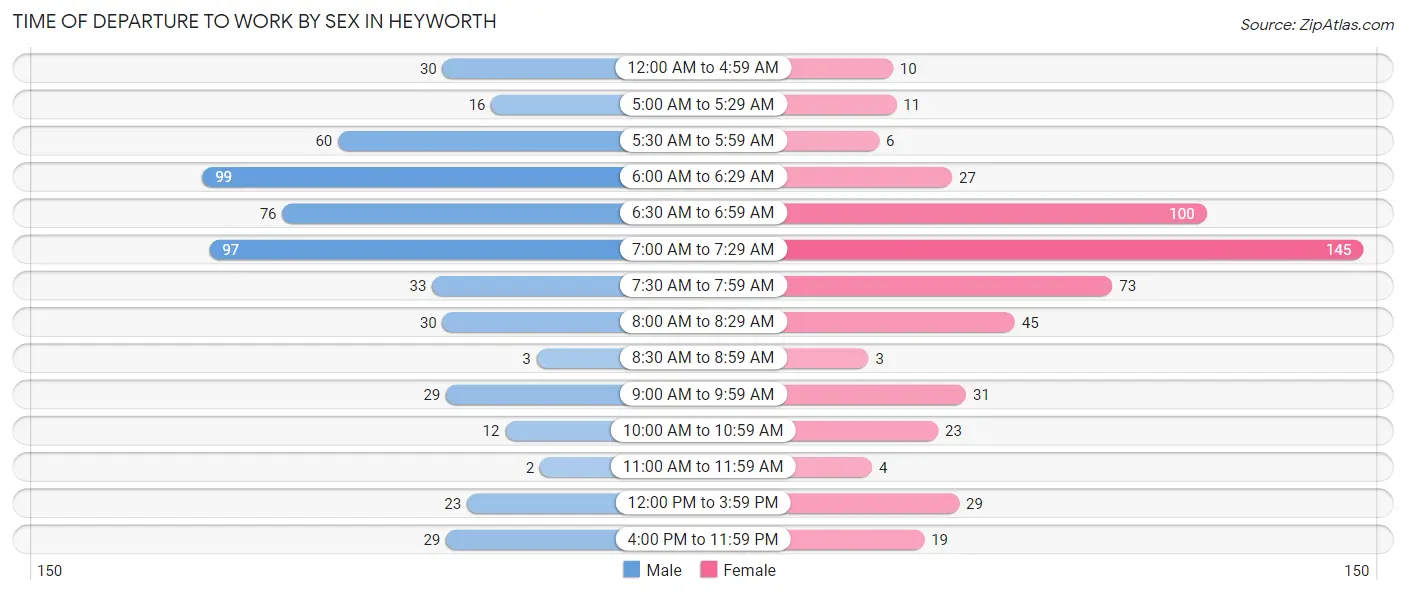
| Time of Departure | Male | Female |
| 12:00 AM to 4:59 AM | 30 (5.6%) | 10 (1.9%) |
| 5:00 AM to 5:29 AM | 16 (3.0%) | 11 (2.1%) |
| 5:30 AM to 5:59 AM | 60 (11.1%) | 6 (1.1%) |
| 6:00 AM to 6:29 AM | 99 (18.4%) | 27 (5.1%) |
| 6:30 AM to 6:59 AM | 76 (14.1%) | 100 (19.0%) |
| 7:00 AM to 7:29 AM | 97 (18.0%) | 145 (27.6%) |
| 7:30 AM to 7:59 AM | 33 (6.1%) | 73 (13.9%) |
| 8:00 AM to 8:29 AM | 30 (5.6%) | 45 (8.6%) |
| 8:30 AM to 8:59 AM | 3 (0.6%) | 3 (0.6%) |
| 9:00 AM to 9:59 AM | 29 (5.4%) | 31 (5.9%) |
| 10:00 AM to 10:59 AM | 12 (2.2%) | 23 (4.4%) |
| 11:00 AM to 11:59 AM | 2 (0.4%) | 4 (0.8%) |
| 12:00 PM to 3:59 PM | 23 (4.3%) | 29 (5.5%) |
| 4:00 PM to 11:59 PM | 29 (5.4%) | 19 (3.6%) |
| Total | 539 (100.0%) | 526 (100.0%) |
Housing Occupancy in Heyworth
Occupancy by Ownership in Heyworth
Of the total 978 dwellings in Heyworth, owner-occupied units account for 846 (86.5%), while renter-occupied units make up 132 (13.5%).
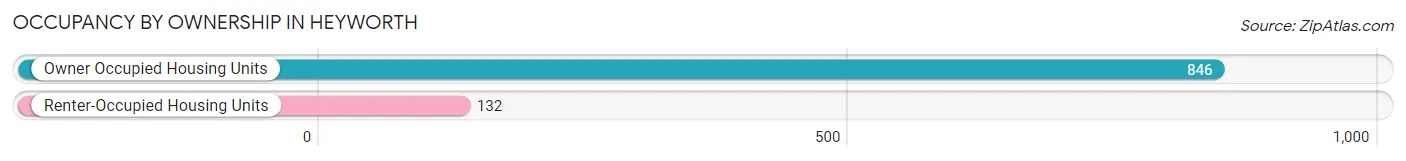
| Occupancy | # Housing Units | % Housing Units |
| Owner Occupied Housing Units | 846 | 86.5% |
| Renter-Occupied Housing Units | 132 | 13.5% |
| Total Occupied Housing Units | 978 | 100.0% |
Occupancy by Household Size in Heyworth
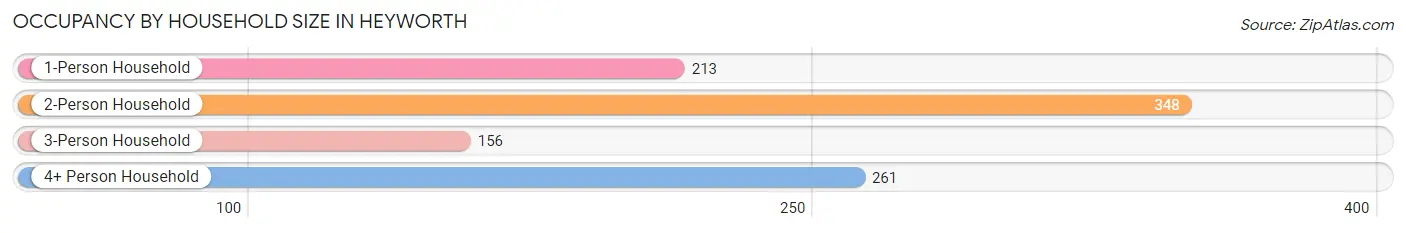
| Household Size | # Housing Units | % Housing Units |
| 1-Person Household | 213 | 21.8% |
| 2-Person Household | 348 | 35.6% |
| 3-Person Household | 156 | 16.0% |
| 4+ Person Household | 261 | 26.7% |
| Total Housing Units | 978 | 100.0% |
Occupancy by Ownership by Household Size in Heyworth
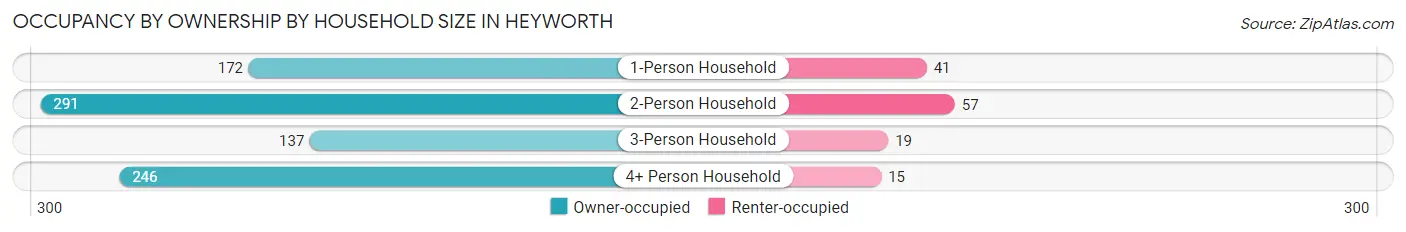
| Household Size | Owner-occupied | Renter-occupied |
| 1-Person Household | 172 (80.7%) | 41 (19.3%) |
| 2-Person Household | 291 (83.6%) | 57 (16.4%) |
| 3-Person Household | 137 (87.8%) | 19 (12.2%) |
| 4+ Person Household | 246 (94.3%) | 15 (5.8%) |
| Total Housing Units | 846 (86.5%) | 132 (13.5%) |
Occupancy by Educational Attainment in Heyworth
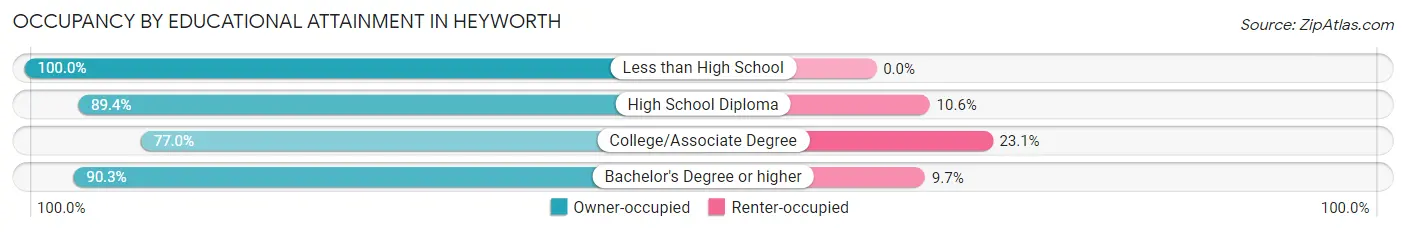
| Household Size | Owner-occupied | Renter-occupied |
| Less than High School | 33 (100.0%) | 0 (0.0%) |
| High School Diploma | 278 (89.4%) | 33 (10.6%) |
| College/Associate Degree | 217 (76.9%) | 65 (23.1%) |
| Bachelor's Degree or higher | 318 (90.3%) | 34 (9.7%) |
Occupancy by Age of Householder in Heyworth
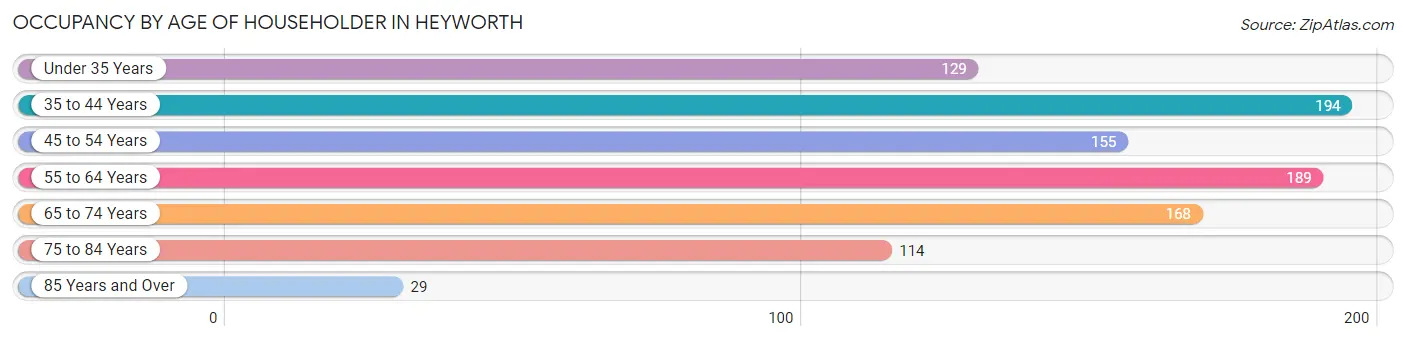
| Age Bracket | # Households | % Households |
| Under 35 Years | 129 | 13.2% |
| 35 to 44 Years | 194 | 19.8% |
| 45 to 54 Years | 155 | 15.9% |
| 55 to 64 Years | 189 | 19.3% |
| 65 to 74 Years | 168 | 17.2% |
| 75 to 84 Years | 114 | 11.7% |
| 85 Years and Over | 29 | 3.0% |
| Total | 978 | 100.0% |
Housing Finances in Heyworth
Median Income by Occupancy in Heyworth
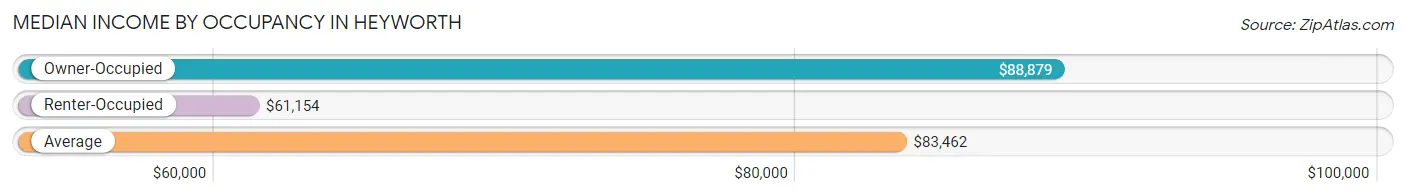
| Occupancy Type | # Households | Median Income |
| Owner-Occupied | 846 (86.5%) | $88,879 |
| Renter-Occupied | 132 (13.5%) | $61,154 |
| Average | 978 (100.0%) | $83,462 |
Occupancy by Householder Income Bracket in Heyworth
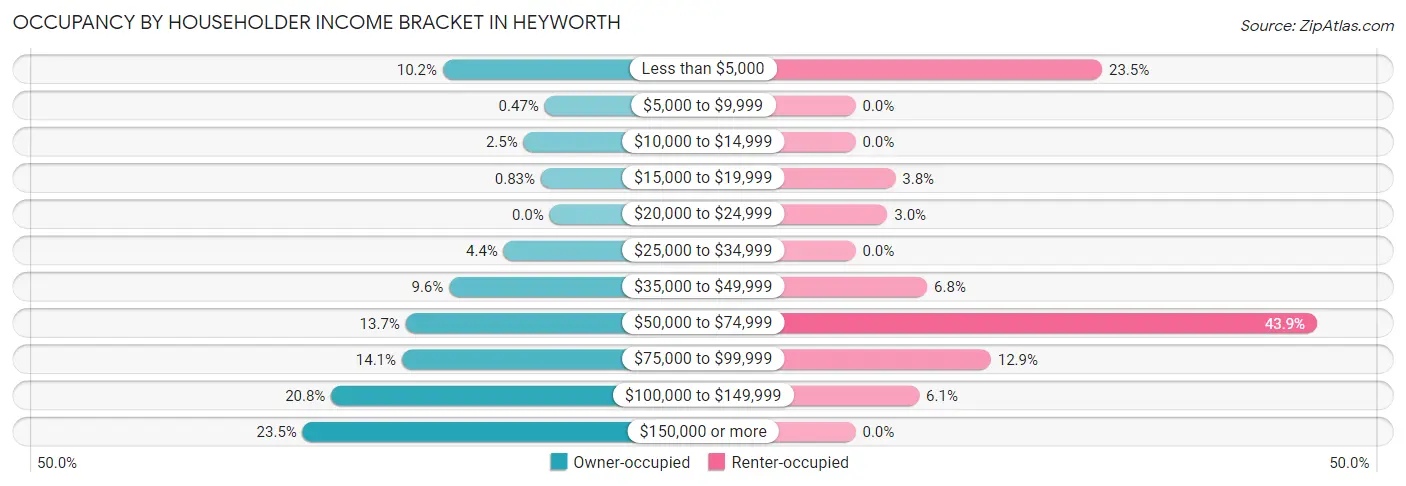
| Income Bracket | Owner-occupied | Renter-occupied |
| Less than $5,000 | 86 (10.2%) | 31 (23.5%) |
| $5,000 to $9,999 | 4 (0.5%) | 0 (0.0%) |
| $10,000 to $14,999 | 21 (2.5%) | 0 (0.0%) |
| $15,000 to $19,999 | 7 (0.8%) | 5 (3.8%) |
| $20,000 to $24,999 | 0 (0.0%) | 4 (3.0%) |
| $25,000 to $34,999 | 37 (4.4%) | 0 (0.0%) |
| $35,000 to $49,999 | 81 (9.6%) | 9 (6.8%) |
| $50,000 to $74,999 | 116 (13.7%) | 58 (43.9%) |
| $75,000 to $99,999 | 119 (14.1%) | 17 (12.9%) |
| $100,000 to $149,999 | 176 (20.8%) | 8 (6.1%) |
| $150,000 or more | 199 (23.5%) | 0 (0.0%) |
| Total | 846 (100.0%) | 132 (100.0%) |
Monthly Housing Cost Tiers in Heyworth
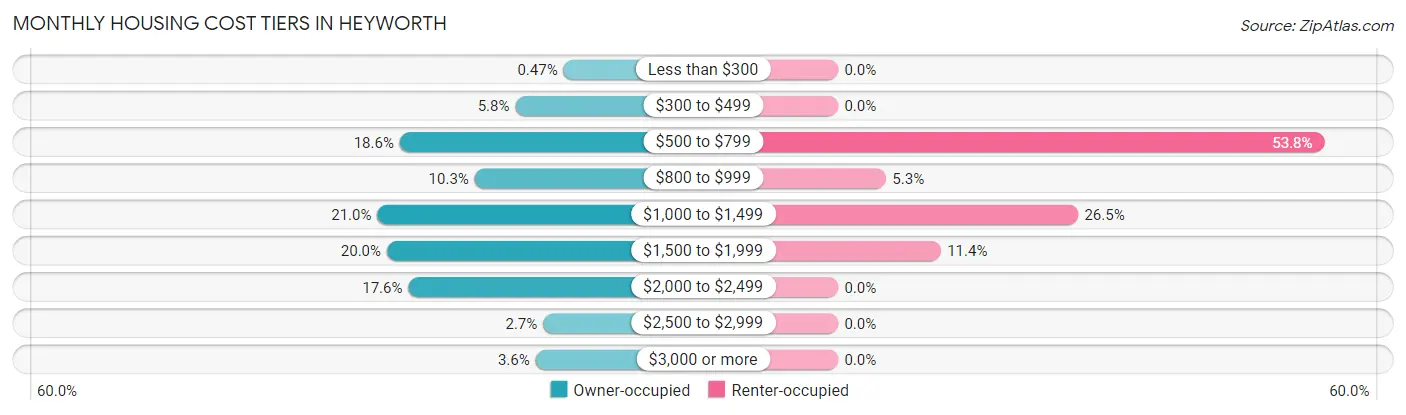
| Monthly Cost | Owner-occupied | Renter-occupied |
| Less than $300 | 4 (0.5%) | 0 (0.0%) |
| $300 to $499 | 49 (5.8%) | 0 (0.0%) |
| $500 to $799 | 157 (18.6%) | 71 (53.8%) |
| $800 to $999 | 87 (10.3%) | 7 (5.3%) |
| $1,000 to $1,499 | 178 (21.0%) | 35 (26.5%) |
| $1,500 to $1,999 | 169 (20.0%) | 15 (11.4%) |
| $2,000 to $2,499 | 149 (17.6%) | 0 (0.0%) |
| $2,500 to $2,999 | 23 (2.7%) | 0 (0.0%) |
| $3,000 or more | 30 (3.5%) | 0 (0.0%) |
| Total | 846 (100.0%) | 132 (100.0%) |
Physical Housing Characteristics in Heyworth
Housing Structures in Heyworth
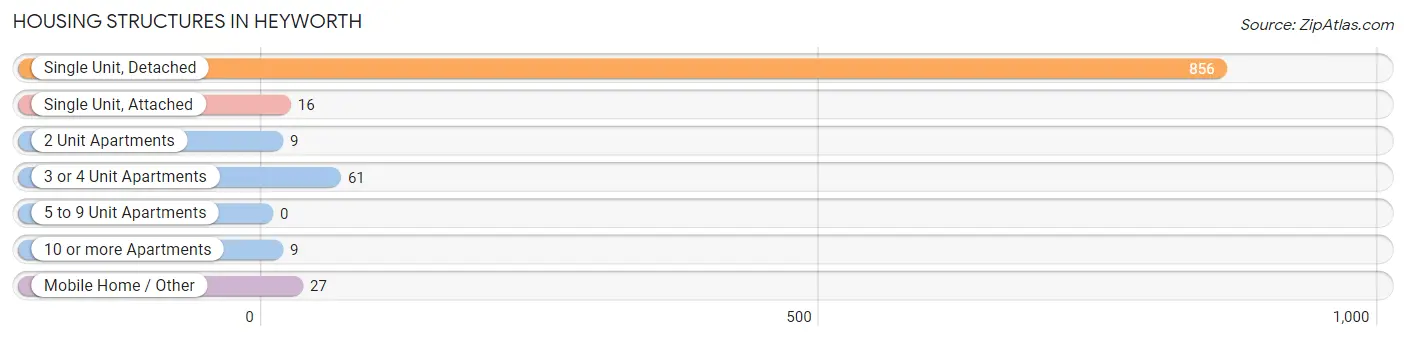
| Structure Type | # Housing Units | % Housing Units |
| Single Unit, Detached | 856 | 87.5% |
| Single Unit, Attached | 16 | 1.6% |
| 2 Unit Apartments | 9 | 0.9% |
| 3 or 4 Unit Apartments | 61 | 6.2% |
| 5 to 9 Unit Apartments | 0 | 0.0% |
| 10 or more Apartments | 9 | 0.9% |
| Mobile Home / Other | 27 | 2.8% |
| Total | 978 | 100.0% |
Housing Structures by Occupancy in Heyworth
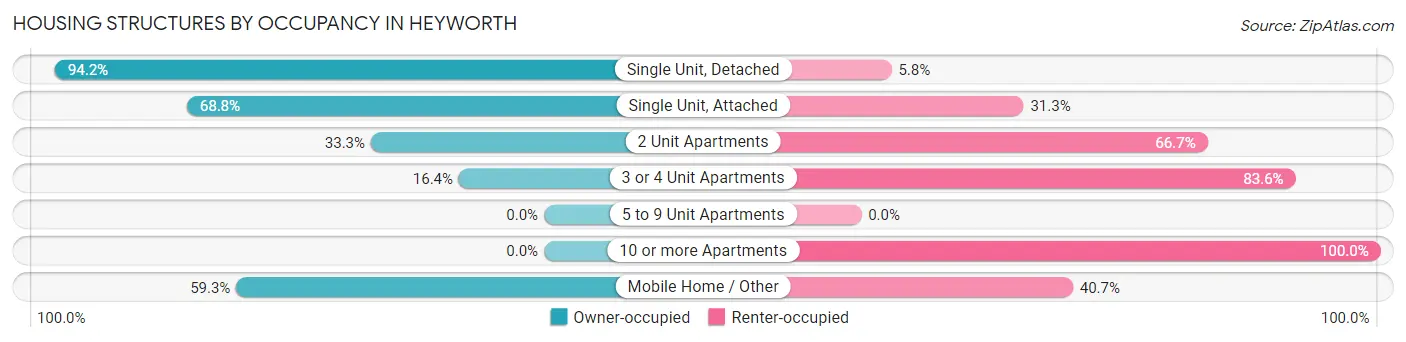
| Structure Type | Owner-occupied | Renter-occupied |
| Single Unit, Detached | 806 (94.2%) | 50 (5.8%) |
| Single Unit, Attached | 11 (68.8%) | 5 (31.2%) |
| 2 Unit Apartments | 3 (33.3%) | 6 (66.7%) |
| 3 or 4 Unit Apartments | 10 (16.4%) | 51 (83.6%) |
| 5 to 9 Unit Apartments | 0 (0.0%) | 0 (0.0%) |
| 10 or more Apartments | 0 (0.0%) | 9 (100.0%) |
| Mobile Home / Other | 16 (59.3%) | 11 (40.7%) |
| Total | 846 (86.5%) | 132 (13.5%) |
Housing Structures by Number of Rooms in Heyworth
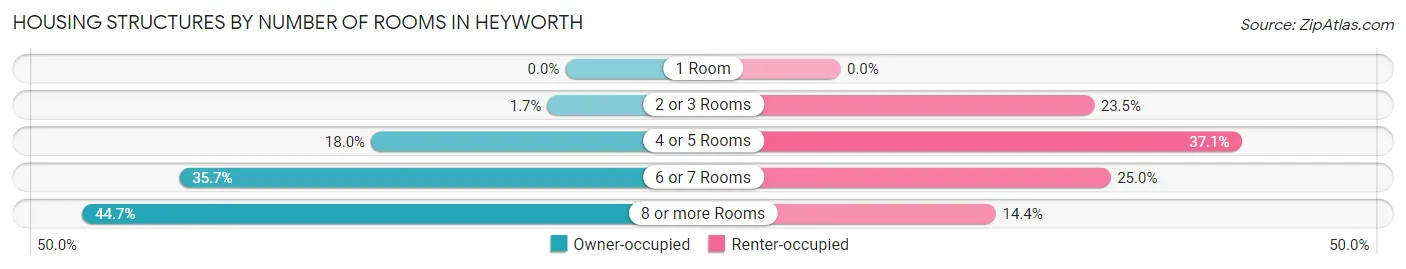
| Number of Rooms | Owner-occupied | Renter-occupied |
| 1 Room | 0 (0.0%) | 0 (0.0%) |
| 2 or 3 Rooms | 14 (1.7%) | 31 (23.5%) |
| 4 or 5 Rooms | 152 (18.0%) | 49 (37.1%) |
| 6 or 7 Rooms | 302 (35.7%) | 33 (25.0%) |
| 8 or more Rooms | 378 (44.7%) | 19 (14.4%) |
| Total | 846 (100.0%) | 132 (100.0%) |
Housing Structure by Heating Type in Heyworth
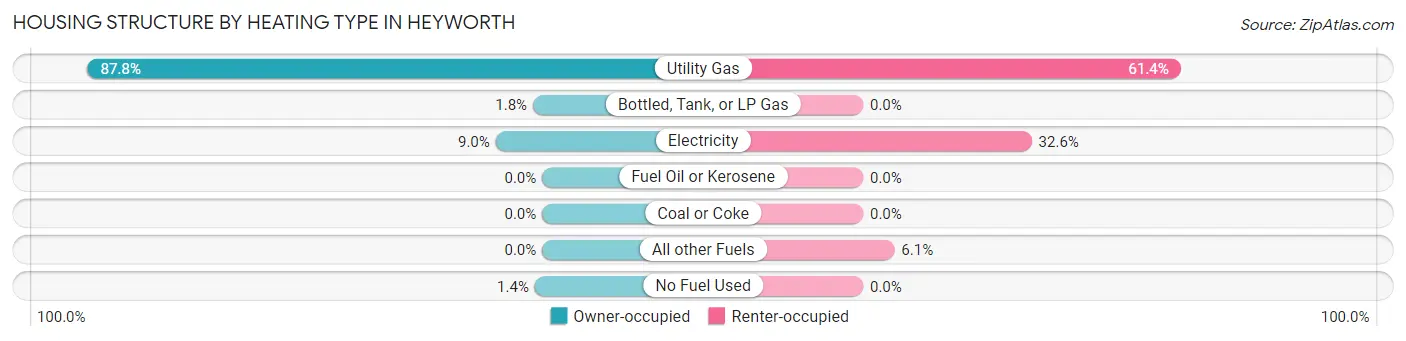
| Heating Type | Owner-occupied | Renter-occupied |
| Utility Gas | 743 (87.8%) | 81 (61.4%) |
| Bottled, Tank, or LP Gas | 15 (1.8%) | 0 (0.0%) |
| Electricity | 76 (9.0%) | 43 (32.6%) |
| Fuel Oil or Kerosene | 0 (0.0%) | 0 (0.0%) |
| Coal or Coke | 0 (0.0%) | 0 (0.0%) |
| All other Fuels | 0 (0.0%) | 8 (6.1%) |
| No Fuel Used | 12 (1.4%) | 0 (0.0%) |
| Total | 846 (100.0%) | 132 (100.0%) |
Household Vehicle Usage in Heyworth
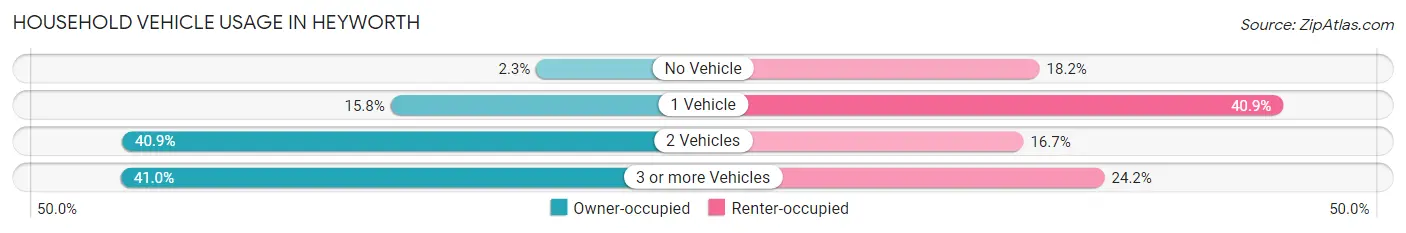
| Vehicles per Household | Owner-occupied | Renter-occupied |
| No Vehicle | 19 (2.2%) | 24 (18.2%) |
| 1 Vehicle | 134 (15.8%) | 54 (40.9%) |
| 2 Vehicles | 346 (40.9%) | 22 (16.7%) |
| 3 or more Vehicles | 347 (41.0%) | 32 (24.2%) |
| Total | 846 (100.0%) | 132 (100.0%) |
Real Estate & Mortgages in Heyworth
Real Estate and Mortgage Overview in Heyworth
| Characteristic | Without Mortgage | With Mortgage |
| Housing Units | 298 | 548 |
| Median Property Value | $182,500 | $211,500 |
| Median Household Income | $51,429 | $165 |
| Monthly Housing Costs | $704 | $30 |
| Real Estate Taxes | $3,795 | $13 |
Property Value by Mortgage Status in Heyworth
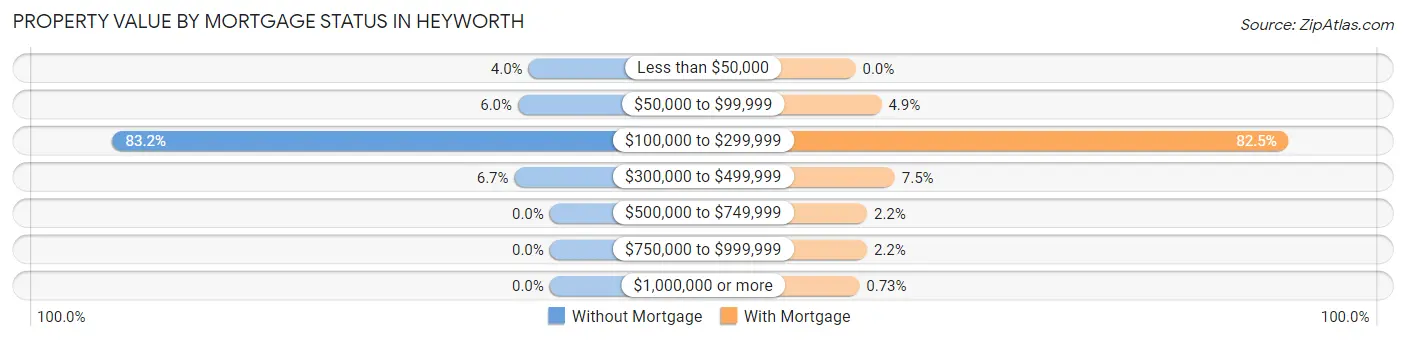
| Property Value | Without Mortgage | With Mortgage |
| Less than $50,000 | 12 (4.0%) | 0 (0.0%) |
| $50,000 to $99,999 | 18 (6.0%) | 27 (4.9%) |
| $100,000 to $299,999 | 248 (83.2%) | 452 (82.5%) |
| $300,000 to $499,999 | 20 (6.7%) | 41 (7.5%) |
| $500,000 to $749,999 | 0 (0.0%) | 12 (2.2%) |
| $750,000 to $999,999 | 0 (0.0%) | 12 (2.2%) |
| $1,000,000 or more | 0 (0.0%) | 4 (0.7%) |
| Total | 298 (100.0%) | 548 (100.0%) |
Household Income by Mortgage Status in Heyworth
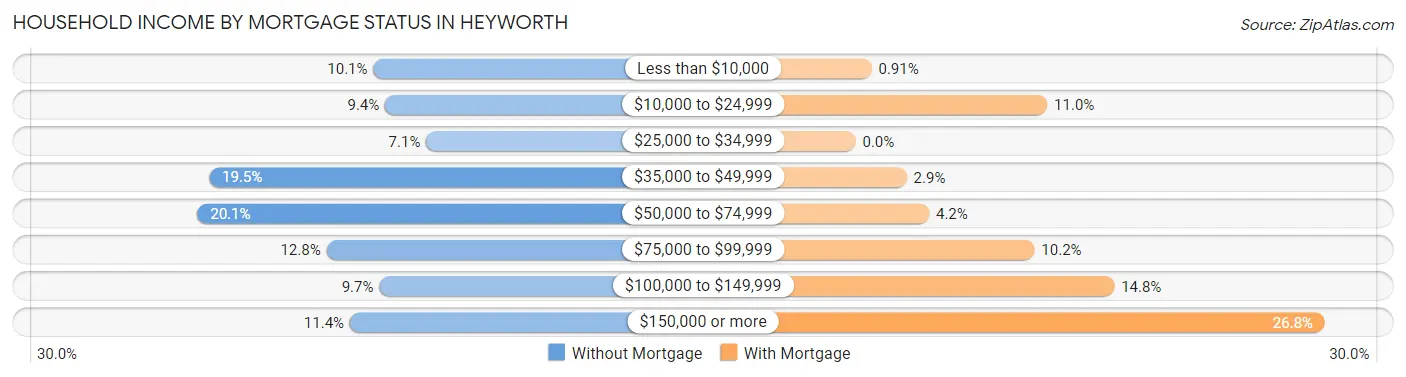
| Household Income | Without Mortgage | With Mortgage |
| Less than $10,000 | 30 (10.1%) | 5 (0.9%) |
| $10,000 to $24,999 | 28 (9.4%) | 60 (11.0%) |
| $25,000 to $34,999 | 21 (7.0%) | 0 (0.0%) |
| $35,000 to $49,999 | 58 (19.5%) | 16 (2.9%) |
| $50,000 to $74,999 | 60 (20.1%) | 23 (4.2%) |
| $75,000 to $99,999 | 38 (12.8%) | 56 (10.2%) |
| $100,000 to $149,999 | 29 (9.7%) | 81 (14.8%) |
| $150,000 or more | 34 (11.4%) | 147 (26.8%) |
| Total | 298 (100.0%) | 548 (100.0%) |
Property Value to Household Income Ratio in Heyworth
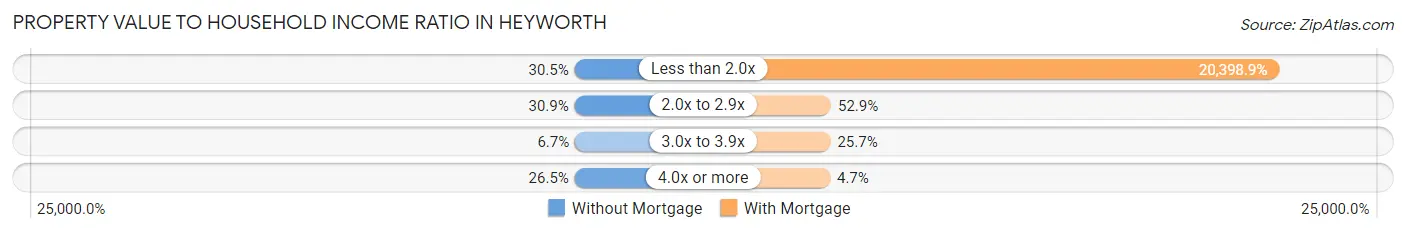
| Value-to-Income Ratio | Without Mortgage | With Mortgage |
| Less than 2.0x | 91 (30.5%) | 111,786 (20,398.9%) |
| 2.0x to 2.9x | 92 (30.9%) | 290 (52.9%) |
| 3.0x to 3.9x | 20 (6.7%) | 141 (25.7%) |
| 4.0x or more | 79 (26.5%) | 26 (4.7%) |
| Total | 298 (100.0%) | 548 (100.0%) |
Real Estate Taxes by Mortgage Status in Heyworth
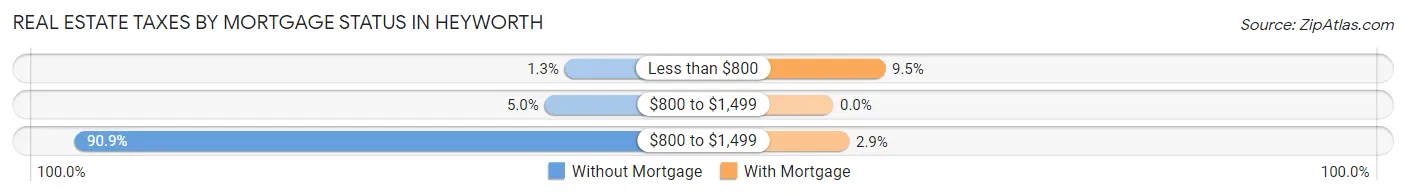
| Property Taxes | Without Mortgage | With Mortgage |
| Less than $800 | 4 (1.3%) | 52 (9.5%) |
| $800 to $1,499 | 15 (5.0%) | 0 (0.0%) |
| $800 to $1,499 | 271 (90.9%) | 16 (2.9%) |
| Total | 298 (100.0%) | 548 (100.0%) |
Health & Disability in Heyworth
Health Insurance Coverage by Age in Heyworth
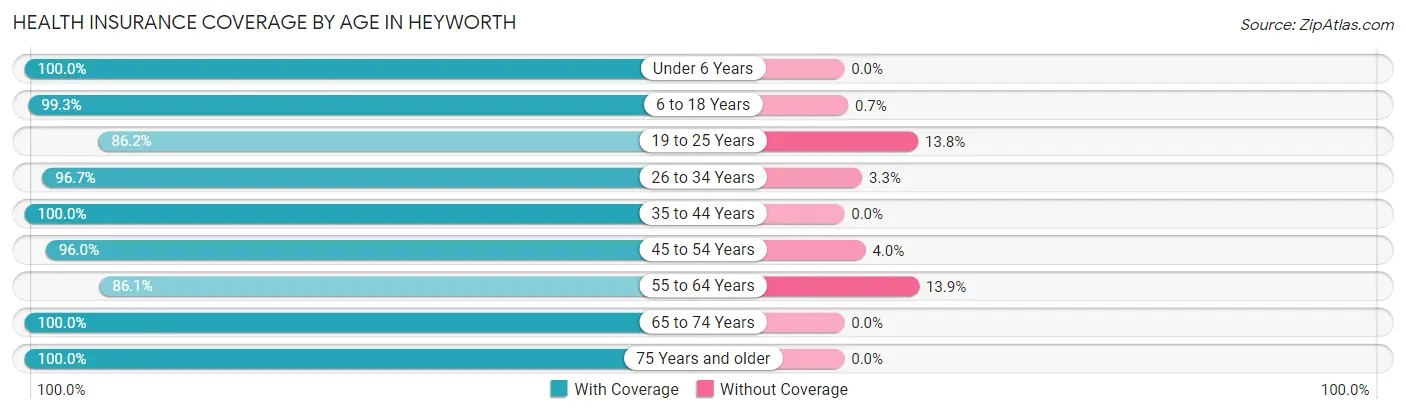
| Age Bracket | With Coverage | Without Coverage |
| Under 6 Years | 125 (100.0%) | 0 (0.0%) |
| 6 to 18 Years | 712 (99.3%) | 5 (0.7%) |
| 19 to 25 Years | 144 (86.2%) | 23 (13.8%) |
| 26 to 34 Years | 203 (96.7%) | 7 (3.3%) |
| 35 to 44 Years | 400 (100.0%) | 0 (0.0%) |
| 45 to 54 Years | 291 (96.0%) | 12 (4.0%) |
| 55 to 64 Years | 309 (86.1%) | 50 (13.9%) |
| 65 to 74 Years | 264 (100.0%) | 0 (0.0%) |
| 75 Years and older | 180 (100.0%) | 0 (0.0%) |
| Total | 2,628 (96.4%) | 97 (3.6%) |
Health Insurance Coverage by Citizenship Status in Heyworth
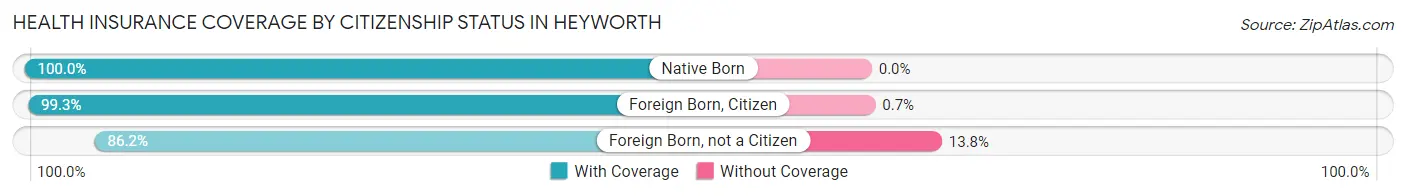
| Citizenship Status | With Coverage | Without Coverage |
| Native Born | 125 (100.0%) | 0 (0.0%) |
| Foreign Born, Citizen | 712 (99.3%) | 5 (0.7%) |
| Foreign Born, not a Citizen | 144 (86.2%) | 23 (13.8%) |
Health Insurance Coverage by Household Income in Heyworth
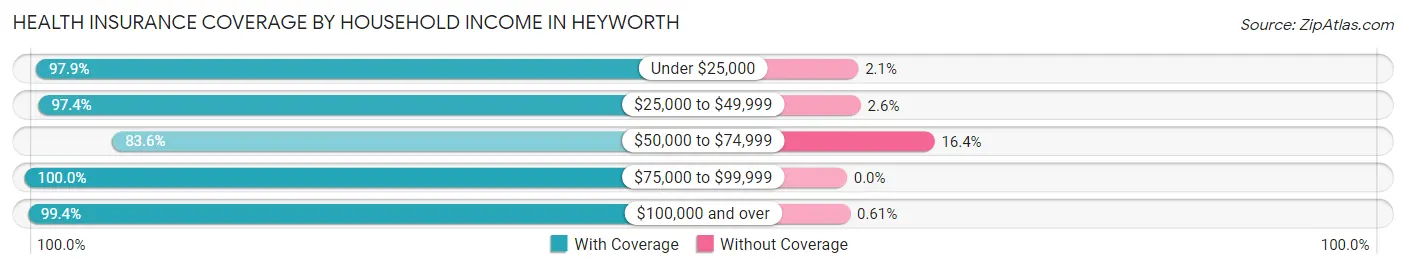
| Household Income | With Coverage | Without Coverage |
| Under $25,000 | 229 (97.9%) | 5 (2.1%) |
| $25,000 to $49,999 | 262 (97.4%) | 7 (2.6%) |
| $50,000 to $74,999 | 392 (83.6%) | 77 (16.4%) |
| $75,000 to $99,999 | 447 (100.0%) | 0 (0.0%) |
| $100,000 and over | 1,298 (99.4%) | 8 (0.6%) |
Public vs Private Health Insurance Coverage by Age in Heyworth
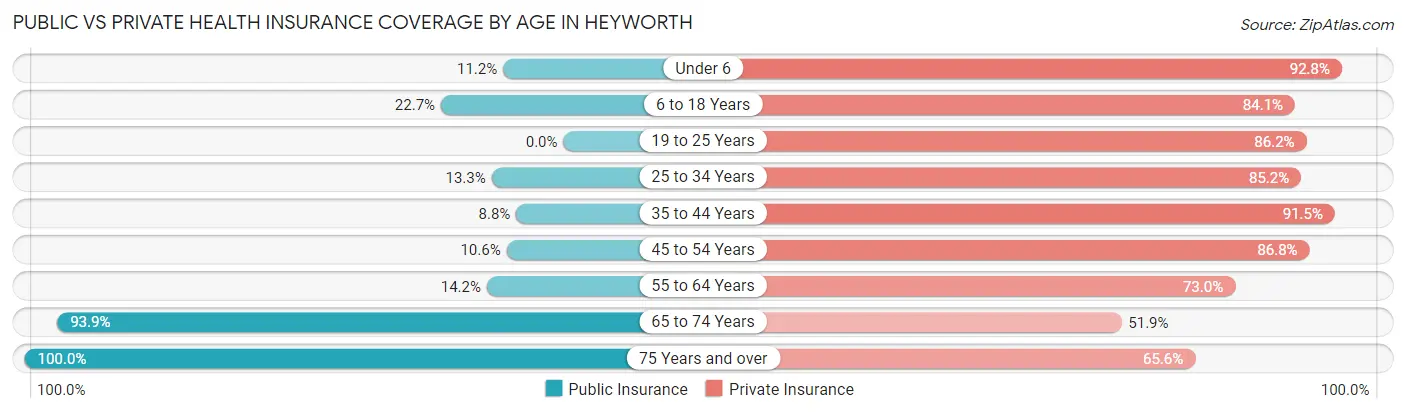
| Age Bracket | Public Insurance | Private Insurance |
| Under 6 | 14 (11.2%) | 116 (92.8%) |
| 6 to 18 Years | 163 (22.7%) | 603 (84.1%) |
| 19 to 25 Years | 0 (0.0%) | 144 (86.2%) |
| 25 to 34 Years | 28 (13.3%) | 179 (85.2%) |
| 35 to 44 Years | 35 (8.7%) | 366 (91.5%) |
| 45 to 54 Years | 32 (10.6%) | 263 (86.8%) |
| 55 to 64 Years | 51 (14.2%) | 262 (73.0%) |
| 65 to 74 Years | 248 (93.9%) | 137 (51.9%) |
| 75 Years and over | 180 (100.0%) | 118 (65.6%) |
| Total | 751 (27.6%) | 2,188 (80.3%) |
Disability Status by Sex by Age in Heyworth
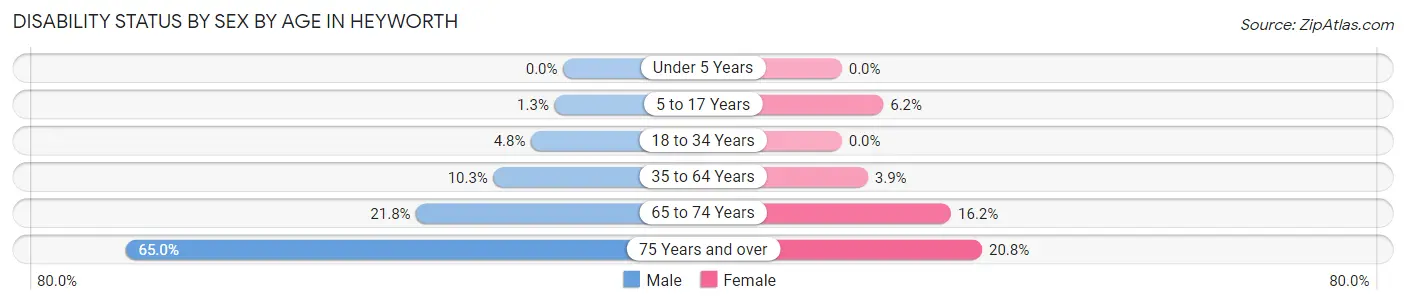
| Age Bracket | Male | Female |
| Under 5 Years | 0 (0.0%) | 0 (0.0%) |
| 5 to 17 Years | 4 (1.3%) | 25 (6.2%) |
| 18 to 34 Years | 10 (4.8%) | 0 (0.0%) |
| 35 to 64 Years | 51 (10.3%) | 22 (3.9%) |
| 65 to 74 Years | 24 (21.8%) | 25 (16.2%) |
| 75 Years and over | 39 (65.0%) | 25 (20.8%) |
Disability Class by Sex by Age in Heyworth
Disability Class: Hearing Difficulty
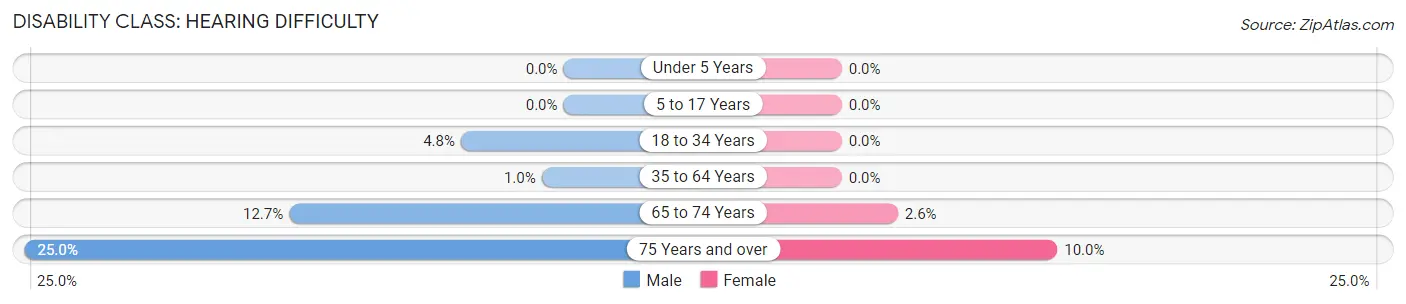
| Age Bracket | Male | Female |
| Under 5 Years | 0 (0.0%) | 0 (0.0%) |
| 5 to 17 Years | 0 (0.0%) | 0 (0.0%) |
| 18 to 34 Years | 10 (4.8%) | 0 (0.0%) |
| 35 to 64 Years | 5 (1.0%) | 0 (0.0%) |
| 65 to 74 Years | 14 (12.7%) | 4 (2.6%) |
| 75 Years and over | 15 (25.0%) | 12 (10.0%) |
Disability Class: Vision Difficulty
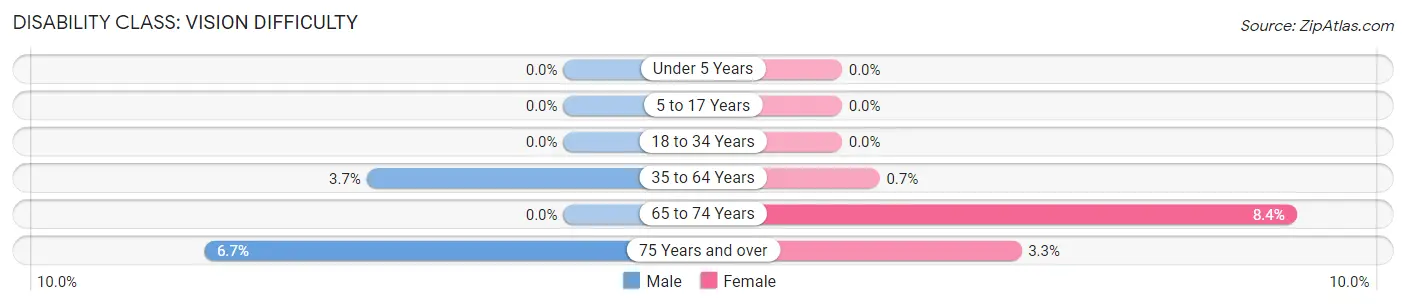
| Age Bracket | Male | Female |
| Under 5 Years | 0 (0.0%) | 0 (0.0%) |
| 5 to 17 Years | 0 (0.0%) | 0 (0.0%) |
| 18 to 34 Years | 0 (0.0%) | 0 (0.0%) |
| 35 to 64 Years | 18 (3.6%) | 4 (0.7%) |
| 65 to 74 Years | 0 (0.0%) | 13 (8.4%) |
| 75 Years and over | 4 (6.7%) | 4 (3.3%) |
Disability Class: Cognitive Difficulty
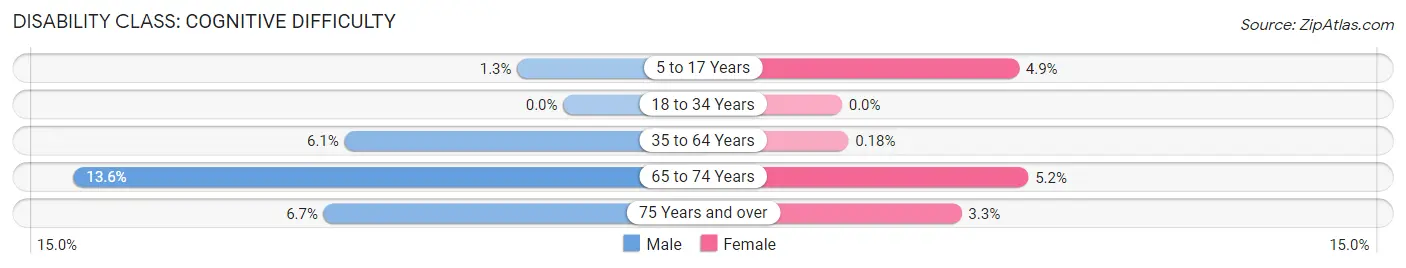
| Age Bracket | Male | Female |
| 5 to 17 Years | 4 (1.3%) | 20 (4.9%) |
| 18 to 34 Years | 0 (0.0%) | 0 (0.0%) |
| 35 to 64 Years | 30 (6.1%) | 1 (0.2%) |
| 65 to 74 Years | 15 (13.6%) | 8 (5.2%) |
| 75 Years and over | 4 (6.7%) | 4 (3.3%) |
Disability Class: Ambulatory Difficulty
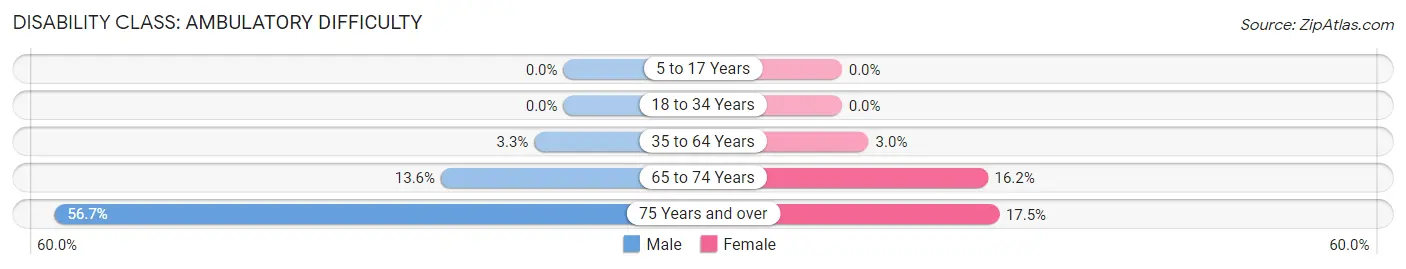
| Age Bracket | Male | Female |
| 5 to 17 Years | 0 (0.0%) | 0 (0.0%) |
| 18 to 34 Years | 0 (0.0%) | 0 (0.0%) |
| 35 to 64 Years | 16 (3.3%) | 17 (3.0%) |
| 65 to 74 Years | 15 (13.6%) | 25 (16.2%) |
| 75 Years and over | 34 (56.7%) | 21 (17.5%) |
Disability Class: Self-Care Difficulty
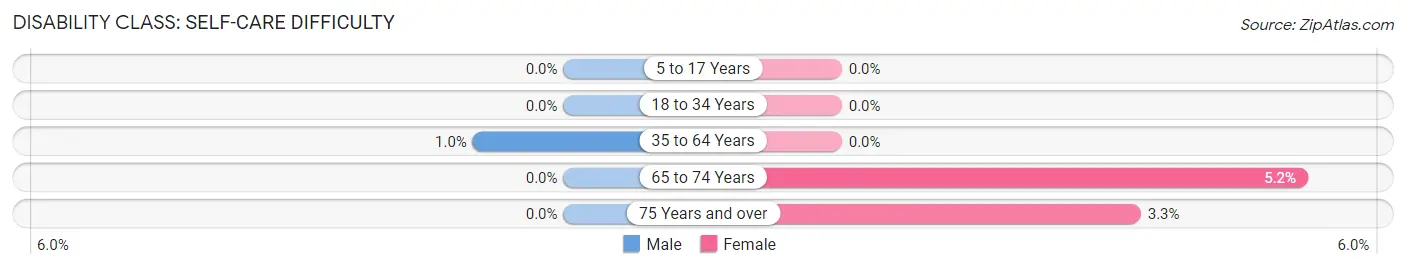
| Age Bracket | Male | Female |
| 5 to 17 Years | 0 (0.0%) | 0 (0.0%) |
| 18 to 34 Years | 0 (0.0%) | 0 (0.0%) |
| 35 to 64 Years | 5 (1.0%) | 0 (0.0%) |
| 65 to 74 Years | 0 (0.0%) | 8 (5.2%) |
| 75 Years and over | 0 (0.0%) | 4 (3.3%) |
Technology Access in Heyworth
Computing Device Access in Heyworth
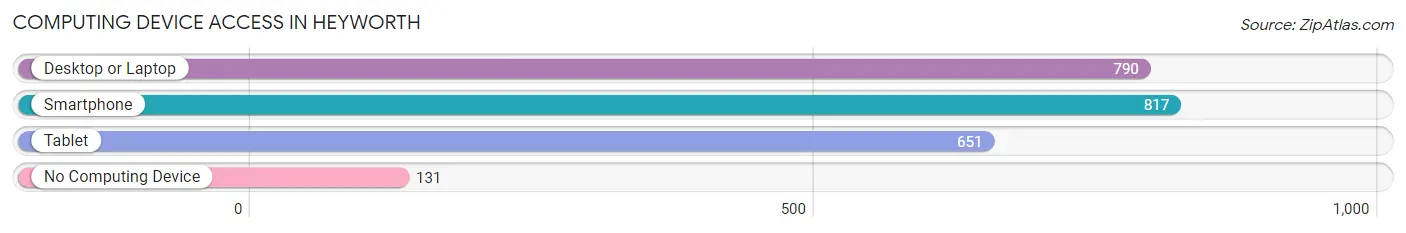
| Device Type | # Households | % Households |
| Desktop or Laptop | 790 | 80.8% |
| Smartphone | 817 | 83.5% |
| Tablet | 651 | 66.6% |
| No Computing Device | 131 | 13.4% |
| Total | 978 | 100.0% |
Internet Access in Heyworth
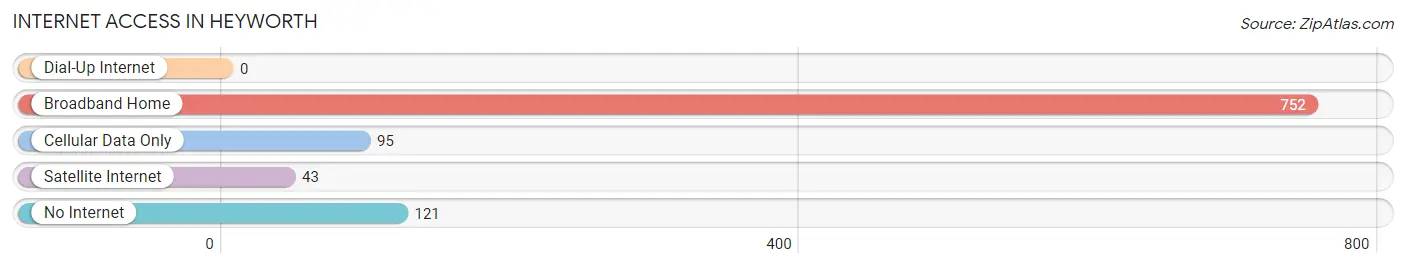
| Internet Type | # Households | % Households |
| Dial-Up Internet | 0 | 0.0% |
| Broadband Home | 752 | 76.9% |
| Cellular Data Only | 95 | 9.7% |
| Satellite Internet | 43 | 4.4% |
| No Internet | 121 | 12.4% |
| Total | 978 | 100.0% |
Heyworth Summary
Introduction
Heyworth is a small village located in McLean County, Illinois. It is situated in the central part of the state, about 25 miles east of Bloomington and about 30 miles west of Champaign. The village has a population of 2,841 people, according to the 2010 census. The village is known for its small-town charm and its close proximity to the larger cities of Bloomington and Champaign.
History
The village of Heyworth was founded in 1854 by William Heyworth, a farmer from Ohio. He purchased the land from the government and began to develop the area. The village was originally called Heyworth Station, as it was a stop on the Illinois Central Railroad. The village was officially incorporated in 1872.
In the early 1900s, the village experienced a period of growth and development. The population increased from 1,000 in 1900 to 1,500 in 1910. The village was home to several businesses, including a bank, a hotel, a grocery store, and a post office.
In the 1950s, the village experienced a period of decline. The population decreased from 1,500 in 1950 to 1,200 in 1960. The decline was due to the closing of the railroad and the lack of industry in the area.
Geography
Heyworth is located in McLean County, Illinois. It is situated in the central part of the state, about 25 miles east of Bloomington and about 30 miles west of Champaign. The village is located in the heart of the Midwest, and is surrounded by rolling hills and farmland.
The village is located on the banks of the Sangamon River, which flows through the area. The village is also located near several lakes, including Lake Bloomington, Lake Evergreen, and Lake Heyworth.
Economy
The economy of Heyworth is largely based on agriculture. The village is home to several farms, which produce corn, soybeans, and other crops. The village is also home to several businesses, including a bank, a hotel, a grocery store, and a post office.
The village is also home to several manufacturing companies, including a plastics manufacturer, a metal fabricator, and a printing company. The village is also home to several small businesses, including restaurants, retail stores, and service providers.
Demographics
According to the 2010 census, the population of Heyworth is 2,841 people. The population is predominantly white (94.3%), with small percentages of African American (2.2%), Hispanic (1.7%), and Asian (1.2%) residents. The median household income is $50,945, and the median age is 38.
Conclusion
Heyworth is a small village located in McLean County, Illinois. It is situated in the central part of the state, about 25 miles east of Bloomington and about 30 miles west of Champaign. The village has a population of 2,841 people, according to the 2010 census. The village is known for its small-town charm and its close proximity to the larger cities of Bloomington and Champaign. The economy of Heyworth is largely based on agriculture, and the village is home to several businesses, including a bank, a hotel, a grocery store, and a post office. The population is predominantly white, with small percentages of African American, Hispanic, and Asian residents.
Common Questions
What is Per Capita Income in Heyworth?
Per Capita income in Heyworth is $33,350.
What is the Median Family Income in Heyworth?
Median Family Income in Heyworth is $97,938.
What is the Median Household income in Heyworth?
Median Household Income in Heyworth is $83,462.
What is Income or Wage Gap in Heyworth?
Income or Wage Gap in Heyworth is 27.7%.
Women in Heyworth earn 72.3 cents for every dollar earned by a man.
What is Inequality or Gini Index in Heyworth?
Inequality or Gini Index in Heyworth is 0.41.
What is the Total Population of Heyworth?
Total Population of Heyworth is 2,725.
What is the Total Male Population of Heyworth?
Total Male Population of Heyworth is 1,239.
What is the Total Female Population of Heyworth?
Total Female Population of Heyworth is 1,486.
What is the Ratio of Males per 100 Females in Heyworth?
There are 83.38 Males per 100 Females in Heyworth.
What is the Ratio of Females per 100 Males in Heyworth?
There are 119.94 Females per 100 Males in Heyworth.
What is the Median Population Age in Heyworth?
Median Population Age in Heyworth is 40.2 Years.
What is the Average Family Size in Heyworth
Average Family Size in Heyworth is 3.3 People.
What is the Average Household Size in Heyworth
Average Household Size in Heyworth is 2.8 People.
How Large is the Labor Force in Heyworth?
There are 1,232 People in the Labor Forcein in Heyworth.
What is the Percentage of People in the Labor Force in Heyworth?
60.9% of People are in the Labor Force in Heyworth.
What is the Unemployment Rate in Heyworth?
Unemployment Rate in Heyworth is 2.7%.