Earnings by Sex by Educational Attainment in Westervelt
Educational Attainment
Male Income
Female Income
Less than High School
-
-
High School Diploma
-
-
College or Associate's Degree
-
-
Bachelor's Degree
-
-
Graduate Degree
-
-
Total
-
-
Family Income in Westervelt
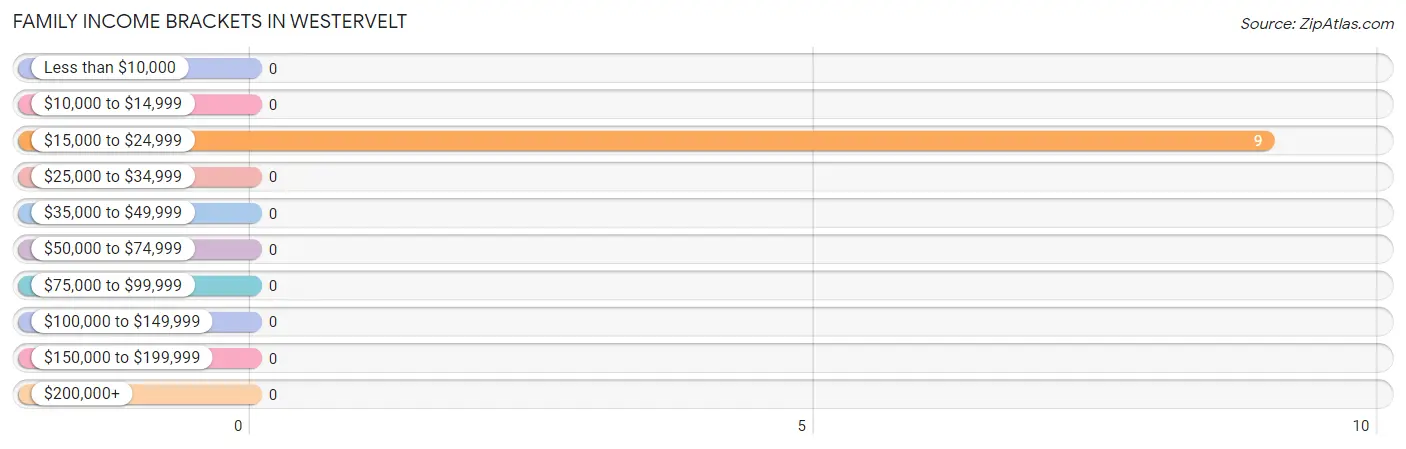
Family Income Brackets in Westervelt
According to the Westervelt family income data, there are 9 families falling into the $15,000 to $24,999 income range, which is the most common income bracket and makes up 100.0% of all families.
Income Bracket
# Families
% Families
Less than $10,000
0
0.0%
$10,000 to $14,999
0
0.0%
$15,000 to $24,999
9
100.0%
$25,000 to $34,999
0
0.0%
$35,000 to $49,999
0
0.0%
$50,000 to $74,999
0
0.0%
$75,000 to $99,999
0
0.0%
$100,000 to $149,999
0
0.0%
$150,000 to $199,999
0
0.0%
$200,000+
0
0.0%
Family Income by Famaliy Size in Westervelt
Income Bracket
# Families
Median Income
2-Person Families
0 (0.0%)
$0
3-Person Families
9 (100.0%)
$0
4-Person Families
0 (0.0%)
$0
5-Person Families
0 (0.0%)
$0
6-Person Families
0 (0.0%)
$0
7+ Person Families
0 (0.0%)
$0
Total
9 (100.0%)
$0
Family Income by Number of Earners in Westervelt
Number of Earners
# Families
Median Income
No Earners
0 (0.0%)
$0
1 Earner
9 (100.0%)
$0
2 Earners
0 (0.0%)
$0
3+ Earners
0 (0.0%)
$0
Total
9 (100.0%)
$0
Household Income in Westervelt
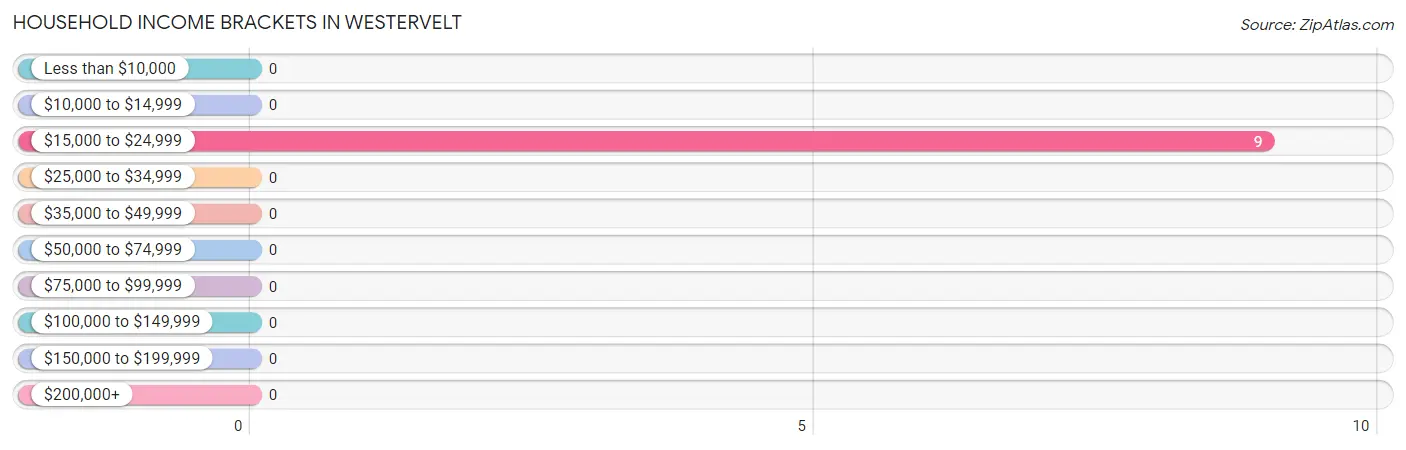
Household Income Brackets in Westervelt
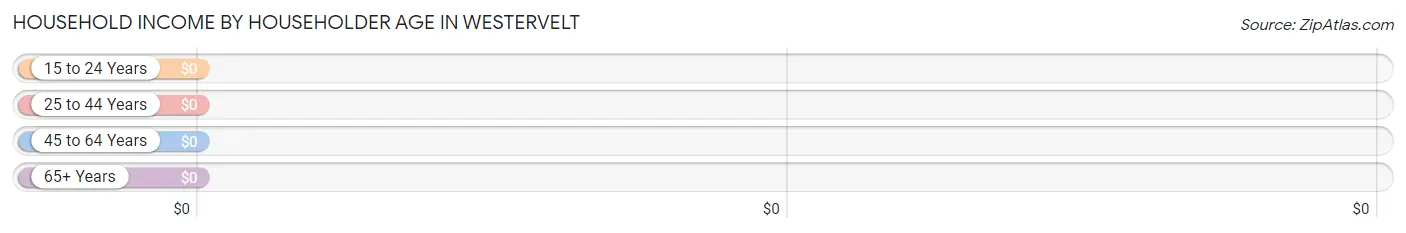
With 9 households falling in the category, the $15,000 to $24,999 income range is the most frequent in Westervelt, accounting for 100.0% of all households.
Income Bracket
# Households
% Households
Less than $10,000
0
0.0%
$10,000 to $14,999
0
0.0%
$15,000 to $24,999
9
100.0%
$25,000 to $34,999
0
0.0%
$35,000 to $49,999
0
0.0%
$50,000 to $74,999
0
0.0%
$75,000 to $99,999
0
0.0%
$100,000 to $149,999
0
0.0%
$150,000 to $199,999
0
0.0%
$200,000+
0
0.0%
Household Income by Householder Age in Westervelt
Income Bracket
# Households
Median Income
15 to 24 Years
0 (0.0%)
$0
25 to 44 Years
9 (100.0%)
$0
45 to 64 Years
0 (0.0%)
$0
65+ Years
0 (0.0%)
$0
Total
9 (100.0%)
$0
Poverty in Westervelt
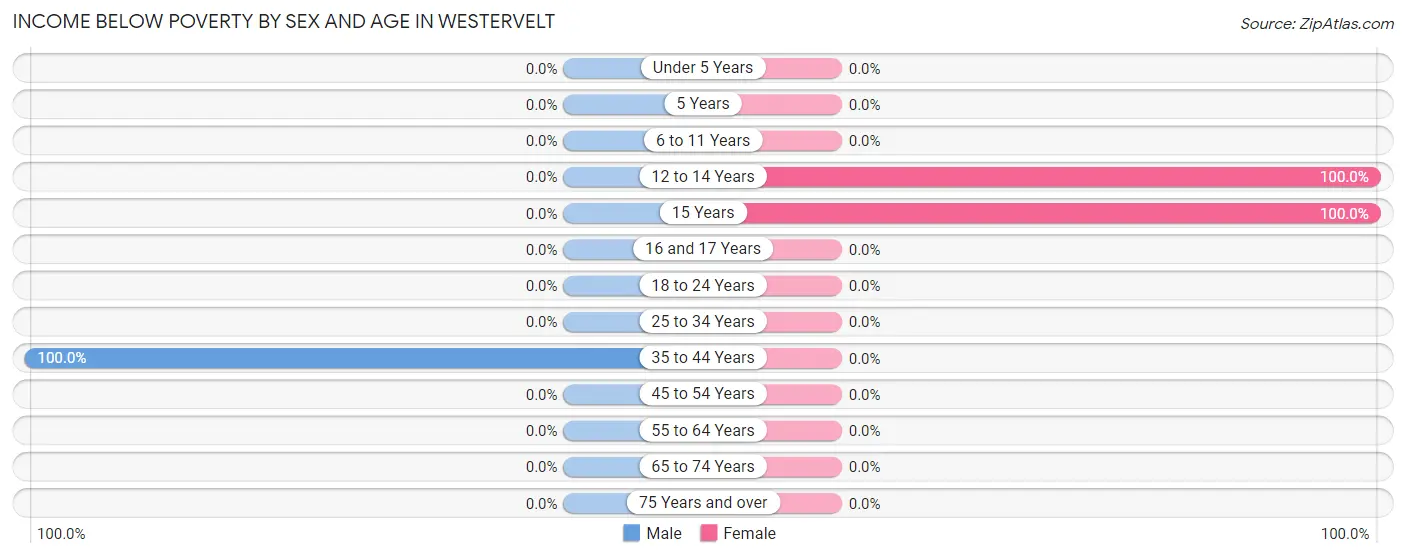
Income Below Poverty by Sex and Age in Westervelt
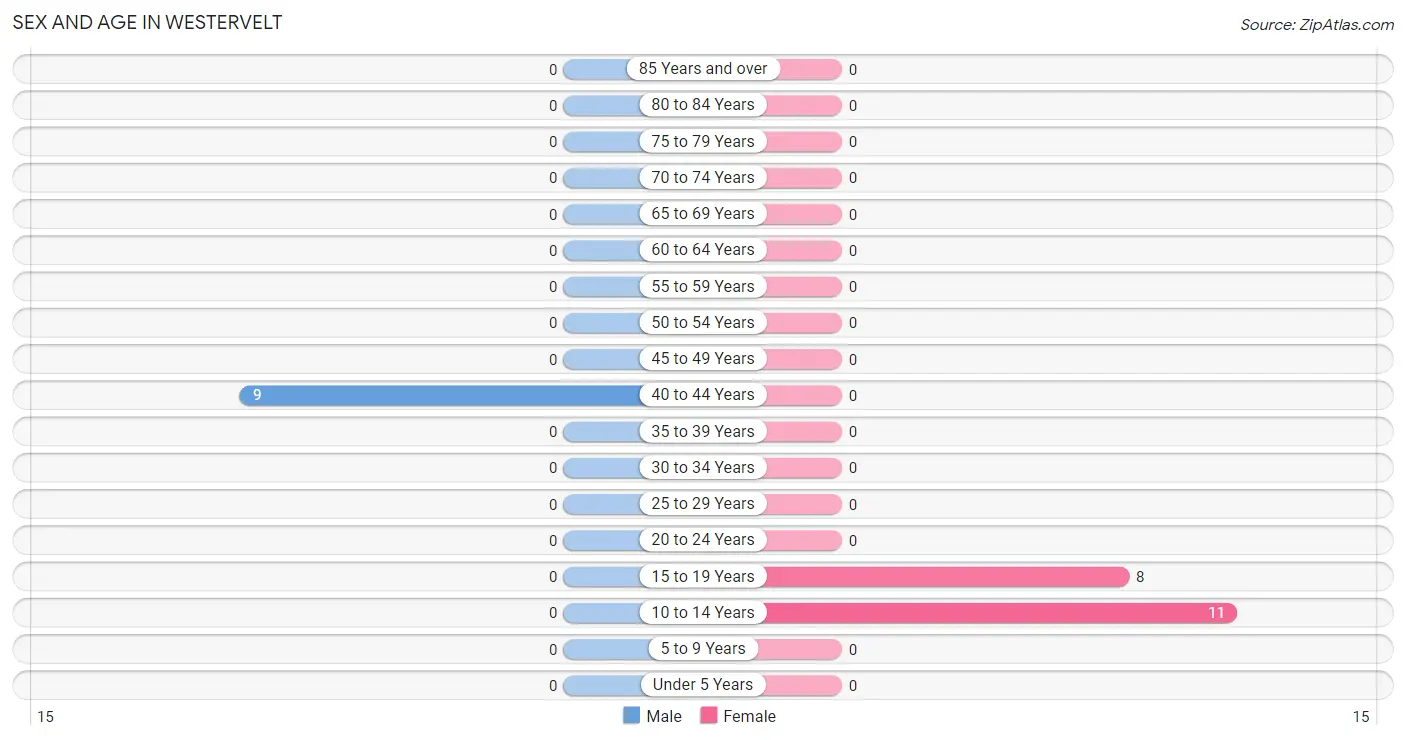
With 100.0% poverty level for males and 100.0% for females among the residents of Westervelt, 35 to 44 year old males and 12 to 14 year old females are the most vulnerable to poverty, with 9 males (100.0%) and 11 females (100.0%) in their respective age groups living below the poverty level.
Age Bracket
Male
Female
Under 5 Years
0 (0.0%)
0 (0.0%)
5 Years
0 (0.0%)
0 (0.0%)
6 to 11 Years
0 (0.0%)
0 (0.0%)
12 to 14 Years
0 (0.0%)
11 (100.0%)
15 Years
0 (0.0%)
8 (100.0%)
16 and 17 Years
0 (0.0%)
0 (0.0%)
18 to 24 Years
0 (0.0%)
0 (0.0%)
25 to 34 Years
0 (0.0%)
0 (0.0%)
35 to 44 Years
9 (100.0%)
0 (0.0%)
45 to 54 Years
0 (0.0%)
0 (0.0%)
55 to 64 Years
0 (0.0%)
0 (0.0%)
65 to 74 Years
0 (0.0%)
0 (0.0%)
75 Years and over
0 (0.0%)
0 (0.0%)
Total
9 (100.0%)
19 (100.0%)
Income Above Poverty by Sex and Age in Westervelt
Age Bracket
Male
Female
Under 5 Years
0 (0.0%)
0 (0.0%)
5 Years
0 (0.0%)
0 (0.0%)
6 to 11 Years
0 (0.0%)
0 (0.0%)
12 to 14 Years
0 (0.0%)
0 (0.0%)
15 Years
0 (0.0%)
0 (0.0%)
16 and 17 Years
0 (0.0%)
0 (0.0%)
18 to 24 Years
0 (0.0%)
0 (0.0%)
25 to 34 Years
0 (0.0%)
0 (0.0%)
35 to 44 Years
0 (0.0%)
0 (0.0%)
45 to 54 Years
0 (0.0%)
0 (0.0%)
55 to 64 Years
0 (0.0%)
0 (0.0%)
65 to 74 Years
0 (0.0%)
0 (0.0%)
75 Years and over
0 (0.0%)
0 (0.0%)
Total
0 (0.0%)
0 (0.0%)
Income Below Poverty Among Married-Couple Families in Westervelt
Children
Above Poverty
Below Poverty
No Children
0 (0.0%)
0 (0.0%)
1 or 2 Children
0 (0.0%)
0 (0.0%)
3 or 4 Children
0 (0.0%)
0 (0.0%)
5 or more Children
0 (0.0%)
0 (0.0%)
Total
0 (0.0%)
0 (0.0%)
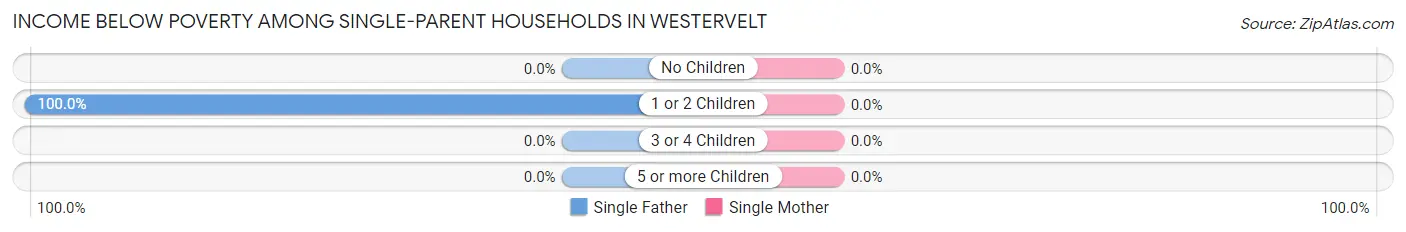
Income Below Poverty Among Single-Parent Households in Westervelt
Children
Single Father
Single Mother
No Children
0 (0.0%)
0 (0.0%)
1 or 2 Children
9 (100.0%)
0 (0.0%)
3 or 4 Children
0 (0.0%)
0 (0.0%)
5 or more Children
0 (0.0%)
0 (0.0%)
Total
9 (100.0%)
0 (0.0%)
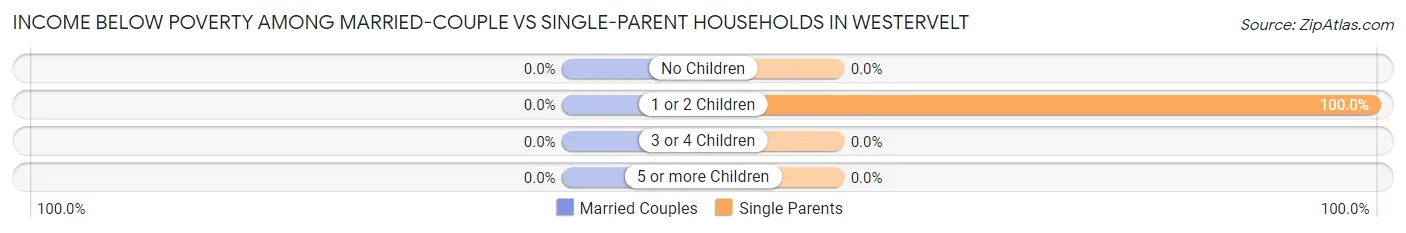
Income Below Poverty Among Married-Couple vs Single-Parent Households in Westervelt
Children
Married-Couple Families
Single-Parent Households
No Children
0 (0.0%)
0 (0.0%)
1 or 2 Children
0 (0.0%)
9 (100.0%)
3 or 4 Children
0 (0.0%)
0 (0.0%)
5 or more Children
0 (0.0%)
0 (0.0%)
Total
0 (0.0%)
9 (100.0%)
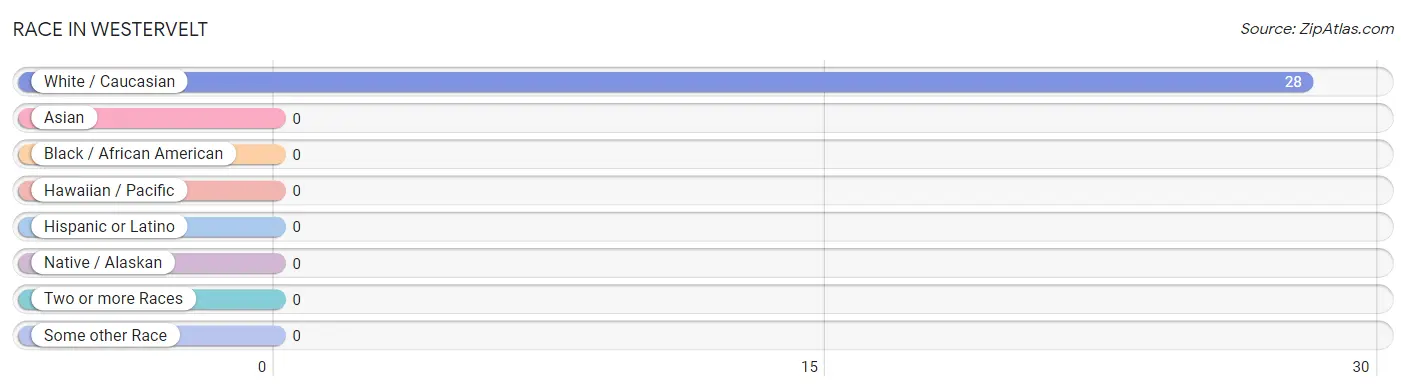
Race in Westervelt
The most populous races in Westervelt are , and White / Caucasian (28 | 100.0%).
Race
# Population
% Population
Asian
0
0.0%
Black / African American
0
0.0%
Hawaiian / Pacific
0
0.0%
Hispanic or Latino
0
0.0%
Native / Alaskan
0
0.0%
White / Caucasian
28
100.0%
Two or more Races
0
0.0%
Some other Race
0
0.0%
Total
28
100.0%
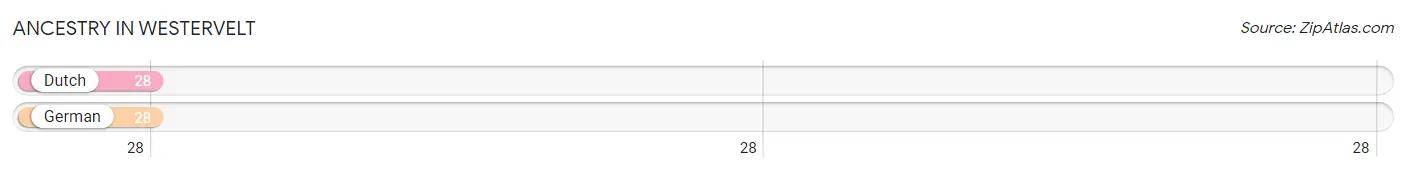
Ancestry in Westervelt
The most populous ancestries reported in Westervelt are Dutch (28 | 100.0%), and German (28 | 100.0%), together accounting for 200.0% of all Westervelt residents.
Ancestry
# Population
% Population
Dutch
28
100.0%
German
28
100.0%
View All 2 Rows
Immigrants in Westervelt
Immigration Origin
# Population
% Population
View All 0 Rows
Sex and Age in Westervelt
Sex and Age in Westervelt
The most populous age groups in Westervelt are 40 to 44 Years (9 | 100.0%) for men and 10 to 14 Years (11 | 57.9%) for women.
Age Bracket
Male
Female
Under 5 Years
0 (0.0%)
0 (0.0%)
5 to 9 Years
0 (0.0%)
0 (0.0%)
10 to 14 Years
0 (0.0%)
11 (57.9%)
15 to 19 Years
0 (0.0%)
8 (42.1%)
20 to 24 Years
0 (0.0%)
0 (0.0%)
25 to 29 Years
0 (0.0%)
0 (0.0%)
30 to 34 Years
0 (0.0%)
0 (0.0%)
35 to 39 Years
0 (0.0%)
0 (0.0%)
40 to 44 Years
9 (100.0%)
0 (0.0%)
45 to 49 Years
0 (0.0%)
0 (0.0%)
50 to 54 Years
0 (0.0%)
0 (0.0%)
55 to 59 Years
0 (0.0%)
0 (0.0%)
60 to 64 Years
0 (0.0%)
0 (0.0%)
65 to 69 Years
0 (0.0%)
0 (0.0%)
70 to 74 Years
0 (0.0%)
0 (0.0%)
75 to 79 Years
0 (0.0%)
0 (0.0%)
80 to 84 Years
0 (0.0%)
0 (0.0%)
85 Years and over
0 (0.0%)
0 (0.0%)
Total
9 (100.0%)
19 (100.0%)
Families and Households in Westervelt
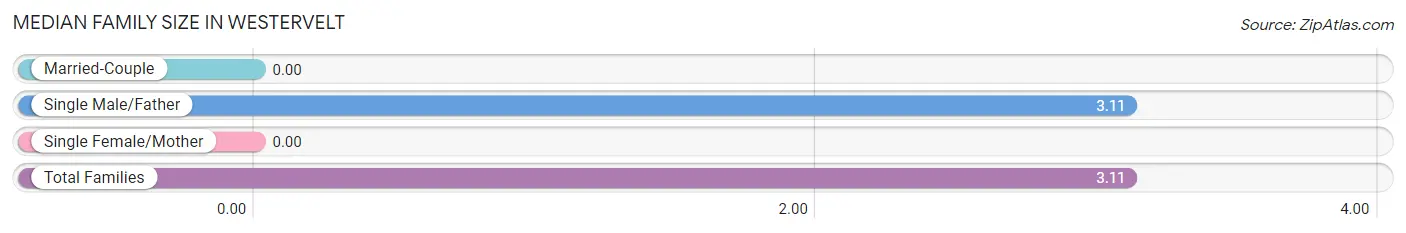
Median Family Size in Westervelt
Family Type
# Families
Family Size
Married-Couple
0 (0.0%)
-
Single Male/Father
9 (100.0%)
3.11
Single Female/Mother
0 (0.0%)
-
Total Families
9 (100.0%)
3.11
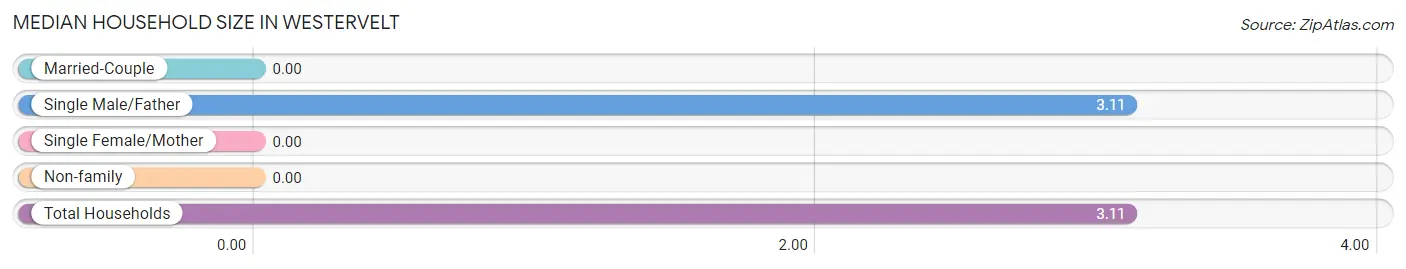
Median Household Size in Westervelt
Household Type
# Households
Household Size
Married-Couple
0 (0.0%)
-
Single Male/Father
9 (100.0%)
3.11
Single Female/Mother
0 (0.0%)
-
Non-family
0 (0.0%)
-
Total Households
9 (100.0%)
3.11
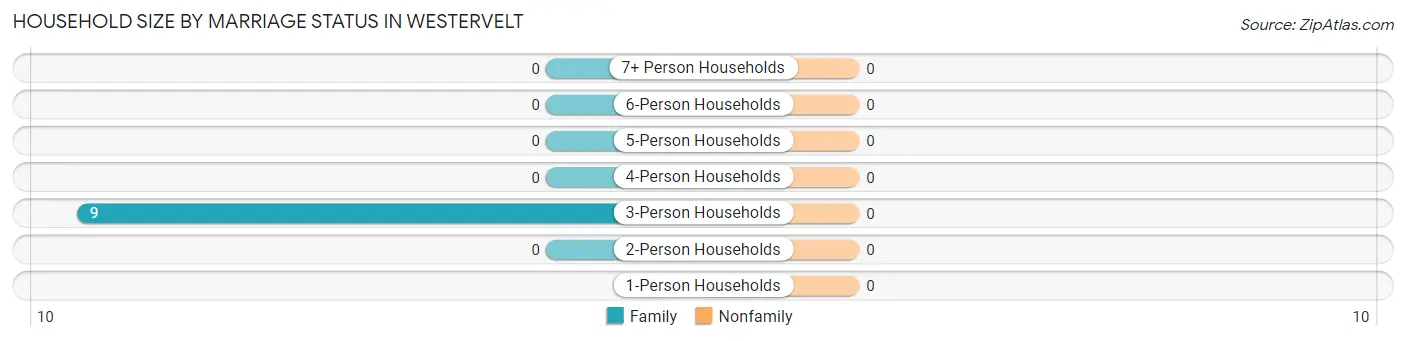
Household Size by Marriage Status in Westervelt
Household Size
Family Households
Nonfamily Households
1-Person Households
-
0 (0.0%)
2-Person Households
0 (0.0%)
0 (0.0%)
3-Person Households
9 (100.0%)
0 (0.0%)
4-Person Households
0 (0.0%)
0 (0.0%)
5-Person Households
0 (0.0%)
0 (0.0%)
6-Person Households
0 (0.0%)
0 (0.0%)
7+ Person Households
0 (0.0%)
0 (0.0%)
Total
9 (100.0%)
0 (0.0%)
Female Fertility in Westervelt
Fertility by Age in Westervelt
Age Bracket
Women with Births
Births / 1,000 Women
15 to 19 years
0 (0.0%)
0.0
20 to 34 years
0 (0.0%)
0.0
35 to 50 years
0 (0.0%)
0.0
Total
0 (0.0%)
0.0
Fertility by Age by Marriage Status in Westervelt
Age Bracket
Married
Unmarried
15 to 19 years
0 (0.0%)
0 (0.0%)
20 to 34 years
0 (0.0%)
0 (0.0%)
35 to 50 years
0 (0.0%)
0 (0.0%)
Total
0 (0.0%)
0 (0.0%)
Fertility by Education in Westervelt
Educational Attainment
Women with Births
Births / 1,000 Women
Less than High School
0 (0.0%)
0.0
High School Diploma
0 (0.0%)
0.0
College or Associate's Degree
0 (0.0%)
0.0
Bachelor's Degree
0 (0.0%)
0.0
Graduate Degree
0 (0.0%)
0.0
Total
0 (0.0%)
0.0
Fertility by Education by Marriage Status in Westervelt
Educational Attainment
Married
Unmarried
Less than High School
0 (0.0%)
0 (0.0%)
High School Diploma
0 (0.0%)
0 (0.0%)
College or Associate's Degree
0 (0.0%)
0 (0.0%)
Bachelor's Degree
0 (0.0%)
0 (0.0%)
Graduate Degree
0 (0.0%)
0 (0.0%)
Total
0 (0.0%)
0 (0.0%)
Employment Characteristics in Westervelt
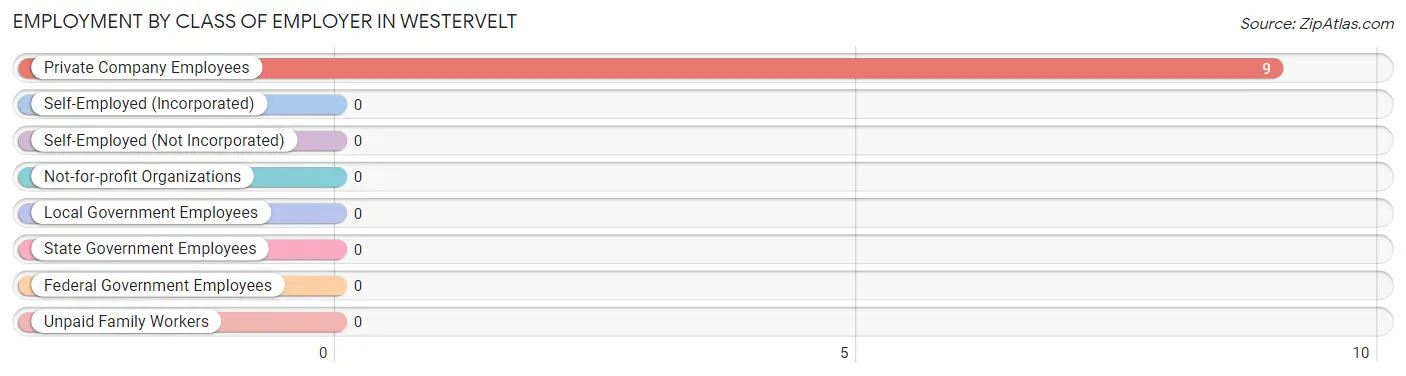
Employment by Class of Employer in Westervelt
Among the 9 employed individuals in Westervelt, , and private company employees (9 | 100.0%) make up the most common classes of employment.
Employer Class
# Employees
% Employees
Private Company Employees
9
100.0%
Self-Employed (Incorporated)
0
0.0%
Self-Employed (Not Incorporated)
0
0.0%
Not-for-profit Organizations
0
0.0%
Local Government Employees
0
0.0%
State Government Employees
0
0.0%
Federal Government Employees
0
0.0%
Unpaid Family Workers
0
0.0%
Total
9
100.0%
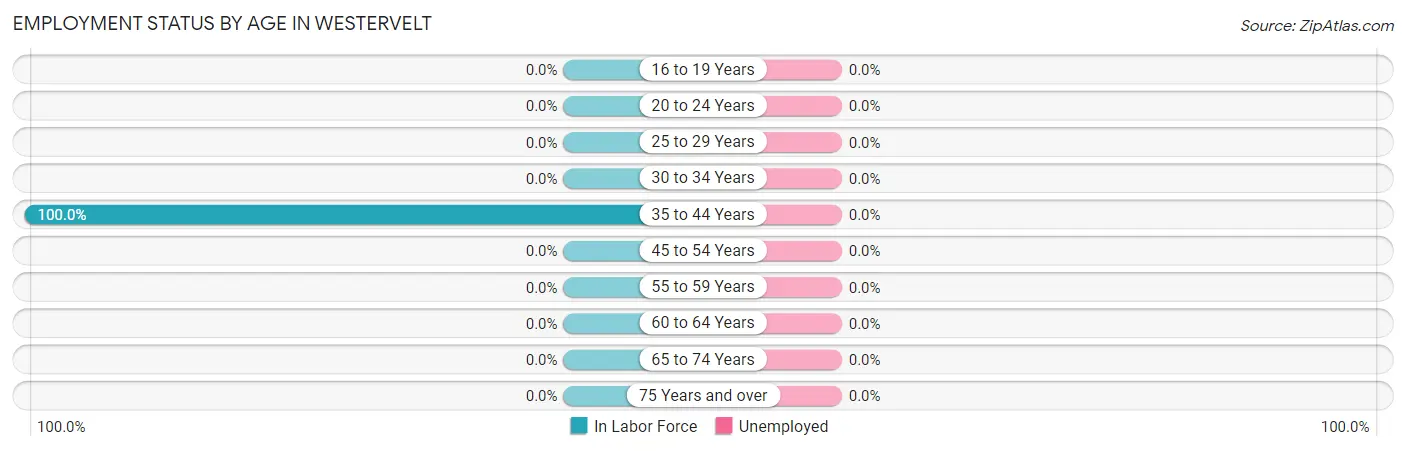
Employment Status by Age in Westervelt
Age Bracket
In Labor Force
Unemployed
16 to 19 Years
0 (0.0%)
0 (0.0%)
20 to 24 Years
0 (0.0%)
0 (0.0%)
25 to 29 Years
0 (0.0%)
0 (0.0%)
30 to 34 Years
0 (0.0%)
0 (0.0%)
35 to 44 Years
9 (100.0%)
0 (0.0%)
45 to 54 Years
0 (0.0%)
0 (0.0%)
55 to 59 Years
0 (0.0%)
0 (0.0%)
60 to 64 Years
0 (0.0%)
0 (0.0%)
65 to 74 Years
0 (0.0%)
0 (0.0%)
75 Years and over
0 (0.0%)
0 (0.0%)
Total
9 (100.0%)
0 (0.0%)
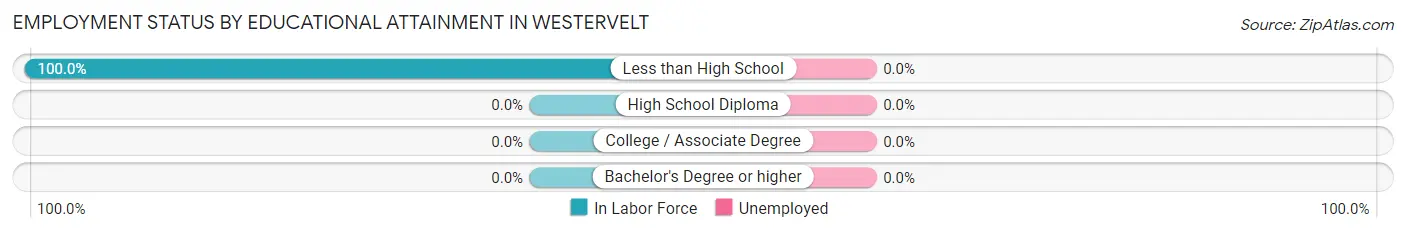
Employment Status by Educational Attainment in Westervelt
Educational Attainment
In Labor Force
Unemployed
Less than High School
9 (100.0%)
0 (0.0%)
High School Diploma
0 (0.0%)
0 (0.0%)
College / Associate Degree
0 (0.0%)
0 (0.0%)
Bachelor's Degree or higher
0 (0.0%)
0 (0.0%)
Total
9 (100.0%)
0 (0.0%)
Employment Occupations by Sex in Westervelt
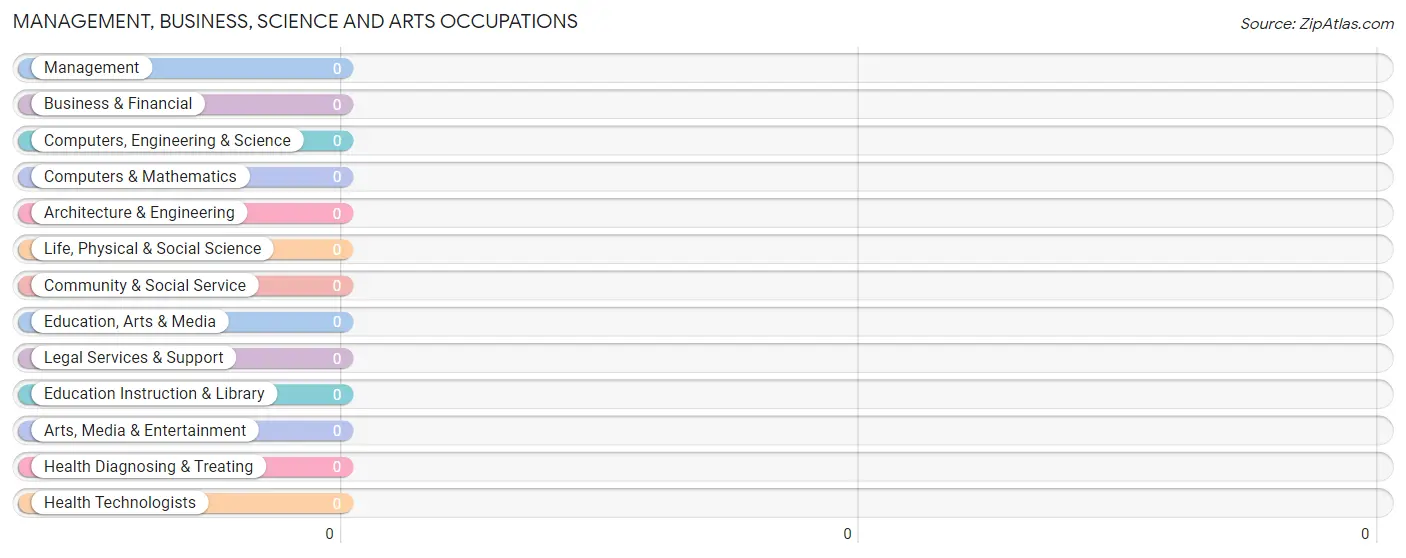
Management, Business, Science and Arts Occupations
Management, Business, Science and Arts Occupations by Sex
Occupation
Male
Female
Management
0 (0.0%)
0 (0.0%)
Business & Financial
0 (0.0%)
0 (0.0%)
Computers, Engineering & Science
0 (0.0%)
0 (0.0%)
Computers & Mathematics
0 (0.0%)
0 (0.0%)
Architecture & Engineering
0 (0.0%)
0 (0.0%)
Life, Physical & Social Science
0 (0.0%)
0 (0.0%)
Community & Social Service
0 (0.0%)
0 (0.0%)
Education, Arts & Media
0 (0.0%)
0 (0.0%)
Legal Services & Support
0 (0.0%)
0 (0.0%)
Education Instruction & Library
0 (0.0%)
0 (0.0%)
Arts, Media & Entertainment
0 (0.0%)
0 (0.0%)
Health Diagnosing & Treating
0 (0.0%)
0 (0.0%)
Health Technologists
0 (0.0%)
0 (0.0%)
Total (Category)
0 (0.0%)
0 (0.0%)
Total (Overall)
9 (100.0%)
0 (0.0%)
Services Occupations
Services Occupations by Sex
Occupation
Male
Female
Healthcare Support
0 (0.0%)
0 (0.0%)
Security & Protection
0 (0.0%)
0 (0.0%)
Firefighting & Prevention
0 (0.0%)
0 (0.0%)
Law Enforcement
0 (0.0%)
0 (0.0%)
Food Preparation & Serving
0 (0.0%)
0 (0.0%)
Cleaning & Maintenance
0 (0.0%)
0 (0.0%)
Personal Care & Service
0 (0.0%)
0 (0.0%)
Total (Category)
0 (0.0%)
0 (0.0%)
Total (Overall)
9 (100.0%)
0 (0.0%)
Sales and Office Occupations
Sales and Office Occupations by Sex
Occupation
Male
Female
Sales & Related
0 (0.0%)
0 (0.0%)
Office & Administration
0 (0.0%)
0 (0.0%)
Total (Category)
0 (0.0%)
0 (0.0%)
Total (Overall)
9 (100.0%)
0 (0.0%)
Natural Resources, Construction and Maintenance Occupations
Natural Resources, Construction and Maintenance Occupations by Sex
Occupation
Male
Female
Farming, Fishing & Forestry
0 (0.0%)
0 (0.0%)
Construction & Extraction
0 (0.0%)
0 (0.0%)
Installation, Maintenance & Repair
0 (0.0%)
0 (0.0%)
Total (Category)
0 (0.0%)
0 (0.0%)
Total (Overall)
9 (100.0%)
0 (0.0%)
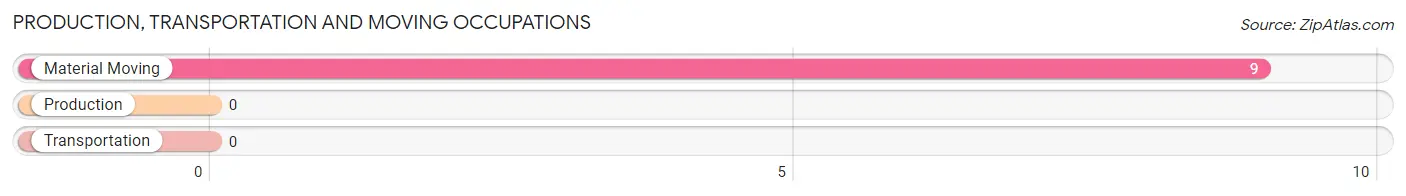
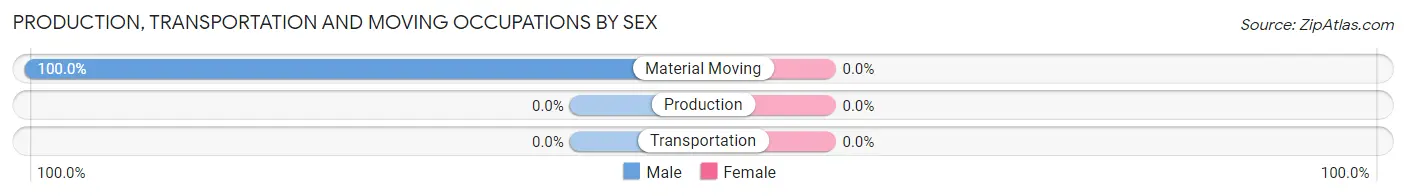
Production, Transportation and Moving Occupations
The most common Production, Transportation and Moving occupations in Westervelt are , and Material Moving (9 | 100.0%).
Production, Transportation and Moving Occupations by Sex
Occupation
Male
Female
Production
0 (0.0%)
0 (0.0%)
Transportation
0 (0.0%)
0 (0.0%)
Material Moving
9 (100.0%)
0 (0.0%)
Total (Category)
9 (100.0%)
0 (0.0%)
Total (Overall)
9 (100.0%)
0 (0.0%)
Employment Industries by Sex in Westervelt
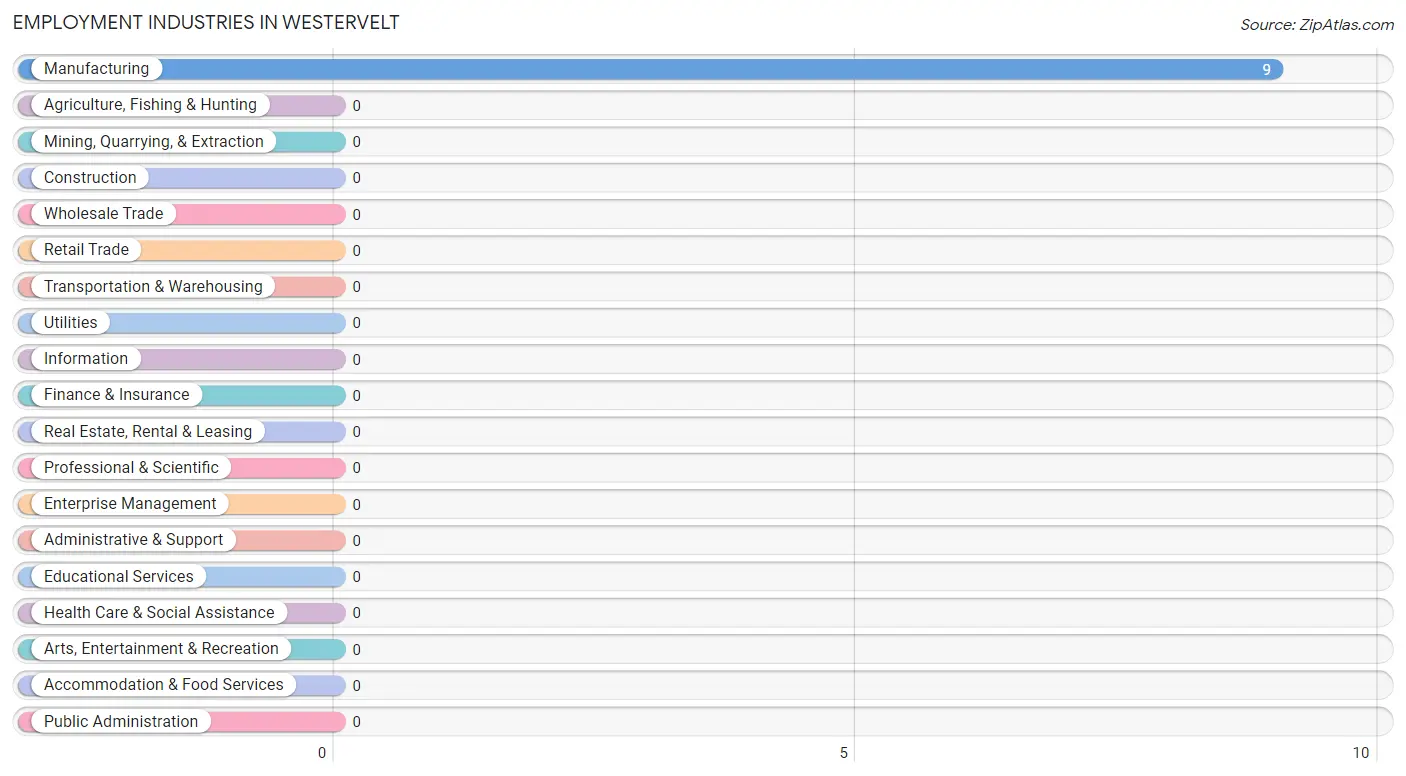
Employment Industries in Westervelt
The major employment industries in Westervelt include , and Manufacturing (9 | 100.0%).
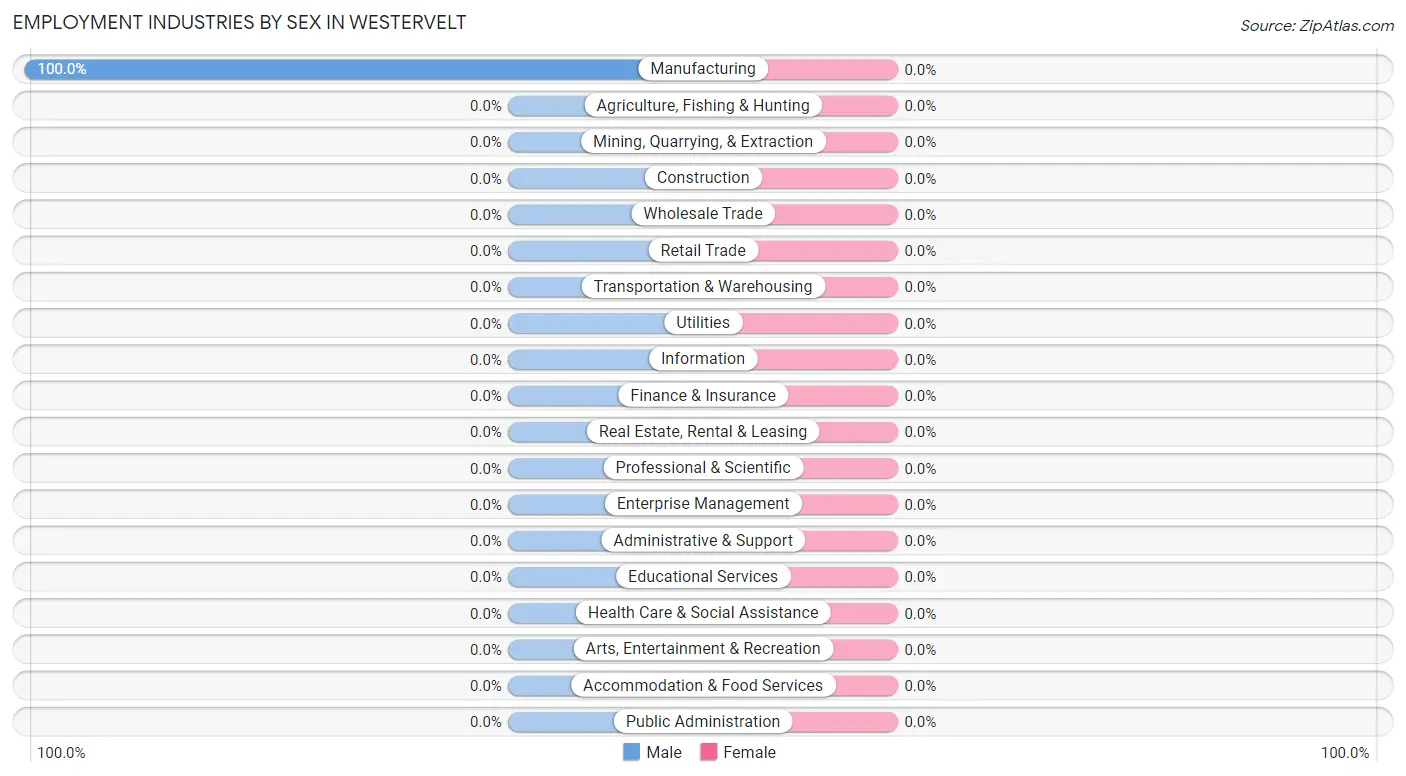
Employment Industries by Sex in Westervelt
Industry
Male
Female
Agriculture, Fishing & Hunting
0 (0.0%)
0 (0.0%)
Mining, Quarrying, & Extraction
0 (0.0%)
0 (0.0%)
Construction
0 (0.0%)
0 (0.0%)
Manufacturing
9 (100.0%)
0 (0.0%)
Wholesale Trade
0 (0.0%)
0 (0.0%)
Retail Trade
0 (0.0%)
0 (0.0%)
Transportation & Warehousing
0 (0.0%)
0 (0.0%)
Utilities
0 (0.0%)
0 (0.0%)
Information
0 (0.0%)
0 (0.0%)
Finance & Insurance
0 (0.0%)
0 (0.0%)
Real Estate, Rental & Leasing
0 (0.0%)
0 (0.0%)
Professional & Scientific
0 (0.0%)
0 (0.0%)
Enterprise Management
0 (0.0%)
0 (0.0%)
Administrative & Support
0 (0.0%)
0 (0.0%)
Educational Services
0 (0.0%)
0 (0.0%)
Health Care & Social Assistance
0 (0.0%)
0 (0.0%)
Arts, Entertainment & Recreation
0 (0.0%)
0 (0.0%)
Accommodation & Food Services
0 (0.0%)
0 (0.0%)
Public Administration
0 (0.0%)
0 (0.0%)
Total
9 (100.0%)
0 (0.0%)
Education in Westervelt
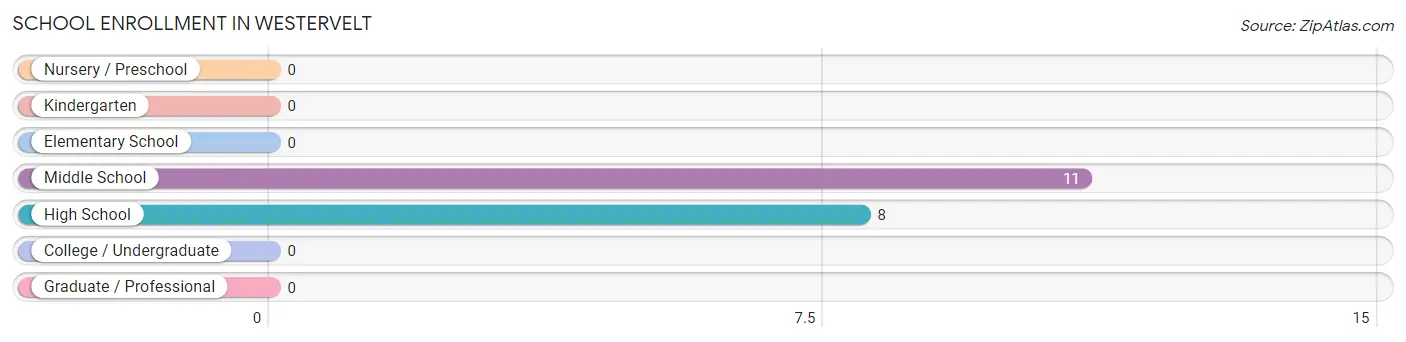
School Enrollment in Westervelt
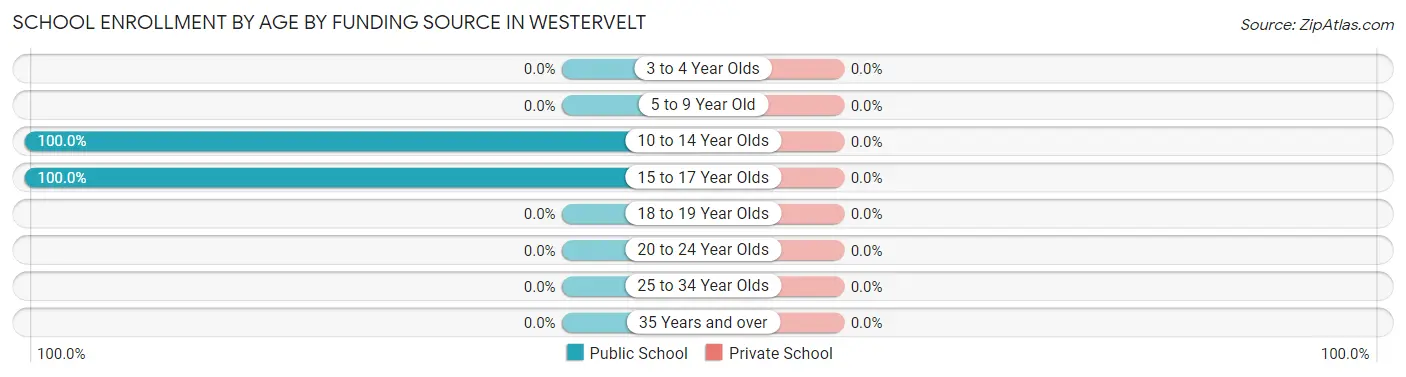
The most common levels of schooling among the 19 students in Westervelt are middle school (11 | 57.9%), and high school (8 | 42.1%).
School Level
# Students
% Students
Nursery / Preschool
0
0.0%
Kindergarten
0
0.0%
Elementary School
0
0.0%
Middle School
11
57.9%
High School
8
42.1%
College / Undergraduate
0
0.0%
Graduate / Professional
0
0.0%
Total
19
100.0%
School Enrollment by Age by Funding Source in Westervelt
Age Bracket
Public School
Private School
3 to 4 Year Olds
0 (0.0%)
0 (0.0%)
5 to 9 Year Old
0 (0.0%)
0 (0.0%)
10 to 14 Year Olds
11 (100.0%)
0 (0.0%)
15 to 17 Year Olds
8 (100.0%)
0 (0.0%)
18 to 19 Year Olds
0 (0.0%)
0 (0.0%)
20 to 24 Year Olds
0 (0.0%)
0 (0.0%)
25 to 34 Year Olds
0 (0.0%)
0 (0.0%)
35 Years and over
0 (0.0%)
0 (0.0%)
Total
19 (100.0%)
0 (0.0%)
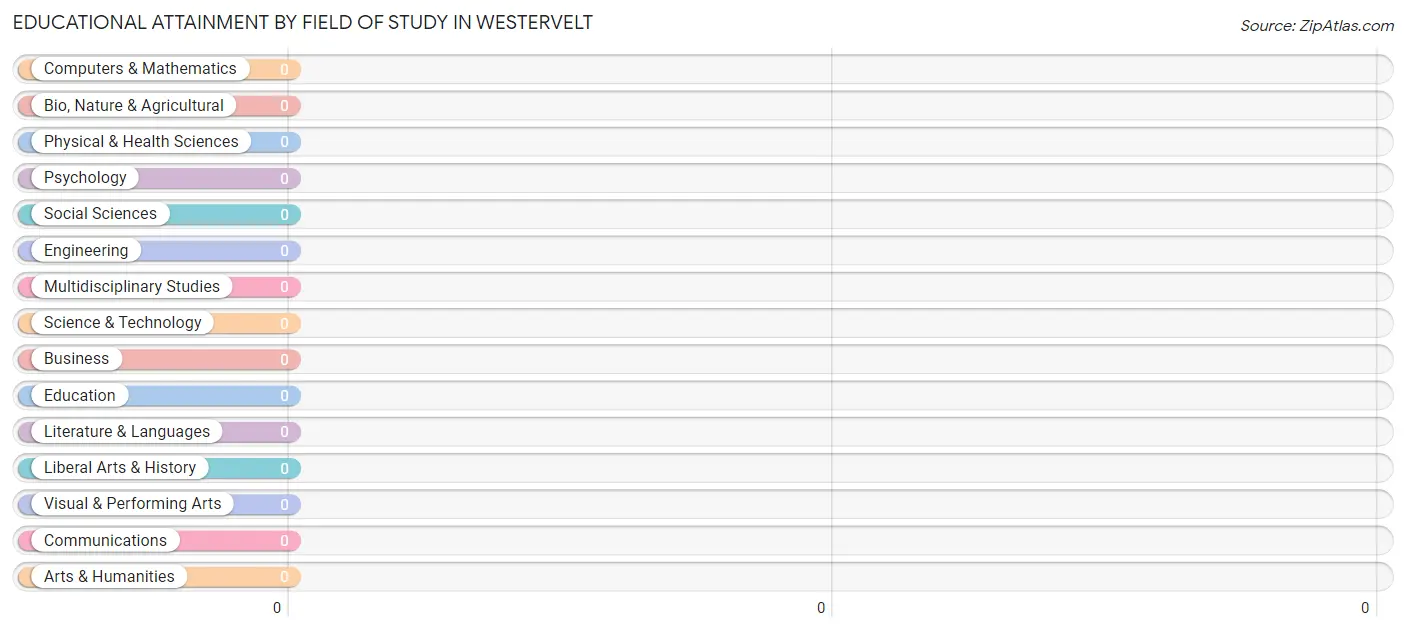
Educational Attainment by Field of Study in Westervelt
Field of Study
# Graduates
% Graduates
Computers & Mathematics
0
0.0%
Bio, Nature & Agricultural
0
0.0%
Physical & Health Sciences
0
0.0%
Psychology
0
0.0%
Social Sciences
0
0.0%
Engineering
0
0.0%
Multidisciplinary Studies
0
0.0%
Science & Technology
0
0.0%
Business
0
0.0%
Education
0
0.0%
Literature & Languages
0
0.0%
Liberal Arts & History
0
0.0%
Visual & Performing Arts
0
0.0%
Communications
0
0.0%
Arts & Humanities
0
0.0%
Total
0
0.0%
Transportation & Commute in Westervelt
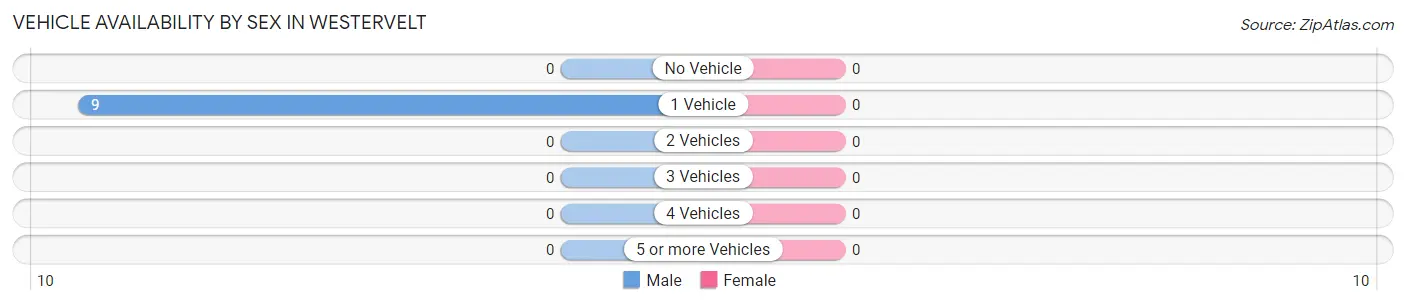
Vehicle Availability by Sex in Westervelt
Vehicles Available
Male
Female
No Vehicle
0 (0.0%)
0 (0.0%)
1 Vehicle
9 (100.0%)
0 (0.0%)
2 Vehicles
0 (0.0%)
0 (0.0%)
3 Vehicles
0 (0.0%)
0 (0.0%)
4 Vehicles
0 (0.0%)
0 (0.0%)
5 or more Vehicles
0 (0.0%)
0 (0.0%)
Total
9 (100.0%)
0 (0.0%)
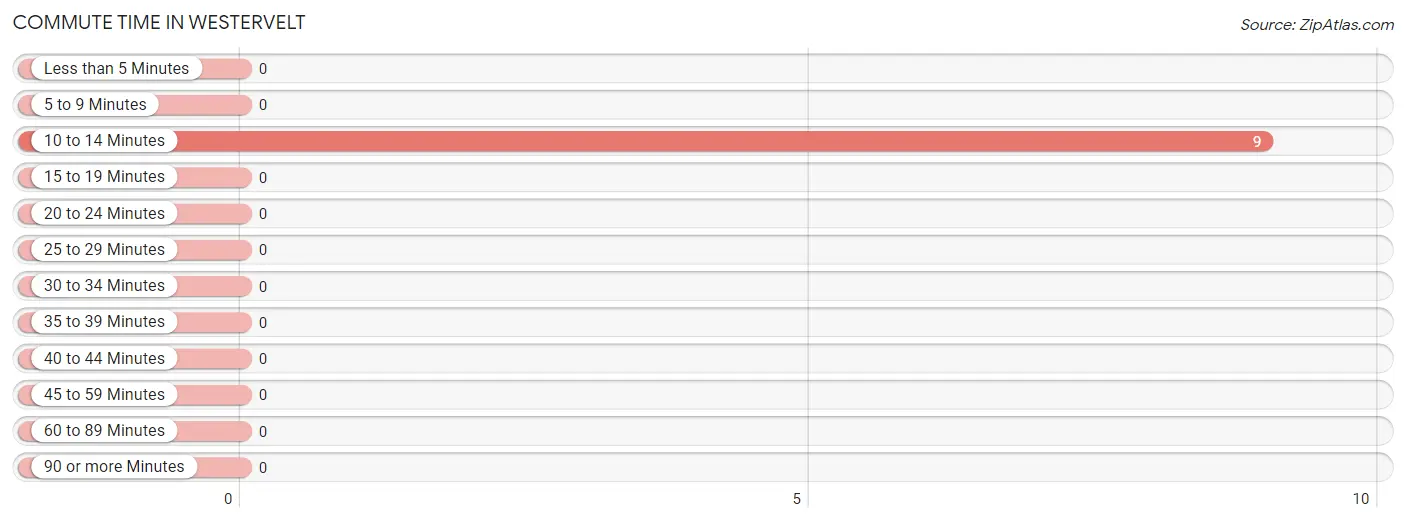
Commute Time in Westervelt
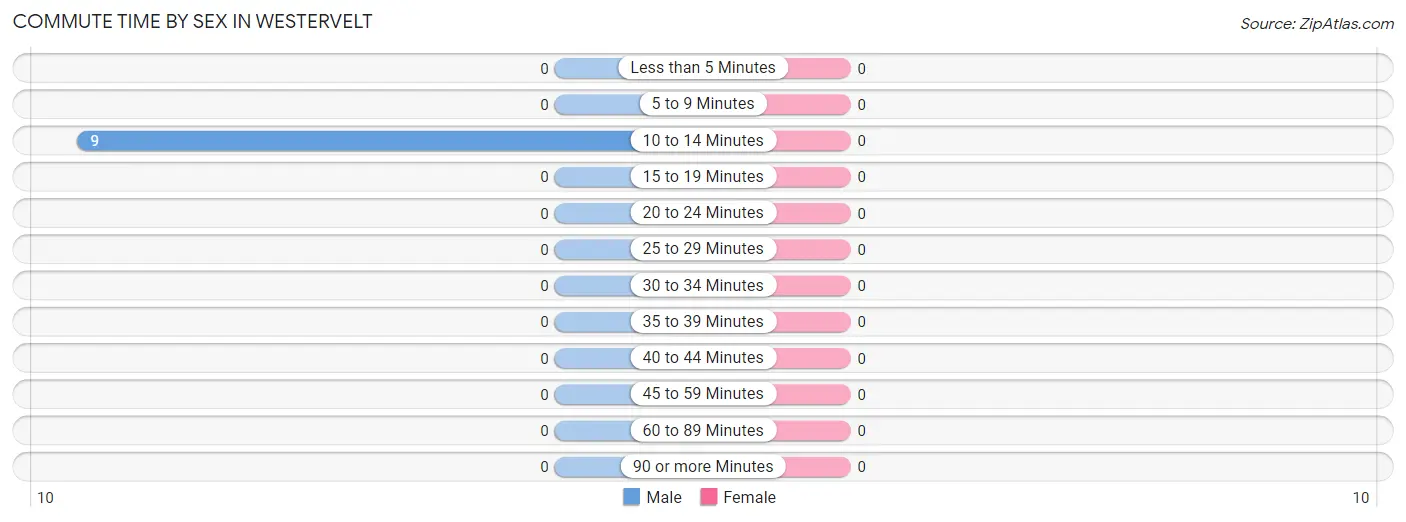
The most frequently occuring commute durations in Westervelt are 10 to 14 minutes (9 commuters, 100.0%), less than 5 minutes (0 commuters, 0.0%), and 5 to 9 minutes (0 commuters, 0.0%).
Commute Time
# Commuters
% Commuters
Less than 5 Minutes
0
0.0%
5 to 9 Minutes
0
0.0%
10 to 14 Minutes
9
100.0%
15 to 19 Minutes
0
0.0%
20 to 24 Minutes
0
0.0%
25 to 29 Minutes
0
0.0%
30 to 34 Minutes
0
0.0%
35 to 39 Minutes
0
0.0%
40 to 44 Minutes
0
0.0%
45 to 59 Minutes
0
0.0%
60 to 89 Minutes
0
0.0%
90 or more Minutes
0
0.0%
Commute Time by Sex in Westervelt
Commute Time
Male
Female
Less than 5 Minutes
0 (0.0%)
0 (0.0%)
5 to 9 Minutes
0 (0.0%)
0 (0.0%)
10 to 14 Minutes
9 (100.0%)
0 (0.0%)
15 to 19 Minutes
0 (0.0%)
0 (0.0%)
20 to 24 Minutes
0 (0.0%)
0 (0.0%)
25 to 29 Minutes
0 (0.0%)
0 (0.0%)
30 to 34 Minutes
0 (0.0%)
0 (0.0%)
35 to 39 Minutes
0 (0.0%)
0 (0.0%)
40 to 44 Minutes
0 (0.0%)
0 (0.0%)
45 to 59 Minutes
0 (0.0%)
0 (0.0%)
60 to 89 Minutes
0 (0.0%)
0 (0.0%)
90 or more Minutes
0 (0.0%)
0 (0.0%)
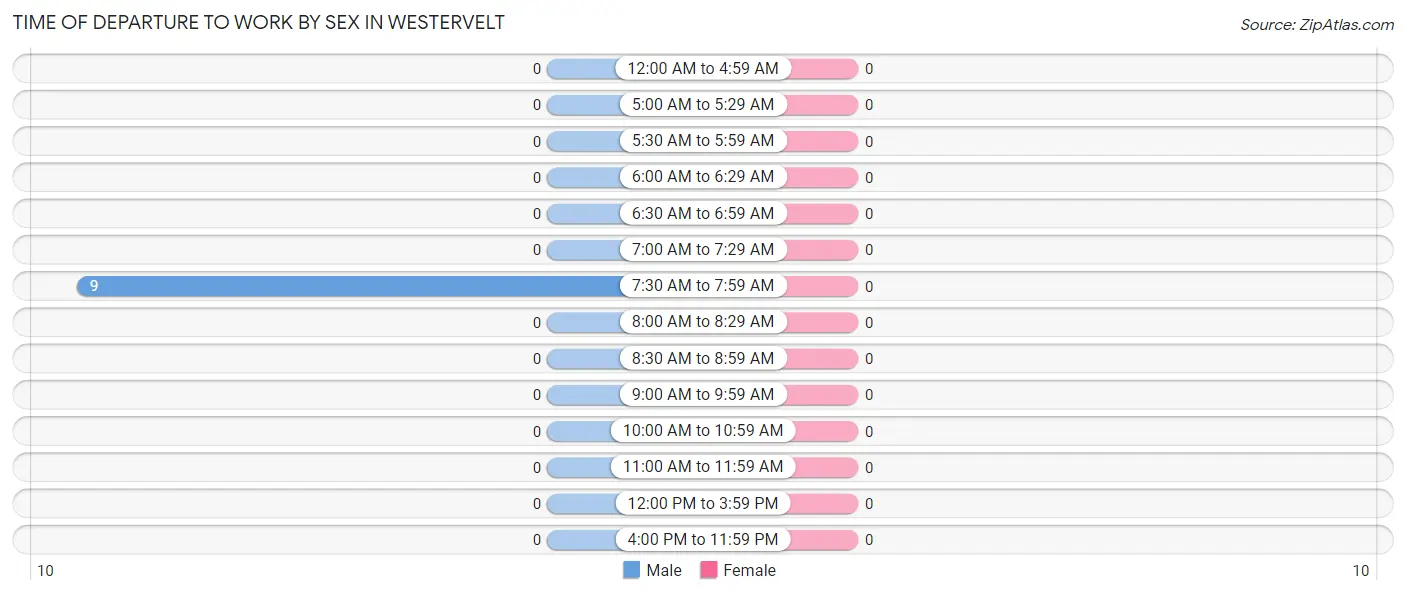
Time of Departure to Work by Sex in Westervelt
Time of Departure
Male
Female
12:00 AM to 4:59 AM
0 (0.0%)
0 (0.0%)
5:00 AM to 5:29 AM
0 (0.0%)
0 (0.0%)
5:30 AM to 5:59 AM
0 (0.0%)
0 (0.0%)
6:00 AM to 6:29 AM
0 (0.0%)
0 (0.0%)
6:30 AM to 6:59 AM
0 (0.0%)
0 (0.0%)
7:00 AM to 7:29 AM
0 (0.0%)
0 (0.0%)
7:30 AM to 7:59 AM
9 (100.0%)
0 (0.0%)
8:00 AM to 8:29 AM
0 (0.0%)
0 (0.0%)
8:30 AM to 8:59 AM
0 (0.0%)
0 (0.0%)
9:00 AM to 9:59 AM
0 (0.0%)
0 (0.0%)
10:00 AM to 10:59 AM
0 (0.0%)
0 (0.0%)
11:00 AM to 11:59 AM
0 (0.0%)
0 (0.0%)
12:00 PM to 3:59 PM
0 (0.0%)
0 (0.0%)
4:00 PM to 11:59 PM
0 (0.0%)
0 (0.0%)
Total
9 (100.0%)
0 (0.0%)
Housing Occupancy in Westervelt
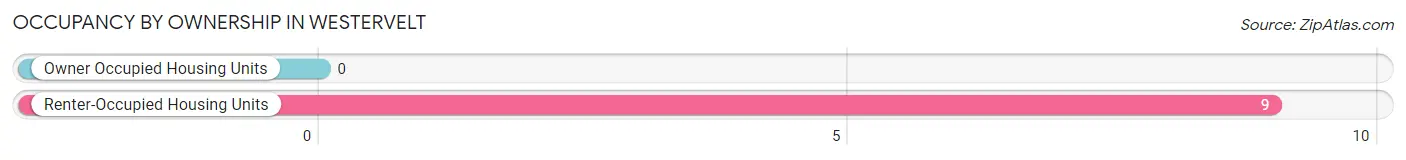
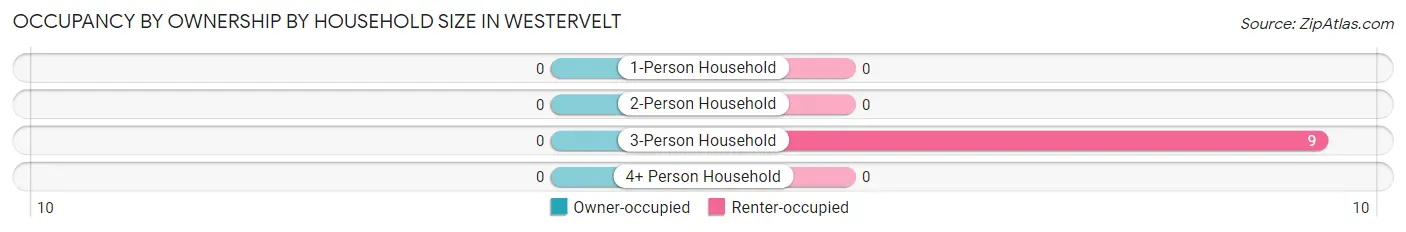
Occupancy by Ownership in Westervelt
Of the total 9 dwellings in Westervelt, owner-occupied units account for 0 (0.0%), while renter-occupied units make up 9 (100.0%).
Occupancy
# Housing Units
% Housing Units
Owner Occupied Housing Units
0
0.0%
Renter-Occupied Housing Units
9
100.0%
Total Occupied Housing Units
9
100.0%
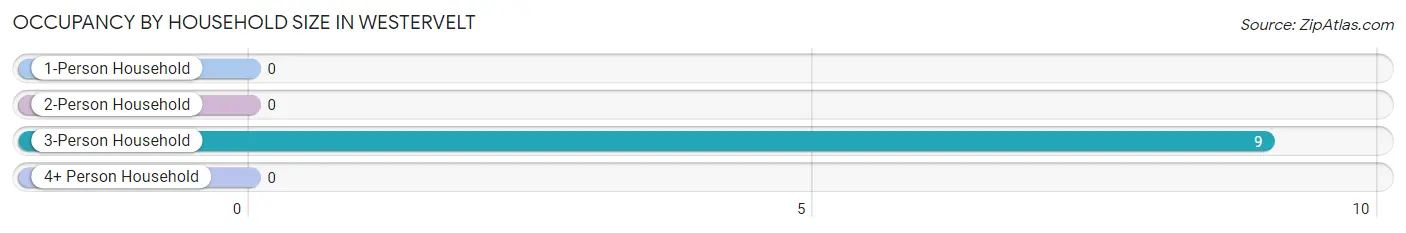
Occupancy by Household Size in Westervelt
Household Size
# Housing Units
% Housing Units
1-Person Household
0
0.0%
2-Person Household
0
0.0%
3-Person Household
9
100.0%
4+ Person Household
0
0.0%
Total Housing Units
9
100.0%
Occupancy by Ownership by Household Size in Westervelt
Household Size
Owner-occupied
Renter-occupied
1-Person Household
0 (0.0%)
0 (0.0%)
2-Person Household
0 (0.0%)
0 (0.0%)
3-Person Household
0 (0.0%)
9 (100.0%)
4+ Person Household
0 (0.0%)
0 (0.0%)
Total Housing Units
0 (0.0%)
9 (100.0%)
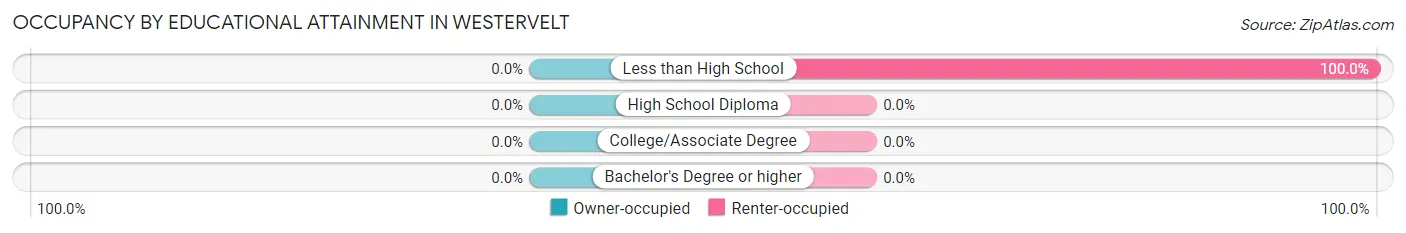
Occupancy by Educational Attainment in Westervelt
Household Size
Owner-occupied
Renter-occupied
Less than High School
0 (0.0%)
9 (100.0%)
High School Diploma
0 (0.0%)
0 (0.0%)
College/Associate Degree
0 (0.0%)
0 (0.0%)
Bachelor's Degree or higher
0 (0.0%)
0 (0.0%)
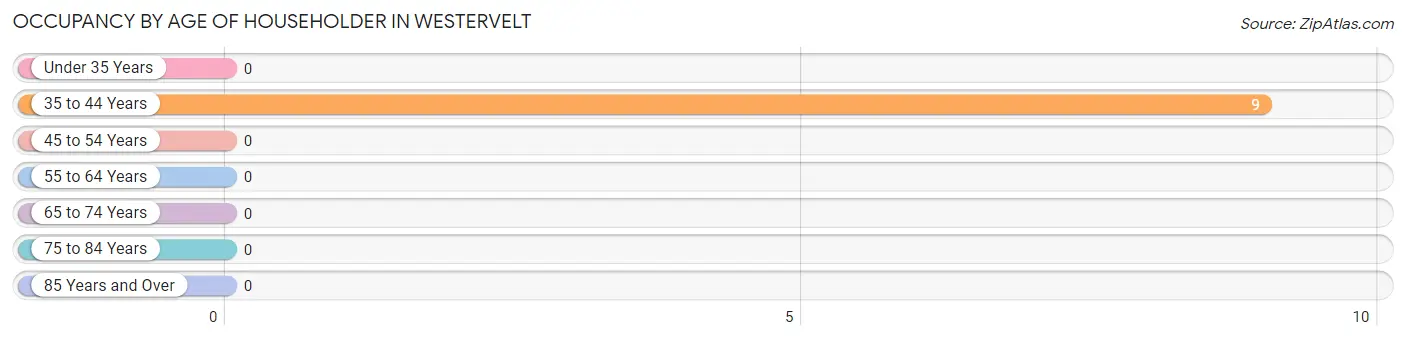
Occupancy by Age of Householder in Westervelt
Age Bracket
# Households
% Households
Under 35 Years
0
0.0%
35 to 44 Years
9
100.0%
45 to 54 Years
0
0.0%
55 to 64 Years
0
0.0%
65 to 74 Years
0
0.0%
75 to 84 Years
0
0.0%
85 Years and Over
0
0.0%
Total
9
100.0%
Housing Finances in Westervelt
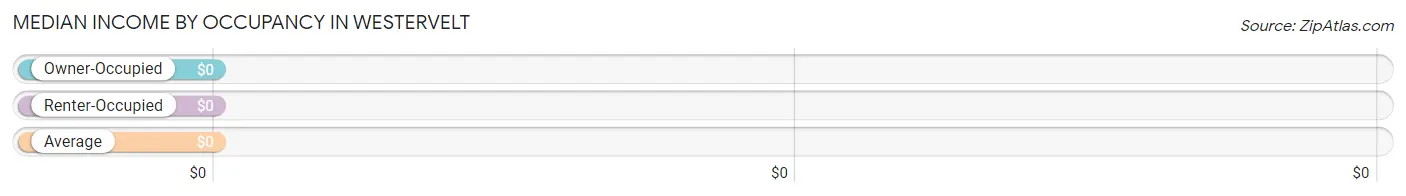
Median Income by Occupancy in Westervelt
Occupancy Type
# Households
Median Income
Owner-Occupied
0 (0.0%)
$0
Renter-Occupied
9 (100.0%)
$0
Average
9 (100.0%)
$0
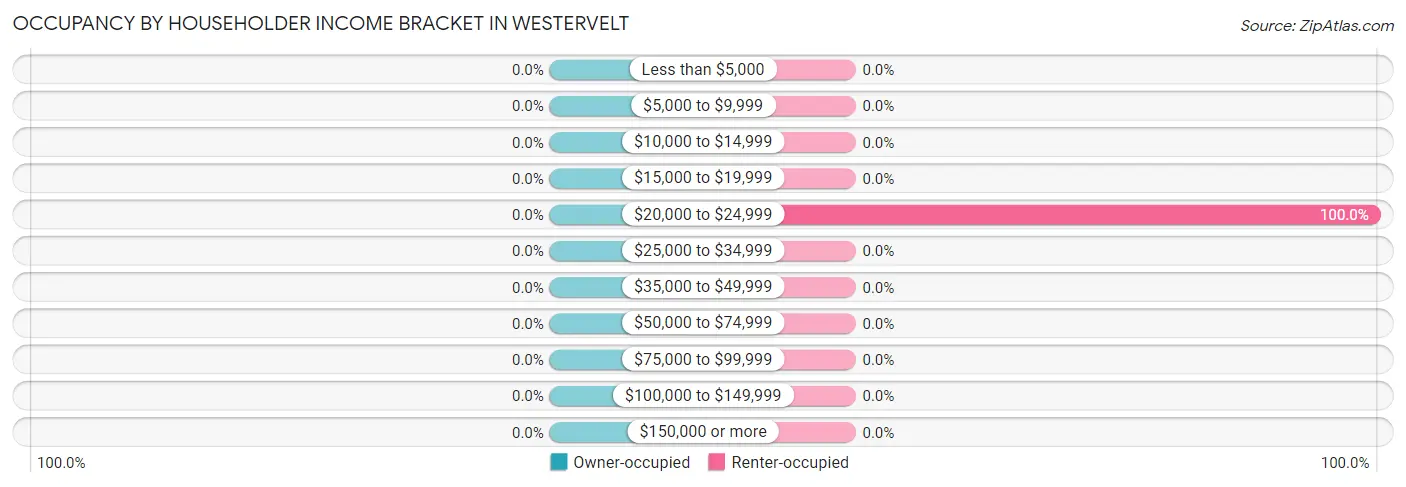
Occupancy by Householder Income Bracket in Westervelt
Income Bracket
Owner-occupied
Renter-occupied
Less than $5,000
0 (0.0%)
0 (0.0%)
$5,000 to $9,999
0 (0.0%)
0 (0.0%)
$10,000 to $14,999
0 (0.0%)
0 (0.0%)
$15,000 to $19,999
0 (0.0%)
0 (0.0%)
$20,000 to $24,999
0 (0.0%)
9 (100.0%)
$25,000 to $34,999
0 (0.0%)
0 (0.0%)
$35,000 to $49,999
0 (0.0%)
0 (0.0%)
$50,000 to $74,999
0 (0.0%)
0 (0.0%)
$75,000 to $99,999
0 (0.0%)
0 (0.0%)
$100,000 to $149,999
0 (0.0%)
0 (0.0%)
$150,000 or more
0 (0.0%)
0 (0.0%)
Total
0 (0.0%)
9 (100.0%)
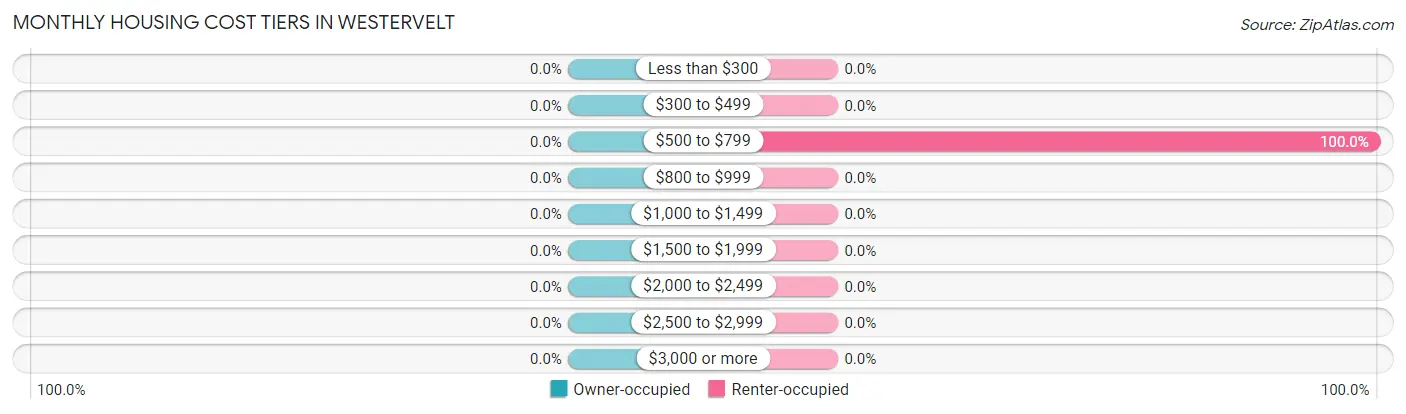
Monthly Housing Cost Tiers in Westervelt
Monthly Cost
Owner-occupied
Renter-occupied
Less than $300
0 (0.0%)
0 (0.0%)
$300 to $499
0 (0.0%)
0 (0.0%)
$500 to $799
0 (0.0%)
9 (100.0%)
$800 to $999
0 (0.0%)
0 (0.0%)
$1,000 to $1,499
0 (0.0%)
0 (0.0%)
$1,500 to $1,999
0 (0.0%)
0 (0.0%)
$2,000 to $2,499
0 (0.0%)
0 (0.0%)
$2,500 to $2,999
0 (0.0%)
0 (0.0%)
$3,000 or more
0 (0.0%)
0 (0.0%)
Total
0 (0.0%)
9 (100.0%)
Physical Housing Characteristics in Westervelt
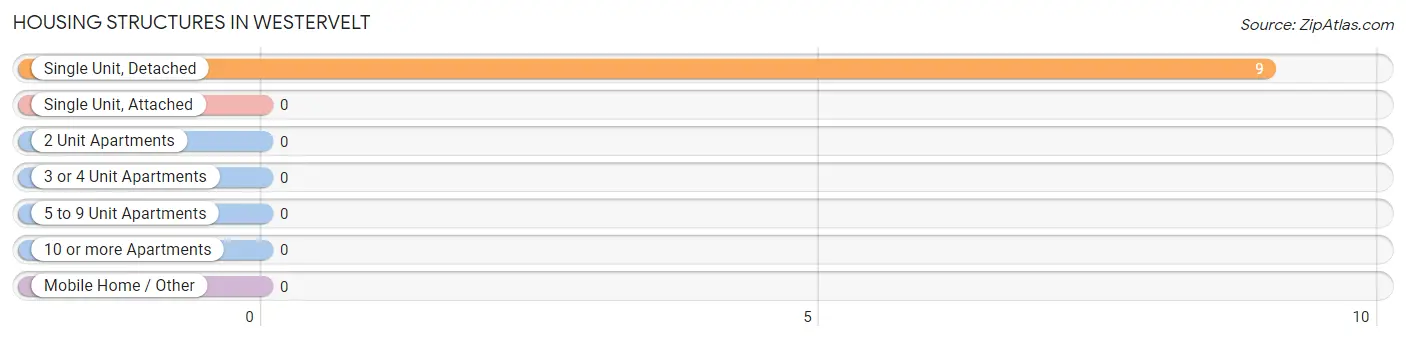
Housing Structures in Westervelt
Structure Type
# Housing Units
% Housing Units
Single Unit, Detached
9
100.0%
Single Unit, Attached
0
0.0%
2 Unit Apartments
0
0.0%
3 or 4 Unit Apartments
0
0.0%
5 to 9 Unit Apartments
0
0.0%
10 or more Apartments
0
0.0%
Mobile Home / Other
0
0.0%
Total
9
100.0%
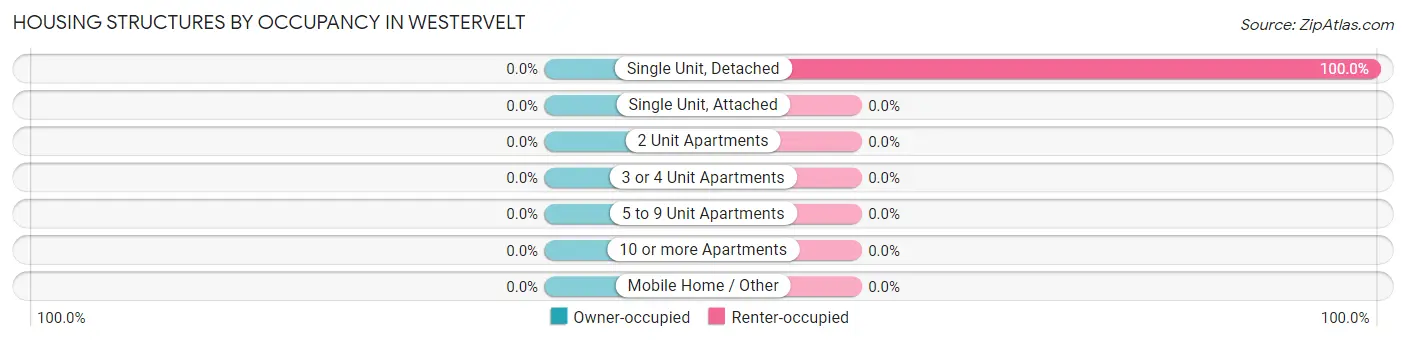
Housing Structures by Occupancy in Westervelt
Structure Type
Owner-occupied
Renter-occupied
Single Unit, Detached
0 (0.0%)
9 (100.0%)
Single Unit, Attached
0 (0.0%)
0 (0.0%)
2 Unit Apartments
0 (0.0%)
0 (0.0%)
3 or 4 Unit Apartments
0 (0.0%)
0 (0.0%)
5 to 9 Unit Apartments
0 (0.0%)
0 (0.0%)
10 or more Apartments
0 (0.0%)
0 (0.0%)
Mobile Home / Other
0 (0.0%)
0 (0.0%)
Total
0 (0.0%)
9 (100.0%)
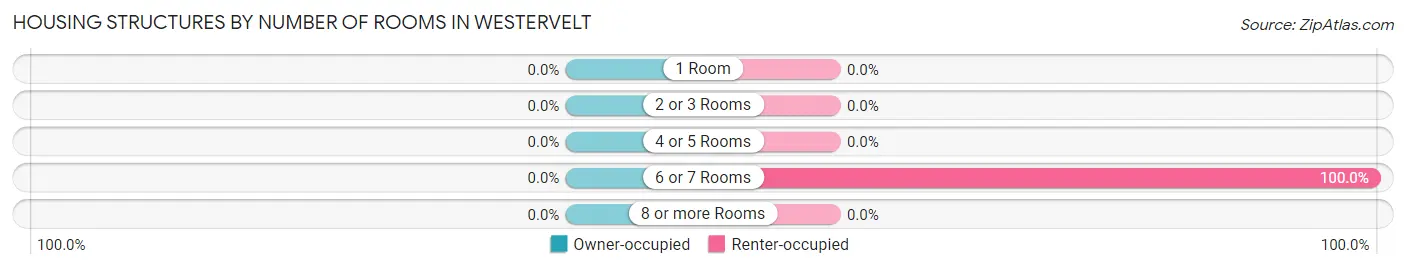
Housing Structures by Number of Rooms in Westervelt
Number of Rooms
Owner-occupied
Renter-occupied
1 Room
0 (0.0%)
0 (0.0%)
2 or 3 Rooms
0 (0.0%)
0 (0.0%)
4 or 5 Rooms
0 (0.0%)
0 (0.0%)
6 or 7 Rooms
0 (0.0%)
9 (100.0%)
8 or more Rooms
0 (0.0%)
0 (0.0%)
Total
0 (0.0%)
9 (100.0%)
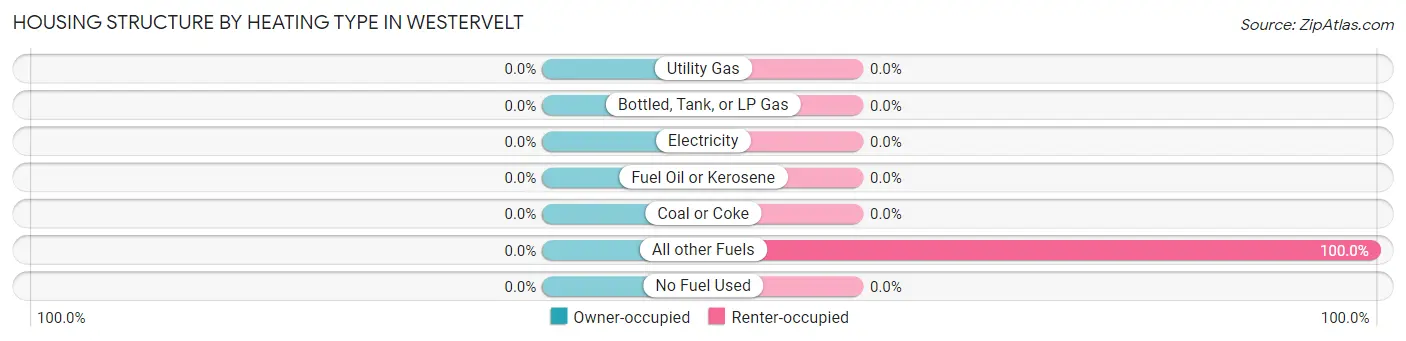
Housing Structure by Heating Type in Westervelt
Heating Type
Owner-occupied
Renter-occupied
Utility Gas
0 (0.0%)
0 (0.0%)
Bottled, Tank, or LP Gas
0 (0.0%)
0 (0.0%)
Electricity
0 (0.0%)
0 (0.0%)
Fuel Oil or Kerosene
0 (0.0%)
0 (0.0%)
Coal or Coke
0 (0.0%)
0 (0.0%)
All other Fuels
0 (0.0%)
9 (100.0%)
No Fuel Used
0 (0.0%)
0 (0.0%)
Total
0 (0.0%)
9 (100.0%)
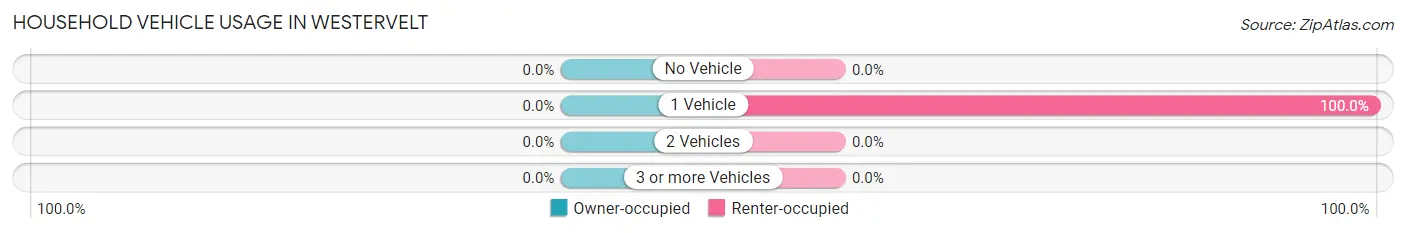
Household Vehicle Usage in Westervelt
Vehicles per Household
Owner-occupied
Renter-occupied
No Vehicle
0 (0.0%)
0 (0.0%)
1 Vehicle
0 (0.0%)
9 (100.0%)
2 Vehicles
0 (0.0%)
0 (0.0%)
3 or more Vehicles
0 (0.0%)
0 (0.0%)
Total
0 (0.0%)
9 (100.0%)
Real Estate & Mortgages in Westervelt
Real Estate and Mortgage Overview in Westervelt
Characteristic
Without Mortgage
With Mortgage
Housing Units
0
0
Median Property Value
-
-
Median Household Income
-
-
Monthly Housing Costs
-
-
Real Estate Taxes
-
-
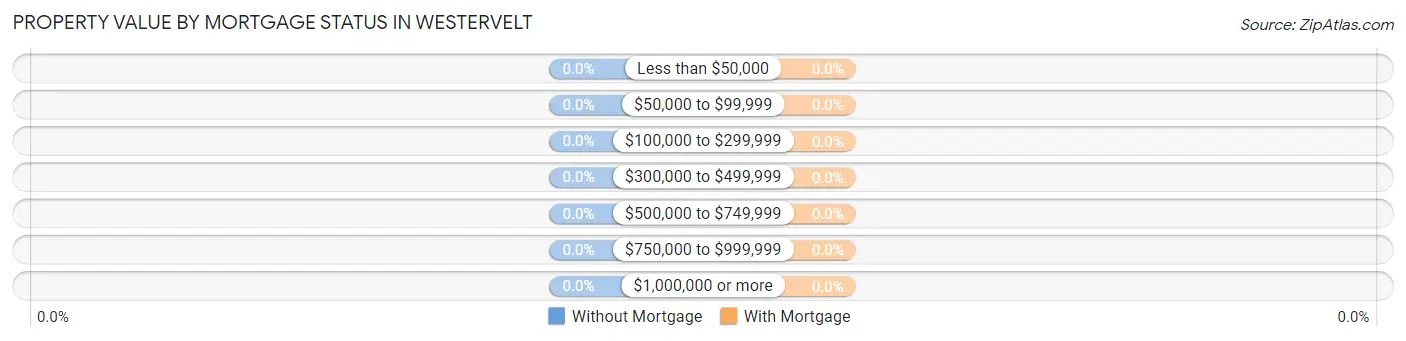
Property Value by Mortgage Status in Westervelt
Property Value
Without Mortgage
With Mortgage
Less than $50,000
0 (0.0%)
0 (0.0%)
$50,000 to $99,999
0 (0.0%)
0 (0.0%)
$100,000 to $299,999
0 (0.0%)
0 (0.0%)
$300,000 to $499,999
0 (0.0%)
0 (0.0%)
$500,000 to $749,999
0 (0.0%)
0 (0.0%)
$750,000 to $999,999
0 (0.0%)
0 (0.0%)
$1,000,000 or more
0 (0.0%)
0 (0.0%)
Total
0 (0.0%)
0 (0.0%)
Household Income by Mortgage Status in Westervelt
Household Income
Without Mortgage
With Mortgage
Less than $10,000
0 (0.0%)
0 (0.0%)
$10,000 to $24,999
0 (0.0%)
0 (0.0%)
$25,000 to $34,999
0 (0.0%)
0 (0.0%)
$35,000 to $49,999
0 (0.0%)
0 (0.0%)
$50,000 to $74,999
0 (0.0%)
0 (0.0%)
$75,000 to $99,999
0 (0.0%)
0 (0.0%)
$100,000 to $149,999
0 (0.0%)
0 (0.0%)
$150,000 or more
0 (0.0%)
0 (0.0%)
Total
0 (0.0%)
0 (0.0%)
Property Value to Household Income Ratio in Westervelt
Value-to-Income Ratio
Without Mortgage
With Mortgage
Less than 2.0x
0 (0.0%)
0 (0.0%)
2.0x to 2.9x
0 (0.0%)
0 (0.0%)
3.0x to 3.9x
0 (0.0%)
0 (0.0%)
4.0x or more
0 (0.0%)
0 (0.0%)
Total
0 (0.0%)
0 (0.0%)
Real Estate Taxes by Mortgage Status in Westervelt
Property Taxes
Without Mortgage
With Mortgage
Less than $800
0 (0.0%)
0 (0.0%)
$800 to $1,499
0 (0.0%)
0 (0.0%)
$800 to $1,499
0 (0.0%)
0 (0.0%)
Total
0 (0.0%)
0 (0.0%)
Health & Disability in Westervelt
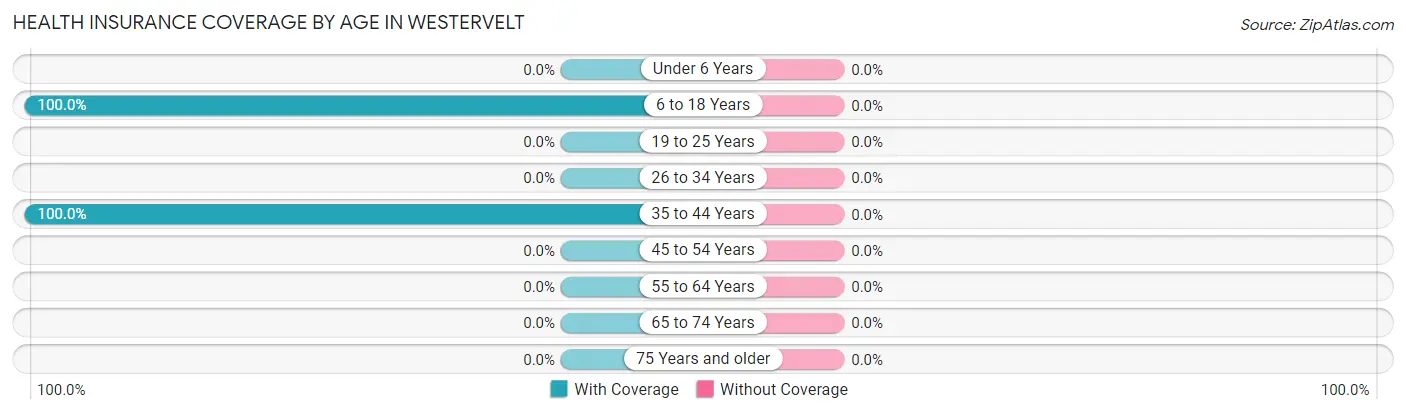
Health Insurance Coverage by Age in Westervelt
Age Bracket
With Coverage
Without Coverage
Under 6 Years
0 (0.0%)
0 (0.0%)
6 to 18 Years
19 (100.0%)
0 (0.0%)
19 to 25 Years
0 (0.0%)
0 (0.0%)
26 to 34 Years
0 (0.0%)
0 (0.0%)
35 to 44 Years
9 (100.0%)
0 (0.0%)
45 to 54 Years
0 (0.0%)
0 (0.0%)
55 to 64 Years
0 (0.0%)
0 (0.0%)
65 to 74 Years
0 (0.0%)
0 (0.0%)
75 Years and older
0 (0.0%)
0 (0.0%)
Total
28 (100.0%)
0 (0.0%)
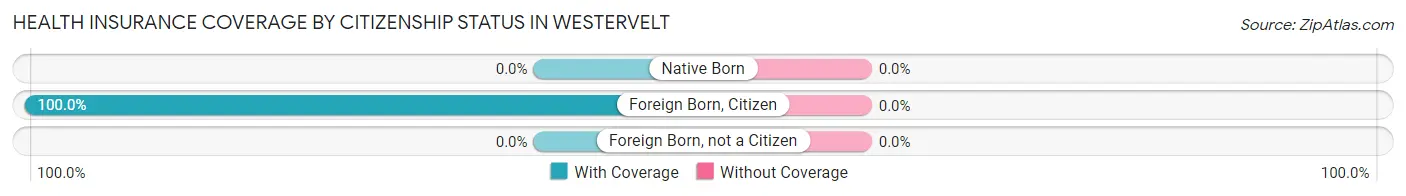
Health Insurance Coverage by Citizenship Status in Westervelt
Citizenship Status
With Coverage
Without Coverage
Native Born
0 (0.0%)
0 (0.0%)
Foreign Born, Citizen
19 (100.0%)
0 (0.0%)
Foreign Born, not a Citizen
0 (0.0%)
0 (0.0%)
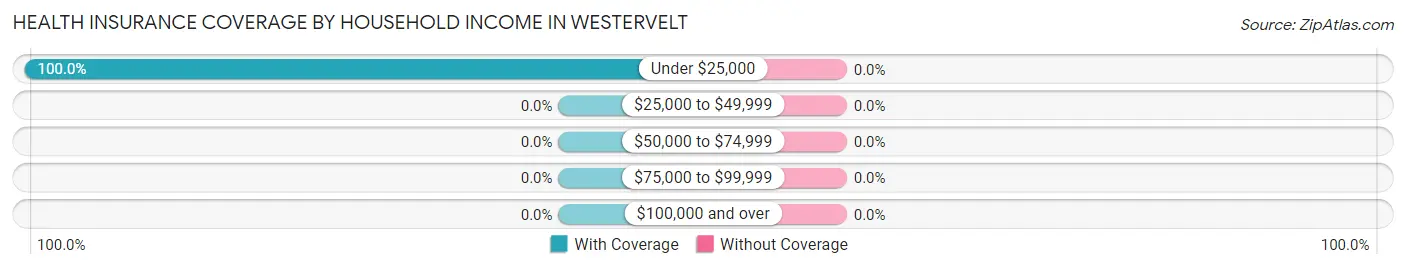
Health Insurance Coverage by Household Income in Westervelt
Household Income
With Coverage
Without Coverage
Under $25,000
28 (100.0%)
0 (0.0%)
$25,000 to $49,999
0 (0.0%)
0 (0.0%)
$50,000 to $74,999
0 (0.0%)
0 (0.0%)
$75,000 to $99,999
0 (0.0%)
0 (0.0%)
$100,000 and over
0 (0.0%)
0 (0.0%)
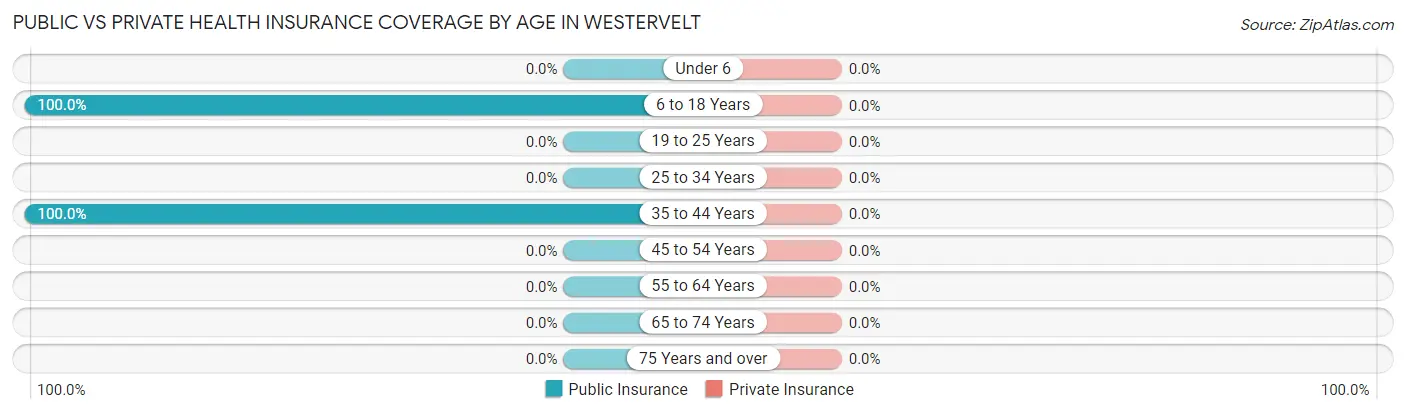
Public vs Private Health Insurance Coverage by Age in Westervelt
Age Bracket
Public Insurance
Private Insurance
Under 6
0 (0.0%)
0 (0.0%)
6 to 18 Years
19 (100.0%)
0 (0.0%)
19 to 25 Years
0 (0.0%)
0 (0.0%)
25 to 34 Years
0 (0.0%)
0 (0.0%)
35 to 44 Years
9 (100.0%)
0 (0.0%)
45 to 54 Years
0 (0.0%)
0 (0.0%)
55 to 64 Years
0 (0.0%)
0 (0.0%)
65 to 74 Years
0 (0.0%)
0 (0.0%)
75 Years and over
0 (0.0%)
0 (0.0%)
Total
28 (100.0%)
0 (0.0%)
Disability Status by Sex by Age in Westervelt
Age Bracket
Male
Female
Under 5 Years
0 (0.0%)
0 (0.0%)
5 to 17 Years
0 (0.0%)
0 (0.0%)
18 to 34 Years
0 (0.0%)
0 (0.0%)
35 to 64 Years
0 (0.0%)
0 (0.0%)
65 to 74 Years
0 (0.0%)
0 (0.0%)
75 Years and over
0 (0.0%)
0 (0.0%)
Disability Class by Sex by Age in Westervelt
Disability Class: Hearing Difficulty
Age Bracket
Male
Female
Under 5 Years
0 (0.0%)
0 (0.0%)
5 to 17 Years
0 (0.0%)
0 (0.0%)
18 to 34 Years
0 (0.0%)
0 (0.0%)
35 to 64 Years
0 (0.0%)
0 (0.0%)
65 to 74 Years
0 (0.0%)
0 (0.0%)
75 Years and over
0 (0.0%)
0 (0.0%)
Disability Class: Vision Difficulty
Age Bracket
Male
Female
Under 5 Years
0 (0.0%)
0 (0.0%)
5 to 17 Years
0 (0.0%)
0 (0.0%)
18 to 34 Years
0 (0.0%)
0 (0.0%)
35 to 64 Years
0 (0.0%)
0 (0.0%)
65 to 74 Years
0 (0.0%)
0 (0.0%)
75 Years and over
0 (0.0%)
0 (0.0%)
Disability Class: Cognitive Difficulty
Age Bracket
Male
Female
5 to 17 Years
0 (0.0%)
0 (0.0%)
18 to 34 Years
0 (0.0%)
0 (0.0%)
35 to 64 Years
0 (0.0%)
0 (0.0%)
65 to 74 Years
0 (0.0%)
0 (0.0%)
75 Years and over
0 (0.0%)
0 (0.0%)
Disability Class: Ambulatory Difficulty
Age Bracket
Male
Female
5 to 17 Years
0 (0.0%)
0 (0.0%)
18 to 34 Years
0 (0.0%)
0 (0.0%)
35 to 64 Years
0 (0.0%)
0 (0.0%)
65 to 74 Years
0 (0.0%)
0 (0.0%)
75 Years and over
0 (0.0%)
0 (0.0%)
Disability Class: Self-Care Difficulty
Age Bracket
Male
Female
5 to 17 Years
0 (0.0%)
0 (0.0%)
18 to 34 Years
0 (0.0%)
0 (0.0%)
35 to 64 Years
0 (0.0%)
0 (0.0%)
65 to 74 Years
0 (0.0%)
0 (0.0%)
75 Years and over
0 (0.0%)
0 (0.0%)
Technology Access in Westervelt
Computing Device Access in Westervelt
Device Type
# Households
% Households
Desktop or Laptop
9
100.0%
Smartphone
9
100.0%
Tablet
9
100.0%
No Computing Device
0
0.0%
Total
9
100.0%
Internet Access in Westervelt
Internet Type
# Households
% Households
Dial-Up Internet
0
0.0%
Broadband Home
0
0.0%
Cellular Data Only
9
100.0%
Satellite Internet
0
0.0%
No Internet
0
0.0%
Total
9
100.0%
Westervelt Summary
Westervelt is a small village located in the state of Illinois, in the United States. It is situated in the county of Macon, and is part of the Decatur Metropolitan Statistical Area. The village has a population of just over 500 people, and is located about 10 miles south of Decatur.
History
The area that is now known as Westervelt was first settled in the early 1800s by a group of German immigrants. The village was originally known as “Westervelt’s Settlement”, and was named after the family that first settled the area. The village was officially incorporated in 1867, and the first post office was established in 1868.
In the late 1800s, the village was a thriving agricultural community, with many of the residents working in the local farms and orchards. The village also had a number of small businesses, including a general store, a blacksmith, and a sawmill.
In the early 1900s, the village began to decline as many of the residents moved away to larger cities in search of better job opportunities. By the mid-1900s, the village had become a virtual ghost town, with only a few residents remaining.
In the late 1900s, the village began to experience a resurgence in population as people began to move back to the area. The village has since become a popular destination for tourists, and is home to a number of small businesses, including a winery, a brewery, and a bed and breakfast.
Geography
Westervelt is located in the central part of the state of Illinois, in the county of Macon. The village is situated about 10 miles south of Decatur, and is bordered by the towns of Oreana, Harristown, and Mount Zion.
The village is located in a rural area, and is surrounded by rolling hills and farmland. The village is situated on the banks of the Sangamon River, and is home to a number of small lakes and ponds.
Economy
The economy of Westervelt is largely based on agriculture and tourism. The village is home to a number of small farms and orchards, and many of the residents are employed in the agricultural industry.
The village is also a popular destination for tourists, and is home to a number of small businesses, including a winery, a brewery, and a bed and breakfast. The village also has a number of antique shops, and is home to a number of festivals and events throughout the year.
Demographics
As of the 2010 census, the population of Westervelt was 514 people. The racial makeup of the village was 97.3% White, 0.6% African American, 0.2% Native American, 0.2% Asian, 0.2% from other races, and 1.6% from two or more races. Hispanic or Latino of any race were 1.2% of the population.
The median household income in Westervelt was $45,000, and the median family income was $50,000. The per capita income for the village was $20,000. About 8.3% of families and 10.2% of the population were below the poverty line, including 11.3% of those under the age of 18 and 8.3% of those 65 and older.
Common Questions
What is the Total Population of Westervelt?
Total Population of Westervelt is 28.
What is the Total Male Population of Westervelt?
Total Male Population of Westervelt is 9.
What is the Total Female Population of Westervelt?
Total Female Population of Westervelt is 19.
What is the Ratio of Males per 100 Females in Westervelt?
There are 47.37 Males per 100 Females in Westervelt.
What is the Ratio of Females per 100 Males in Westervelt?
There are 211.11 Females per 100 Males in Westervelt.
What is the Median Population Age in Westervelt?
Median Population Age in Westervelt is 15.4 Years.
What is the Average Family Size in Westervelt
Average Family Size in Westervelt is 3.1 People.
What is the Average Household Size in Westervelt
Average Household Size in Westervelt is 3.1 People.
How Large is the Labor Force in Westervelt?
There are 9 People in the Labor Forcein in Westervelt.
What is the Percentage of People in the Labor Force in Westervelt?
100.0% of People are in the Labor Force in Westervelt.
Report Title
Report Link
HTML Copy & Paste Link
Social Media
Copy and paste the folowing code into any webpage where you would like this interactive chart to display