Greenwich, CT Map & Demographics
Greenwich Map
Greenwich Overview
$112,136
PER CAPITA INCOME
$161,888
AVG FAMILY INCOME
$128,839
AVG HOUSEHOLD INCOME
63.1%
WAGE / INCOME GAP [ % ]
36.9¢/ $1
WAGE / INCOME GAP [ $ ]
0.60
INEQUALITY / GINI INDEX
14,051
TOTAL POPULATION
6,487
MALE POPULATION
7,564
FEMALE POPULATION
85.76
MALES / 100 FEMALES
116.60
FEMALES / 100 MALES
44.4
MEDIAN AGE
3.1
AVG FAMILY SIZE
2.5
AVG HOUSEHOLD SIZE
6,845
LABOR FORCE [ PEOPLE ]
61.2%
PERCENT IN LABOR FORCE
8.1%
UNEMPLOYMENT RATE
Greenwich Area Codes
Income in Greenwich
Income Overview in Greenwich
Per Capita Income in Greenwich is $112,136, while median incomes of families and households are $161,888 and $128,839 respectively.
| Characteristic | Number | Measure |
| Per Capita Income | 14,051 | $112,136 |
| Median Family Income | 3,673 | $161,888 |
| Mean Family Income | 3,673 | $337,903 |
| Median Household Income | 5,626 | $128,839 |
| Mean Household Income | 5,626 | $276,350 |
| Income Deficit | 3,673 | $0 |
| Wage / Income Gap (%) | 14,051 | 63.14% |
| Wage / Income Gap ($) | 14,051 | 36.86¢ per $1 |
| Gini / Inequality Index | 14,051 | 0.60 |
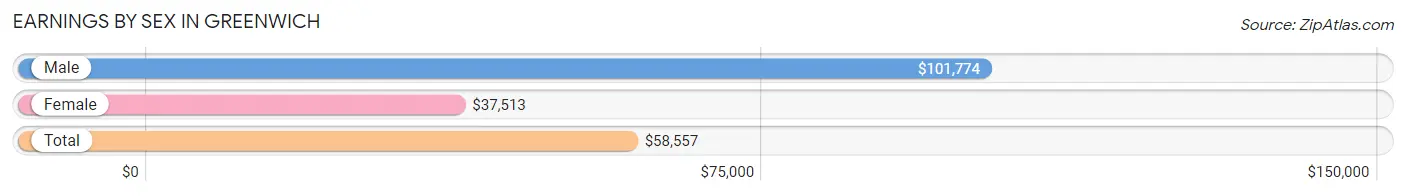
Earnings by Sex in Greenwich
Average Earnings in Greenwich are $58,557, $101,774 for men and $37,513 for women, a difference of 63.1%.
| Sex | Number | Average Earnings |
| Male | 4,096 (56.6%) | $101,774 |
| Female | 3,139 (43.4%) | $37,513 |
| Total | 7,235 (100.0%) | $58,557 |
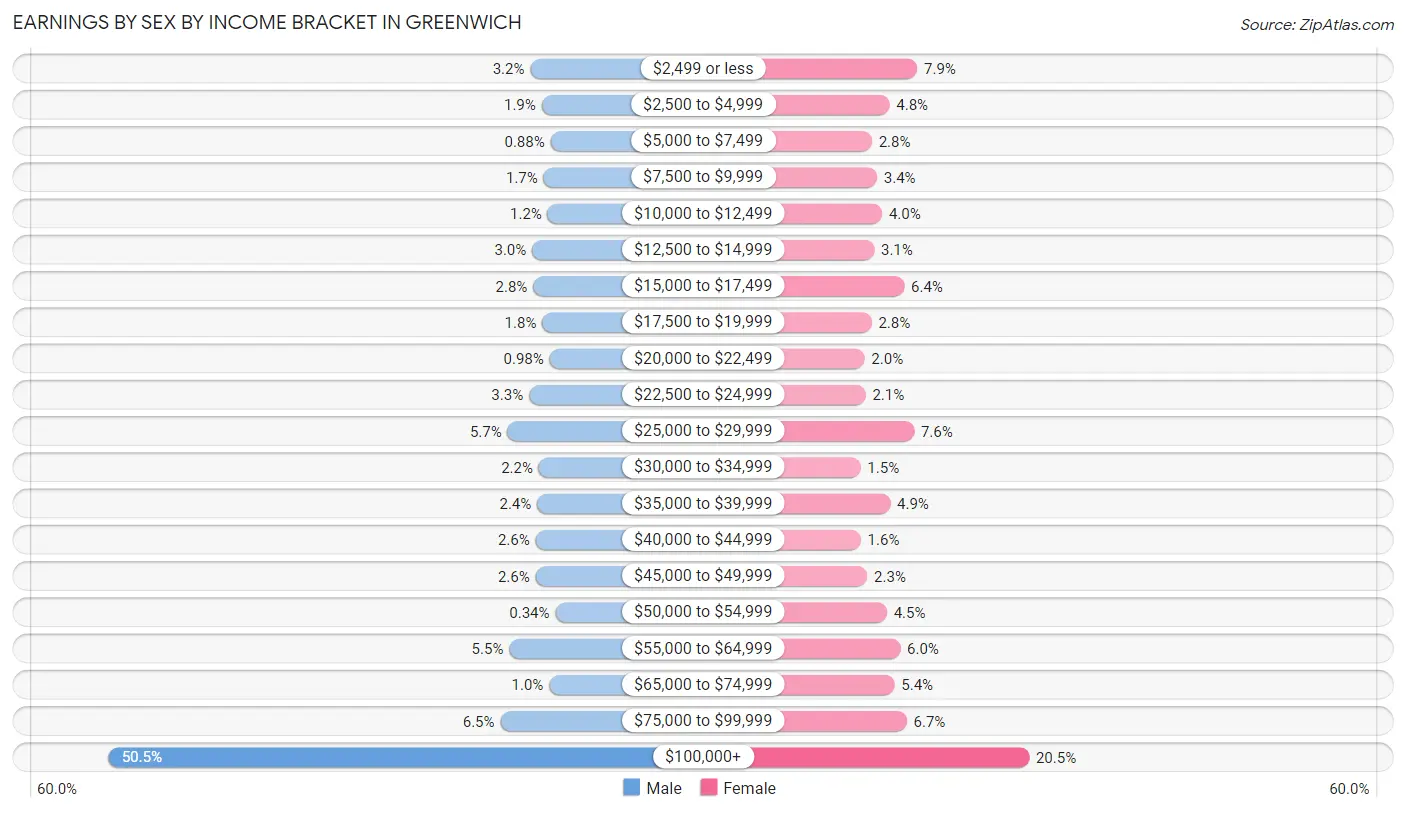
Earnings by Sex by Income Bracket in Greenwich
The most common earnings brackets in Greenwich are $100,000+ for men (2,070 | 50.5%) and $100,000+ for women (643 | 20.5%).
| Income | Male | Female |
| $2,499 or less | 129 (3.2%) | 248 (7.9%) |
| $2,500 to $4,999 | 77 (1.9%) | 150 (4.8%) |
| $5,000 to $7,499 | 36 (0.9%) | 88 (2.8%) |
| $7,500 to $9,999 | 68 (1.7%) | 106 (3.4%) |
| $10,000 to $12,499 | 49 (1.2%) | 124 (4.0%) |
| $12,500 to $14,999 | 121 (2.9%) | 96 (3.1%) |
| $15,000 to $17,499 | 116 (2.8%) | 202 (6.4%) |
| $17,500 to $19,999 | 74 (1.8%) | 87 (2.8%) |
| $20,000 to $22,499 | 40 (1.0%) | 62 (2.0%) |
| $22,500 to $24,999 | 135 (3.3%) | 66 (2.1%) |
| $25,000 to $29,999 | 234 (5.7%) | 237 (7.5%) |
| $30,000 to $34,999 | 90 (2.2%) | 48 (1.5%) |
| $35,000 to $39,999 | 98 (2.4%) | 153 (4.9%) |
| $40,000 to $44,999 | 105 (2.6%) | 49 (1.6%) |
| $45,000 to $49,999 | 105 (2.6%) | 72 (2.3%) |
| $50,000 to $54,999 | 14 (0.3%) | 141 (4.5%) |
| $55,000 to $64,999 | 226 (5.5%) | 188 (6.0%) |
| $65,000 to $74,999 | 42 (1.0%) | 168 (5.3%) |
| $75,000 to $99,999 | 267 (6.5%) | 211 (6.7%) |
| $100,000+ | 2,070 (50.5%) | 643 (20.5%) |
| Total | 4,096 (100.0%) | 3,139 (100.0%) |
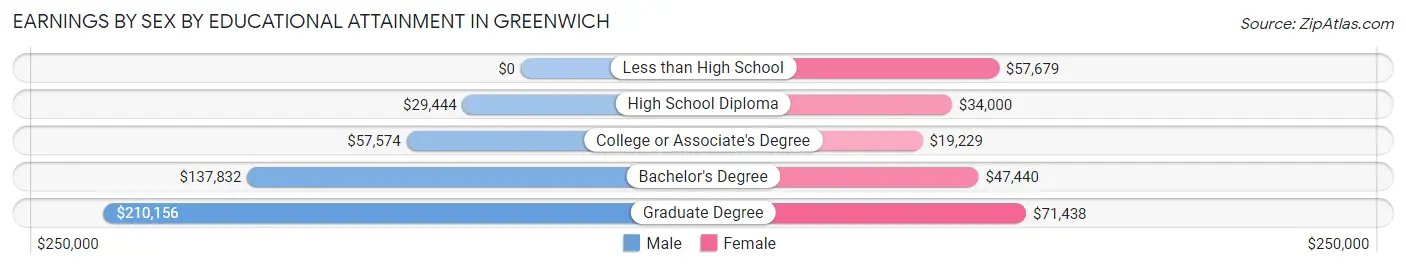
Earnings by Sex by Educational Attainment in Greenwich
Average earnings in Greenwich are $109,886 for men and $44,659 for women, a difference of 59.4%. Men with an educational attainment of graduate degree enjoy the highest average annual earnings of $210,156, while those with high school diploma education earn the least with $29,444. Women with an educational attainment of graduate degree earn the most with the average annual earnings of $71,438, while those with college or associate's degree education have the smallest earnings of $19,229.
| Educational Attainment | Male Income | Female Income |
| Less than High School | - | - |
| High School Diploma | $29,444 | $34,000 |
| College or Associate's Degree | $57,574 | $19,229 |
| Bachelor's Degree | $137,832 | $47,440 |
| Graduate Degree | $210,156 | $71,438 |
| Total | $109,886 | $44,659 |
Family Income in Greenwich
Family Income Brackets in Greenwich
According to the Greenwich family income data, there are 1,627 families falling into the $200,000+ income range, which is the most common income bracket and makes up 44.3% of all families. Conversely, the $10,000 to $14,999 income bracket is the least frequent group with only 33 families (0.9%) belonging to this category.
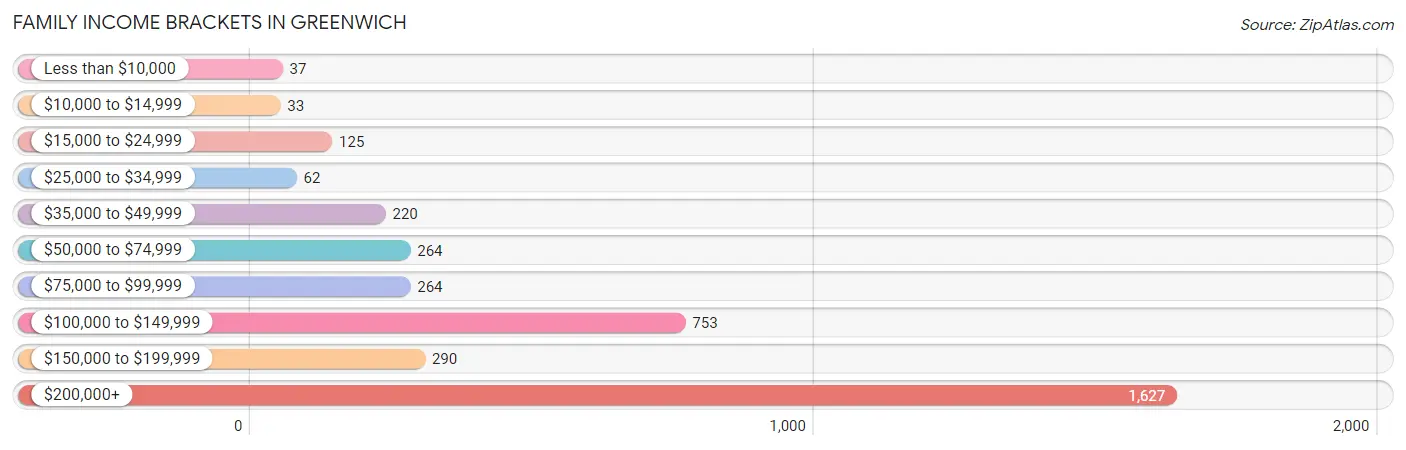
| Income Bracket | # Families | % Families |
| Less than $10,000 | 37 | 1.0% |
| $10,000 to $14,999 | 33 | 0.9% |
| $15,000 to $24,999 | 125 | 3.4% |
| $25,000 to $34,999 | 62 | 1.7% |
| $35,000 to $49,999 | 220 | 6.0% |
| $50,000 to $74,999 | 264 | 7.2% |
| $75,000 to $99,999 | 264 | 7.2% |
| $100,000 to $149,999 | 753 | 20.5% |
| $150,000 to $199,999 | 290 | 7.9% |
| $200,000+ | 1,627 | 44.3% |
Family Income by Famaliy Size in Greenwich
5-person families (294 | 8.0%) account for the highest median family income in Greenwich with $250,001 per family, while 2-person families (1,520 | 41.4%) have the highest median income of $83,421 per family member.
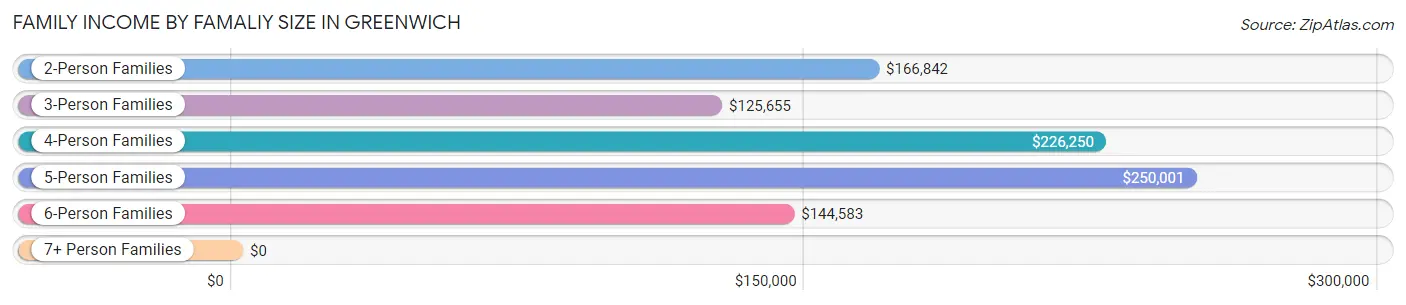
| Income Bracket | # Families | Median Income |
| 2-Person Families | 1,520 (41.4%) | $166,842 |
| 3-Person Families | 859 (23.4%) | $125,655 |
| 4-Person Families | 833 (22.7%) | $226,250 |
| 5-Person Families | 294 (8.0%) | $250,001 |
| 6-Person Families | 161 (4.4%) | $144,583 |
| 7+ Person Families | 6 (0.2%) | $0 |
| Total | 3,673 (100.0%) | $161,888 |
Family Income by Number of Earners in Greenwich
The median family income in Greenwich is $161,888, with families comprising 2 earners (1,288) having the highest median family income of $226,429, while families with no earners (345) have the lowest median family income of $118,875, accounting for 35.1% and 9.4% of families, respectively.
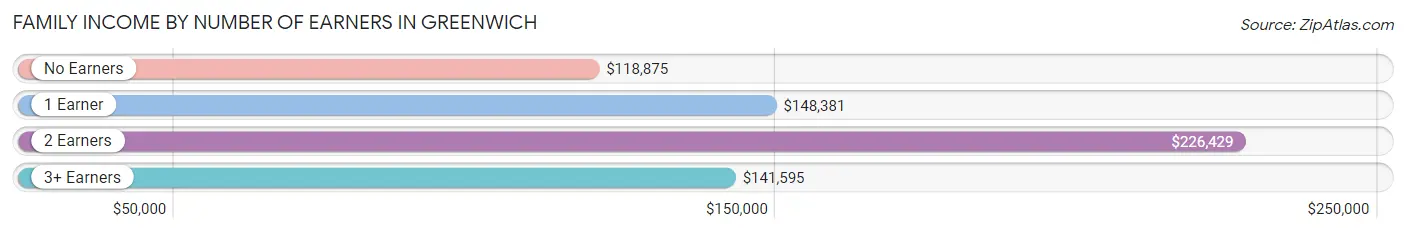
| Number of Earners | # Families | Median Income |
| No Earners | 345 (9.4%) | $118,875 |
| 1 Earner | 1,577 (42.9%) | $148,381 |
| 2 Earners | 1,288 (35.1%) | $226,429 |
| 3+ Earners | 463 (12.6%) | $141,595 |
| Total | 3,673 (100.0%) | $161,888 |
Household Income in Greenwich
Household Income Brackets in Greenwich
With 1,997 households falling in the category, the $200,000+ income range is the most frequent in Greenwich, accounting for 35.5% of all households. In contrast, only 124 households (2.2%) fall into the $10,000 to $14,999 income bracket, making it the least populous group.
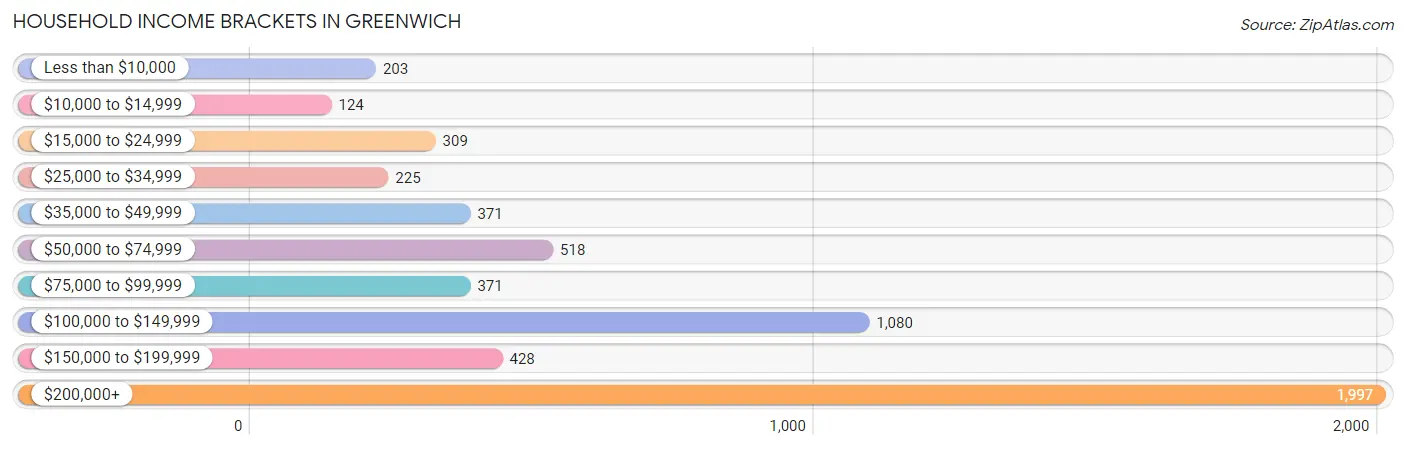
| Income Bracket | # Households | % Households |
| Less than $10,000 | 203 | 3.6% |
| $10,000 to $14,999 | 124 | 2.2% |
| $15,000 to $24,999 | 309 | 5.5% |
| $25,000 to $34,999 | 225 | 4.0% |
| $35,000 to $49,999 | 371 | 6.6% |
| $50,000 to $74,999 | 518 | 9.2% |
| $75,000 to $99,999 | 371 | 6.6% |
| $100,000 to $149,999 | 1,080 | 19.2% |
| $150,000 to $199,999 | 428 | 7.6% |
| $200,000+ | 1,997 | 35.5% |
Household Income by Householder Age in Greenwich
The median household income in Greenwich is $128,839, with the highest median household income of $144,621 found in the 45 to 64 years age bracket for the primary householder. A total of 2,478 households (44.1%) fall into this category. Meanwhile, the 15 to 24 years age bracket for the primary householder has the lowest median household income of $0, with 28 households (0.5%) in this group.
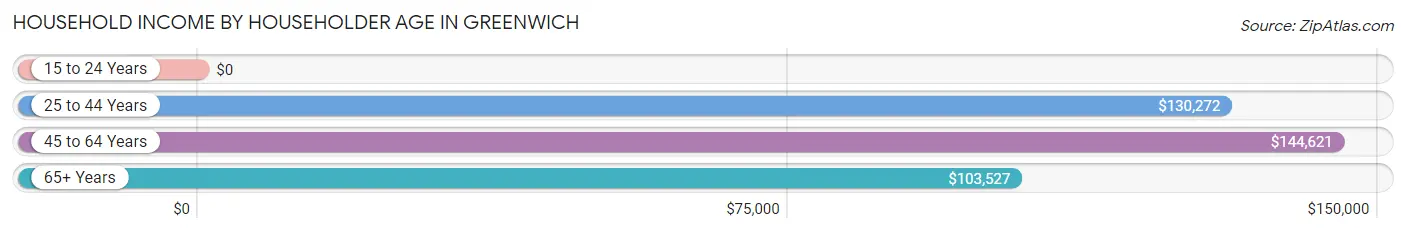
| Income Bracket | # Households | Median Income |
| 15 to 24 Years | 28 (0.5%) | $0 |
| 25 to 44 Years | 1,381 (24.5%) | $130,272 |
| 45 to 64 Years | 2,478 (44.1%) | $144,621 |
| 65+ Years | 1,739 (30.9%) | $103,527 |
| Total | 5,626 (100.0%) | $128,839 |
Poverty in Greenwich
Income Below Poverty by Sex and Age in Greenwich
With 6.7% poverty level for males and 9.2% for females among the residents of Greenwich, under 5 year old males and 18 to 24 year old females are the most vulnerable to poverty, with 85 males (19.9%) and 66 females (15.8%) in their respective age groups living below the poverty level.
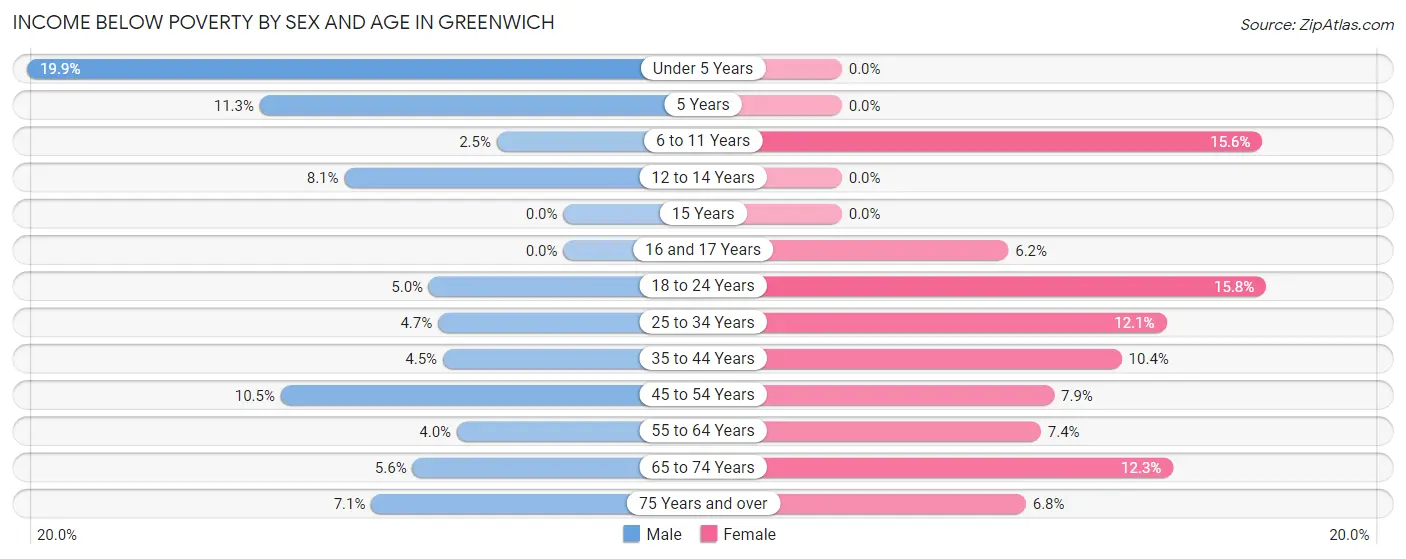
| Age Bracket | Male | Female |
| Under 5 Years | 85 (19.9%) | 0 (0.0%) |
| 5 Years | 8 (11.3%) | 0 (0.0%) |
| 6 to 11 Years | 12 (2.5%) | 113 (15.6%) |
| 12 to 14 Years | 27 (8.1%) | 0 (0.0%) |
| 15 Years | 0 (0.0%) | 0 (0.0%) |
| 16 and 17 Years | 0 (0.0%) | 16 (6.2%) |
| 18 to 24 Years | 19 (5.0%) | 66 (15.8%) |
| 25 to 34 Years | 42 (4.6%) | 64 (12.0%) |
| 35 to 44 Years | 30 (4.5%) | 99 (10.4%) |
| 45 to 54 Years | 101 (10.5%) | 86 (7.9%) |
| 55 to 64 Years | 40 (4.0%) | 88 (7.4%) |
| 65 to 74 Years | 38 (5.6%) | 110 (12.3%) |
| 75 Years and over | 29 (7.1%) | 49 (6.8%) |
| Total | 431 (6.7%) | 691 (9.2%) |
Income Above Poverty by Sex and Age in Greenwich
According to the poverty statistics in Greenwich, males aged 15 years and females aged under 5 years are the age groups that are most secure financially, with 100.0% of males and 100.0% of females in these age groups living above the poverty line.
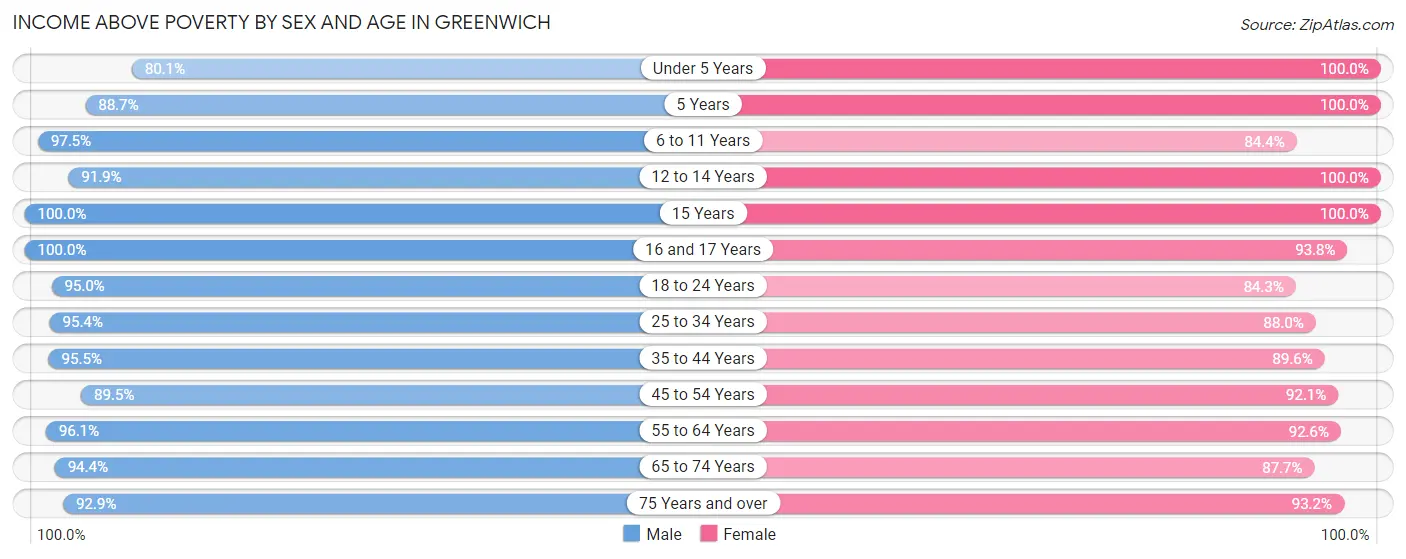
| Age Bracket | Male | Female |
| Under 5 Years | 342 (80.1%) | 343 (100.0%) |
| 5 Years | 63 (88.7%) | 26 (100.0%) |
| 6 to 11 Years | 474 (97.5%) | 611 (84.4%) |
| 12 to 14 Years | 305 (91.9%) | 212 (100.0%) |
| 15 Years | 52 (100.0%) | 186 (100.0%) |
| 16 and 17 Years | 97 (100.0%) | 243 (93.8%) |
| 18 to 24 Years | 362 (95.0%) | 353 (84.3%) |
| 25 to 34 Years | 861 (95.4%) | 467 (87.9%) |
| 35 to 44 Years | 641 (95.5%) | 854 (89.6%) |
| 45 to 54 Years | 862 (89.5%) | 1,006 (92.1%) |
| 55 to 64 Years | 973 (96.1%) | 1,103 (92.6%) |
| 65 to 74 Years | 640 (94.4%) | 784 (87.7%) |
| 75 Years and over | 378 (92.9%) | 668 (93.2%) |
| Total | 6,050 (93.3%) | 6,856 (90.8%) |
Income Below Poverty Among Married-Couple Families in Greenwich
The poverty statistics for married-couple families in Greenwich show that 4.4% or 129 of the total 2,917 families live below the poverty line. Families with 1 or 2 children have the highest poverty rate of 10.1%, comprising of 93 families. On the other hand, families with 3 or 4 children have the lowest poverty rate of 0.0%, which includes 0 families.
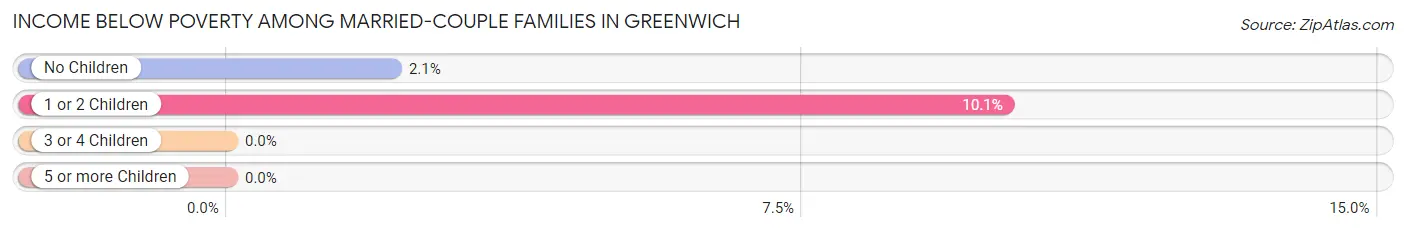
| Children | Above Poverty | Below Poverty |
| No Children | 1,644 (97.9%) | 36 (2.1%) |
| 1 or 2 Children | 824 (89.9%) | 93 (10.1%) |
| 3 or 4 Children | 320 (100.0%) | 0 (0.0%) |
| 5 or more Children | 0 (0.0%) | 0 (0.0%) |
| Total | 2,788 (95.6%) | 129 (4.4%) |
Income Below Poverty Among Single-Parent Households in Greenwich
According to the poverty data in Greenwich, 0.7% or 1 single-father households and 4.7% or 29 single-mother households are living below the poverty line. Among single-father households, those with 1 or 2 children have the highest poverty rate, with 1 households (4.8%) experiencing poverty. Likewise, among single-mother households, those with 5 or more children have the highest poverty rate, with 6 households (100.0%) falling below the poverty line.
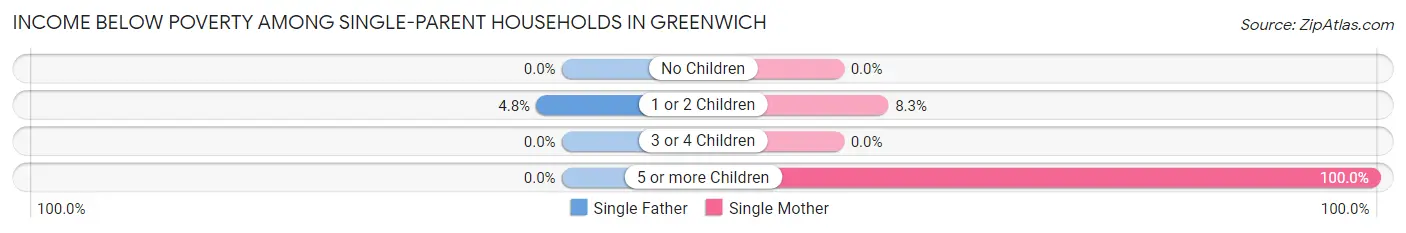
| Children | Single Father | Single Mother |
| No Children | 0 (0.0%) | 0 (0.0%) |
| 1 or 2 Children | 1 (4.8%) | 23 (8.3%) |
| 3 or 4 Children | 0 (0.0%) | 0 (0.0%) |
| 5 or more Children | 0 (0.0%) | 6 (100.0%) |
| Total | 1 (0.7%) | 29 (4.7%) |
Income Below Poverty Among Married-Couple vs Single-Parent Households in Greenwich
The poverty data for Greenwich shows that 129 of the married-couple family households (4.4%) and 30 of the single-parent households (4.0%) are living below the poverty level. Within the married-couple family households, those with 1 or 2 children have the highest poverty rate, with 93 households (10.1%) falling below the poverty line. Among the single-parent households, those with 5 or more children have the highest poverty rate, with 6 household (100.0%) living below poverty.
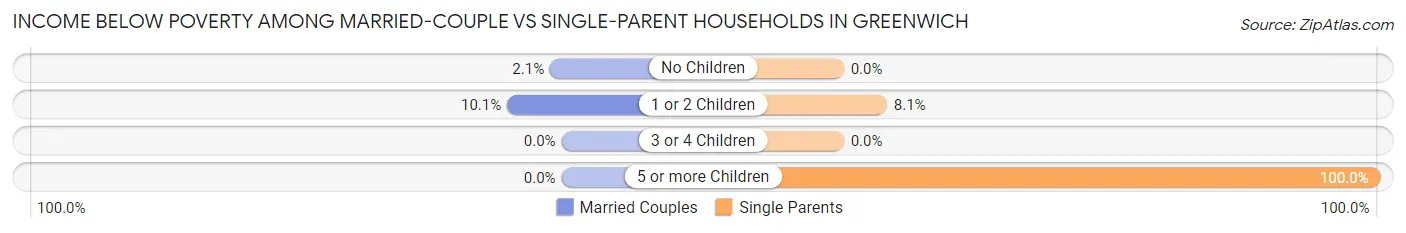
| Children | Married-Couple Families | Single-Parent Households |
| No Children | 36 (2.1%) | 0 (0.0%) |
| 1 or 2 Children | 93 (10.1%) | 24 (8.1%) |
| 3 or 4 Children | 0 (0.0%) | 0 (0.0%) |
| 5 or more Children | 0 (0.0%) | 6 (100.0%) |
| Total | 129 (4.4%) | 30 (4.0%) |
Race in Greenwich
The most populous races in Greenwich are White / Caucasian (10,467 | 74.5%), Hispanic or Latino (2,660 | 18.9%), and Two or more Races (1,046 | 7.4%).
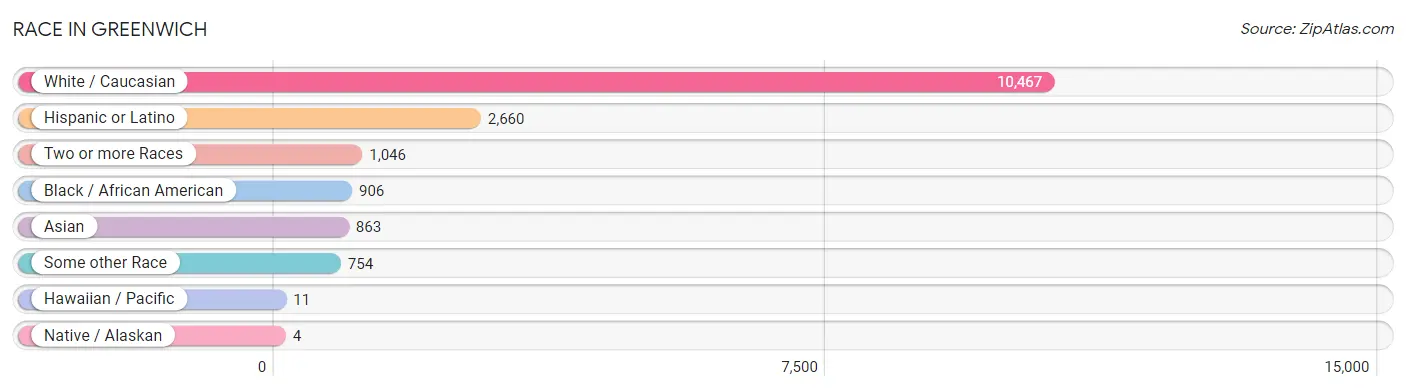
| Race | # Population | % Population |
| Asian | 863 | 6.1% |
| Black / African American | 906 | 6.5% |
| Hawaiian / Pacific | 11 | 0.1% |
| Hispanic or Latino | 2,660 | 18.9% |
| Native / Alaskan | 4 | 0.0% |
| White / Caucasian | 10,467 | 74.5% |
| Two or more Races | 1,046 | 7.4% |
| Some other Race | 754 | 5.4% |
| Total | 14,051 | 100.0% |
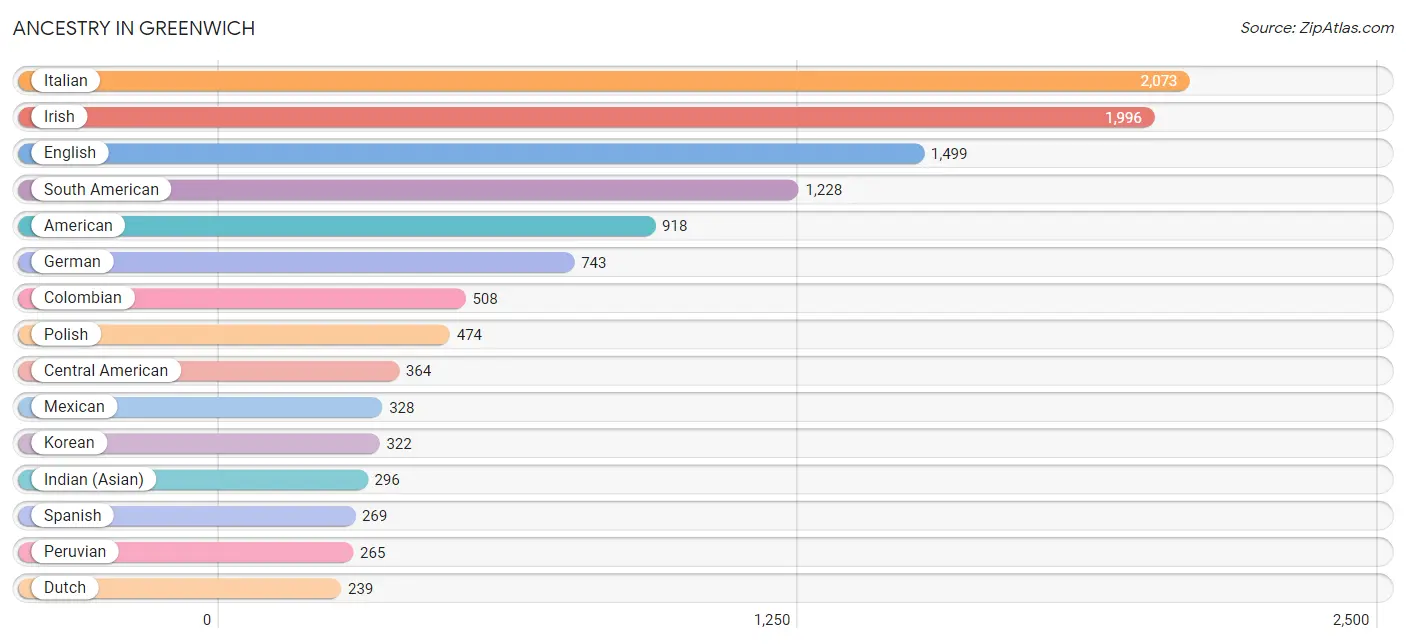
Ancestry in Greenwich
The most populous ancestries reported in Greenwich are Italian (2,073 | 14.7%), Irish (1,996 | 14.2%), English (1,499 | 10.7%), South American (1,228 | 8.7%), and American (918 | 6.5%), together accounting for 54.9% of all Greenwich residents.
| Ancestry | # Population | % Population |
| African | 20 | 0.1% |
| Albanian | 67 | 0.5% |
| American | 918 | 6.5% |
| Arab | 91 | 0.6% |
| Argentinean | 144 | 1.0% |
| Armenian | 8 | 0.1% |
| Australian | 19 | 0.1% |
| Austrian | 32 | 0.2% |
| Basque | 6 | 0.0% |
| Bhutanese | 82 | 0.6% |
| Blackfeet | 4 | 0.0% |
| Brazilian | 127 | 0.9% |
| British | 147 | 1.1% |
| Burmese | 179 | 1.3% |
| Canadian | 60 | 0.4% |
| Central American | 364 | 2.6% |
| Cherokee | 96 | 0.7% |
| Chilean | 157 | 1.1% |
| Colombian | 508 | 3.6% |
| Croatian | 24 | 0.2% |
| Cuban | 107 | 0.8% |
| Czech | 43 | 0.3% |
| Danish | 138 | 1.0% |
| Dominican | 68 | 0.5% |
| Dutch | 239 | 1.7% |
| Eastern European | 200 | 1.4% |
| Ecuadorian | 38 | 0.3% |
| Egyptian | 60 | 0.4% |
| English | 1,499 | 10.7% |
| Ethiopian | 10 | 0.1% |
| European | 186 | 1.3% |
| Filipino | 28 | 0.2% |
| French | 176 | 1.3% |
| French Canadian | 65 | 0.5% |
| German | 743 | 5.3% |
| Greek | 132 | 0.9% |
| Guamanian / Chamorro | 11 | 0.1% |
| Guatemalan | 23 | 0.2% |
| Haitian | 1 | 0.0% |
| Honduran | 208 | 1.5% |
| Hungarian | 31 | 0.2% |
| Indian (Asian) | 296 | 2.1% |
| Iranian | 87 | 0.6% |
| Irish | 1,996 | 14.2% |
| Israeli | 148 | 1.1% |
| Italian | 2,073 | 14.7% |
| Jamaican | 57 | 0.4% |
| Korean | 322 | 2.3% |
| Latvian | 8 | 0.1% |
| Lebanese | 21 | 0.2% |
| Lithuanian | 41 | 0.3% |
| Mexican | 328 | 2.3% |
| Native Hawaiian | 96 | 0.7% |
| Northern European | 90 | 0.6% |
| Norwegian | 196 | 1.4% |
| Pakistani | 6 | 0.0% |
| Panamanian | 68 | 0.5% |
| Peruvian | 265 | 1.9% |
| Polish | 474 | 3.4% |
| Portuguese | 37 | 0.3% |
| Puerto Rican | 204 | 1.5% |
| Romanian | 29 | 0.2% |
| Russian | 196 | 1.4% |
| Salvadoran | 65 | 0.5% |
| Samoan | 96 | 0.7% |
| Scandinavian | 8 | 0.1% |
| Scotch-Irish | 106 | 0.7% |
| Scottish | 165 | 1.2% |
| Slovak | 19 | 0.1% |
| Slovene | 27 | 0.2% |
| South African | 18 | 0.1% |
| South American | 1,228 | 8.7% |
| South American Indian | 12 | 0.1% |
| Spaniard | 25 | 0.2% |
| Spanish | 269 | 1.9% |
| Sri Lankan | 21 | 0.2% |
| Subsaharan African | 48 | 0.3% |
| Swedish | 110 | 0.8% |
| Swiss | 28 | 0.2% |
| Syrian | 10 | 0.1% |
| Thai | 226 | 1.6% |
| Turkish | 61 | 0.4% |
| Ukrainian | 88 | 0.6% |
| Uruguayan | 77 | 0.5% |
| Welsh | 40 | 0.3% |
| Yugoslavian | 25 | 0.2% | View All 86 Rows |
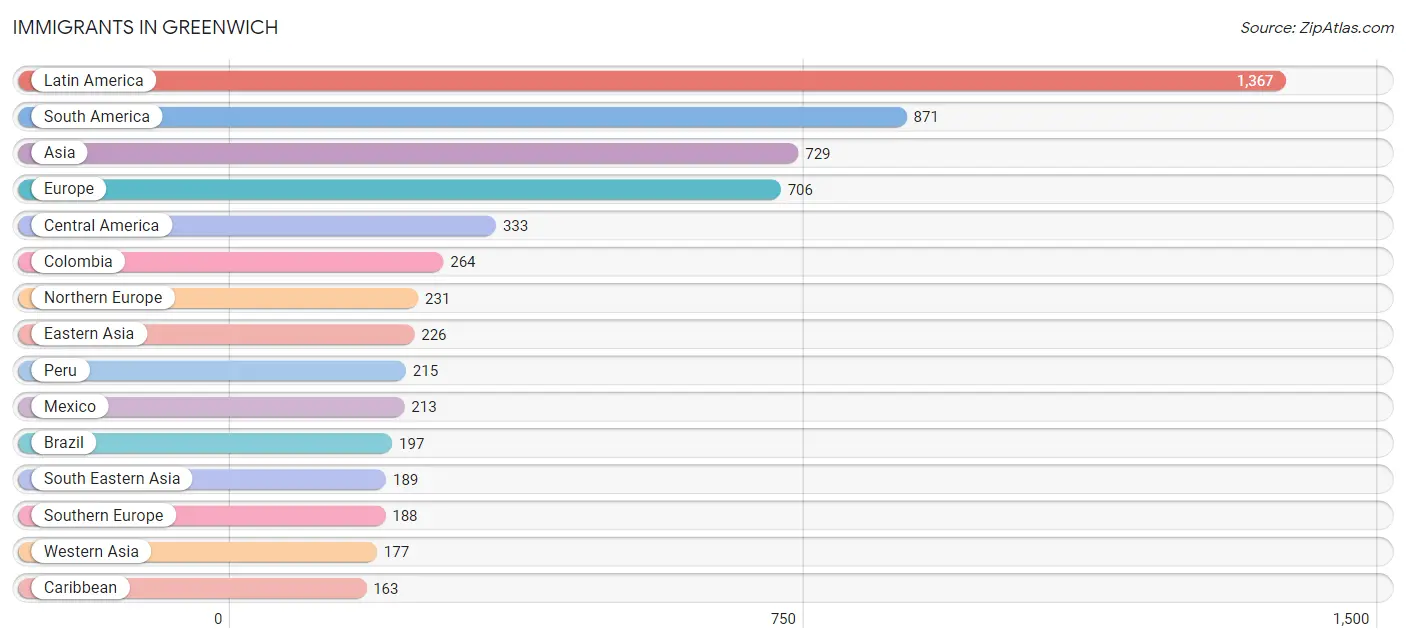
Immigrants in Greenwich
The most numerous immigrant groups reported in Greenwich came from Latin America (1,367 | 9.7%), South America (871 | 6.2%), Asia (729 | 5.2%), Europe (706 | 5.0%), and Central America (333 | 2.4%), together accounting for 28.5% of all Greenwich residents.
| Immigration Origin | # Population | % Population |
| Africa | 55 | 0.4% |
| Albania | 13 | 0.1% |
| Argentina | 52 | 0.4% |
| Asia | 729 | 5.2% |
| Australia | 42 | 0.3% |
| Bosnia and Herzegovina | 13 | 0.1% |
| Brazil | 197 | 1.4% |
| Canada | 115 | 0.8% |
| Caribbean | 163 | 1.2% |
| Central America | 333 | 2.4% |
| Chile | 44 | 0.3% |
| China | 92 | 0.6% |
| Colombia | 264 | 1.9% |
| Croatia | 16 | 0.1% |
| Cuba | 11 | 0.1% |
| Czechoslovakia | 9 | 0.1% |
| Denmark | 38 | 0.3% |
| Dominican Republic | 67 | 0.5% |
| Eastern Africa | 7 | 0.1% |
| Eastern Asia | 226 | 1.6% |
| Eastern Europe | 155 | 1.1% |
| Ecuador | 30 | 0.2% |
| Egypt | 19 | 0.1% |
| England | 67 | 0.5% |
| Ethiopia | 7 | 0.1% |
| Europe | 706 | 5.0% |
| France | 95 | 0.7% |
| Germany | 23 | 0.2% |
| Greece | 18 | 0.1% |
| Guatemala | 23 | 0.2% |
| Guyana | 10 | 0.1% |
| Haiti | 1 | 0.0% |
| Honduras | 72 | 0.5% |
| Hong Kong | 41 | 0.3% |
| India | 93 | 0.7% |
| Iran | 44 | 0.3% |
| Ireland | 18 | 0.1% |
| Israel | 47 | 0.3% |
| Italy | 104 | 0.7% |
| Jamaica | 84 | 0.6% |
| Japan | 41 | 0.3% |
| Korea | 93 | 0.7% |
| Latin America | 1,367 | 9.7% |
| Latvia | 8 | 0.1% |
| Lebanon | 11 | 0.1% |
| Mexico | 213 | 1.5% |
| Middle Africa | 20 | 0.1% |
| Netherlands | 5 | 0.0% |
| Northern Africa | 19 | 0.1% |
| Northern Europe | 231 | 1.6% |
| Norway | 40 | 0.3% |
| Oceania | 42 | 0.3% |
| Panama | 25 | 0.2% |
| Peru | 215 | 1.5% |
| Philippines | 162 | 1.1% |
| Poland | 34 | 0.2% |
| Portugal | 17 | 0.1% |
| Romania | 12 | 0.1% |
| Russia | 13 | 0.1% |
| Scotland | 12 | 0.1% |
| Serbia | 13 | 0.1% |
| South Africa | 9 | 0.1% |
| South America | 871 | 6.2% |
| South Central Asia | 137 | 1.0% |
| South Eastern Asia | 189 | 1.3% |
| Southern Europe | 188 | 1.3% |
| Spain | 49 | 0.4% |
| Sweden | 6 | 0.0% |
| Switzerland | 9 | 0.1% |
| Taiwan | 31 | 0.2% |
| Thailand | 6 | 0.0% |
| Turkey | 29 | 0.2% |
| Uruguay | 59 | 0.4% |
| Vietnam | 21 | 0.2% |
| Western Asia | 177 | 1.3% |
| Western Europe | 132 | 0.9% | View All 76 Rows |
Sex and Age in Greenwich
Sex and Age in Greenwich
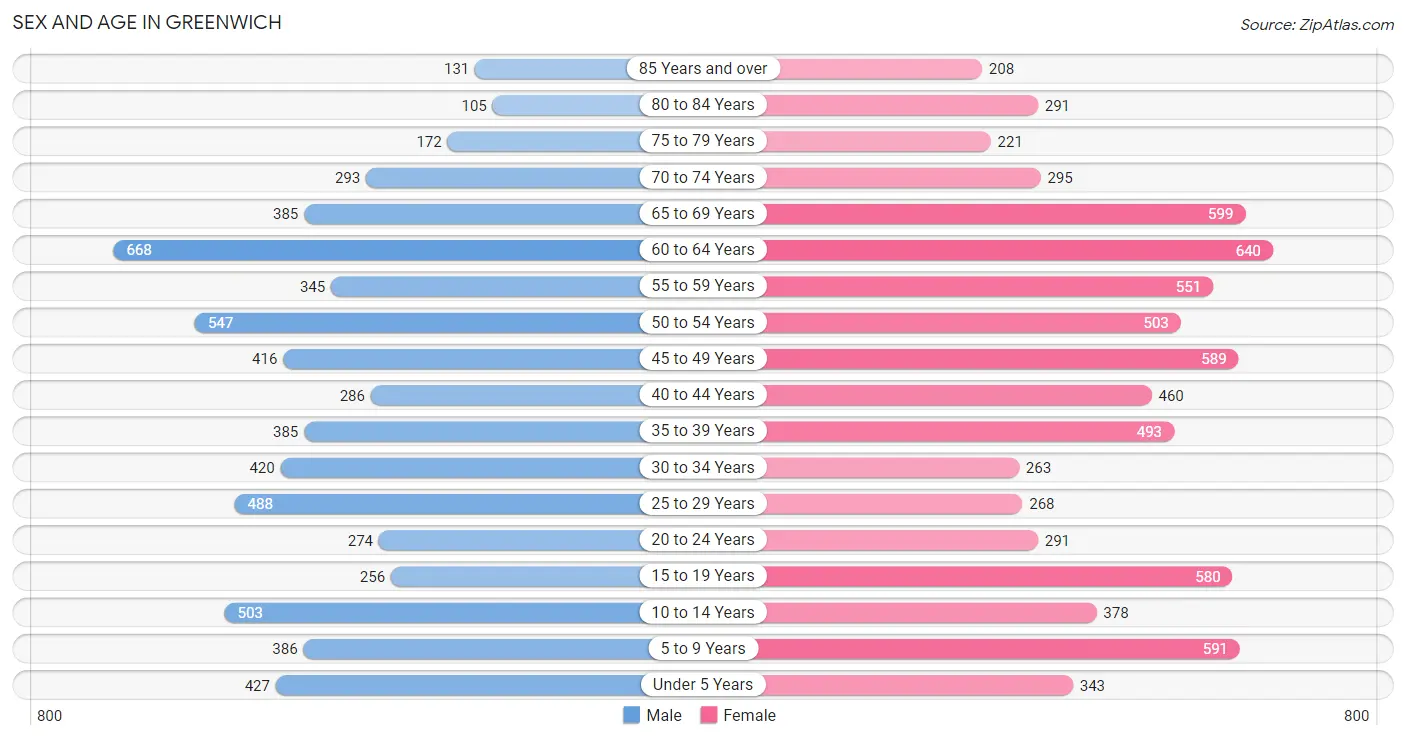
The most populous age groups in Greenwich are 60 to 64 Years (668 | 10.3%) for men and 60 to 64 Years (640 | 8.5%) for women.
| Age Bracket | Male | Female |
| Under 5 Years | 427 (6.6%) | 343 (4.5%) |
| 5 to 9 Years | 386 (5.9%) | 591 (7.8%) |
| 10 to 14 Years | 503 (7.7%) | 378 (5.0%) |
| 15 to 19 Years | 256 (4.0%) | 580 (7.7%) |
| 20 to 24 Years | 274 (4.2%) | 291 (3.8%) |
| 25 to 29 Years | 488 (7.5%) | 268 (3.5%) |
| 30 to 34 Years | 420 (6.5%) | 263 (3.5%) |
| 35 to 39 Years | 385 (5.9%) | 493 (6.5%) |
| 40 to 44 Years | 286 (4.4%) | 460 (6.1%) |
| 45 to 49 Years | 416 (6.4%) | 589 (7.8%) |
| 50 to 54 Years | 547 (8.4%) | 503 (6.7%) |
| 55 to 59 Years | 345 (5.3%) | 551 (7.3%) |
| 60 to 64 Years | 668 (10.3%) | 640 (8.5%) |
| 65 to 69 Years | 385 (5.9%) | 599 (7.9%) |
| 70 to 74 Years | 293 (4.5%) | 295 (3.9%) |
| 75 to 79 Years | 172 (2.6%) | 221 (2.9%) |
| 80 to 84 Years | 105 (1.6%) | 291 (3.8%) |
| 85 Years and over | 131 (2.0%) | 208 (2.8%) |
| Total | 6,487 (100.0%) | 7,564 (100.0%) |
Families and Households in Greenwich
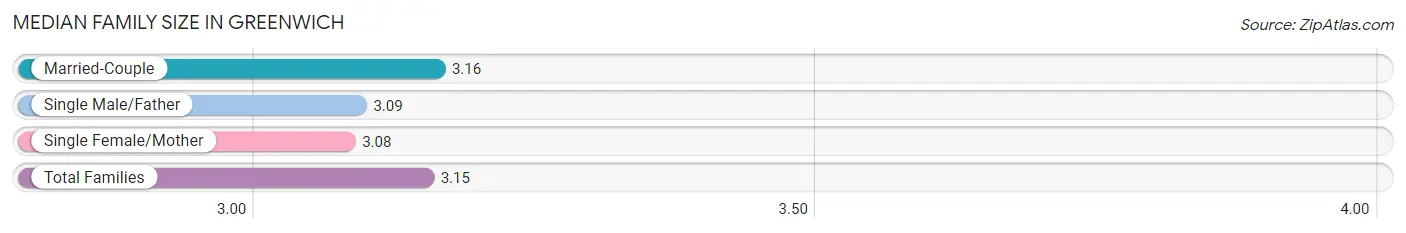
Median Family Size in Greenwich
The median family size in Greenwich is 3.15 persons per family, with married-couple families (2,917 | 79.4%) accounting for the largest median family size of 3.16 persons per family. On the other hand, single female/mother families (615 | 16.7%) represent the smallest median family size with 3.08 persons per family.
| Family Type | # Families | Family Size |
| Married-Couple | 2,917 (79.4%) | 3.16 |
| Single Male/Father | 141 (3.8%) | 3.09 |
| Single Female/Mother | 615 (16.7%) | 3.08 |
| Total Families | 3,673 (100.0%) | 3.15 |
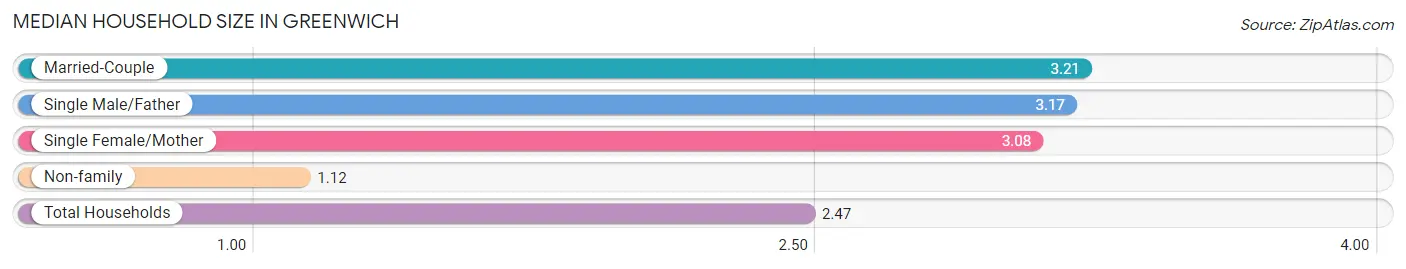
Median Household Size in Greenwich
The median household size in Greenwich is 2.47 persons per household, with married-couple households (2,917 | 51.8%) accounting for the largest median household size of 3.21 persons per household. non-family households (1,953 | 34.7%) represent the smallest median household size with 1.12 persons per household.
| Household Type | # Households | Household Size |
| Married-Couple | 2,917 (51.8%) | 3.21 |
| Single Male/Father | 141 (2.5%) | 3.17 |
| Single Female/Mother | 615 (10.9%) | 3.08 |
| Non-family | 1,953 (34.7%) | 1.12 |
| Total Households | 5,626 (100.0%) | 2.47 |
Household Size by Marriage Status in Greenwich
Out of a total of 5,626 households in Greenwich, 3,673 (65.3%) are family households, while 1,953 (34.7%) are nonfamily households. The most numerous type of family households are 2-person households, comprising 1,475, and the most common type of nonfamily households are 1-person households, comprising 1,759.
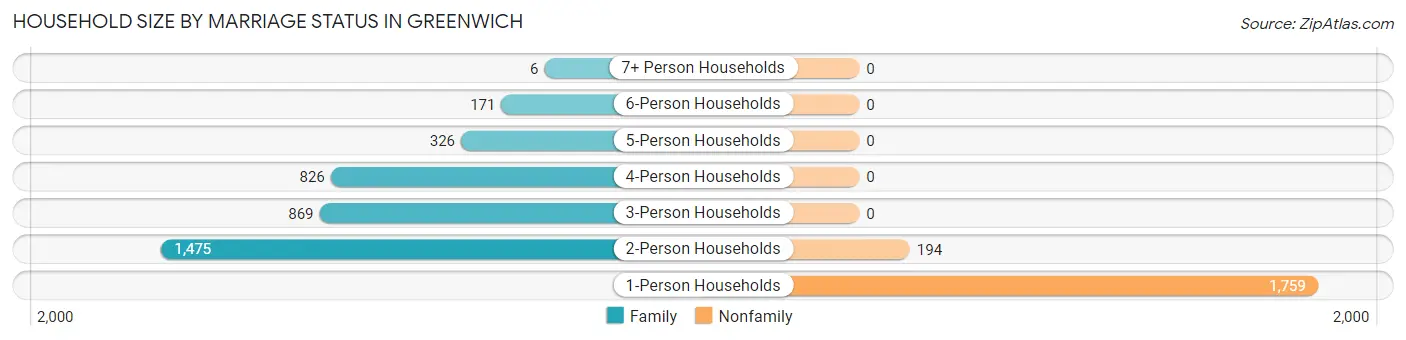
| Household Size | Family Households | Nonfamily Households |
| 1-Person Households | - | 1,759 (31.3%) |
| 2-Person Households | 1,475 (26.2%) | 194 (3.5%) |
| 3-Person Households | 869 (15.4%) | 0 (0.0%) |
| 4-Person Households | 826 (14.7%) | 0 (0.0%) |
| 5-Person Households | 326 (5.8%) | 0 (0.0%) |
| 6-Person Households | 171 (3.0%) | 0 (0.0%) |
| 7+ Person Households | 6 (0.1%) | 0 (0.0%) |
| Total | 3,673 (65.3%) | 1,953 (34.7%) |
Female Fertility in Greenwich
Fertility by Age in Greenwich
Average fertility rate in Greenwich is 50.0 births per 1,000 women. Women in the age bracket of 20 to 34 years have the highest fertility rate with 97.0 births per 1,000 women. Women in the age bracket of 20 to 34 years acount for 51.9% of all women with births.
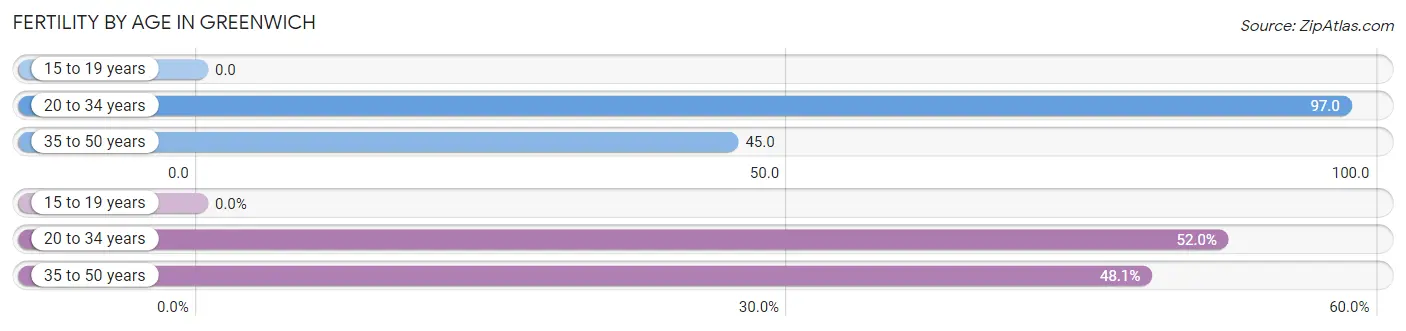
| Age Bracket | Women with Births | Births / 1,000 Women |
| 15 to 19 years | 0 (0.0%) | 0.0 |
| 20 to 34 years | 80 (51.9%) | 97.0 |
| 35 to 50 years | 74 (48.0%) | 45.0 |
| Total | 154 (100.0%) | 50.0 |
Fertility by Age by Marriage Status in Greenwich
95.5% of women with births (154) in Greenwich are married. The highest percentage of unmarried women with births falls into 35 to 50 years age bracket with 9.5% of them unmarried at the time of birth, while the lowest percentage of unmarried women with births belong to 20 to 34 years age bracket with 0.0% of them unmarried.
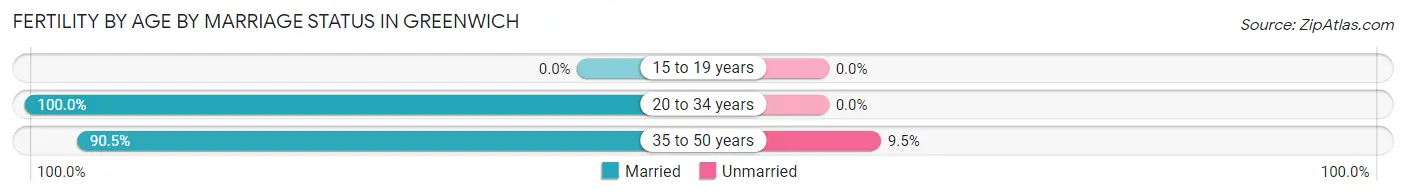
| Age Bracket | Married | Unmarried |
| 15 to 19 years | 0 (0.0%) | 0 (0.0%) |
| 20 to 34 years | 80 (100.0%) | 0 (0.0%) |
| 35 to 50 years | 67 (90.5%) | 7 (9.5%) |
| Total | 147 (95.5%) | 7 (4.5%) |
Fertility by Education in Greenwich
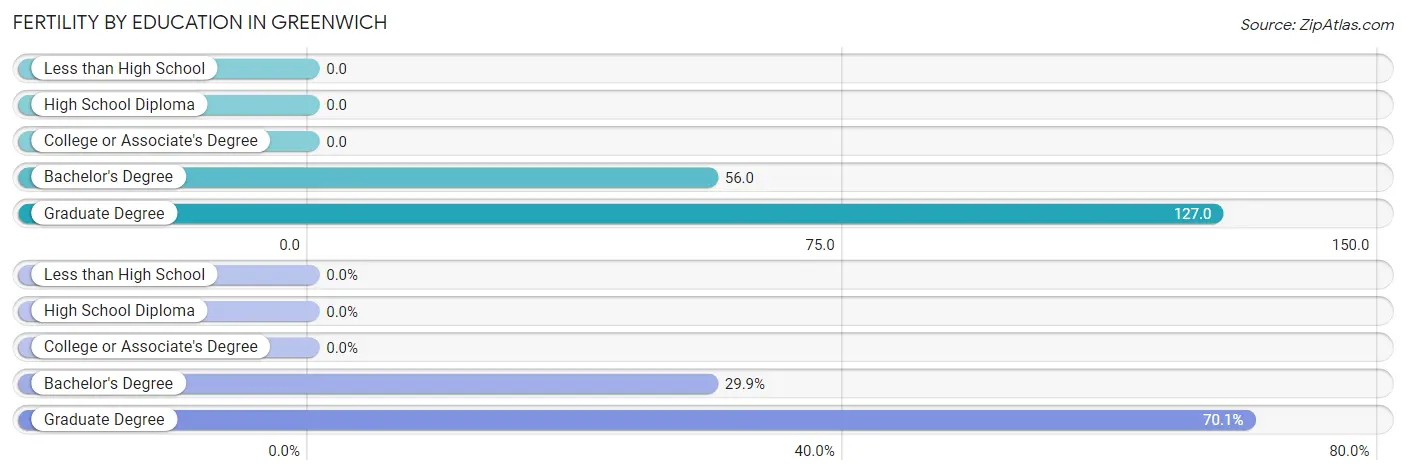
| Educational Attainment | Women with Births | Births / 1,000 Women |
| Less than High School | 0 (0.0%) | 0.0 |
| High School Diploma | 0 (0.0%) | 0.0 |
| College or Associate's Degree | 0 (0.0%) | 0.0 |
| Bachelor's Degree | 46 (29.9%) | 56.0 |
| Graduate Degree | 108 (70.1%) | 127.0 |
| Total | 154 (100.0%) | 50.0 |
Fertility by Education by Marriage Status in Greenwich
4.5% of women with births in Greenwich are unmarried. Women with the educational attainment of bachelor's degree are most likely to be married with 100.0% of them married at childbirth, while women with the educational attainment of graduate degree are least likely to be married with 6.5% of them unmarried at childbirth.
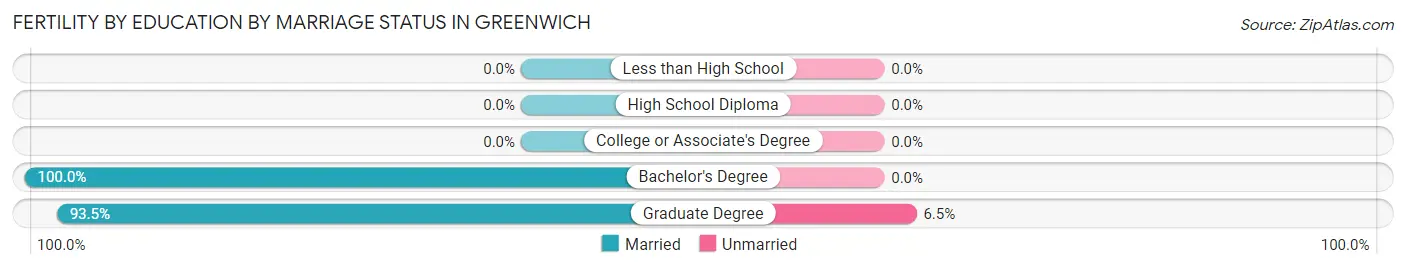
| Educational Attainment | Married | Unmarried |
| Less than High School | 0 (0.0%) | 0 (0.0%) |
| High School Diploma | 0 (0.0%) | 0 (0.0%) |
| College or Associate's Degree | 0 (0.0%) | 0 (0.0%) |
| Bachelor's Degree | 46 (100.0%) | 0 (0.0%) |
| Graduate Degree | 101 (93.5%) | 7 (6.5%) |
| Total | 147 (95.5%) | 7 (4.5%) |
Employment Characteristics in Greenwich
Employment by Class of Employer in Greenwich
Among the 6,210 employed individuals in Greenwich, private company employees (3,926 | 63.2%), not-for-profit organizations (749 | 12.1%), and self-employed (not incorporated) (681 | 11.0%) make up the most common classes of employment.
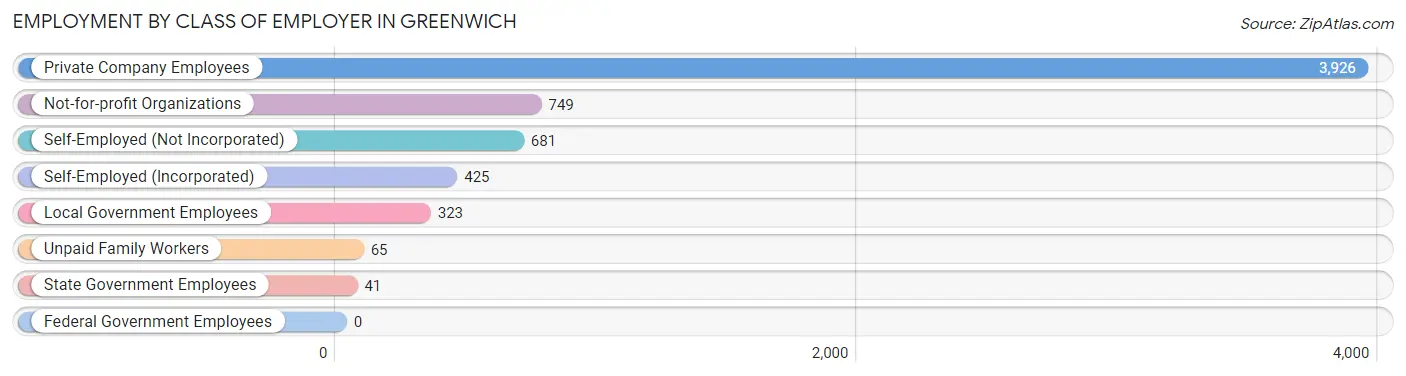
| Employer Class | # Employees | % Employees |
| Private Company Employees | 3,926 | 63.2% |
| Self-Employed (Incorporated) | 425 | 6.8% |
| Self-Employed (Not Incorporated) | 681 | 11.0% |
| Not-for-profit Organizations | 749 | 12.1% |
| Local Government Employees | 323 | 5.2% |
| State Government Employees | 41 | 0.7% |
| Federal Government Employees | 0 | 0.0% |
| Unpaid Family Workers | 65 | 1.1% |
| Total | 6,210 | 100.0% |
Employment Status by Age in Greenwich
According to the labor force statistics for Greenwich, out of the total population over 16 years of age (11,185), 61.2% or 6,845 individuals are in the labor force, with 8.1% or 554 of them unemployed. The age group with the highest labor force participation rate is 25 to 29 years, with 86.4% or 653 individuals in the labor force. Within the labor force, the 75 years and over age range has the highest percentage of unemployed individuals, with 18.4% or 23 of them being unemployed.
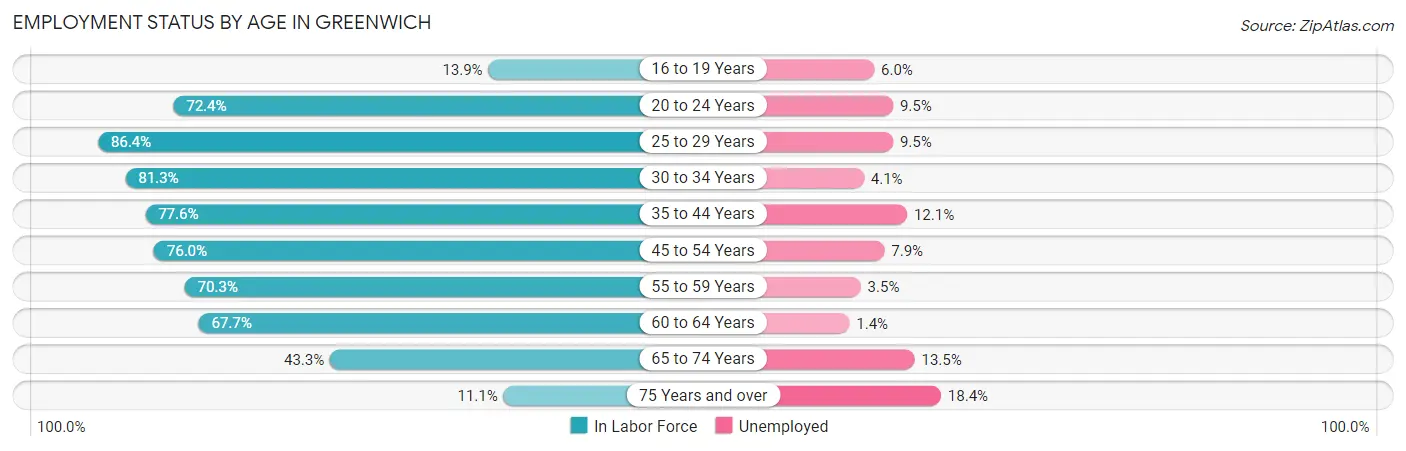
| Age Bracket | In Labor Force | Unemployed |
| 16 to 19 Years | 83 (13.9%) | 5 (6.0%) |
| 20 to 24 Years | 409 (72.4%) | 39 (9.5%) |
| 25 to 29 Years | 653 (86.4%) | 62 (9.5%) |
| 30 to 34 Years | 555 (81.3%) | 23 (4.1%) |
| 35 to 44 Years | 1,260 (77.6%) | 152 (12.1%) |
| 45 to 54 Years | 1,562 (76.0%) | 123 (7.9%) |
| 55 to 59 Years | 630 (70.3%) | 22 (3.5%) |
| 60 to 64 Years | 886 (67.7%) | 12 (1.4%) |
| 65 to 74 Years | 681 (43.3%) | 92 (13.5%) |
| 75 Years and over | 125 (11.1%) | 23 (18.4%) |
| Total | 6,845 (61.2%) | 554 (8.1%) |
Employment Status by Educational Attainment in Greenwich
According to labor force statistics for Greenwich, 75.7% of individuals (5,543) out of the total population between 25 and 64 years of age (7,322) are in the labor force, with 7.1% or 394 of them being unemployed. The group with the highest labor force participation rate are those with the educational attainment of bachelor's degree or higher, with 77.1% or 3,894 individuals in the labor force. Within the labor force, individuals with college / associate degree education have the highest percentage of unemployment, with 18.2% or 126 of them being unemployed.
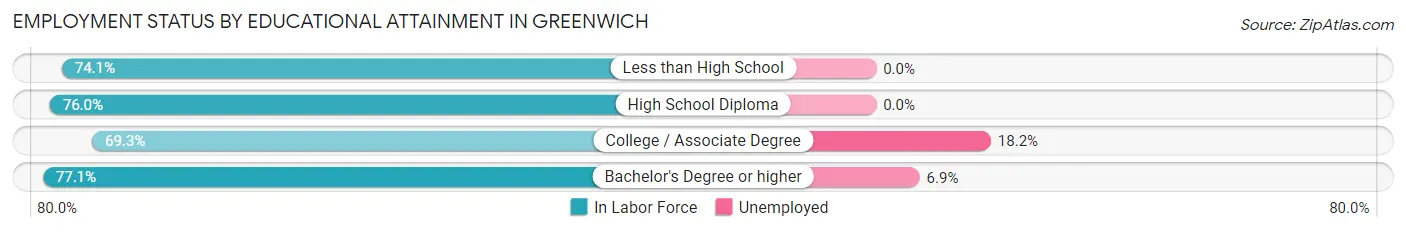
| Educational Attainment | In Labor Force | Unemployed |
| Less than High School | 218 (74.1%) | 0 (0.0%) |
| High School Diploma | 743 (76.0%) | 0 (0.0%) |
| College / Associate Degree | 692 (69.3%) | 182 (18.2%) |
| Bachelor's Degree or higher | 3,894 (77.1%) | 349 (6.9%) |
| Total | 5,543 (75.7%) | 520 (7.1%) |
Employment Occupations by Sex in Greenwich
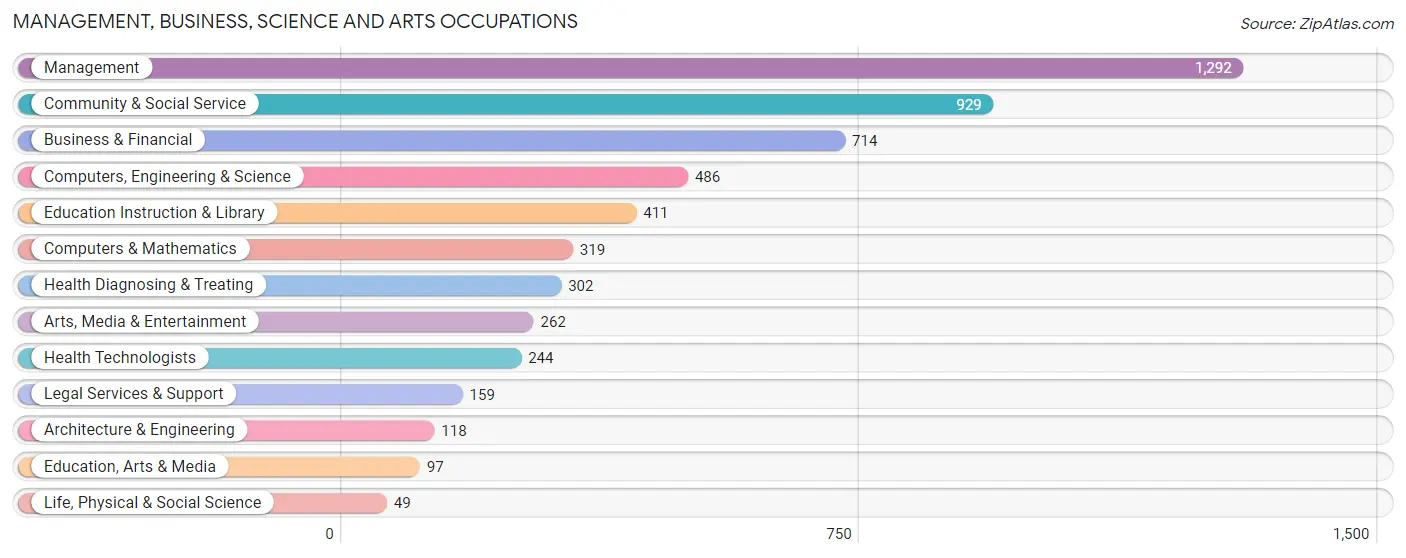
Management, Business, Science and Arts Occupations
The most common Management, Business, Science and Arts occupations in Greenwich are Management (1,292 | 20.5%), Community & Social Service (929 | 14.8%), Business & Financial (714 | 11.4%), Computers, Engineering & Science (486 | 7.7%), and Education Instruction & Library (411 | 6.5%).
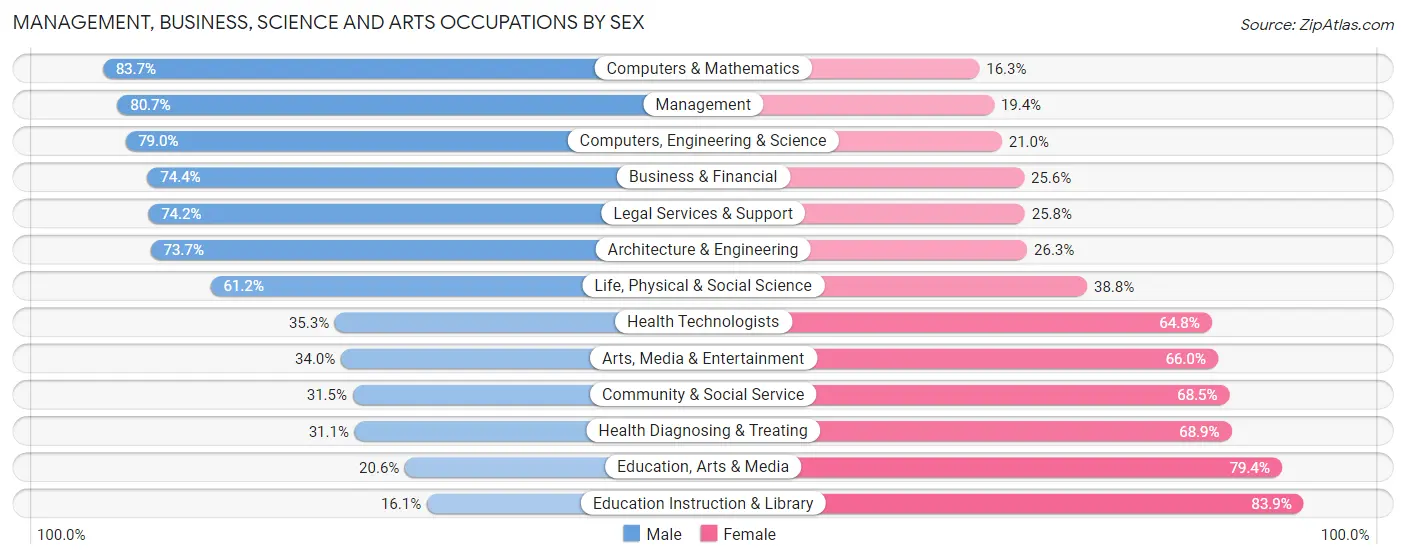
Management, Business, Science and Arts Occupations by Sex
Within the Management, Business, Science and Arts occupations in Greenwich, the most male-oriented occupations are Computers & Mathematics (83.7%), Management (80.6%), and Computers, Engineering & Science (79.0%), while the most female-oriented occupations are Education Instruction & Library (83.9%), Education, Arts & Media (79.4%), and Health Diagnosing & Treating (68.9%).
| Occupation | Male | Female |
| Management | 1,042 (80.6%) | 250 (19.4%) |
| Business & Financial | 531 (74.4%) | 183 (25.6%) |
| Computers, Engineering & Science | 384 (79.0%) | 102 (21.0%) |
| Computers & Mathematics | 267 (83.7%) | 52 (16.3%) |
| Architecture & Engineering | 87 (73.7%) | 31 (26.3%) |
| Life, Physical & Social Science | 30 (61.2%) | 19 (38.8%) |
| Community & Social Service | 293 (31.5%) | 636 (68.5%) |
| Education, Arts & Media | 20 (20.6%) | 77 (79.4%) |
| Legal Services & Support | 118 (74.2%) | 41 (25.8%) |
| Education Instruction & Library | 66 (16.1%) | 345 (83.9%) |
| Arts, Media & Entertainment | 89 (34.0%) | 173 (66.0%) |
| Health Diagnosing & Treating | 94 (31.1%) | 208 (68.9%) |
| Health Technologists | 86 (35.2%) | 158 (64.7%) |
| Total (Category) | 2,344 (63.0%) | 1,379 (37.0%) |
| Total (Overall) | 3,677 (58.5%) | 2,611 (41.5%) |
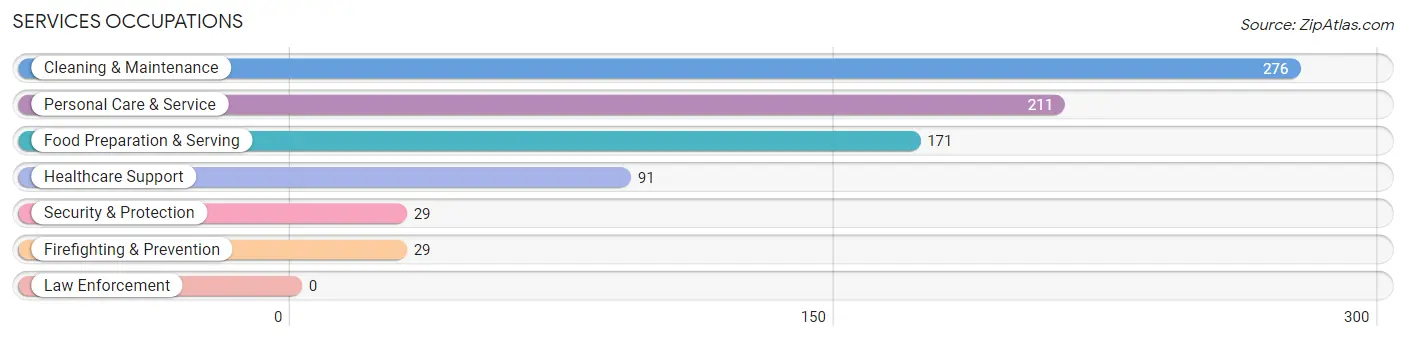
Services Occupations
The most common Services occupations in Greenwich are Cleaning & Maintenance (276 | 4.4%), Personal Care & Service (211 | 3.4%), Food Preparation & Serving (171 | 2.7%), Healthcare Support (91 | 1.5%), and Security & Protection (29 | 0.5%).
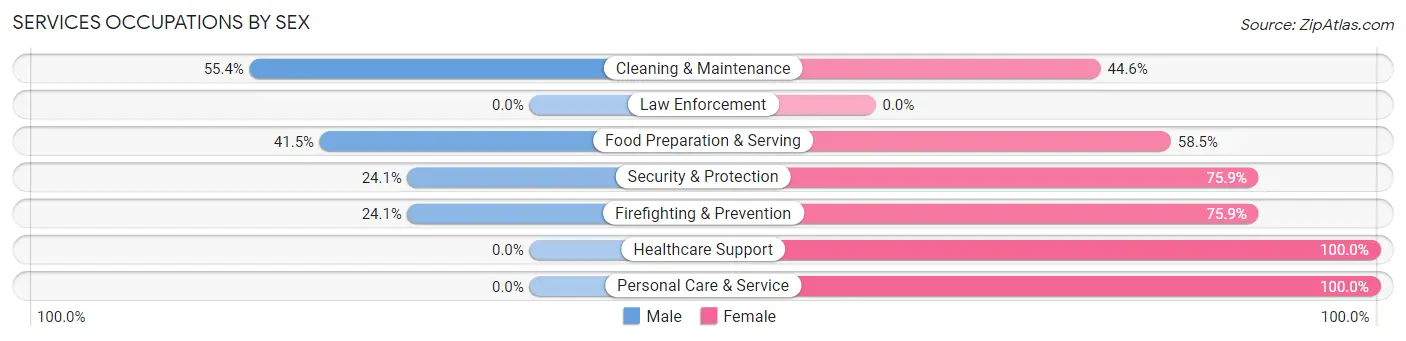
Services Occupations by Sex
Within the Services occupations in Greenwich, the most male-oriented occupations are Cleaning & Maintenance (55.4%), Food Preparation & Serving (41.5%), and Security & Protection (24.1%), while the most female-oriented occupations are Healthcare Support (100.0%), Personal Care & Service (100.0%), and Security & Protection (75.9%).
| Occupation | Male | Female |
| Healthcare Support | 0 (0.0%) | 91 (100.0%) |
| Security & Protection | 7 (24.1%) | 22 (75.9%) |
| Firefighting & Prevention | 7 (24.1%) | 22 (75.9%) |
| Law Enforcement | 0 (0.0%) | 0 (0.0%) |
| Food Preparation & Serving | 71 (41.5%) | 100 (58.5%) |
| Cleaning & Maintenance | 153 (55.4%) | 123 (44.6%) |
| Personal Care & Service | 0 (0.0%) | 211 (100.0%) |
| Total (Category) | 231 (29.7%) | 547 (70.3%) |
| Total (Overall) | 3,677 (58.5%) | 2,611 (41.5%) |
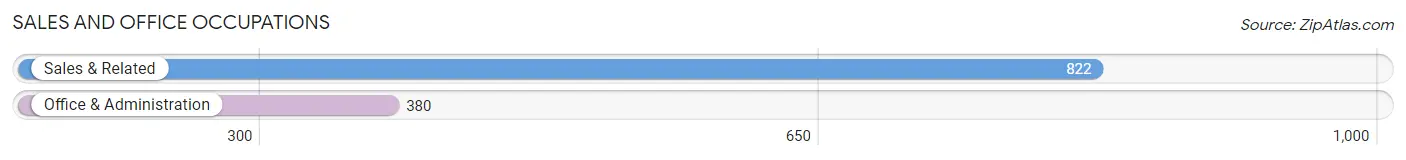
Sales and Office Occupations
The most common Sales and Office occupations in Greenwich are Sales & Related (822 | 13.1%), and Office & Administration (380 | 6.0%).
Sales and Office Occupations by Sex
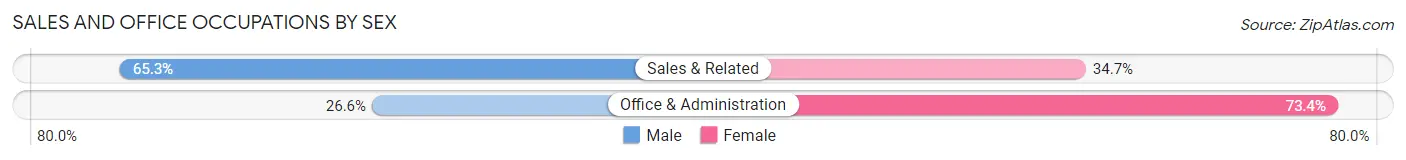
| Occupation | Male | Female |
| Sales & Related | 537 (65.3%) | 285 (34.7%) |
| Office & Administration | 101 (26.6%) | 279 (73.4%) |
| Total (Category) | 638 (53.1%) | 564 (46.9%) |
| Total (Overall) | 3,677 (58.5%) | 2,611 (41.5%) |
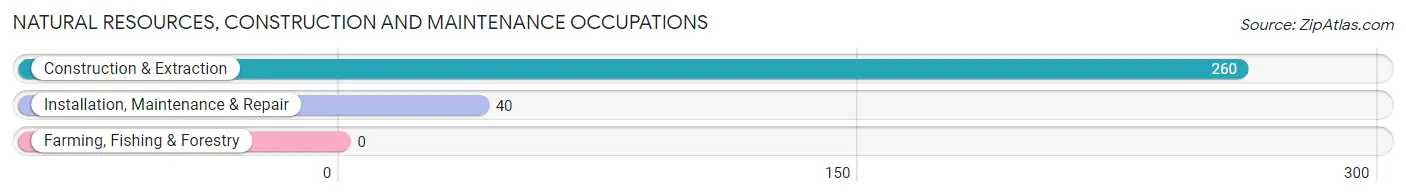
Natural Resources, Construction and Maintenance Occupations
The most common Natural Resources, Construction and Maintenance occupations in Greenwich are Construction & Extraction (260 | 4.1%), and Installation, Maintenance & Repair (40 | 0.6%).
Natural Resources, Construction and Maintenance Occupations by Sex
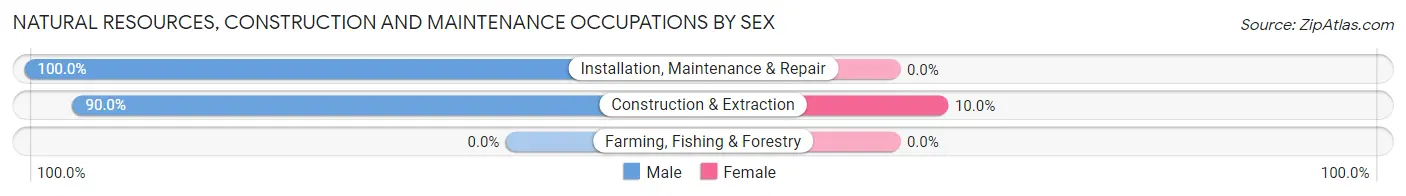
| Occupation | Male | Female |
| Farming, Fishing & Forestry | 0 (0.0%) | 0 (0.0%) |
| Construction & Extraction | 234 (90.0%) | 26 (10.0%) |
| Installation, Maintenance & Repair | 40 (100.0%) | 0 (0.0%) |
| Total (Category) | 274 (91.3%) | 26 (8.7%) |
| Total (Overall) | 3,677 (58.5%) | 2,611 (41.5%) |
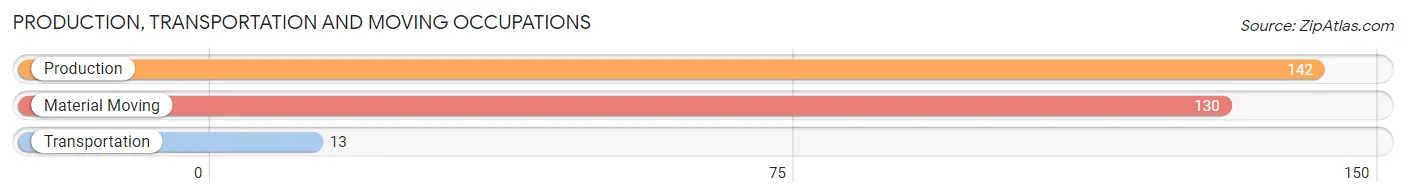
Production, Transportation and Moving Occupations
The most common Production, Transportation and Moving occupations in Greenwich are Production (142 | 2.3%), Material Moving (130 | 2.1%), and Transportation (13 | 0.2%).
Production, Transportation and Moving Occupations by Sex
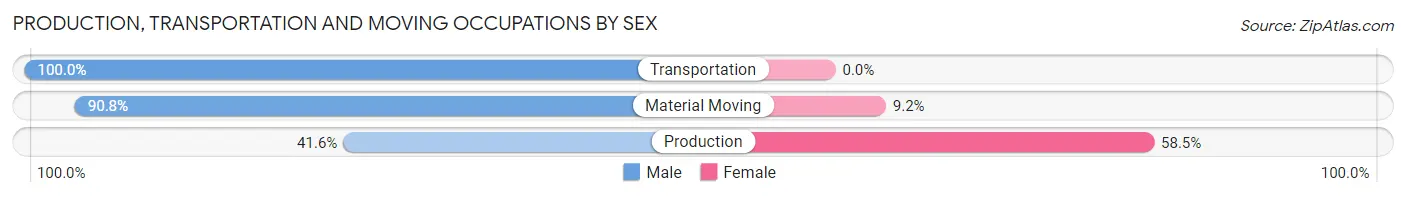
| Occupation | Male | Female |
| Production | 59 (41.5%) | 83 (58.5%) |
| Transportation | 13 (100.0%) | 0 (0.0%) |
| Material Moving | 118 (90.8%) | 12 (9.2%) |
| Total (Category) | 190 (66.7%) | 95 (33.3%) |
| Total (Overall) | 3,677 (58.5%) | 2,611 (41.5%) |
Employment Industries by Sex in Greenwich
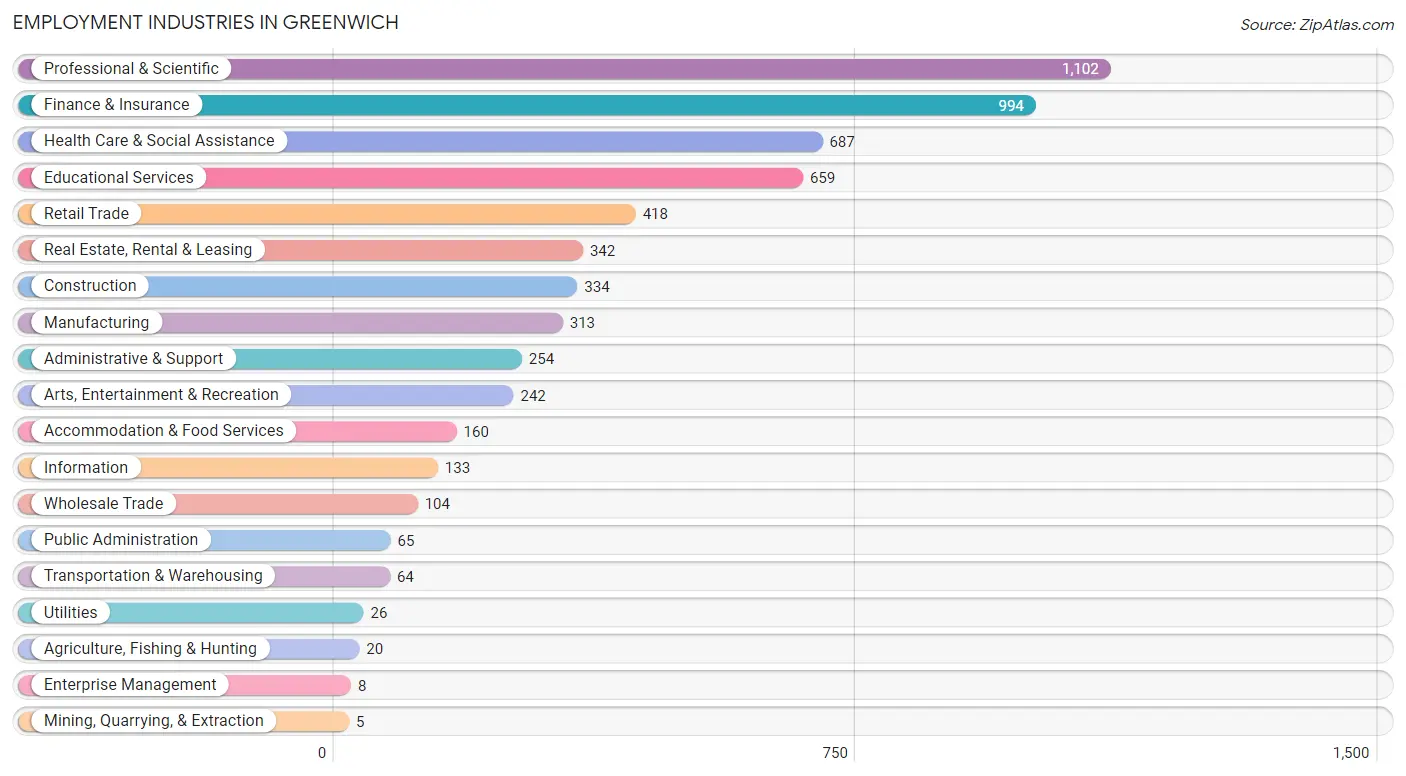
Employment Industries in Greenwich
The major employment industries in Greenwich include Professional & Scientific (1,102 | 17.5%), Finance & Insurance (994 | 15.8%), Health Care & Social Assistance (687 | 10.9%), Educational Services (659 | 10.5%), and Retail Trade (418 | 6.7%).
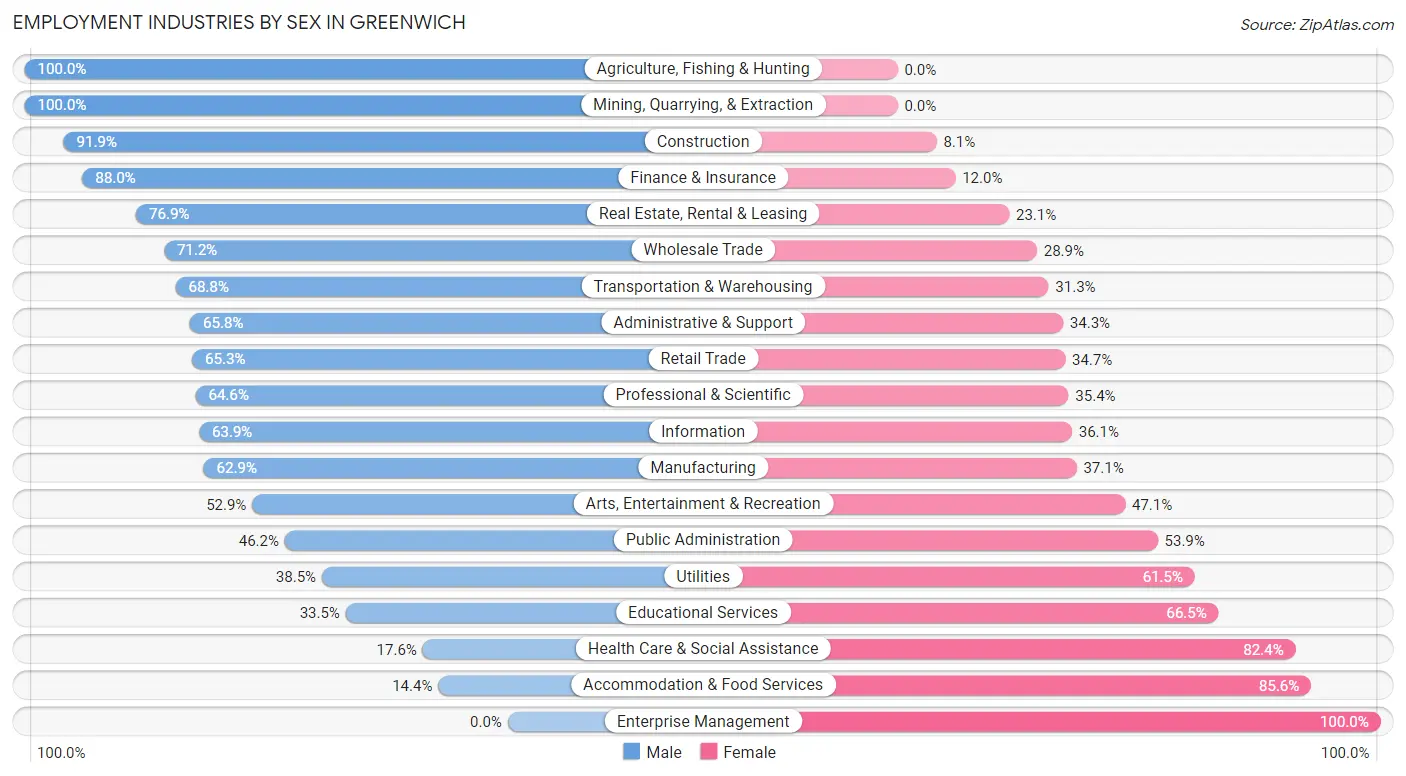
Employment Industries by Sex in Greenwich
The Greenwich industries that see more men than women are Agriculture, Fishing & Hunting (100.0%), Mining, Quarrying, & Extraction (100.0%), and Construction (91.9%), whereas the industries that tend to have a higher number of women are Enterprise Management (100.0%), Accommodation & Food Services (85.6%), and Health Care & Social Assistance (82.4%).
| Industry | Male | Female |
| Agriculture, Fishing & Hunting | 20 (100.0%) | 0 (0.0%) |
| Mining, Quarrying, & Extraction | 5 (100.0%) | 0 (0.0%) |
| Construction | 307 (91.9%) | 27 (8.1%) |
| Manufacturing | 197 (62.9%) | 116 (37.1%) |
| Wholesale Trade | 74 (71.2%) | 30 (28.8%) |
| Retail Trade | 273 (65.3%) | 145 (34.7%) |
| Transportation & Warehousing | 44 (68.8%) | 20 (31.2%) |
| Utilities | 10 (38.5%) | 16 (61.5%) |
| Information | 85 (63.9%) | 48 (36.1%) |
| Finance & Insurance | 875 (88.0%) | 119 (12.0%) |
| Real Estate, Rental & Leasing | 263 (76.9%) | 79 (23.1%) |
| Professional & Scientific | 712 (64.6%) | 390 (35.4%) |
| Enterprise Management | 0 (0.0%) | 8 (100.0%) |
| Administrative & Support | 167 (65.7%) | 87 (34.3%) |
| Educational Services | 221 (33.5%) | 438 (66.5%) |
| Health Care & Social Assistance | 121 (17.6%) | 566 (82.4%) |
| Arts, Entertainment & Recreation | 128 (52.9%) | 114 (47.1%) |
| Accommodation & Food Services | 23 (14.4%) | 137 (85.6%) |
| Public Administration | 30 (46.2%) | 35 (53.8%) |
| Total | 3,677 (58.5%) | 2,611 (41.5%) |
Education in Greenwich
School Enrollment in Greenwich
The most common levels of schooling among the 3,307 students in Greenwich are elementary school (863 | 26.1%), high school (837 | 25.3%), and middle school (696 | 21.0%).
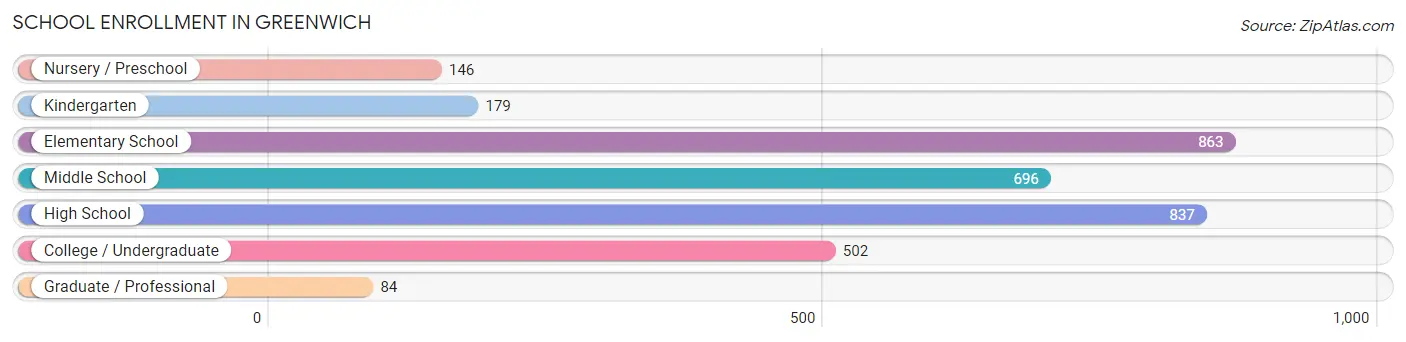
| School Level | # Students | % Students |
| Nursery / Preschool | 146 | 4.4% |
| Kindergarten | 179 | 5.4% |
| Elementary School | 863 | 26.1% |
| Middle School | 696 | 21.0% |
| High School | 837 | 25.3% |
| College / Undergraduate | 502 | 15.2% |
| Graduate / Professional | 84 | 2.5% |
| Total | 3,307 | 100.0% |
School Enrollment by Age by Funding Source in Greenwich
Out of a total of 3,307 students who are enrolled in schools in Greenwich, 1,597 (48.3%) attend a private institution, while the remaining 1,710 (51.7%) are enrolled in public schools. The age group of 3 to 4 year olds has the highest likelihood of being enrolled in private schools, with 119 (92.2% in the age bracket) enrolled. Conversely, the age group of 25 to 34 year olds has the lowest likelihood of being enrolled in a private school, with 85 (70.8% in the age bracket) attending a public institution.
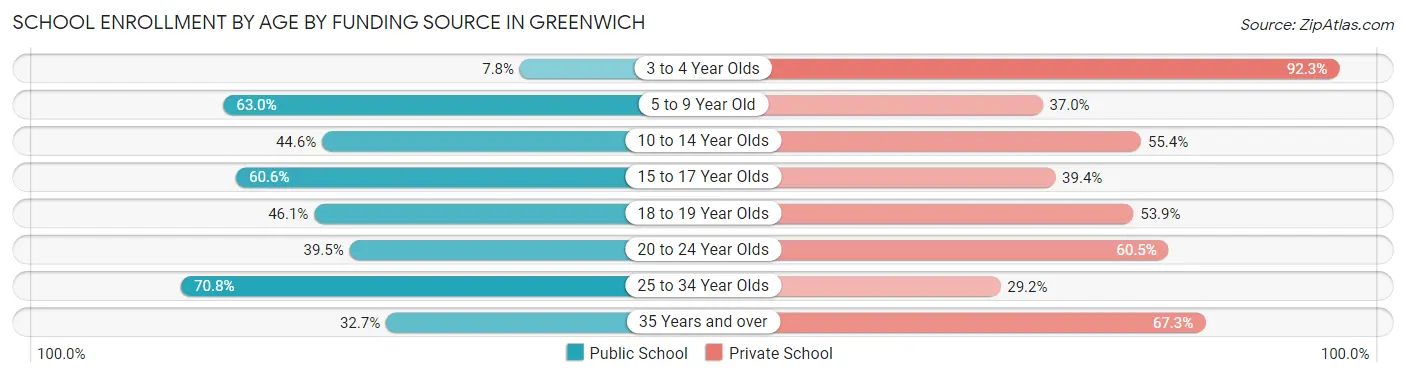
| Age Bracket | Public School | Private School |
| 3 to 4 Year Olds | 10 (7.7%) | 119 (92.2%) |
| 5 to 9 Year Old | 609 (63.0%) | 358 (37.0%) |
| 10 to 14 Year Olds | 393 (44.6%) | 488 (55.4%) |
| 15 to 17 Year Olds | 360 (60.6%) | 234 (39.4%) |
| 18 to 19 Year Olds | 111 (46.1%) | 130 (53.9%) |
| 20 to 24 Year Olds | 107 (39.5%) | 164 (60.5%) |
| 25 to 34 Year Olds | 85 (70.8%) | 35 (29.2%) |
| 35 Years and over | 34 (32.7%) | 70 (67.3%) |
| Total | 1,710 (51.7%) | 1,597 (48.3%) |
Educational Attainment by Field of Study in Greenwich
Business (1,645 | 22.8%), social sciences (1,376 | 19.1%), liberal arts & history (692 | 9.6%), literature & languages (551 | 7.6%), and engineering (387 | 5.4%) are the most common fields of study among 7,218 individuals in Greenwich who have obtained a bachelor's degree or higher.
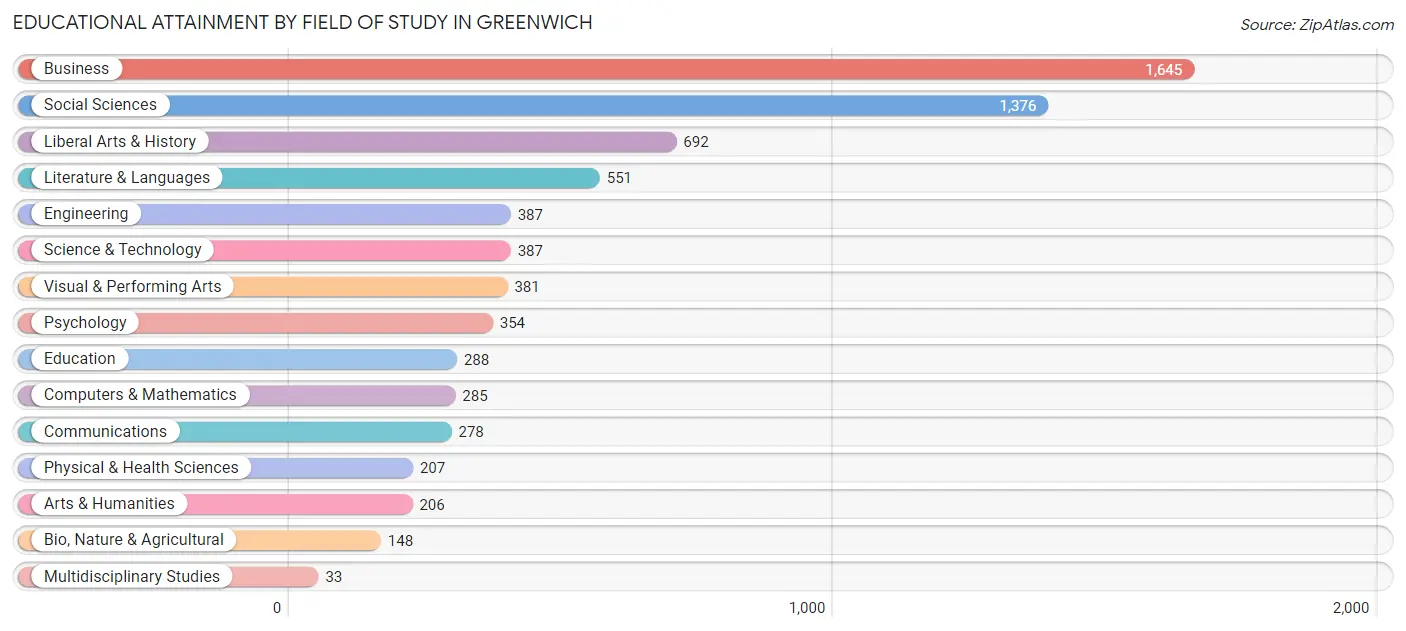
| Field of Study | # Graduates | % Graduates |
| Computers & Mathematics | 285 | 4.0% |
| Bio, Nature & Agricultural | 148 | 2.1% |
| Physical & Health Sciences | 207 | 2.9% |
| Psychology | 354 | 4.9% |
| Social Sciences | 1,376 | 19.1% |
| Engineering | 387 | 5.4% |
| Multidisciplinary Studies | 33 | 0.5% |
| Science & Technology | 387 | 5.4% |
| Business | 1,645 | 22.8% |
| Education | 288 | 4.0% |
| Literature & Languages | 551 | 7.6% |
| Liberal Arts & History | 692 | 9.6% |
| Visual & Performing Arts | 381 | 5.3% |
| Communications | 278 | 3.8% |
| Arts & Humanities | 206 | 2.9% |
| Total | 7,218 | 100.0% |
Transportation & Commute in Greenwich
Vehicle Availability by Sex in Greenwich
The most prevalent vehicle ownership categories in Greenwich are males with 2 vehicles (1,589, accounting for 44.3%) and females with 2 vehicles (891, making up 62.9%).

| Vehicles Available | Male | Female |
| No Vehicle | 139 (3.9%) | 166 (6.6%) |
| 1 Vehicle | 828 (23.1%) | 823 (32.6%) |
| 2 Vehicles | 1,589 (44.3%) | 891 (35.2%) |
| 3 Vehicles | 607 (16.9%) | 330 (13.1%) |
| 4 Vehicles | 305 (8.5%) | 218 (8.6%) |
| 5 or more Vehicles | 123 (3.4%) | 100 (4.0%) |
| Total | 3,591 (100.0%) | 2,528 (100.0%) |
Commute Time in Greenwich
The most frequently occuring commute durations in Greenwich are 5 to 9 minutes (856 commuters, 16.8%), 10 to 14 minutes (820 commuters, 16.1%), and 60 to 89 minutes (727 commuters, 14.3%).
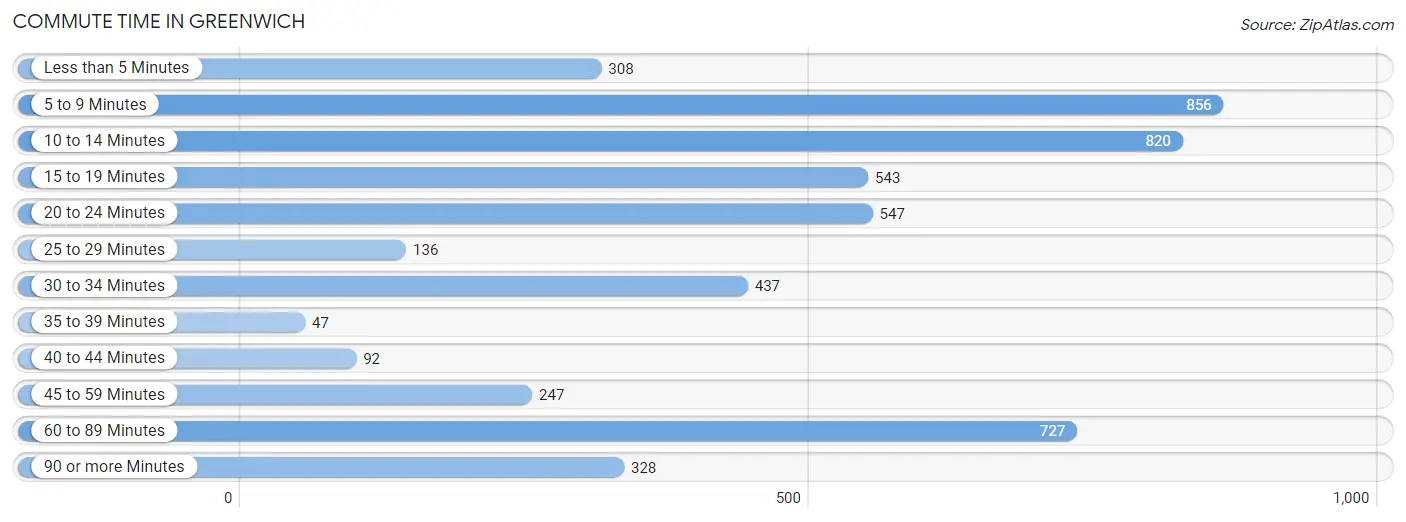
| Commute Time | # Commuters | % Commuters |
| Less than 5 Minutes | 308 | 6.0% |
| 5 to 9 Minutes | 856 | 16.8% |
| 10 to 14 Minutes | 820 | 16.1% |
| 15 to 19 Minutes | 543 | 10.7% |
| 20 to 24 Minutes | 547 | 10.7% |
| 25 to 29 Minutes | 136 | 2.7% |
| 30 to 34 Minutes | 437 | 8.6% |
| 35 to 39 Minutes | 47 | 0.9% |
| 40 to 44 Minutes | 92 | 1.8% |
| 45 to 59 Minutes | 247 | 4.9% |
| 60 to 89 Minutes | 727 | 14.3% |
| 90 or more Minutes | 328 | 6.5% |
Commute Time by Sex in Greenwich
The most common commute times in Greenwich are 10 to 14 minutes (556 commuters, 18.3%) for males and 5 to 9 minutes (424 commuters, 20.7%) for females.
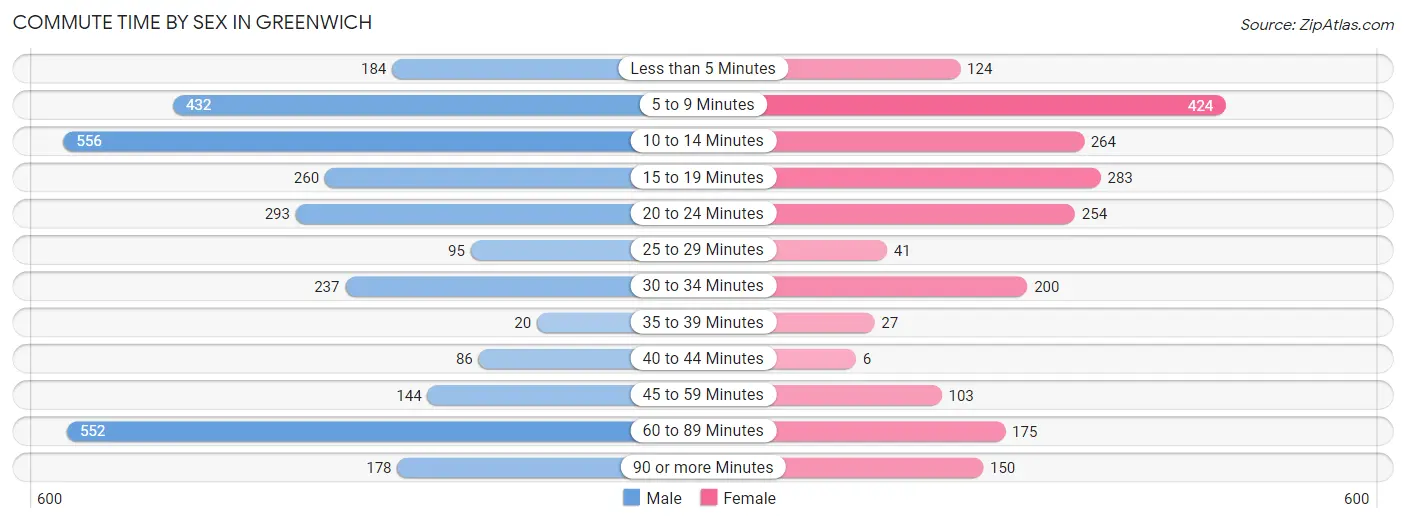
| Commute Time | Male | Female |
| Less than 5 Minutes | 184 (6.1%) | 124 (6.0%) |
| 5 to 9 Minutes | 432 (14.2%) | 424 (20.7%) |
| 10 to 14 Minutes | 556 (18.3%) | 264 (12.9%) |
| 15 to 19 Minutes | 260 (8.6%) | 283 (13.8%) |
| 20 to 24 Minutes | 293 (9.7%) | 254 (12.4%) |
| 25 to 29 Minutes | 95 (3.1%) | 41 (2.0%) |
| 30 to 34 Minutes | 237 (7.8%) | 200 (9.8%) |
| 35 to 39 Minutes | 20 (0.7%) | 27 (1.3%) |
| 40 to 44 Minutes | 86 (2.8%) | 6 (0.3%) |
| 45 to 59 Minutes | 144 (4.7%) | 103 (5.0%) |
| 60 to 89 Minutes | 552 (18.2%) | 175 (8.5%) |
| 90 or more Minutes | 178 (5.9%) | 150 (7.3%) |
Time of Departure to Work by Sex in Greenwich
The most frequent times of departure to work in Greenwich are 7:00 AM to 7:29 AM (469, 15.4%) for males and 7:30 AM to 7:59 AM (518, 25.3%) for females.
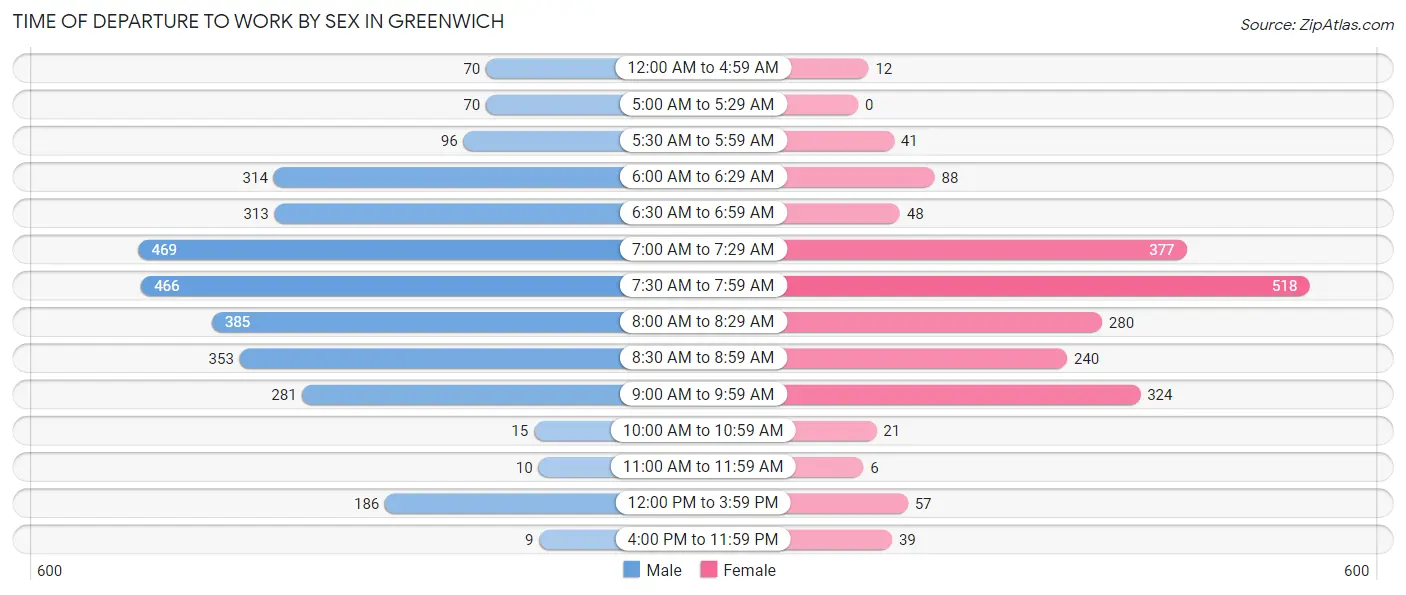
| Time of Departure | Male | Female |
| 12:00 AM to 4:59 AM | 70 (2.3%) | 12 (0.6%) |
| 5:00 AM to 5:29 AM | 70 (2.3%) | 0 (0.0%) |
| 5:30 AM to 5:59 AM | 96 (3.2%) | 41 (2.0%) |
| 6:00 AM to 6:29 AM | 314 (10.3%) | 88 (4.3%) |
| 6:30 AM to 6:59 AM | 313 (10.3%) | 48 (2.3%) |
| 7:00 AM to 7:29 AM | 469 (15.4%) | 377 (18.4%) |
| 7:30 AM to 7:59 AM | 466 (15.3%) | 518 (25.3%) |
| 8:00 AM to 8:29 AM | 385 (12.7%) | 280 (13.7%) |
| 8:30 AM to 8:59 AM | 353 (11.6%) | 240 (11.7%) |
| 9:00 AM to 9:59 AM | 281 (9.2%) | 324 (15.8%) |
| 10:00 AM to 10:59 AM | 15 (0.5%) | 21 (1.0%) |
| 11:00 AM to 11:59 AM | 10 (0.3%) | 6 (0.3%) |
| 12:00 PM to 3:59 PM | 186 (6.1%) | 57 (2.8%) |
| 4:00 PM to 11:59 PM | 9 (0.3%) | 39 (1.9%) |
| Total | 3,037 (100.0%) | 2,051 (100.0%) |
Housing Occupancy in Greenwich
Occupancy by Ownership in Greenwich
Of the total 5,626 dwellings in Greenwich, owner-occupied units account for 2,859 (50.8%), while renter-occupied units make up 2,767 (49.2%).
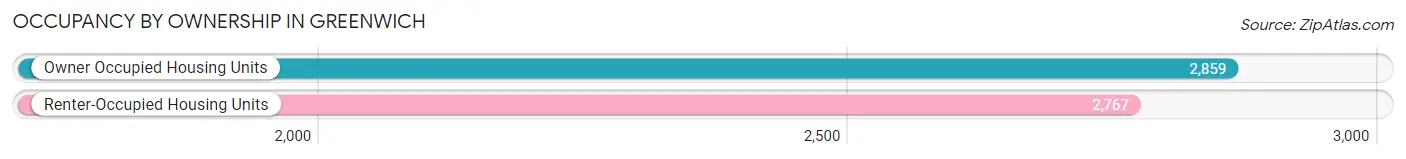
| Occupancy | # Housing Units | % Housing Units |
| Owner Occupied Housing Units | 2,859 | 50.8% |
| Renter-Occupied Housing Units | 2,767 | 49.2% |
| Total Occupied Housing Units | 5,626 | 100.0% |
Occupancy by Household Size in Greenwich
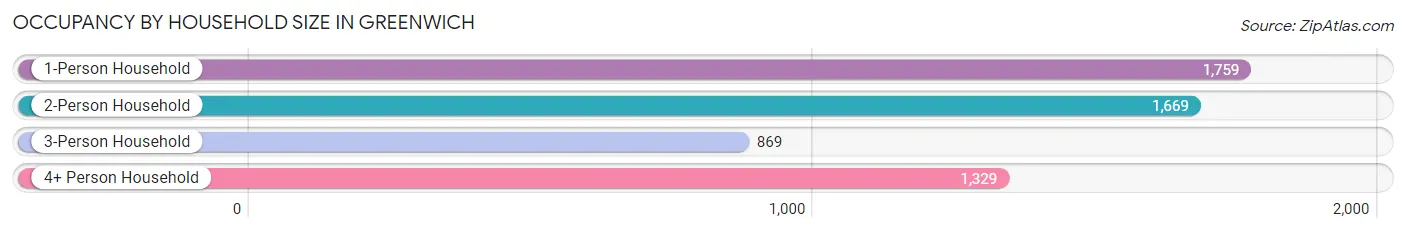
| Household Size | # Housing Units | % Housing Units |
| 1-Person Household | 1,759 | 31.3% |
| 2-Person Household | 1,669 | 29.7% |
| 3-Person Household | 869 | 15.4% |
| 4+ Person Household | 1,329 | 23.6% |
| Total Housing Units | 5,626 | 100.0% |
Occupancy by Ownership by Household Size in Greenwich
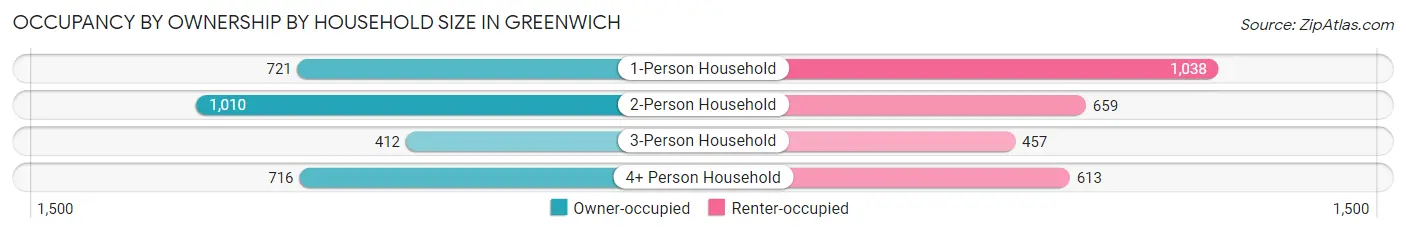
| Household Size | Owner-occupied | Renter-occupied |
| 1-Person Household | 721 (41.0%) | 1,038 (59.0%) |
| 2-Person Household | 1,010 (60.5%) | 659 (39.5%) |
| 3-Person Household | 412 (47.4%) | 457 (52.6%) |
| 4+ Person Household | 716 (53.9%) | 613 (46.1%) |
| Total Housing Units | 2,859 (50.8%) | 2,767 (49.2%) |
Occupancy by Educational Attainment in Greenwich
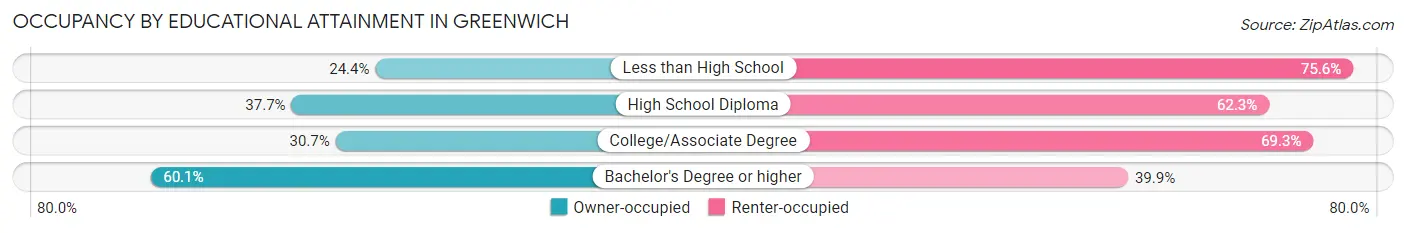
| Household Size | Owner-occupied | Renter-occupied |
| Less than High School | 87 (24.4%) | 270 (75.6%) |
| High School Diploma | 269 (37.7%) | 445 (62.3%) |
| College/Associate Degree | 243 (30.7%) | 549 (69.3%) |
| Bachelor's Degree or higher | 2,260 (60.1%) | 1,503 (39.9%) |
Occupancy by Age of Householder in Greenwich
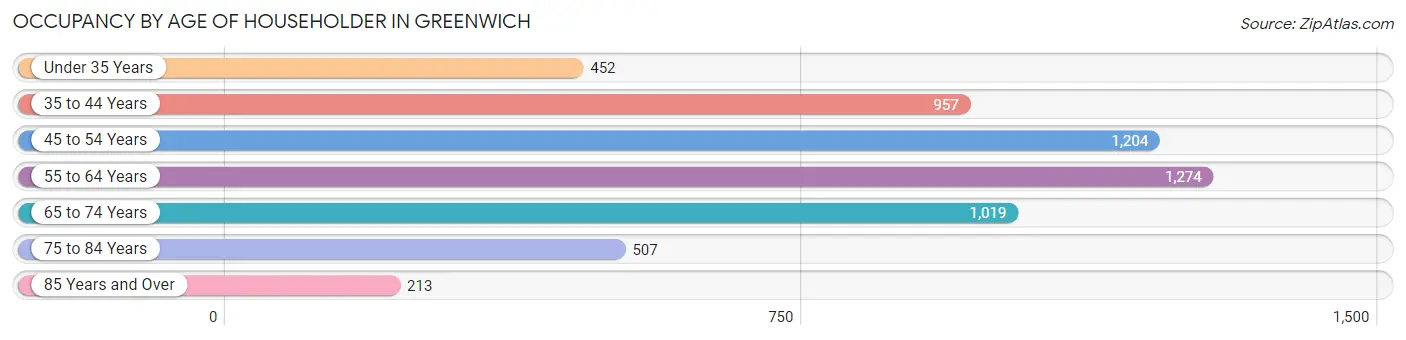
| Age Bracket | # Households | % Households |
| Under 35 Years | 452 | 8.0% |
| 35 to 44 Years | 957 | 17.0% |
| 45 to 54 Years | 1,204 | 21.4% |
| 55 to 64 Years | 1,274 | 22.6% |
| 65 to 74 Years | 1,019 | 18.1% |
| 75 to 84 Years | 507 | 9.0% |
| 85 Years and Over | 213 | 3.8% |
| Total | 5,626 | 100.0% |
Housing Finances in Greenwich
Median Income by Occupancy in Greenwich
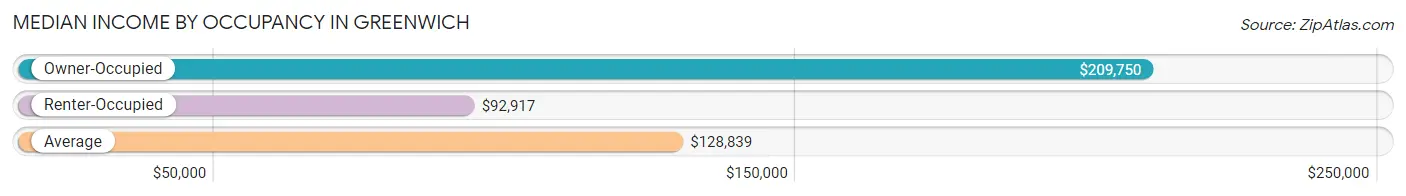
| Occupancy Type | # Households | Median Income |
| Owner-Occupied | 2,859 (50.8%) | $209,750 |
| Renter-Occupied | 2,767 (49.2%) | $92,917 |
| Average | 5,626 (100.0%) | $128,839 |
Occupancy by Householder Income Bracket in Greenwich
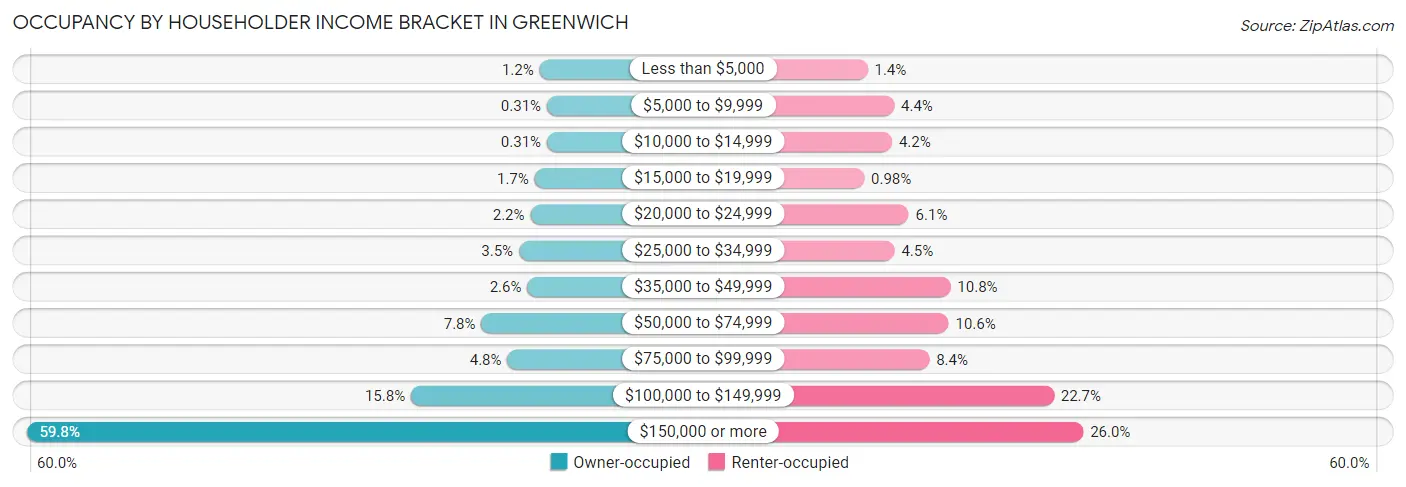
| Income Bracket | Owner-occupied | Renter-occupied |
| Less than $5,000 | 33 (1.1%) | 38 (1.4%) |
| $5,000 to $9,999 | 9 (0.3%) | 122 (4.4%) |
| $10,000 to $14,999 | 9 (0.3%) | 115 (4.2%) |
| $15,000 to $19,999 | 49 (1.7%) | 27 (1.0%) |
| $20,000 to $24,999 | 63 (2.2%) | 168 (6.1%) |
| $25,000 to $34,999 | 100 (3.5%) | 123 (4.4%) |
| $35,000 to $49,999 | 73 (2.5%) | 300 (10.8%) |
| $50,000 to $74,999 | 223 (7.8%) | 294 (10.6%) |
| $75,000 to $99,999 | 138 (4.8%) | 233 (8.4%) |
| $100,000 to $149,999 | 453 (15.8%) | 627 (22.7%) |
| $150,000 or more | 1,709 (59.8%) | 720 (26.0%) |
| Total | 2,859 (100.0%) | 2,767 (100.0%) |
Monthly Housing Cost Tiers in Greenwich
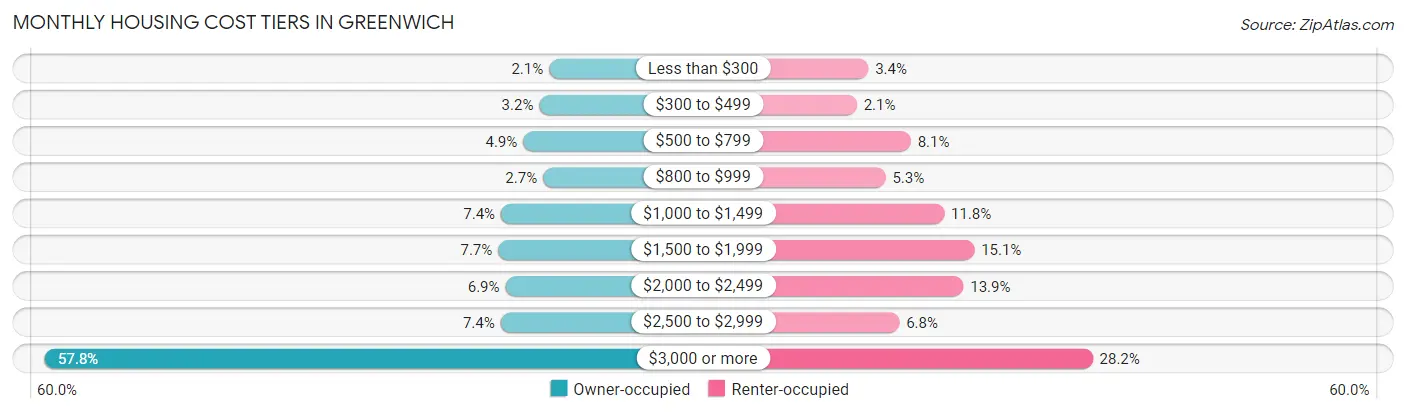
| Monthly Cost | Owner-occupied | Renter-occupied |
| Less than $300 | 59 (2.1%) | 94 (3.4%) |
| $300 to $499 | 90 (3.2%) | 59 (2.1%) |
| $500 to $799 | 141 (4.9%) | 224 (8.1%) |
| $800 to $999 | 78 (2.7%) | 147 (5.3%) |
| $1,000 to $1,499 | 211 (7.4%) | 326 (11.8%) |
| $1,500 to $1,999 | 220 (7.7%) | 418 (15.1%) |
| $2,000 to $2,499 | 197 (6.9%) | 385 (13.9%) |
| $2,500 to $2,999 | 212 (7.4%) | 189 (6.8%) |
| $3,000 or more | 1,651 (57.8%) | 780 (28.2%) |
| Total | 2,859 (100.0%) | 2,767 (100.0%) |
Physical Housing Characteristics in Greenwich
Housing Structures in Greenwich
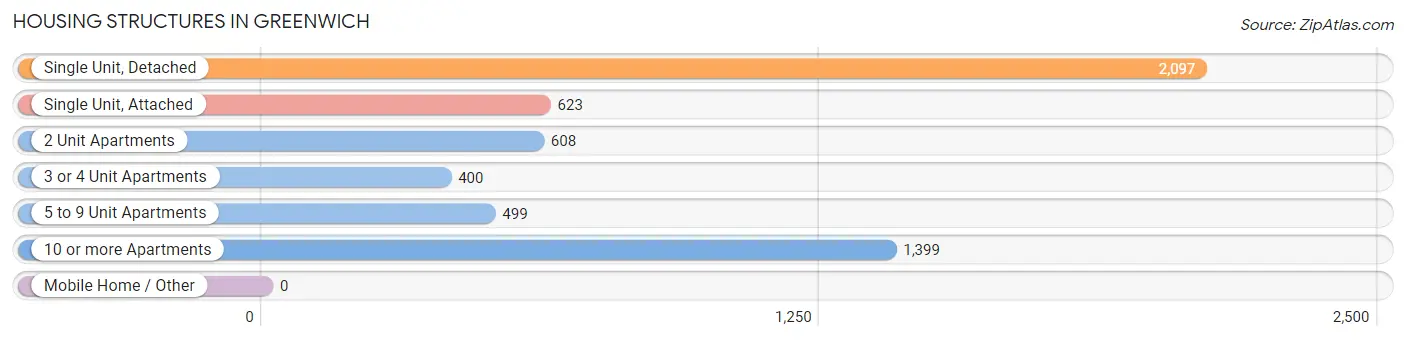
| Structure Type | # Housing Units | % Housing Units |
| Single Unit, Detached | 2,097 | 37.3% |
| Single Unit, Attached | 623 | 11.1% |
| 2 Unit Apartments | 608 | 10.8% |
| 3 or 4 Unit Apartments | 400 | 7.1% |
| 5 to 9 Unit Apartments | 499 | 8.9% |
| 10 or more Apartments | 1,399 | 24.9% |
| Mobile Home / Other | 0 | 0.0% |
| Total | 5,626 | 100.0% |
Housing Structures by Occupancy in Greenwich
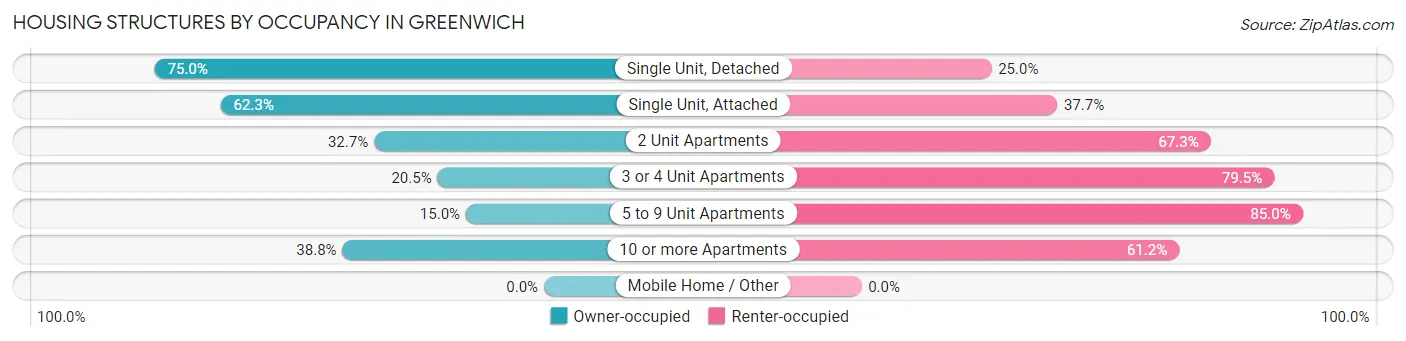
| Structure Type | Owner-occupied | Renter-occupied |
| Single Unit, Detached | 1,572 (75.0%) | 525 (25.0%) |
| Single Unit, Attached | 388 (62.3%) | 235 (37.7%) |
| 2 Unit Apartments | 199 (32.7%) | 409 (67.3%) |
| 3 or 4 Unit Apartments | 82 (20.5%) | 318 (79.5%) |
| 5 to 9 Unit Apartments | 75 (15.0%) | 424 (85.0%) |
| 10 or more Apartments | 543 (38.8%) | 856 (61.2%) |
| Mobile Home / Other | 0 (0.0%) | 0 (0.0%) |
| Total | 2,859 (50.8%) | 2,767 (49.2%) |
Housing Structures by Number of Rooms in Greenwich
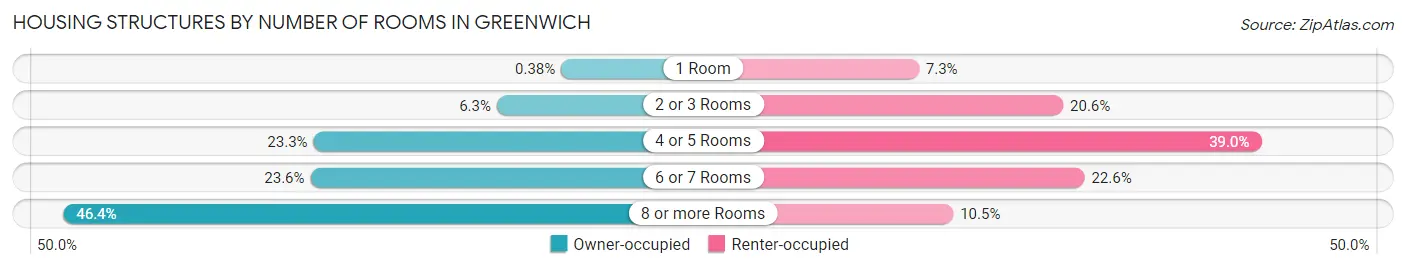
| Number of Rooms | Owner-occupied | Renter-occupied |
| 1 Room | 11 (0.4%) | 202 (7.3%) |
| 2 or 3 Rooms | 181 (6.3%) | 571 (20.6%) |
| 4 or 5 Rooms | 666 (23.3%) | 1,078 (39.0%) |
| 6 or 7 Rooms | 674 (23.6%) | 626 (22.6%) |
| 8 or more Rooms | 1,327 (46.4%) | 290 (10.5%) |
| Total | 2,859 (100.0%) | 2,767 (100.0%) |
Housing Structure by Heating Type in Greenwich
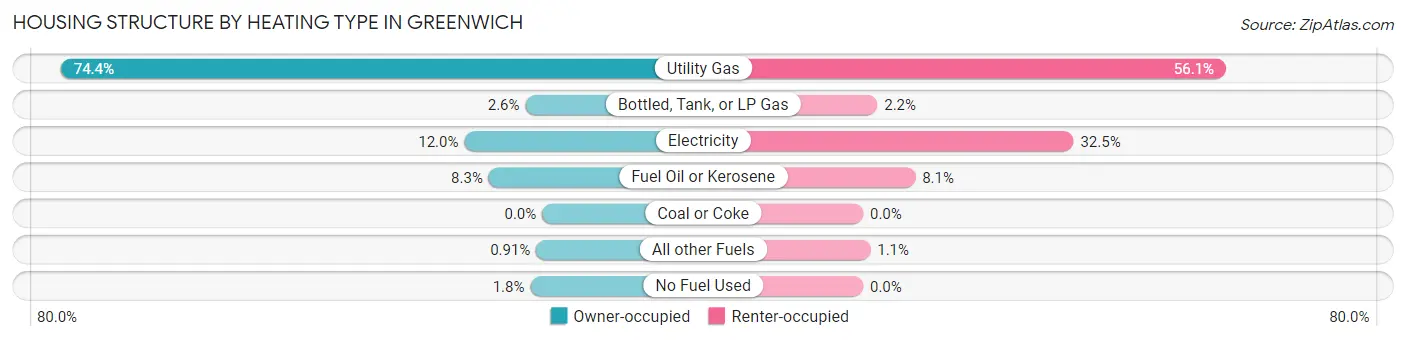
| Heating Type | Owner-occupied | Renter-occupied |
| Utility Gas | 2,127 (74.4%) | 1,552 (56.1%) |
| Bottled, Tank, or LP Gas | 74 (2.6%) | 61 (2.2%) |
| Electricity | 344 (12.0%) | 900 (32.5%) |
| Fuel Oil or Kerosene | 236 (8.3%) | 223 (8.1%) |
| Coal or Coke | 0 (0.0%) | 0 (0.0%) |
| All other Fuels | 26 (0.9%) | 31 (1.1%) |
| No Fuel Used | 52 (1.8%) | 0 (0.0%) |
| Total | 2,859 (100.0%) | 2,767 (100.0%) |
Household Vehicle Usage in Greenwich
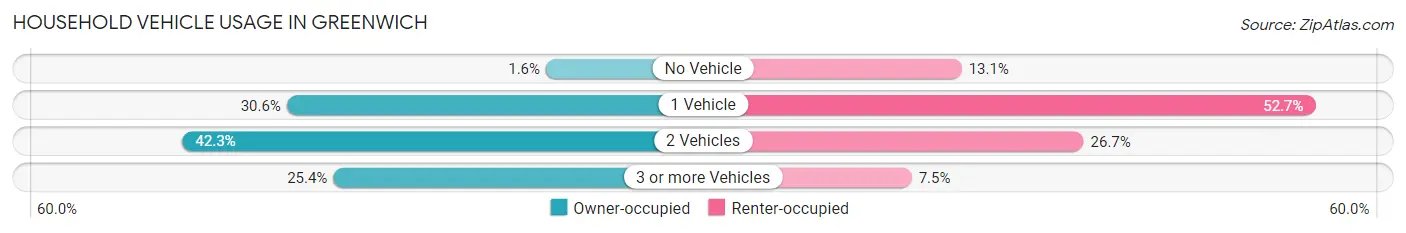
| Vehicles per Household | Owner-occupied | Renter-occupied |
| No Vehicle | 46 (1.6%) | 362 (13.1%) |
| 1 Vehicle | 876 (30.6%) | 1,458 (52.7%) |
| 2 Vehicles | 1,210 (42.3%) | 740 (26.7%) |
| 3 or more Vehicles | 727 (25.4%) | 207 (7.5%) |
| Total | 2,859 (100.0%) | 2,767 (100.0%) |
Real Estate & Mortgages in Greenwich
Real Estate and Mortgage Overview in Greenwich
| Characteristic | Without Mortgage | With Mortgage |
| Housing Units | 1,239 | 1,620 |
| Median Property Value | $1,217,100 | $1,636,200 |
| Median Household Income | $149,290 | $1,102 |
| Monthly Housing Costs | $1,501 | $1,279 |
| Real Estate Taxes | $10,001 | $40 |
Property Value by Mortgage Status in Greenwich
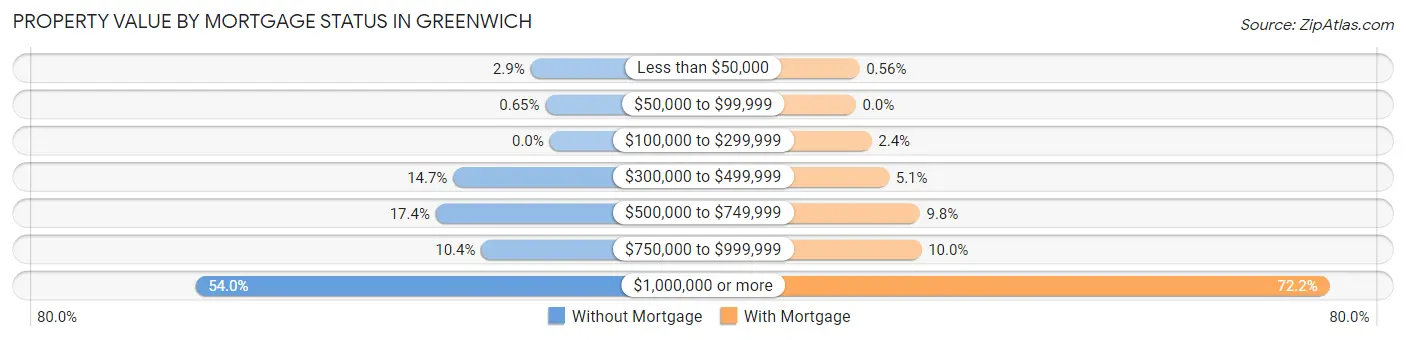
| Property Value | Without Mortgage | With Mortgage |
| Less than $50,000 | 36 (2.9%) | 9 (0.6%) |
| $50,000 to $99,999 | 8 (0.6%) | 0 (0.0%) |
| $100,000 to $299,999 | 0 (0.0%) | 39 (2.4%) |
| $300,000 to $499,999 | 182 (14.7%) | 82 (5.1%) |
| $500,000 to $749,999 | 215 (17.3%) | 158 (9.8%) |
| $750,000 to $999,999 | 129 (10.4%) | 162 (10.0%) |
| $1,000,000 or more | 669 (54.0%) | 1,170 (72.2%) |
| Total | 1,239 (100.0%) | 1,620 (100.0%) |
Household Income by Mortgage Status in Greenwich
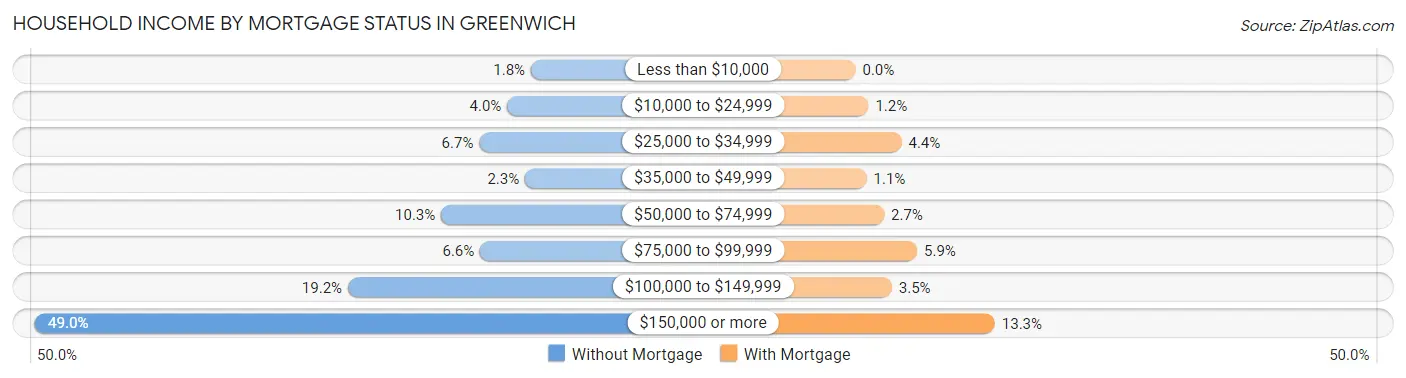
| Household Income | Without Mortgage | With Mortgage |
| Less than $10,000 | 22 (1.8%) | 0 (0.0%) |
| $10,000 to $24,999 | 50 (4.0%) | 20 (1.2%) |
| $25,000 to $34,999 | 83 (6.7%) | 71 (4.4%) |
| $35,000 to $49,999 | 29 (2.3%) | 17 (1.1%) |
| $50,000 to $74,999 | 128 (10.3%) | 44 (2.7%) |
| $75,000 to $99,999 | 82 (6.6%) | 95 (5.9%) |
| $100,000 to $149,999 | 238 (19.2%) | 56 (3.5%) |
| $150,000 or more | 607 (49.0%) | 215 (13.3%) |
| Total | 1,239 (100.0%) | 1,620 (100.0%) |
Property Value to Household Income Ratio in Greenwich
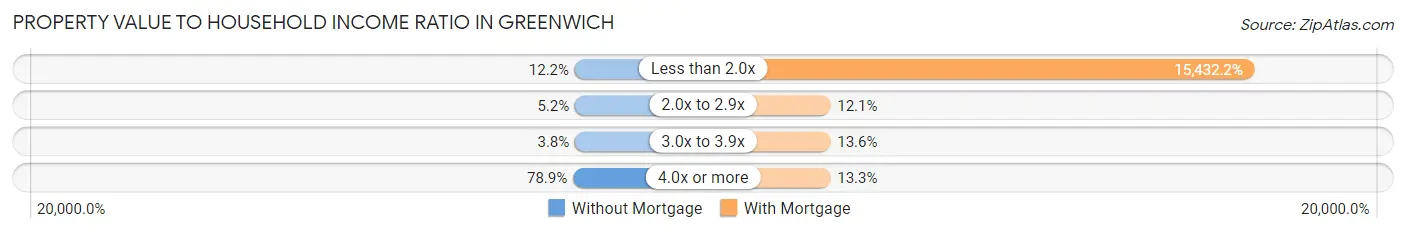
| Value-to-Income Ratio | Without Mortgage | With Mortgage |
| Less than 2.0x | 151 (12.2%) | 250,001 (15,432.2%) |
| 2.0x to 2.9x | 64 (5.2%) | 196 (12.1%) |
| 3.0x to 3.9x | 47 (3.8%) | 221 (13.6%) |
| 4.0x or more | 977 (78.8%) | 215 (13.3%) |
| Total | 1,239 (100.0%) | 1,620 (100.0%) |
Real Estate Taxes by Mortgage Status in Greenwich
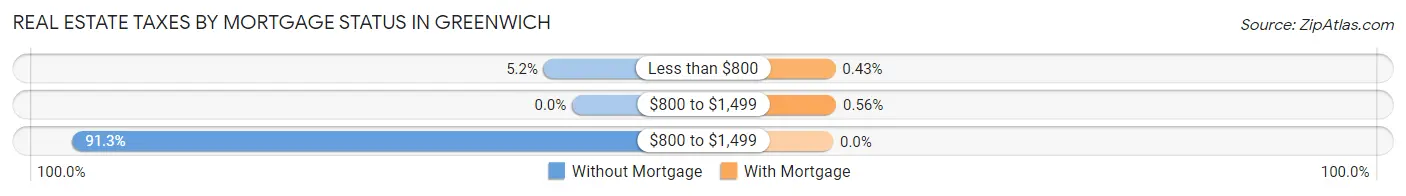
| Property Taxes | Without Mortgage | With Mortgage |
| Less than $800 | 64 (5.2%) | 7 (0.4%) |
| $800 to $1,499 | 0 (0.0%) | 9 (0.6%) |
| $800 to $1,499 | 1,131 (91.3%) | 0 (0.0%) |
| Total | 1,239 (100.0%) | 1,620 (100.0%) |
Health & Disability in Greenwich
Health Insurance Coverage by Age in Greenwich
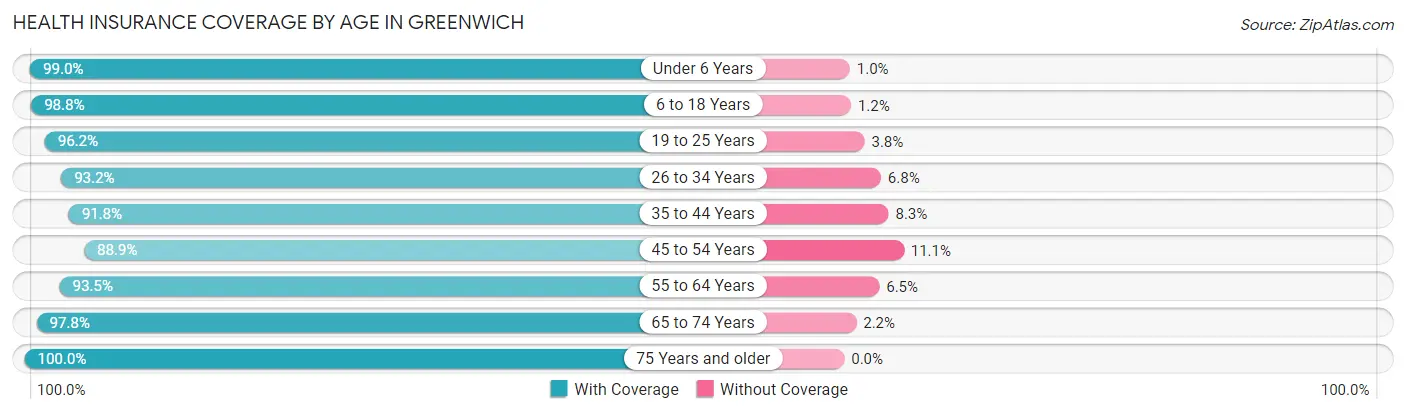
| Age Bracket | With Coverage | Without Coverage |
| Under 6 Years | 858 (99.0%) | 9 (1.0%) |
| 6 to 18 Years | 2,478 (98.8%) | 31 (1.2%) |
| 19 to 25 Years | 790 (96.2%) | 31 (3.8%) |
| 26 to 34 Years | 1,173 (93.2%) | 86 (6.8%) |
| 35 to 44 Years | 1,490 (91.7%) | 134 (8.3%) |
| 45 to 54 Years | 1,827 (88.9%) | 228 (11.1%) |
| 55 to 64 Years | 2,060 (93.5%) | 144 (6.5%) |
| 65 to 74 Years | 1,537 (97.8%) | 35 (2.2%) |
| 75 Years and older | 1,124 (100.0%) | 0 (0.0%) |
| Total | 13,337 (95.0%) | 698 (5.0%) |
Health Insurance Coverage by Citizenship Status in Greenwich
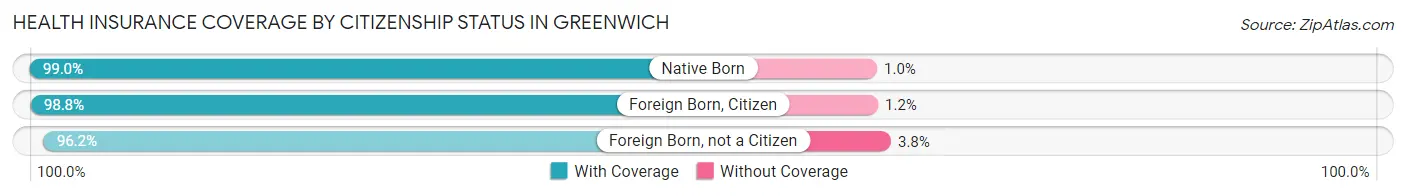
| Citizenship Status | With Coverage | Without Coverage |
| Native Born | 858 (99.0%) | 9 (1.0%) |
| Foreign Born, Citizen | 2,478 (98.8%) | 31 (1.2%) |
| Foreign Born, not a Citizen | 790 (96.2%) | 31 (3.8%) |
Health Insurance Coverage by Household Income in Greenwich
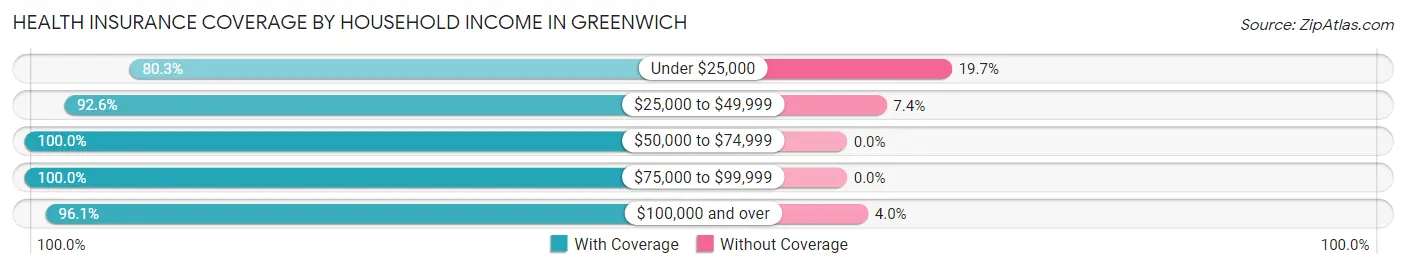
| Household Income | With Coverage | Without Coverage |
| Under $25,000 | 932 (80.3%) | 228 (19.7%) |
| $25,000 to $49,999 | 1,123 (92.6%) | 90 (7.4%) |
| $50,000 to $74,999 | 993 (100.0%) | 0 (0.0%) |
| $75,000 to $99,999 | 906 (100.0%) | 0 (0.0%) |
| $100,000 and over | 9,245 (96.1%) | 380 (4.0%) |
Public vs Private Health Insurance Coverage by Age in Greenwich
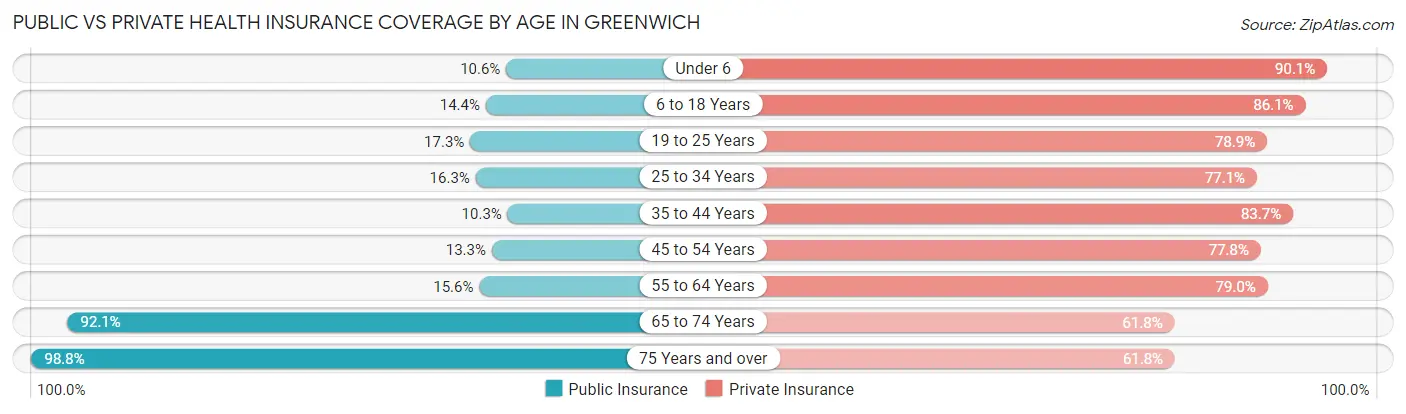
| Age Bracket | Public Insurance | Private Insurance |
| Under 6 | 92 (10.6%) | 781 (90.1%) |
| 6 to 18 Years | 361 (14.4%) | 2,159 (86.1%) |
| 19 to 25 Years | 142 (17.3%) | 648 (78.9%) |
| 25 to 34 Years | 205 (16.3%) | 970 (77.0%) |
| 35 to 44 Years | 168 (10.3%) | 1,360 (83.7%) |
| 45 to 54 Years | 273 (13.3%) | 1,598 (77.8%) |
| 55 to 64 Years | 344 (15.6%) | 1,742 (79.0%) |
| 65 to 74 Years | 1,447 (92.0%) | 971 (61.8%) |
| 75 Years and over | 1,110 (98.8%) | 695 (61.8%) |
| Total | 4,142 (29.5%) | 10,924 (77.8%) |
Disability Status by Sex by Age in Greenwich
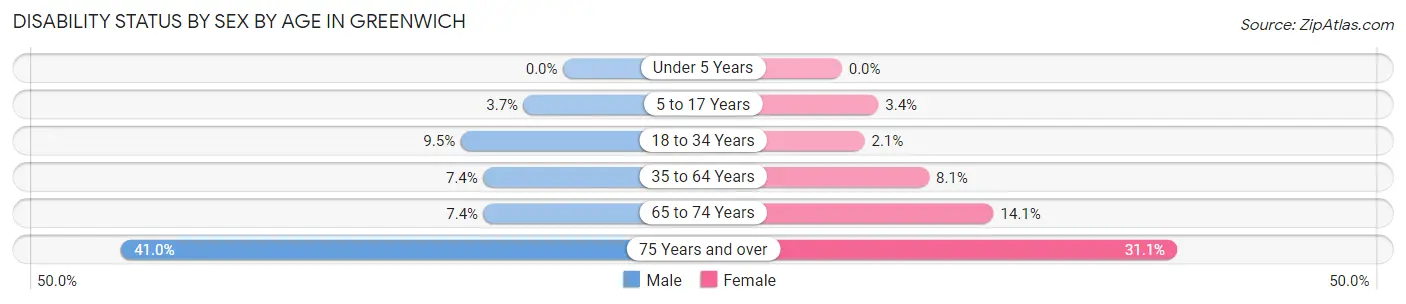
| Age Bracket | Male | Female |
| Under 5 Years | 0 (0.0%) | 0 (0.0%) |
| 5 to 17 Years | 38 (3.7%) | 48 (3.4%) |
| 18 to 34 Years | 122 (9.5%) | 20 (2.1%) |
| 35 to 64 Years | 196 (7.4%) | 262 (8.1%) |
| 65 to 74 Years | 50 (7.4%) | 126 (14.1%) |
| 75 Years and over | 167 (41.0%) | 223 (31.1%) |
Disability Class by Sex by Age in Greenwich
Disability Class: Hearing Difficulty
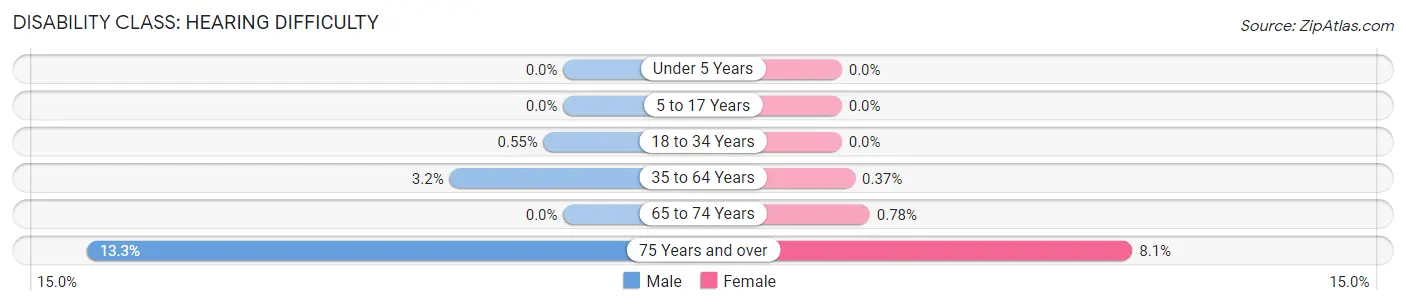
| Age Bracket | Male | Female |
| Under 5 Years | 0 (0.0%) | 0 (0.0%) |
| 5 to 17 Years | 0 (0.0%) | 0 (0.0%) |
| 18 to 34 Years | 7 (0.5%) | 0 (0.0%) |
| 35 to 64 Years | 84 (3.2%) | 12 (0.4%) |
| 65 to 74 Years | 0 (0.0%) | 7 (0.8%) |
| 75 Years and over | 54 (13.3%) | 58 (8.1%) |
Disability Class: Vision Difficulty
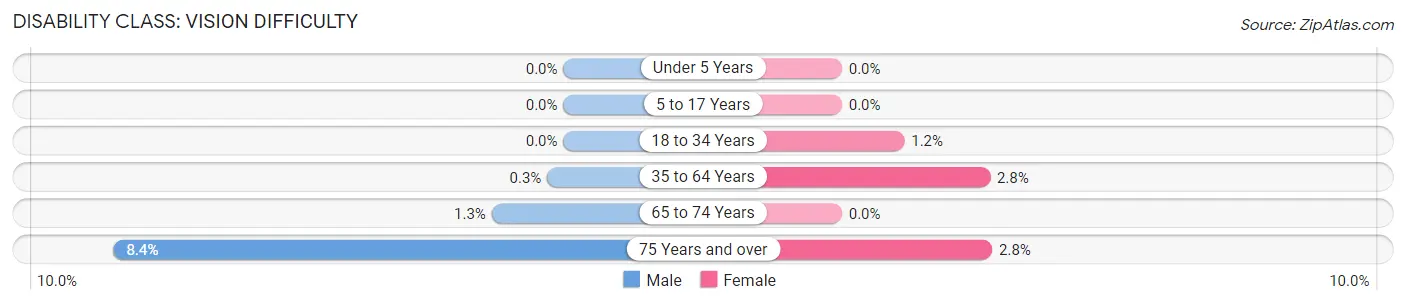
| Age Bracket | Male | Female |
| Under 5 Years | 0 (0.0%) | 0 (0.0%) |
| 5 to 17 Years | 0 (0.0%) | 0 (0.0%) |
| 18 to 34 Years | 0 (0.0%) | 11 (1.2%) |
| 35 to 64 Years | 8 (0.3%) | 89 (2.8%) |
| 65 to 74 Years | 9 (1.3%) | 0 (0.0%) |
| 75 Years and over | 34 (8.4%) | 20 (2.8%) |
Disability Class: Cognitive Difficulty
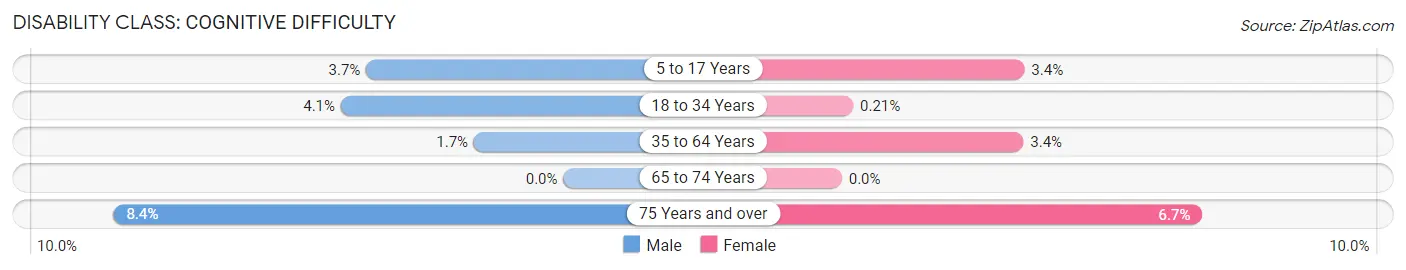
| Age Bracket | Male | Female |
| 5 to 17 Years | 38 (3.7%) | 48 (3.4%) |
| 18 to 34 Years | 53 (4.1%) | 2 (0.2%) |
| 35 to 64 Years | 44 (1.7%) | 109 (3.4%) |
| 65 to 74 Years | 0 (0.0%) | 0 (0.0%) |
| 75 Years and over | 34 (8.4%) | 48 (6.7%) |
Disability Class: Ambulatory Difficulty
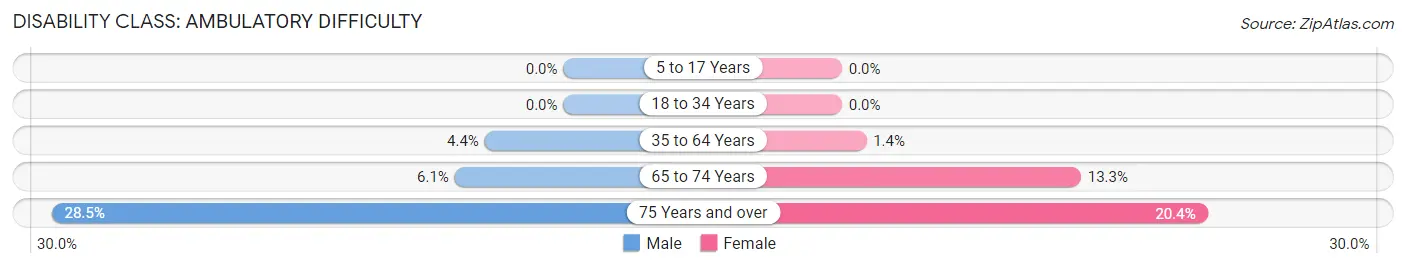
| Age Bracket | Male | Female |
| 5 to 17 Years | 0 (0.0%) | 0 (0.0%) |
| 18 to 34 Years | 0 (0.0%) | 0 (0.0%) |
| 35 to 64 Years | 116 (4.4%) | 44 (1.4%) |
| 65 to 74 Years | 41 (6.0%) | 119 (13.3%) |
| 75 Years and over | 116 (28.5%) | 146 (20.4%) |
Disability Class: Self-Care Difficulty
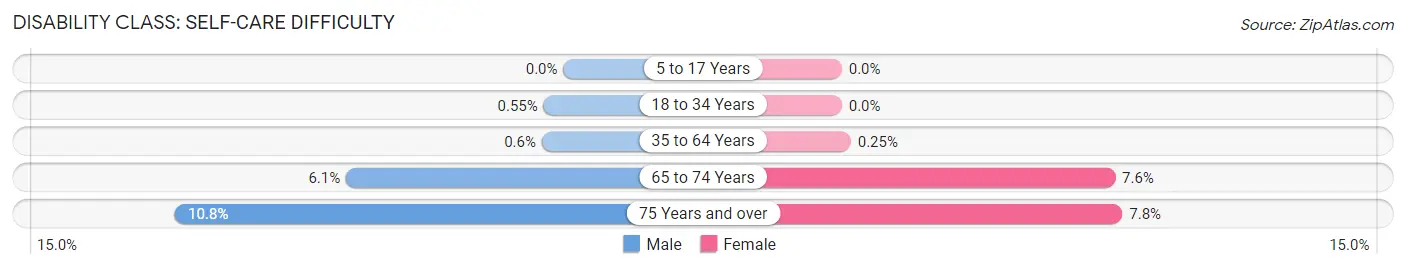
| Age Bracket | Male | Female |
| 5 to 17 Years | 0 (0.0%) | 0 (0.0%) |
| 18 to 34 Years | 7 (0.5%) | 0 (0.0%) |
| 35 to 64 Years | 16 (0.6%) | 8 (0.3%) |
| 65 to 74 Years | 41 (6.0%) | 68 (7.6%) |
| 75 Years and over | 44 (10.8%) | 56 (7.8%) |
Technology Access in Greenwich
Computing Device Access in Greenwich
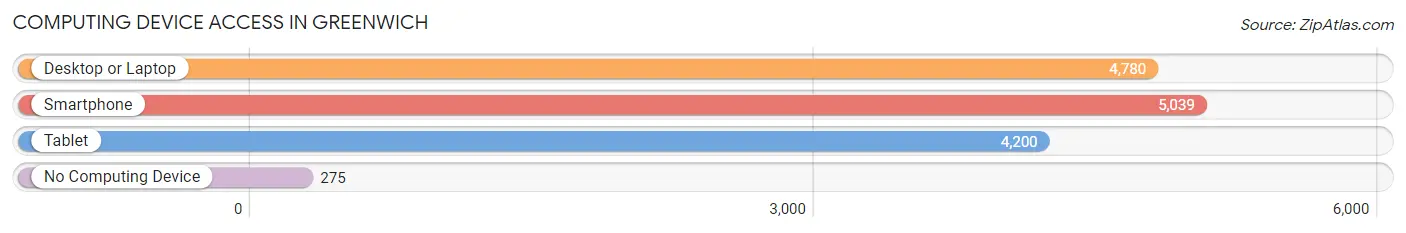
| Device Type | # Households | % Households |
| Desktop or Laptop | 4,780 | 85.0% |
| Smartphone | 5,039 | 89.6% |
| Tablet | 4,200 | 74.7% |
| No Computing Device | 275 | 4.9% |
| Total | 5,626 | 100.0% |
Internet Access in Greenwich
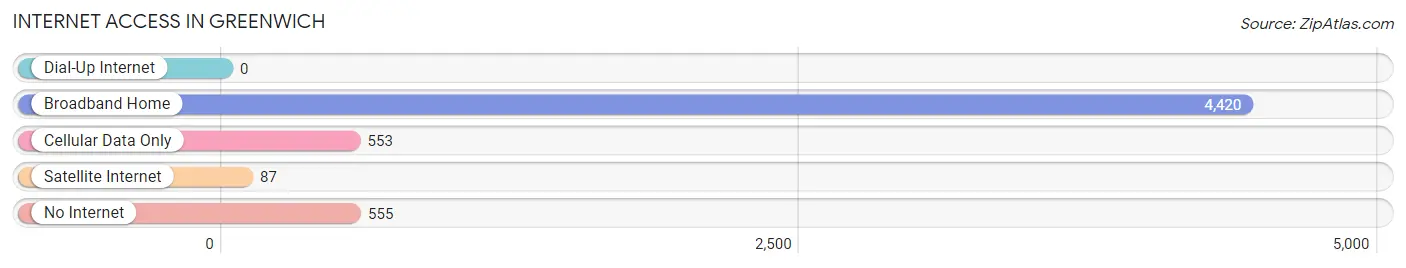
| Internet Type | # Households | % Households |
| Dial-Up Internet | 0 | 0.0% |
| Broadband Home | 4,420 | 78.6% |
| Cellular Data Only | 553 | 9.8% |
| Satellite Internet | 87 | 1.5% |
| No Internet | 555 | 9.9% |
| Total | 5,626 | 100.0% |
Greenwich Summary
Greenwich, Connecticut is a town located in Fairfield County, Connecticut, United States. It is situated on the Long Island Sound, just east of New York City. It is the largest town in Fairfield County and the 10th largest municipality in Connecticut. Greenwich is home to many affluent neighborhoods and is considered one of the most affluent towns in the United States.
History
Greenwich was first settled in 1640 by English settlers from the New Haven Colony. The town was named after Greenwich, England, and was incorporated in 1665. During the American Revolution, the town was a center of activity, with many privateers operating out of the harbor. After the war, Greenwich became a popular summer resort for wealthy New Yorkers.
Geography
Greenwich is located in southwestern Connecticut, on the Long Island Sound. It is bordered by Stamford to the north, New Canaan to the east, and Port Chester, New York to the south. The town covers an area of approximately 67 square miles, with a population of approximately 62,000 people.
Economy
Greenwich is a major financial center, with many large financial institutions and hedge funds located in the town. It is also home to many large corporations, including the world headquarters of the hedge fund Bridgewater Associates. The town is also home to many wealthy individuals, and is considered one of the wealthiest towns in the United States.
Demographics
As of the 2010 census, the population of Greenwich was 62,000. The racial makeup of the town was 87.2% White, 4.3% African American, 0.2% Native American, 4.7% Asian, and 3.6% from other races. The median household income was $150,000, and the median family income was $200,000.
Conclusion
Greenwich, Connecticut is a town located in Fairfield County, Connecticut, United States. It is situated on the Long Island Sound, just east of New York City. It is the largest town in Fairfield County and the 10th largest municipality in Connecticut. Greenwich is home to many affluent neighborhoods and is considered one of the most affluent towns in the United States. The town is a major financial center, with many large financial institutions and hedge funds located in the town. The population of Greenwich is 62,000, with a median household income of $150,000 and a median family income of $200,000.
Common Questions
What is Per Capita Income in Greenwich?
Per Capita income in Greenwich is $112,136.
What is the Median Family Income in Greenwich?
Median Family Income in Greenwich is $161,888.
What is the Median Household income in Greenwich?
Median Household Income in Greenwich is $128,839.
What is Income or Wage Gap in Greenwich?
Income or Wage Gap in Greenwich is 63.1%.
Women in Greenwich earn 36.9 cents for every dollar earned by a man.
What is Inequality or Gini Index in Greenwich?
Inequality or Gini Index in Greenwich is 0.60.
What is the Total Population of Greenwich?
Total Population of Greenwich is 14,051.
What is the Total Male Population of Greenwich?
Total Male Population of Greenwich is 6,487.
What is the Total Female Population of Greenwich?
Total Female Population of Greenwich is 7,564.
What is the Ratio of Males per 100 Females in Greenwich?
There are 85.76 Males per 100 Females in Greenwich.
What is the Ratio of Females per 100 Males in Greenwich?
There are 116.60 Females per 100 Males in Greenwich.
What is the Median Population Age in Greenwich?
Median Population Age in Greenwich is 44.4 Years.
What is the Average Family Size in Greenwich
Average Family Size in Greenwich is 3.1 People.
What is the Average Household Size in Greenwich
Average Household Size in Greenwich is 2.5 People.
How Large is the Labor Force in Greenwich?
There are 6,845 People in the Labor Forcein in Greenwich.
What is the Percentage of People in the Labor Force in Greenwich?
61.2% of People are in the Labor Force in Greenwich.
What is the Unemployment Rate in Greenwich?
Unemployment Rate in Greenwich is 8.1%.