Collinsville, CT Map & Demographics
Collinsville Map
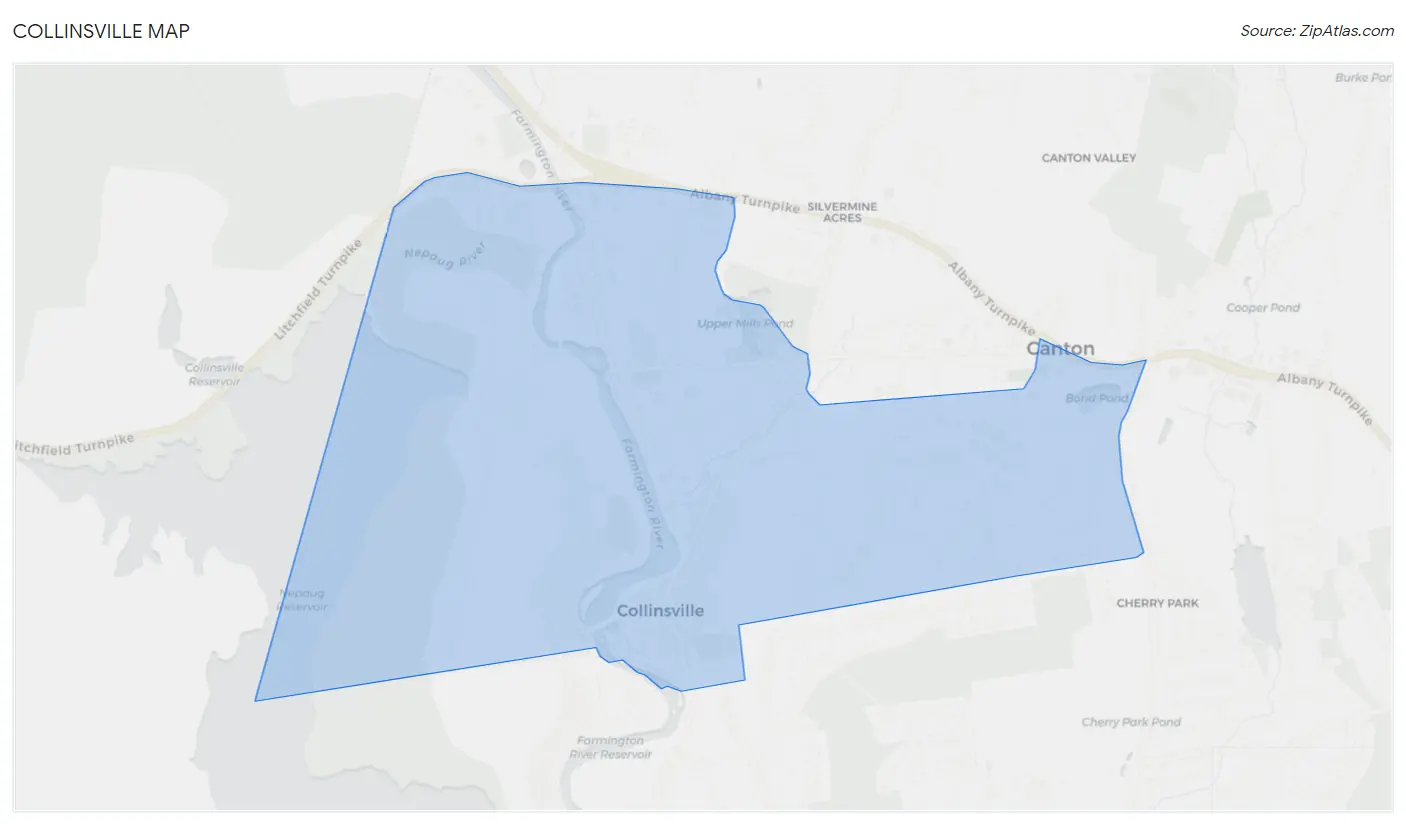
Collinsville Overview
$71,983
PER CAPITA INCOME
$191,250
AVG FAMILY INCOME
$101,336
AVG HOUSEHOLD INCOME
20.6%
WAGE / INCOME GAP [ % ]
79.4¢/ $1
WAGE / INCOME GAP [ $ ]
0.52
INEQUALITY / GINI INDEX
3,750
TOTAL POPULATION
1,688
MALE POPULATION
2,062
FEMALE POPULATION
81.86
MALES / 100 FEMALES
122.16
FEMALES / 100 MALES
42.4
MEDIAN AGE
3.2
AVG FAMILY SIZE
2.3
AVG HOUSEHOLD SIZE
1,968
LABOR FORCE [ PEOPLE ]
64.3%
PERCENT IN LABOR FORCE
2.2%
UNEMPLOYMENT RATE
Collinsville Zip Codes
Collinsville Area Codes
Income in Collinsville
Income Overview in Collinsville
Per Capita Income in Collinsville is $71,983, while median incomes of families and households are $191,250 and $101,336 respectively.
| Characteristic | Number | Measure |
| Per Capita Income | 3,750 | $71,983 |
| Median Family Income | 829 | $191,250 |
| Mean Family Income | 829 | $264,586 |
| Median Household Income | 1,583 | $101,336 |
| Mean Household Income | 1,583 | $169,418 |
| Income Deficit | 829 | $0 |
| Wage / Income Gap (%) | 3,750 | 20.60% |
| Wage / Income Gap ($) | 3,750 | 79.40¢ per $1 |
| Gini / Inequality Index | 3,750 | 0.52 |
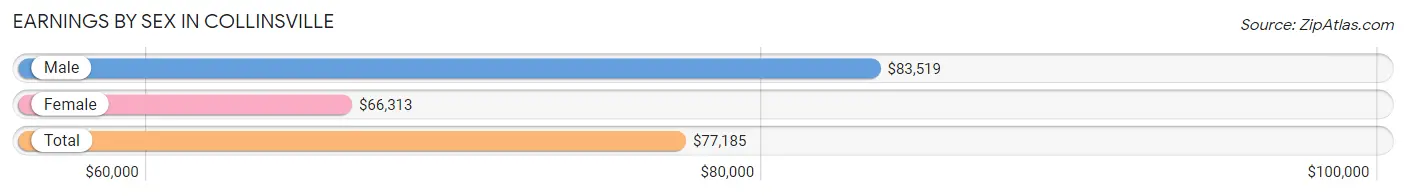
Earnings by Sex in Collinsville
Average Earnings in Collinsville are $77,185, $83,519 for men and $66,313 for women, a difference of 20.6%.
| Sex | Number | Average Earnings |
| Male | 986 (48.8%) | $83,519 |
| Female | 1,035 (51.2%) | $66,313 |
| Total | 2,021 (100.0%) | $77,185 |
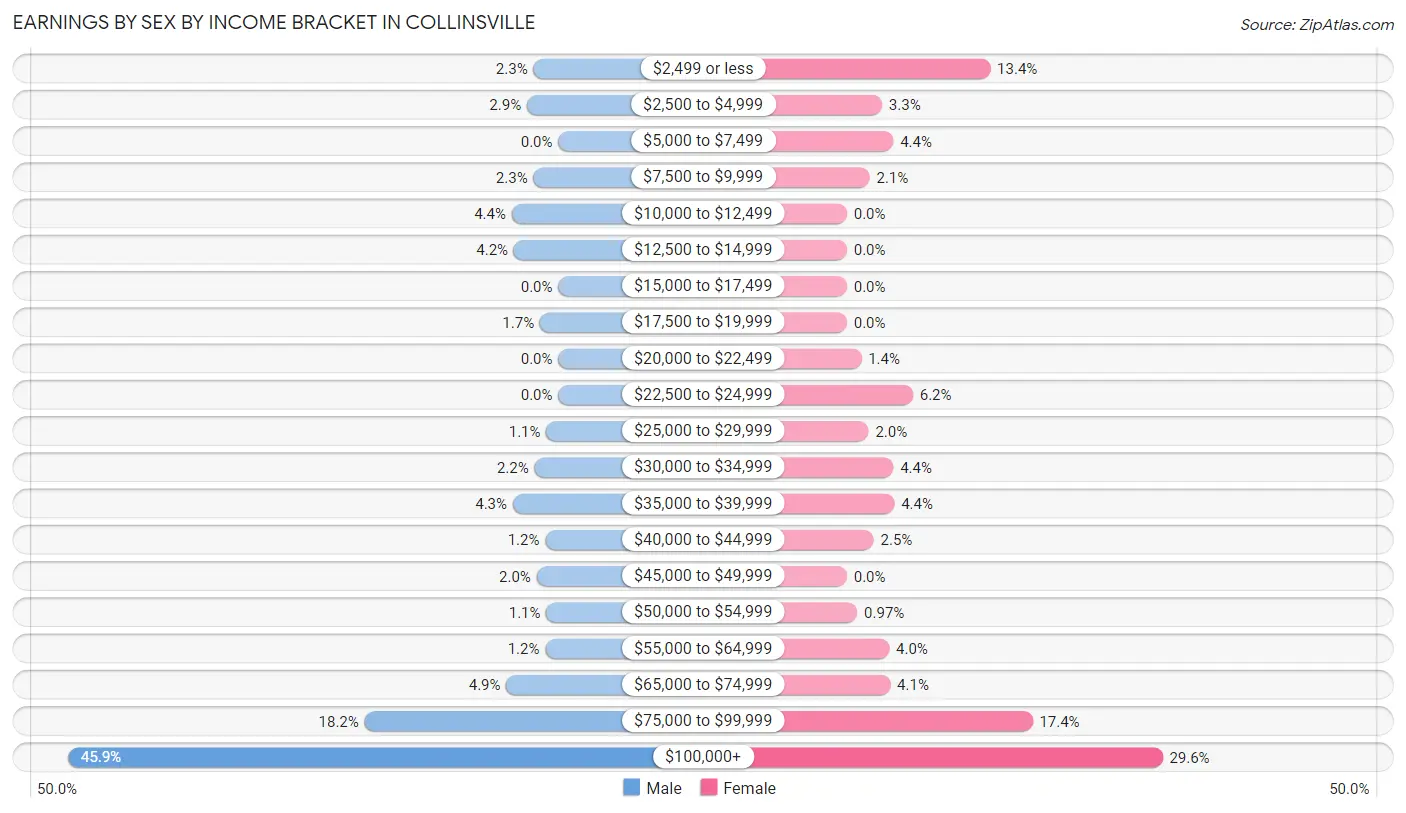
Earnings by Sex by Income Bracket in Collinsville
The most common earnings brackets in Collinsville are $100,000+ for men (453 | 45.9%) and $100,000+ for women (306 | 29.6%).
| Income | Male | Female |
| $2,499 or less | 23 (2.3%) | 139 (13.4%) |
| $2,500 to $4,999 | 29 (2.9%) | 34 (3.3%) |
| $5,000 to $7,499 | 0 (0.0%) | 45 (4.3%) |
| $7,500 to $9,999 | 23 (2.3%) | 22 (2.1%) |
| $10,000 to $12,499 | 43 (4.4%) | 0 (0.0%) |
| $12,500 to $14,999 | 41 (4.2%) | 0 (0.0%) |
| $15,000 to $17,499 | 0 (0.0%) | 0 (0.0%) |
| $17,500 to $19,999 | 17 (1.7%) | 0 (0.0%) |
| $20,000 to $22,499 | 0 (0.0%) | 14 (1.3%) |
| $22,500 to $24,999 | 0 (0.0%) | 64 (6.2%) |
| $25,000 to $29,999 | 11 (1.1%) | 21 (2.0%) |
| $30,000 to $34,999 | 22 (2.2%) | 45 (4.3%) |
| $35,000 to $39,999 | 42 (4.3%) | 46 (4.4%) |
| $40,000 to $44,999 | 12 (1.2%) | 26 (2.5%) |
| $45,000 to $49,999 | 20 (2.0%) | 0 (0.0%) |
| $50,000 to $54,999 | 11 (1.1%) | 10 (1.0%) |
| $55,000 to $64,999 | 12 (1.2%) | 41 (4.0%) |
| $65,000 to $74,999 | 48 (4.9%) | 42 (4.1%) |
| $75,000 to $99,999 | 179 (18.1%) | 180 (17.4%) |
| $100,000+ | 453 (45.9%) | 306 (29.6%) |
| Total | 986 (100.0%) | 1,035 (100.0%) |
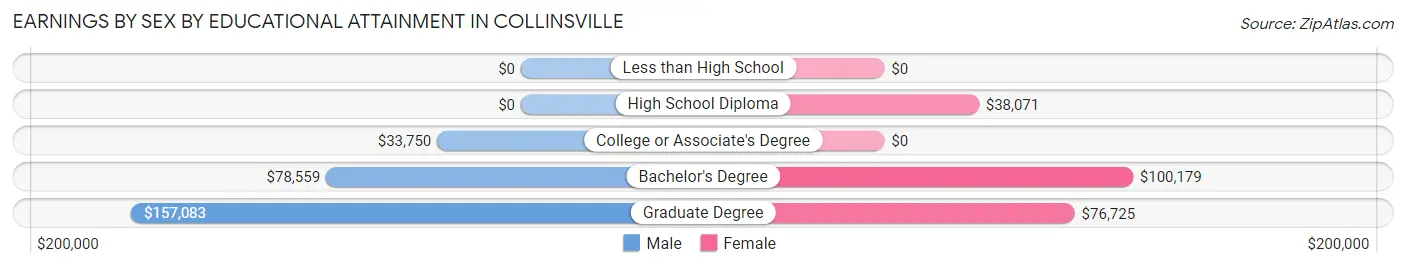
Earnings by Sex by Educational Attainment in Collinsville
Average earnings in Collinsville are $93,036 for men and $77,025 for women, a difference of 17.2%. Men with an educational attainment of graduate degree enjoy the highest average annual earnings of $157,083, while those with college or associate's degree education earn the least with $33,750. Women with an educational attainment of bachelor's degree earn the most with the average annual earnings of $100,179, while those with high school diploma education have the smallest earnings of $38,071.
| Educational Attainment | Male Income | Female Income |
| Less than High School | - | - |
| High School Diploma | - | - |
| College or Associate's Degree | $33,750 | $0 |
| Bachelor's Degree | $78,559 | $100,179 |
| Graduate Degree | $157,083 | $76,725 |
| Total | $93,036 | $77,025 |
Family Income in Collinsville
Family Income Brackets in Collinsville
According to the Collinsville family income data, there are 403 families falling into the $200,000+ income range, which is the most common income bracket and makes up 48.6% of all families.
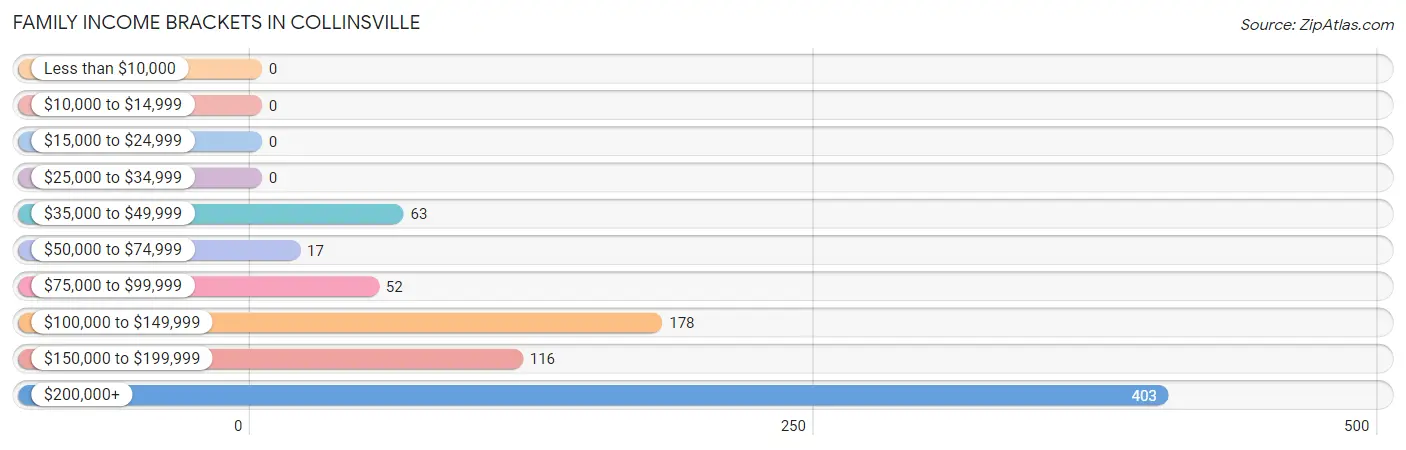
| Income Bracket | # Families | % Families |
| Less than $10,000 | 0 | 0.0% |
| $10,000 to $14,999 | 0 | 0.0% |
| $15,000 to $24,999 | 0 | 0.0% |
| $25,000 to $34,999 | 0 | 0.0% |
| $35,000 to $49,999 | 63 | 7.6% |
| $50,000 to $74,999 | 17 | 2.1% |
| $75,000 to $99,999 | 52 | 6.3% |
| $100,000 to $149,999 | 178 | 21.5% |
| $150,000 to $199,999 | 116 | 14.0% |
| $200,000+ | 403 | 48.6% |
Family Income by Famaliy Size in Collinsville
4-person families (290 | 35.0%) account for the highest median family income in Collinsville with $242,100 per family, while 2-person families (402 | 48.5%) have the highest median income of $74,350 per family member.
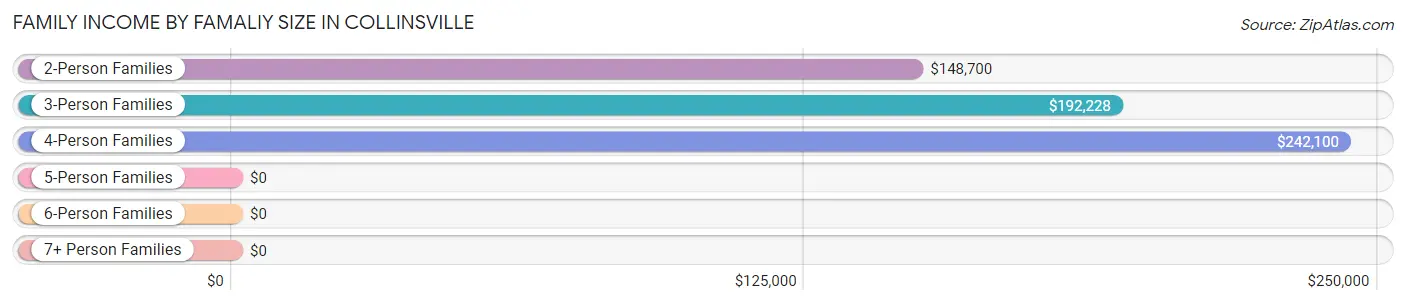
| Income Bracket | # Families | Median Income |
| 2-Person Families | 402 (48.5%) | $148,700 |
| 3-Person Families | 55 (6.6%) | $192,228 |
| 4-Person Families | 290 (35.0%) | $242,100 |
| 5-Person Families | 60 (7.2%) | $0 |
| 6-Person Families | 0 (0.0%) | $0 |
| 7+ Person Families | 22 (2.6%) | $0 |
| Total | 829 (100.0%) | $191,250 |
Family Income by Number of Earners in Collinsville
The median family income in Collinsville is $191,250, with families comprising 3+ earners (106) having the highest median family income of $250,001, while families with 1 earner (171) have the lowest median family income of $102,198, accounting for 12.8% and 20.6% of families, respectively.
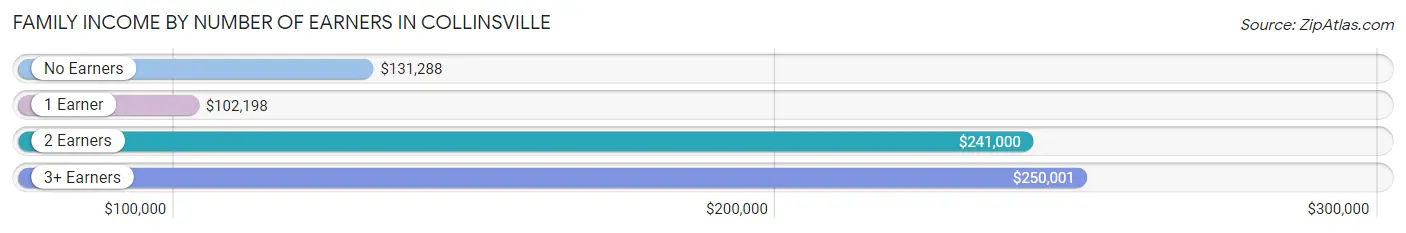
| Number of Earners | # Families | Median Income |
| No Earners | 62 (7.5%) | $131,288 |
| 1 Earner | 171 (20.6%) | $102,198 |
| 2 Earners | 490 (59.1%) | $241,000 |
| 3+ Earners | 106 (12.8%) | $250,001 |
| Total | 829 (100.0%) | $191,250 |
Household Income in Collinsville
Household Income Brackets in Collinsville
With 424 households falling in the category, the $200,000+ income range is the most frequent in Collinsville, accounting for 26.8% of all households. In contrast, only 13 households (0.8%) fall into the $10,000 to $14,999 income bracket, making it the least populous group.
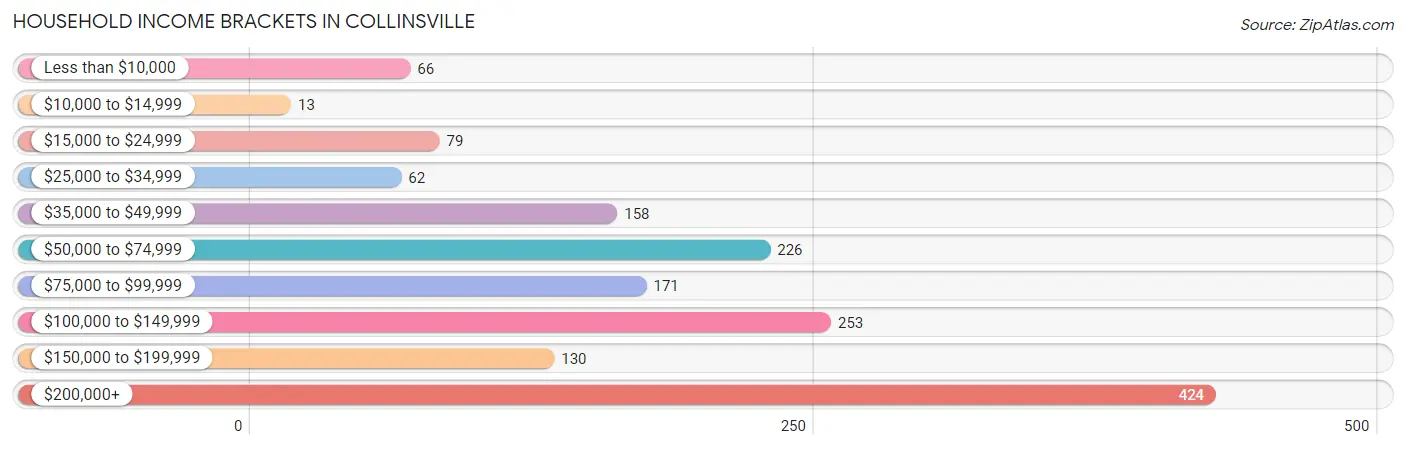
| Income Bracket | # Households | % Households |
| Less than $10,000 | 66 | 4.2% |
| $10,000 to $14,999 | 13 | 0.8% |
| $15,000 to $24,999 | 79 | 5.0% |
| $25,000 to $34,999 | 62 | 3.9% |
| $35,000 to $49,999 | 158 | 10.0% |
| $50,000 to $74,999 | 226 | 14.3% |
| $75,000 to $99,999 | 171 | 10.8% |
| $100,000 to $149,999 | 253 | 16.0% |
| $150,000 to $199,999 | 130 | 8.2% |
| $200,000+ | 424 | 26.8% |
Household Income by Householder Age in Collinsville
The median household income in Collinsville is $101,336, with the highest median household income of $184,821 found in the 45 to 64 years age bracket for the primary householder. A total of 548 households (34.6%) fall into this category. Meanwhile, the 15 to 24 years age bracket for the primary householder has the lowest median household income of $0, with 20 households (1.3%) in this group.
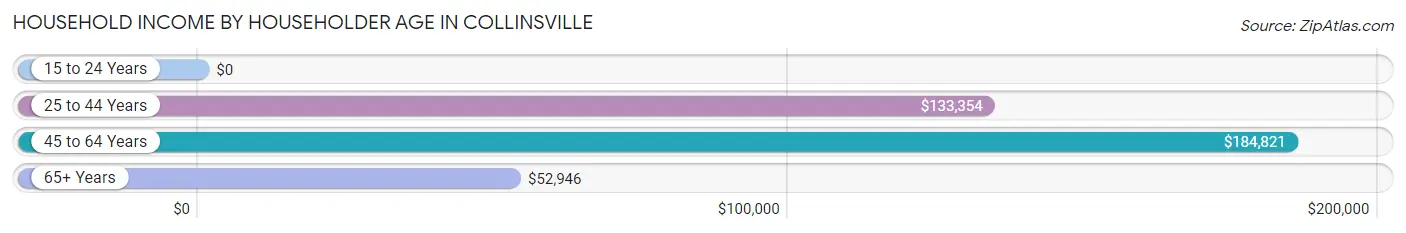
| Income Bracket | # Households | Median Income |
| 15 to 24 Years | 20 (1.3%) | $0 |
| 25 to 44 Years | 422 (26.7%) | $133,354 |
| 45 to 64 Years | 548 (34.6%) | $184,821 |
| 65+ Years | 593 (37.5%) | $52,946 |
| Total | 1,583 (100.0%) | $101,336 |
Poverty in Collinsville
Income Below Poverty by Sex and Age in Collinsville
With 2.3% poverty level for males and 7.0% for females among the residents of Collinsville, 65 to 74 year old males and 25 to 34 year old females are the most vulnerable to poverty, with 15 males (14.1%) and 71 females (25.6%) in their respective age groups living below the poverty level.
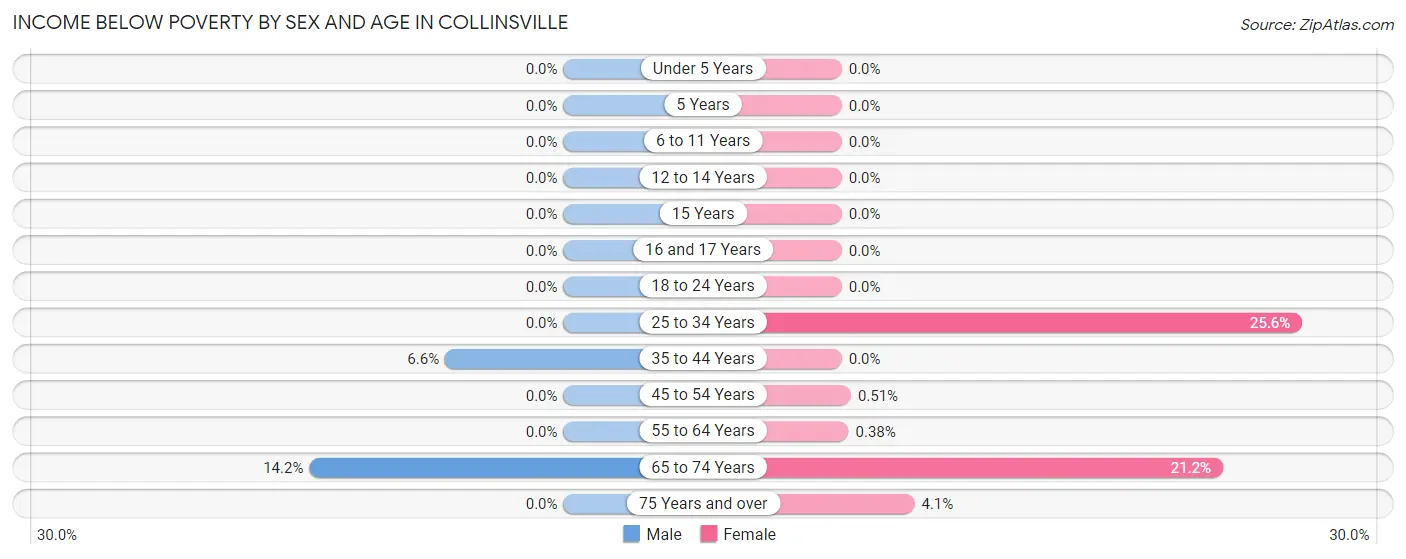
| Age Bracket | Male | Female |
| Under 5 Years | 0 (0.0%) | 0 (0.0%) |
| 5 Years | 0 (0.0%) | 0 (0.0%) |
| 6 to 11 Years | 0 (0.0%) | 0 (0.0%) |
| 12 to 14 Years | 0 (0.0%) | 0 (0.0%) |
| 15 Years | 0 (0.0%) | 0 (0.0%) |
| 16 and 17 Years | 0 (0.0%) | 0 (0.0%) |
| 18 to 24 Years | 0 (0.0%) | 0 (0.0%) |
| 25 to 34 Years | 0 (0.0%) | 71 (25.6%) |
| 35 to 44 Years | 23 (6.6%) | 0 (0.0%) |
| 45 to 54 Years | 0 (0.0%) | 1 (0.5%) |
| 55 to 64 Years | 0 (0.0%) | 1 (0.4%) |
| 65 to 74 Years | 15 (14.1%) | 52 (21.2%) |
| 75 Years and over | 0 (0.0%) | 13 (4.1%) |
| Total | 38 (2.3%) | 138 (7.0%) |
Income Above Poverty by Sex and Age in Collinsville
According to the poverty statistics in Collinsville, males aged under 5 years and females aged under 5 years are the age groups that are most secure financially, with 100.0% of males and 100.0% of females in these age groups living above the poverty line.
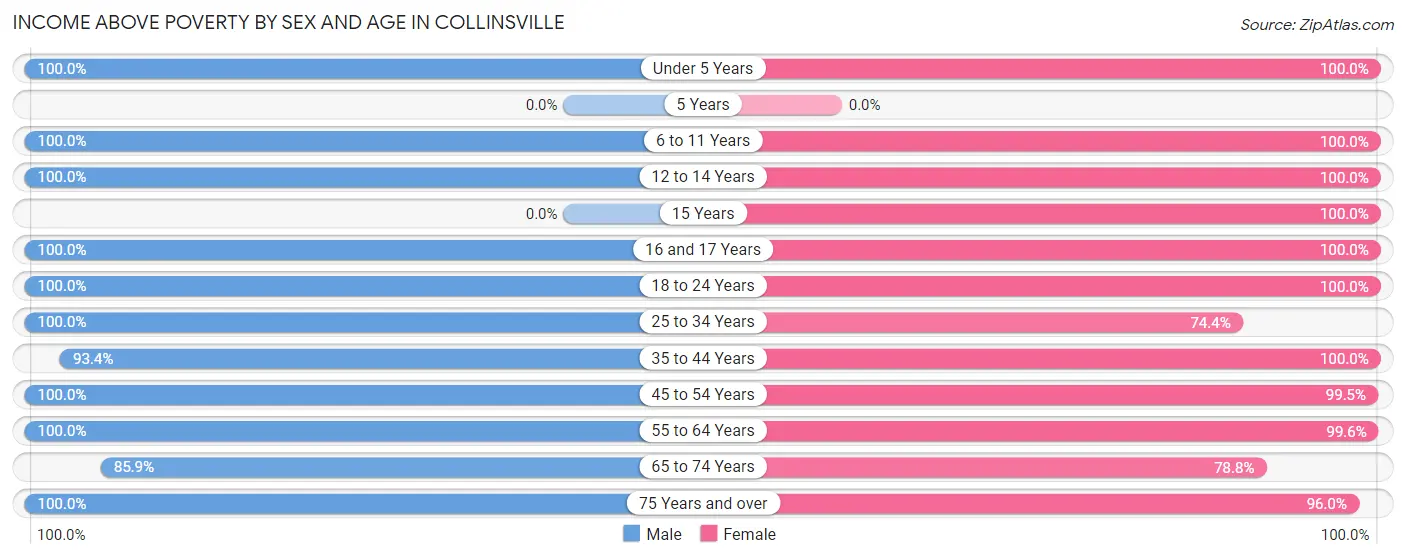
| Age Bracket | Male | Female |
| Under 5 Years | 110 (100.0%) | 93 (100.0%) |
| 5 Years | 0 (0.0%) | 0 (0.0%) |
| 6 to 11 Years | 122 (100.0%) | 125 (100.0%) |
| 12 to 14 Years | 130 (100.0%) | 54 (100.0%) |
| 15 Years | 0 (0.0%) | 25 (100.0%) |
| 16 and 17 Years | 62 (100.0%) | 94 (100.0%) |
| 18 to 24 Years | 77 (100.0%) | 84 (100.0%) |
| 25 to 34 Years | 90 (100.0%) | 206 (74.4%) |
| 35 to 44 Years | 326 (93.4%) | 194 (100.0%) |
| 45 to 54 Years | 139 (100.0%) | 194 (99.5%) |
| 55 to 64 Years | 375 (100.0%) | 264 (99.6%) |
| 65 to 74 Years | 91 (85.9%) | 193 (78.8%) |
| 75 Years and over | 89 (100.0%) | 308 (96.0%) |
| Total | 1,611 (97.7%) | 1,834 (93.0%) |
Income Below Poverty Among Married-Couple Families in Collinsville
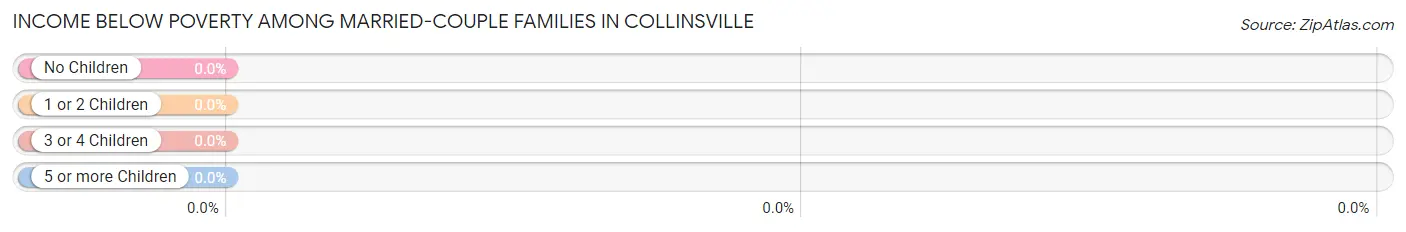
| Children | Above Poverty | Below Poverty |
| No Children | 440 (100.0%) | 0 (0.0%) |
| 1 or 2 Children | 258 (100.0%) | 0 (0.0%) |
| 3 or 4 Children | 47 (100.0%) | 0 (0.0%) |
| 5 or more Children | 0 (0.0%) | 0 (0.0%) |
| Total | 745 (100.0%) | 0 (0.0%) |
Income Below Poverty Among Single-Parent Households in Collinsville
| Children | Single Father | Single Mother |
| No Children | 0 (0.0%) | 0 (0.0%) |
| 1 or 2 Children | 0 (0.0%) | 0 (0.0%) |
| 3 or 4 Children | 0 (0.0%) | 0 (0.0%) |
| 5 or more Children | 0 (0.0%) | 0 (0.0%) |
| Total | 0 (0.0%) | 0 (0.0%) |
Income Below Poverty Among Married-Couple vs Single-Parent Households in Collinsville
| Children | Married-Couple Families | Single-Parent Households |
| No Children | 0 (0.0%) | 0 (0.0%) |
| 1 or 2 Children | 0 (0.0%) | 0 (0.0%) |
| 3 or 4 Children | 0 (0.0%) | 0 (0.0%) |
| 5 or more Children | 0 (0.0%) | 0 (0.0%) |
| Total | 0 (0.0%) | 0 (0.0%) |
Race in Collinsville
The most populous races in Collinsville are White / Caucasian (3,333 | 88.9%), Black / African American (166 | 4.4%), and Two or more Races (161 | 4.3%).
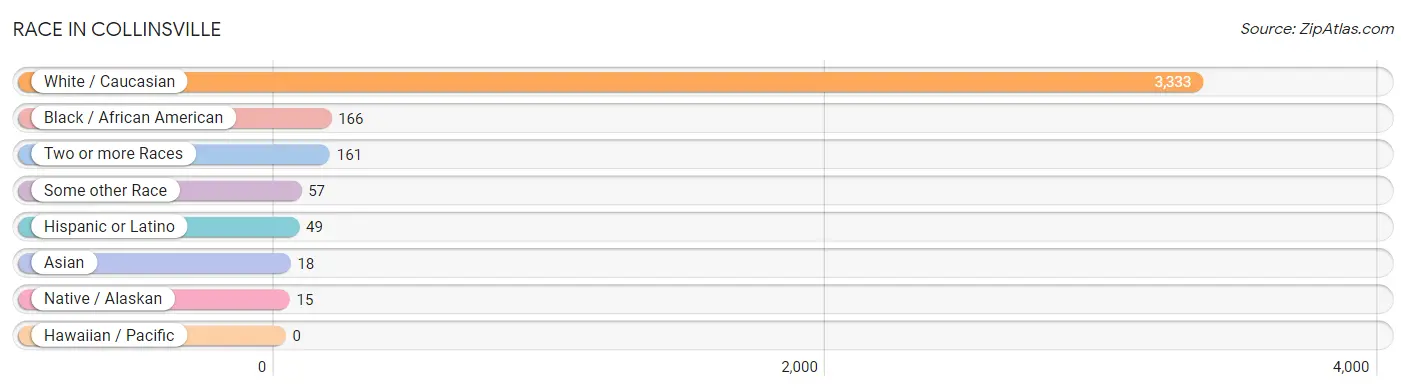
| Race | # Population | % Population |
| Asian | 18 | 0.5% |
| Black / African American | 166 | 4.4% |
| Hawaiian / Pacific | 0 | 0.0% |
| Hispanic or Latino | 49 | 1.3% |
| Native / Alaskan | 15 | 0.4% |
| White / Caucasian | 3,333 | 88.9% |
| Two or more Races | 161 | 4.3% |
| Some other Race | 57 | 1.5% |
| Total | 3,750 | 100.0% |
Ancestry in Collinsville
The most populous ancestries reported in Collinsville are Italian (780 | 20.8%), Irish (674 | 18.0%), English (671 | 17.9%), German (303 | 8.1%), and French (274 | 7.3%), together accounting for 72.0% of all Collinsville residents.
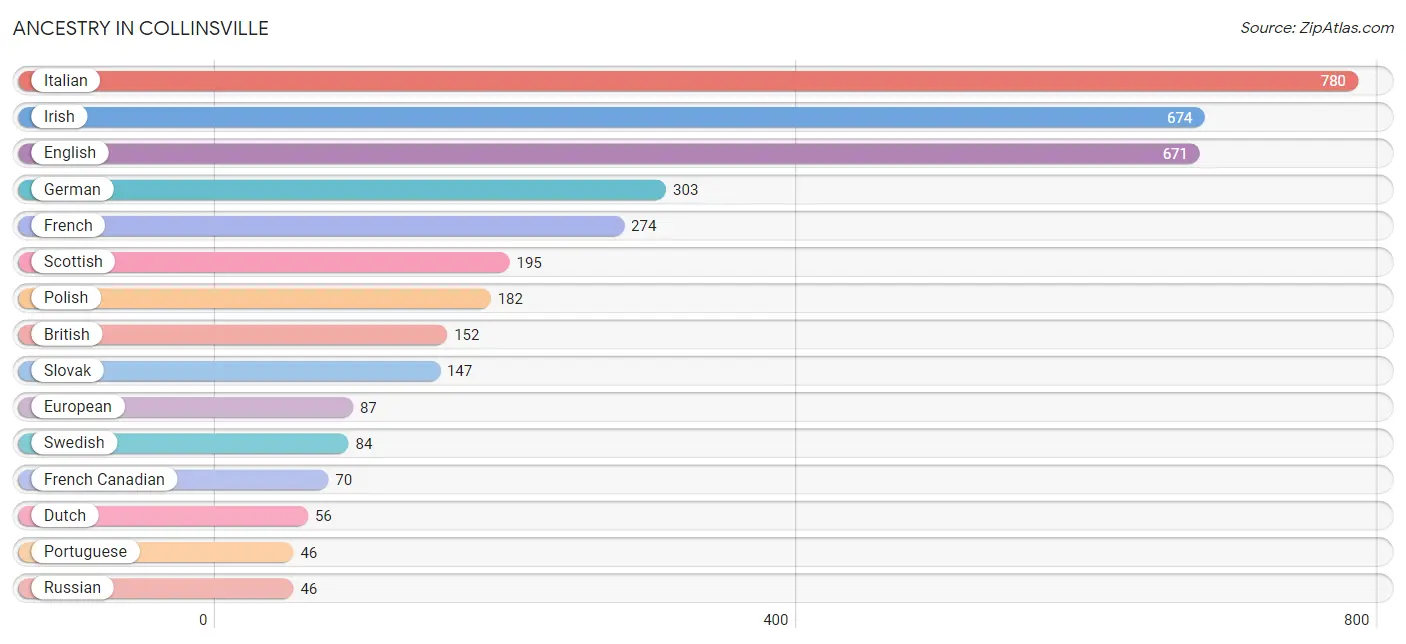
| Ancestry | # Population | % Population |
| American | 28 | 0.7% |
| British | 152 | 4.1% |
| Canadian | 22 | 0.6% |
| Cape Verdean | 26 | 0.7% |
| Croatian | 29 | 0.8% |
| Czech | 14 | 0.4% |
| Danish | 10 | 0.3% |
| Dutch | 56 | 1.5% |
| Eastern European | 14 | 0.4% |
| Ecuadorian | 14 | 0.4% |
| English | 671 | 17.9% |
| European | 87 | 2.3% |
| French | 274 | 7.3% |
| French Canadian | 70 | 1.9% |
| German | 303 | 8.1% |
| Greek | 15 | 0.4% |
| Hungarian | 23 | 0.6% |
| Indian (Asian) | 18 | 0.5% |
| Irish | 674 | 18.0% |
| Italian | 780 | 20.8% |
| Jamaican | 33 | 0.9% |
| Lithuanian | 24 | 0.6% |
| Lumbee | 15 | 0.4% |
| Polish | 182 | 4.9% |
| Portuguese | 46 | 1.2% |
| Puerto Rican | 7 | 0.2% |
| Russian | 46 | 1.2% |
| Scottish | 195 | 5.2% |
| Slovak | 147 | 3.9% |
| South American | 14 | 0.4% |
| Spanish | 28 | 0.7% |
| Subsaharan African | 26 | 0.7% |
| Swedish | 84 | 2.2% |
| Swiss | 24 | 0.6% |
| Welsh | 37 | 1.0% | View All 35 Rows |
Immigrants in Collinsville
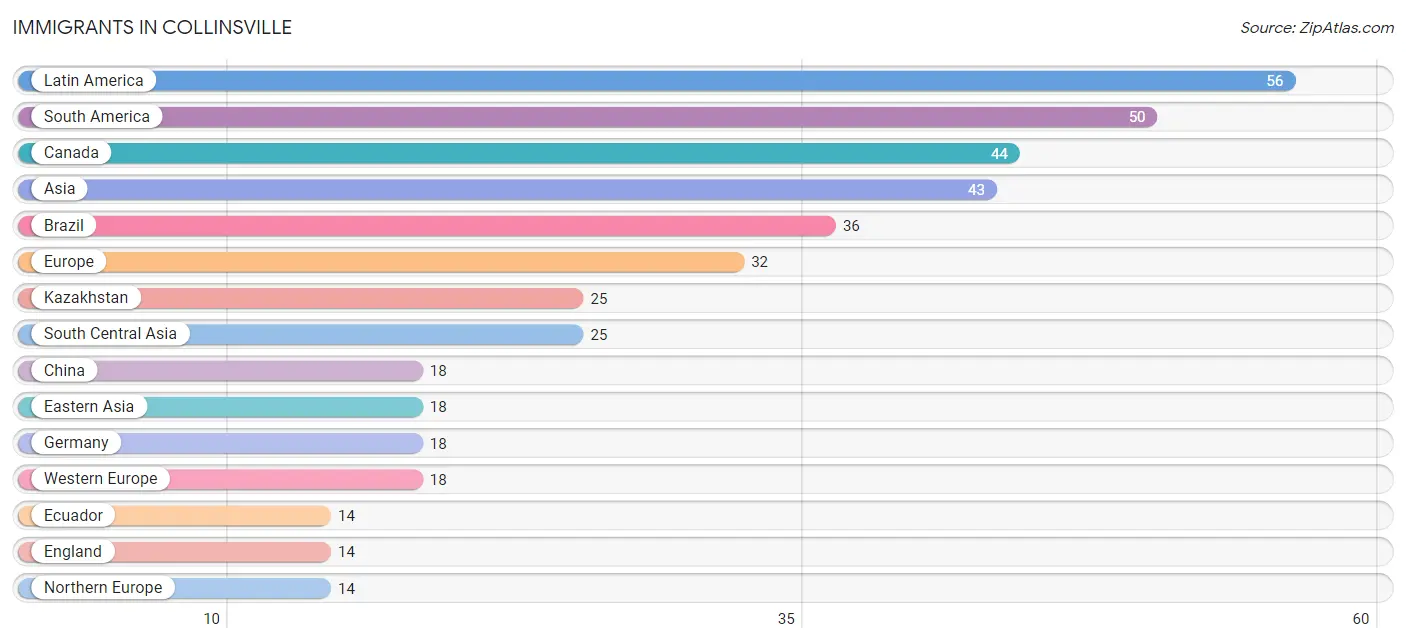
The most numerous immigrant groups reported in Collinsville came from Latin America (56 | 1.5%), South America (50 | 1.3%), Canada (44 | 1.2%), Asia (43 | 1.1%), and Brazil (36 | 1.0%), together accounting for 6.1% of all Collinsville residents.
| Immigration Origin | # Population | % Population |
| Asia | 43 | 1.1% |
| Brazil | 36 | 1.0% |
| Canada | 44 | 1.2% |
| Caribbean | 6 | 0.2% |
| China | 18 | 0.5% |
| Eastern Asia | 18 | 0.5% |
| Ecuador | 14 | 0.4% |
| England | 14 | 0.4% |
| Europe | 32 | 0.9% |
| Germany | 18 | 0.5% |
| Jamaica | 6 | 0.2% |
| Kazakhstan | 25 | 0.7% |
| Latin America | 56 | 1.5% |
| Northern Europe | 14 | 0.4% |
| South America | 50 | 1.3% |
| South Central Asia | 25 | 0.7% |
| Western Europe | 18 | 0.5% | View All 17 Rows |
Sex and Age in Collinsville
Sex and Age in Collinsville
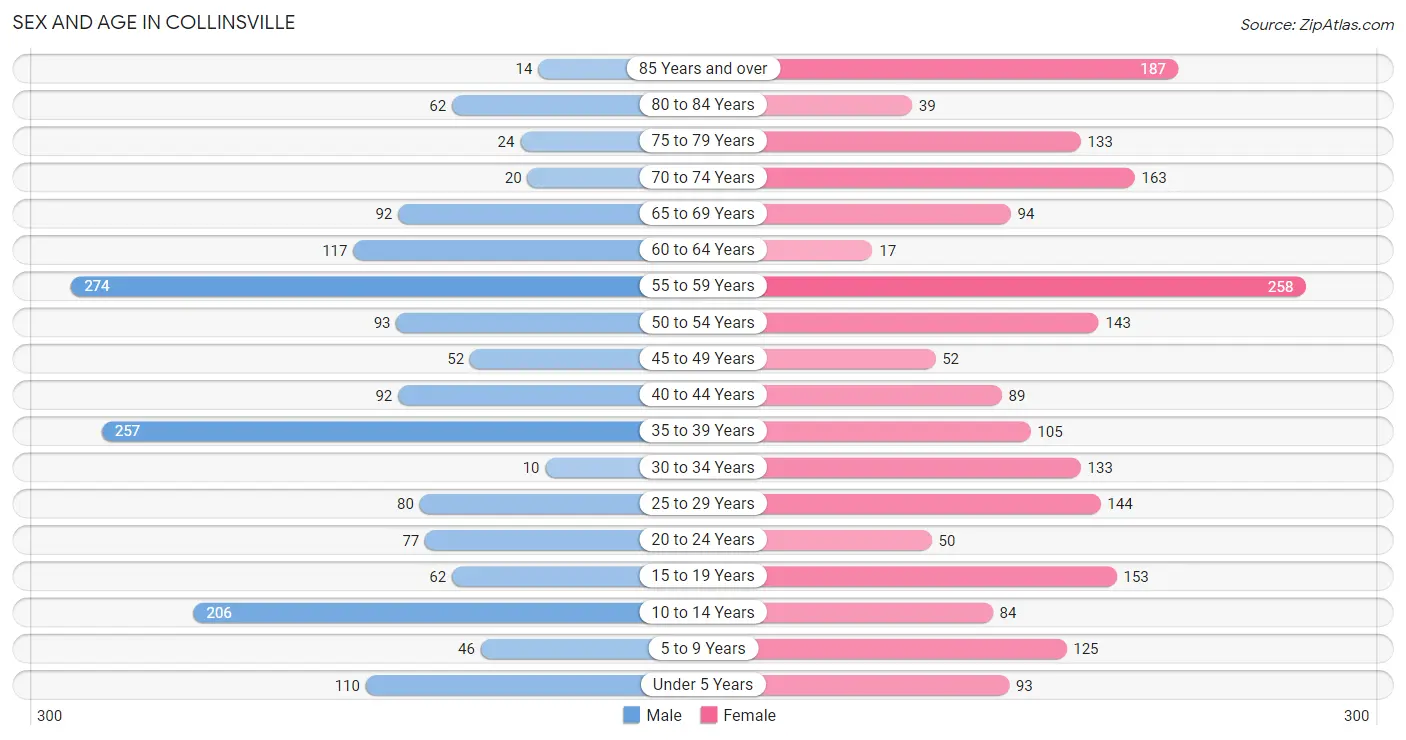
The most populous age groups in Collinsville are 55 to 59 Years (274 | 16.2%) for men and 55 to 59 Years (258 | 12.5%) for women.
| Age Bracket | Male | Female |
| Under 5 Years | 110 (6.5%) | 93 (4.5%) |
| 5 to 9 Years | 46 (2.7%) | 125 (6.1%) |
| 10 to 14 Years | 206 (12.2%) | 84 (4.1%) |
| 15 to 19 Years | 62 (3.7%) | 153 (7.4%) |
| 20 to 24 Years | 77 (4.6%) | 50 (2.4%) |
| 25 to 29 Years | 80 (4.7%) | 144 (7.0%) |
| 30 to 34 Years | 10 (0.6%) | 133 (6.5%) |
| 35 to 39 Years | 257 (15.2%) | 105 (5.1%) |
| 40 to 44 Years | 92 (5.4%) | 89 (4.3%) |
| 45 to 49 Years | 52 (3.1%) | 52 (2.5%) |
| 50 to 54 Years | 93 (5.5%) | 143 (6.9%) |
| 55 to 59 Years | 274 (16.2%) | 258 (12.5%) |
| 60 to 64 Years | 117 (6.9%) | 17 (0.8%) |
| 65 to 69 Years | 92 (5.4%) | 94 (4.6%) |
| 70 to 74 Years | 20 (1.2%) | 163 (7.9%) |
| 75 to 79 Years | 24 (1.4%) | 133 (6.5%) |
| 80 to 84 Years | 62 (3.7%) | 39 (1.9%) |
| 85 Years and over | 14 (0.8%) | 187 (9.1%) |
| Total | 1,688 (100.0%) | 2,062 (100.0%) |
Families and Households in Collinsville
Median Family Size in Collinsville
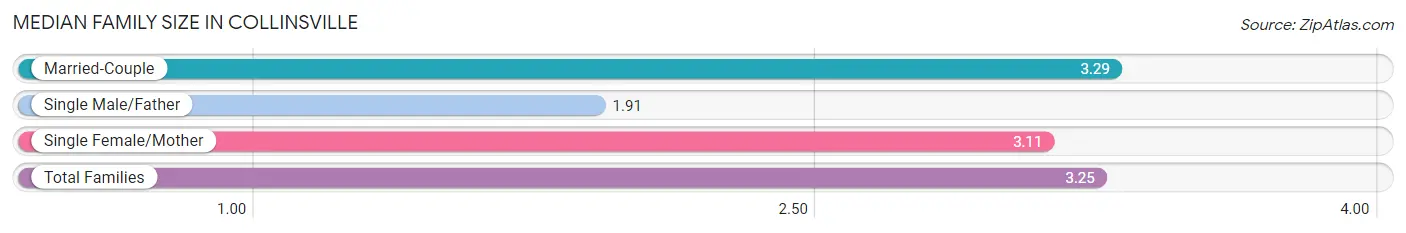
The median family size in Collinsville is 3.25 persons per family, with married-couple families (745 | 89.9%) accounting for the largest median family size of 3.29 persons per family. On the other hand, single male/father families (11 | 1.3%) represent the smallest median family size with 1.91 persons per family.
| Family Type | # Families | Family Size |
| Married-Couple | 745 (89.9%) | 3.29 |
| Single Male/Father | 11 (1.3%) | 1.91 |
| Single Female/Mother | 73 (8.8%) | 3.11 |
| Total Families | 829 (100.0%) | 3.25 |
Median Household Size in Collinsville
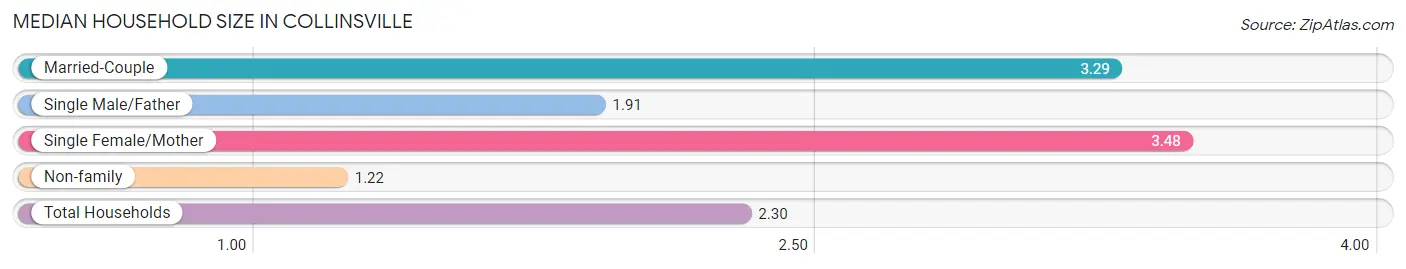
The median household size in Collinsville is 2.30 persons per household, with single female/mother households (73 | 4.6%) accounting for the largest median household size of 3.48 persons per household. non-family households (754 | 47.6%) represent the smallest median household size with 1.22 persons per household.
| Household Type | # Households | Household Size |
| Married-Couple | 745 (47.1%) | 3.29 |
| Single Male/Father | 11 (0.7%) | 1.91 |
| Single Female/Mother | 73 (4.6%) | 3.48 |
| Non-family | 754 (47.6%) | 1.22 |
| Total Households | 1,583 (100.0%) | 2.30 |
Household Size by Marriage Status in Collinsville
Out of a total of 1,583 households in Collinsville, 829 (52.4%) are family households, while 754 (47.6%) are nonfamily households. The most numerous type of family households are 2-person households, comprising 402, and the most common type of nonfamily households are 1-person households, comprising 624.
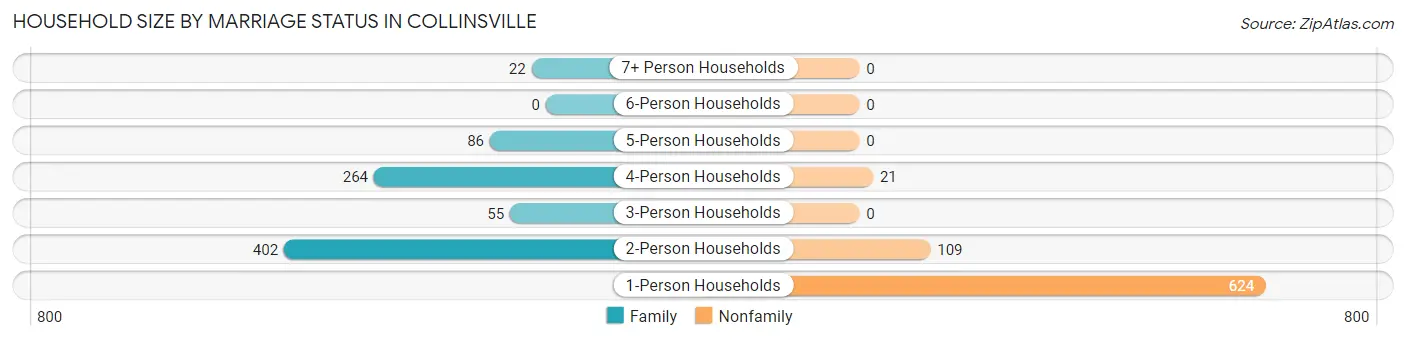
| Household Size | Family Households | Nonfamily Households |
| 1-Person Households | - | 624 (39.4%) |
| 2-Person Households | 402 (25.4%) | 109 (6.9%) |
| 3-Person Households | 55 (3.5%) | 0 (0.0%) |
| 4-Person Households | 264 (16.7%) | 21 (1.3%) |
| 5-Person Households | 86 (5.4%) | 0 (0.0%) |
| 6-Person Households | 0 (0.0%) | 0 (0.0%) |
| 7+ Person Households | 22 (1.4%) | 0 (0.0%) |
| Total | 829 (52.4%) | 754 (47.6%) |
Female Fertility in Collinsville
Fertility by Age in Collinsville
| Age Bracket | Women with Births | Births / 1,000 Women |
| 15 to 19 years | 0 (0.0%) | 0.0 |
| 20 to 34 years | 0 (0.0%) | 0.0 |
| 35 to 50 years | 0 (0.0%) | 0.0 |
| Total | 0 (0.0%) | 0.0 |
Fertility by Age by Marriage Status in Collinsville
| Age Bracket | Married | Unmarried |
| 15 to 19 years | 0 (0.0%) | 0 (0.0%) |
| 20 to 34 years | 0 (0.0%) | 0 (0.0%) |
| 35 to 50 years | 0 (0.0%) | 0 (0.0%) |
| Total | 0 (0.0%) | 0 (0.0%) |
Fertility by Education in Collinsville
| Educational Attainment | Women with Births | Births / 1,000 Women |
| Less than High School | 0 (0.0%) | 0.0 |
| High School Diploma | 0 (0.0%) | 0.0 |
| College or Associate's Degree | 0 (0.0%) | 0.0 |
| Bachelor's Degree | 0 (0.0%) | 0.0 |
| Graduate Degree | 0 (0.0%) | 0.0 |
| Total | 0 (0.0%) | 0.0 |
Fertility by Education by Marriage Status in Collinsville
| Educational Attainment | Married | Unmarried |
| Less than High School | 0 (0.0%) | 0 (0.0%) |
| High School Diploma | 0 (0.0%) | 0 (0.0%) |
| College or Associate's Degree | 0 (0.0%) | 0 (0.0%) |
| Bachelor's Degree | 0 (0.0%) | 0 (0.0%) |
| Graduate Degree | 0 (0.0%) | 0 (0.0%) |
| Total | 0 (0.0%) | 0 (0.0%) |
Employment Characteristics in Collinsville
Employment by Class of Employer in Collinsville
Among the 1,822 employed individuals in Collinsville, private company employees (1,056 | 58.0%), not-for-profit organizations (303 | 16.6%), and local government employees (172 | 9.4%) make up the most common classes of employment.
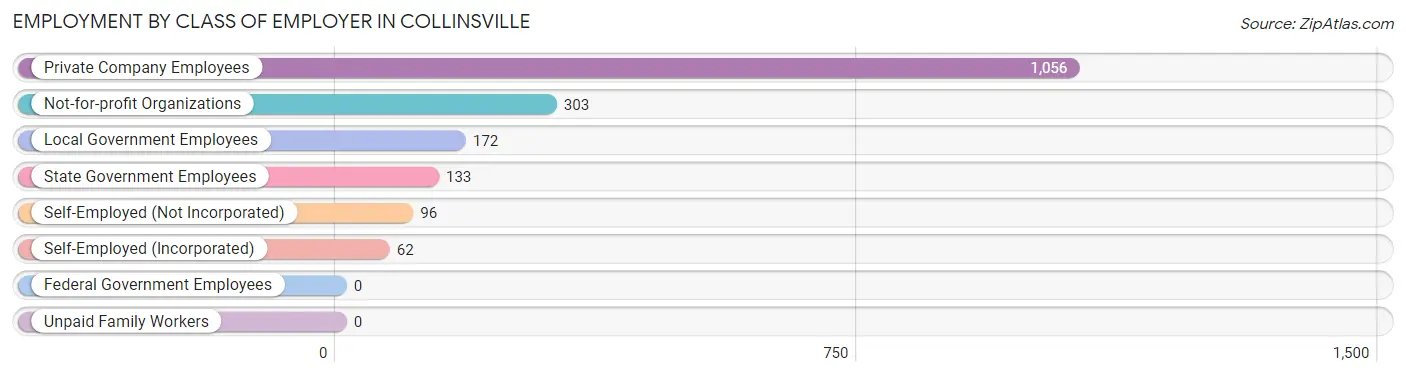
| Employer Class | # Employees | % Employees |
| Private Company Employees | 1,056 | 58.0% |
| Self-Employed (Incorporated) | 62 | 3.4% |
| Self-Employed (Not Incorporated) | 96 | 5.3% |
| Not-for-profit Organizations | 303 | 16.6% |
| Local Government Employees | 172 | 9.4% |
| State Government Employees | 133 | 7.3% |
| Federal Government Employees | 0 | 0.0% |
| Unpaid Family Workers | 0 | 0.0% |
| Total | 1,822 | 100.0% |
Employment Status by Age in Collinsville
According to the labor force statistics for Collinsville, out of the total population over 16 years of age (3,061), 64.3% or 1,968 individuals are in the labor force, with 2.2% or 43 of them unemployed. The age group with the highest labor force participation rate is 30 to 34 years, with 100.0% or 143 individuals in the labor force. Within the labor force, the 16 to 19 years age range has the highest percentage of unemployed individuals, with 23.9% or 27 of them being unemployed.
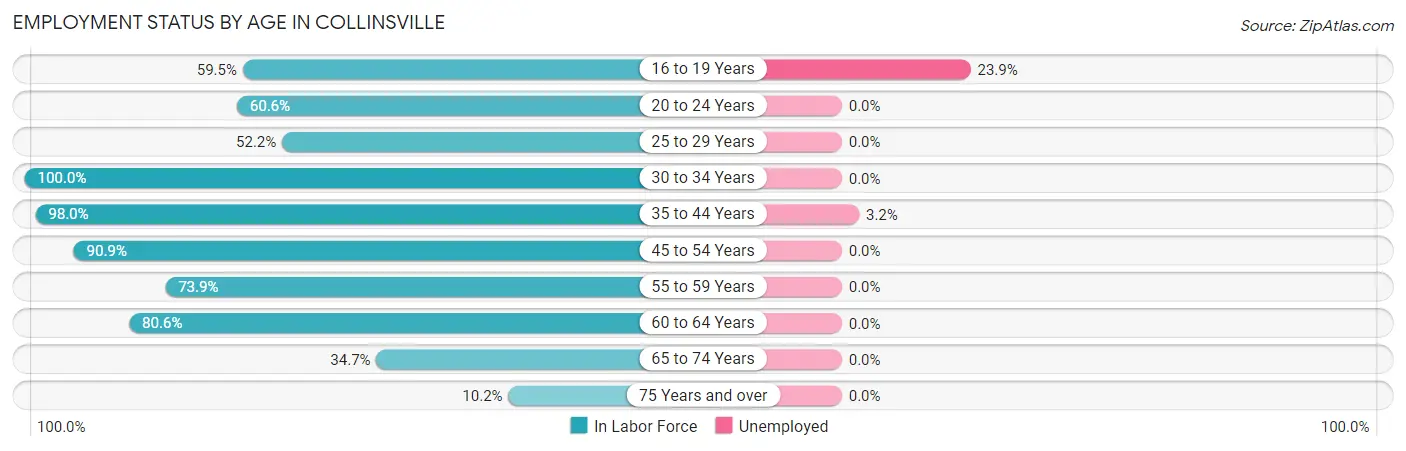
| Age Bracket | In Labor Force | Unemployed |
| 16 to 19 Years | 113 (59.5%) | 27 (23.9%) |
| 20 to 24 Years | 77 (60.6%) | 0 (0.0%) |
| 25 to 29 Years | 117 (52.2%) | 0 (0.0%) |
| 30 to 34 Years | 143 (100.0%) | 0 (0.0%) |
| 35 to 44 Years | 532 (98.0%) | 17 (3.2%) |
| 45 to 54 Years | 309 (90.9%) | 0 (0.0%) |
| 55 to 59 Years | 393 (73.9%) | 0 (0.0%) |
| 60 to 64 Years | 108 (80.6%) | 0 (0.0%) |
| 65 to 74 Years | 128 (34.7%) | 0 (0.0%) |
| 75 Years and over | 47 (10.2%) | 0 (0.0%) |
| Total | 1,968 (64.3%) | 43 (2.2%) |
Employment Status by Educational Attainment in Collinsville
According to labor force statistics for Collinsville, 83.6% of individuals (1,602) out of the total population between 25 and 64 years of age (1,916) are in the labor force, with 1.1% or 18 of them being unemployed. The group with the highest labor force participation rate are those with the educational attainment of bachelor's degree or higher, with 91.0% or 1,348 individuals in the labor force. Within the labor force, individuals with bachelor's degree or higher education have the highest percentage of unemployment, with 1.3% or 18 of them being unemployed.
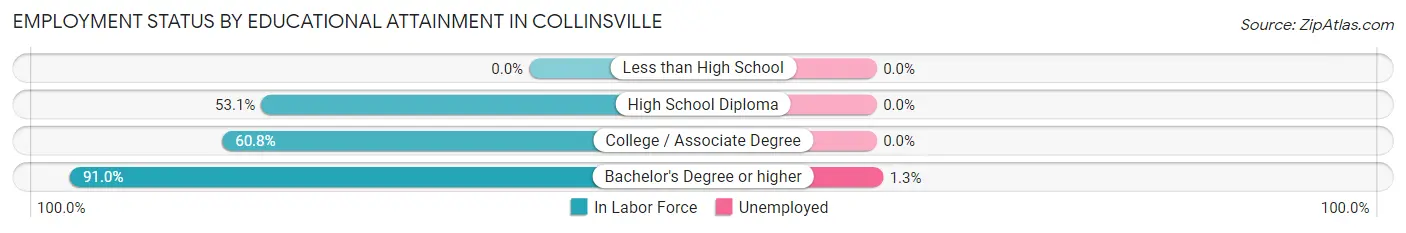
| Educational Attainment | In Labor Force | Unemployed |
| Less than High School | 0 (0.0%) | 0 (0.0%) |
| High School Diploma | 68 (53.1%) | 0 (0.0%) |
| College / Associate Degree | 186 (60.8%) | 0 (0.0%) |
| Bachelor's Degree or higher | 1,348 (91.0%) | 19 (1.3%) |
| Total | 1,602 (83.6%) | 21 (1.1%) |
Employment Occupations by Sex in Collinsville
Management, Business, Science and Arts Occupations
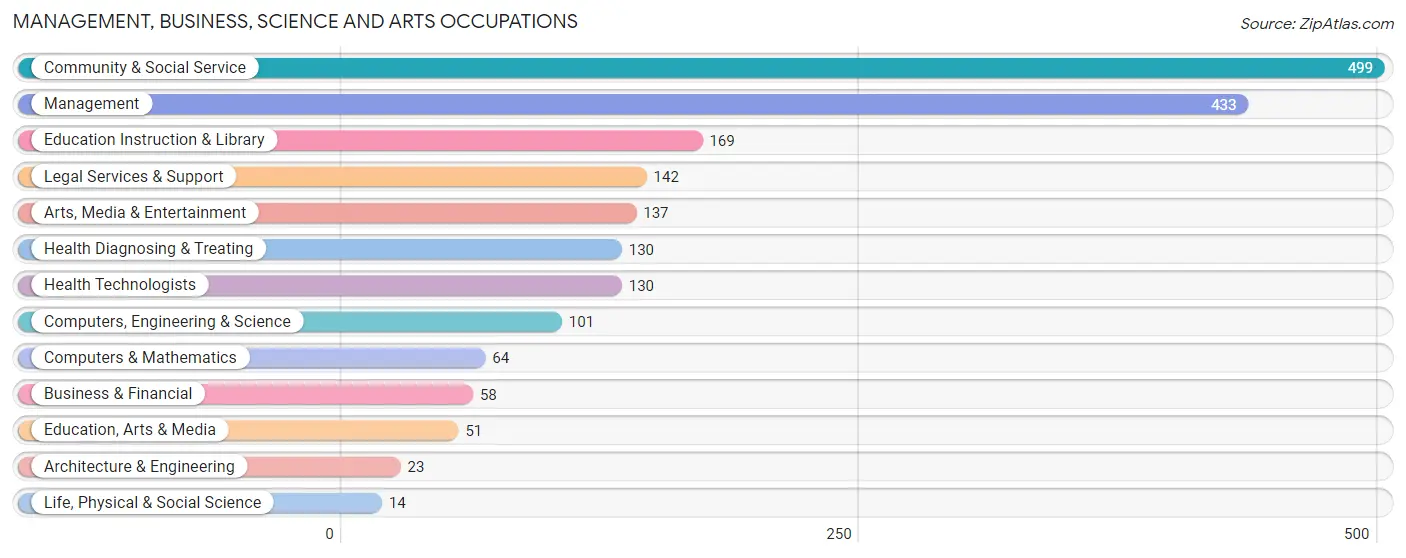
The most common Management, Business, Science and Arts occupations in Collinsville are Community & Social Service (499 | 26.0%), Management (433 | 22.5%), Education Instruction & Library (169 | 8.8%), Legal Services & Support (142 | 7.4%), and Arts, Media & Entertainment (137 | 7.1%).
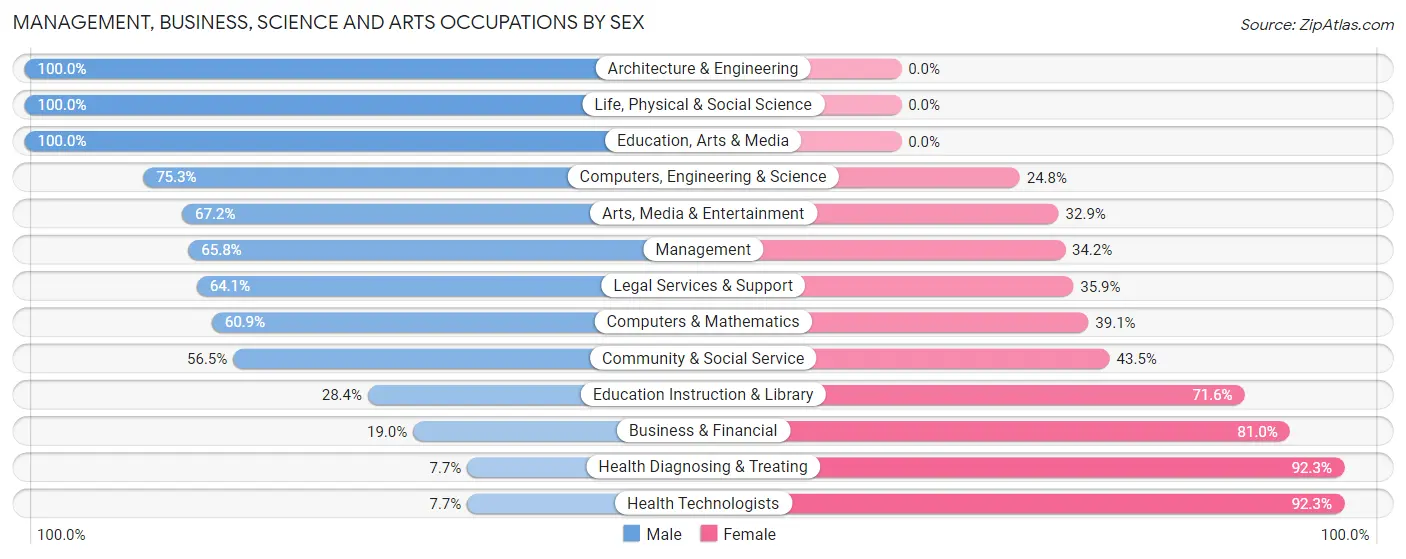
Management, Business, Science and Arts Occupations by Sex
Within the Management, Business, Science and Arts occupations in Collinsville, the most male-oriented occupations are Architecture & Engineering (100.0%), Life, Physical & Social Science (100.0%), and Education, Arts & Media (100.0%), while the most female-oriented occupations are Health Diagnosing & Treating (92.3%), Health Technologists (92.3%), and Business & Financial (81.0%).
| Occupation | Male | Female |
| Management | 285 (65.8%) | 148 (34.2%) |
| Business & Financial | 11 (19.0%) | 47 (81.0%) |
| Computers, Engineering & Science | 76 (75.2%) | 25 (24.7%) |
| Computers & Mathematics | 39 (60.9%) | 25 (39.1%) |
| Architecture & Engineering | 23 (100.0%) | 0 (0.0%) |
| Life, Physical & Social Science | 14 (100.0%) | 0 (0.0%) |
| Community & Social Service | 282 (56.5%) | 217 (43.5%) |
| Education, Arts & Media | 51 (100.0%) | 0 (0.0%) |
| Legal Services & Support | 91 (64.1%) | 51 (35.9%) |
| Education Instruction & Library | 48 (28.4%) | 121 (71.6%) |
| Arts, Media & Entertainment | 92 (67.1%) | 45 (32.9%) |
| Health Diagnosing & Treating | 10 (7.7%) | 120 (92.3%) |
| Health Technologists | 10 (7.7%) | 120 (92.3%) |
| Total (Category) | 664 (54.4%) | 557 (45.6%) |
| Total (Overall) | 945 (49.1%) | 978 (50.9%) |
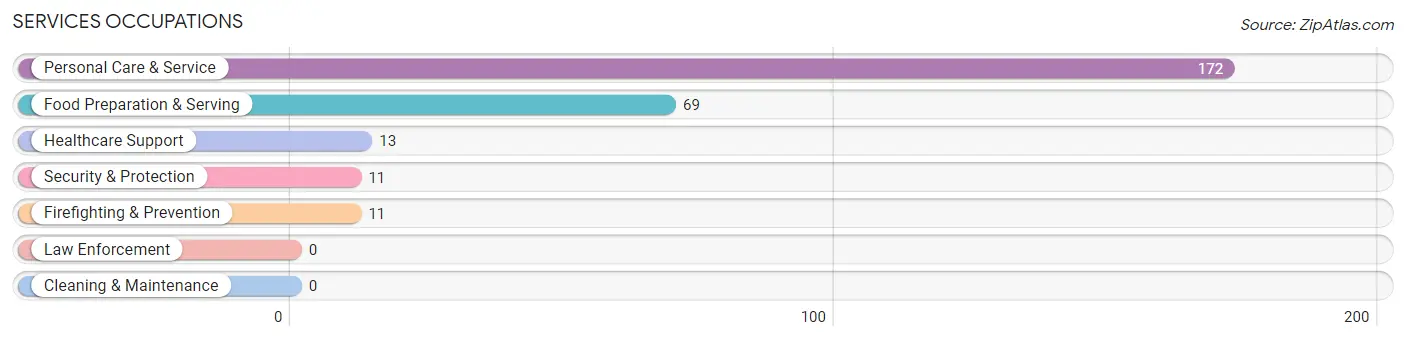
Services Occupations
The most common Services occupations in Collinsville are Personal Care & Service (172 | 8.9%), Food Preparation & Serving (69 | 3.6%), Healthcare Support (13 | 0.7%), Security & Protection (11 | 0.6%), and Firefighting & Prevention (11 | 0.6%).
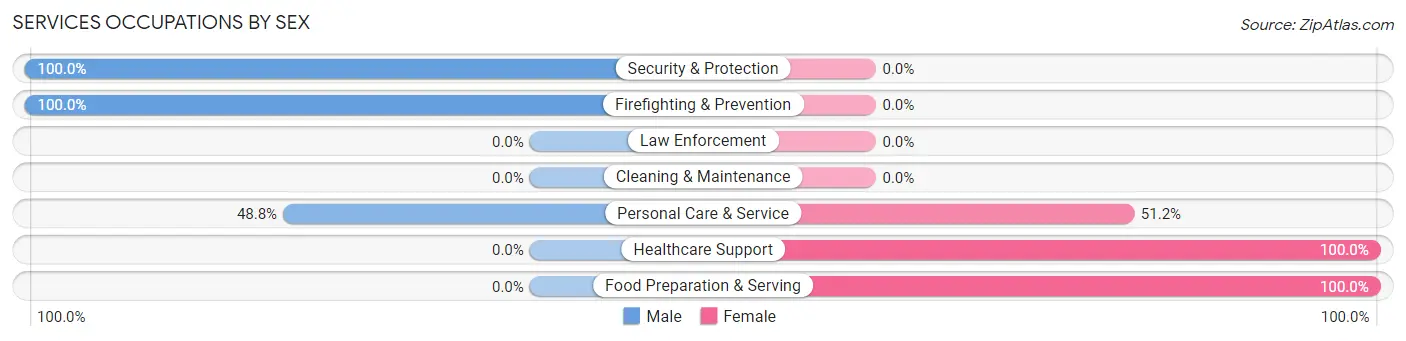
Services Occupations by Sex
Within the Services occupations in Collinsville, the most male-oriented occupations are Security & Protection (100.0%), Firefighting & Prevention (100.0%), and Personal Care & Service (48.8%), while the most female-oriented occupations are Healthcare Support (100.0%), Food Preparation & Serving (100.0%), and Personal Care & Service (51.2%).
| Occupation | Male | Female |
| Healthcare Support | 0 (0.0%) | 13 (100.0%) |
| Security & Protection | 11 (100.0%) | 0 (0.0%) |
| Firefighting & Prevention | 11 (100.0%) | 0 (0.0%) |
| Law Enforcement | 0 (0.0%) | 0 (0.0%) |
| Food Preparation & Serving | 0 (0.0%) | 69 (100.0%) |
| Cleaning & Maintenance | 0 (0.0%) | 0 (0.0%) |
| Personal Care & Service | 84 (48.8%) | 88 (51.2%) |
| Total (Category) | 95 (35.8%) | 170 (64.1%) |
| Total (Overall) | 945 (49.1%) | 978 (50.9%) |
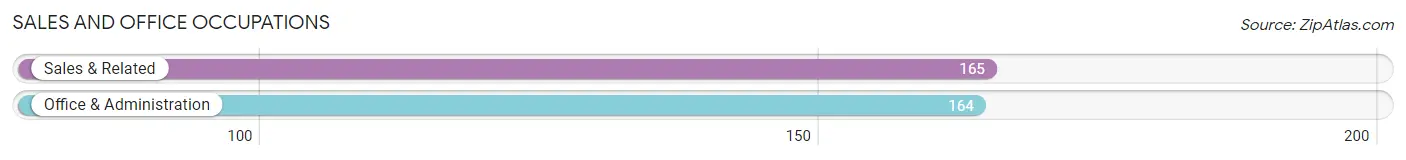
Sales and Office Occupations
The most common Sales and Office occupations in Collinsville are Sales & Related (165 | 8.6%), and Office & Administration (164 | 8.5%).
Sales and Office Occupations by Sex
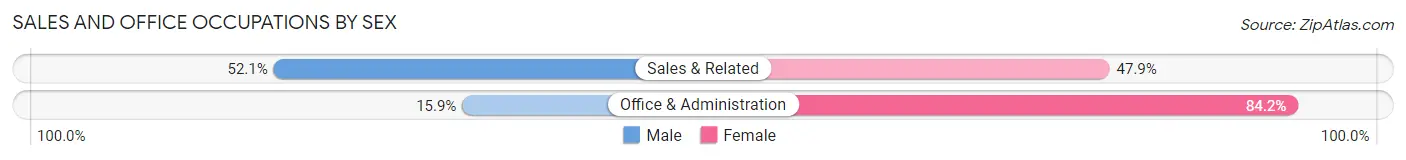
| Occupation | Male | Female |
| Sales & Related | 86 (52.1%) | 79 (47.9%) |
| Office & Administration | 26 (15.9%) | 138 (84.2%) |
| Total (Category) | 112 (34.0%) | 217 (66.0%) |
| Total (Overall) | 945 (49.1%) | 978 (50.9%) |
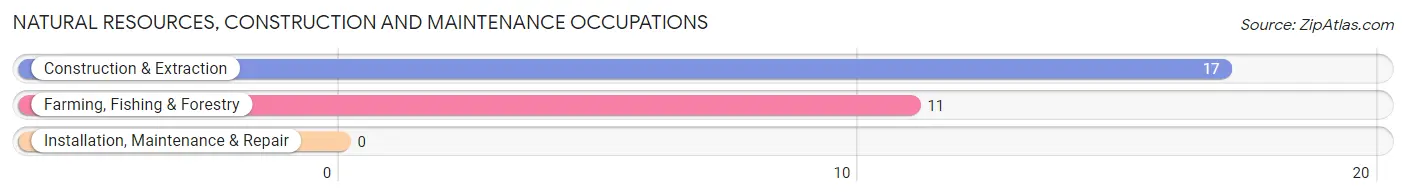
Natural Resources, Construction and Maintenance Occupations
The most common Natural Resources, Construction and Maintenance occupations in Collinsville are Construction & Extraction (17 | 0.9%), and Farming, Fishing & Forestry (11 | 0.6%).
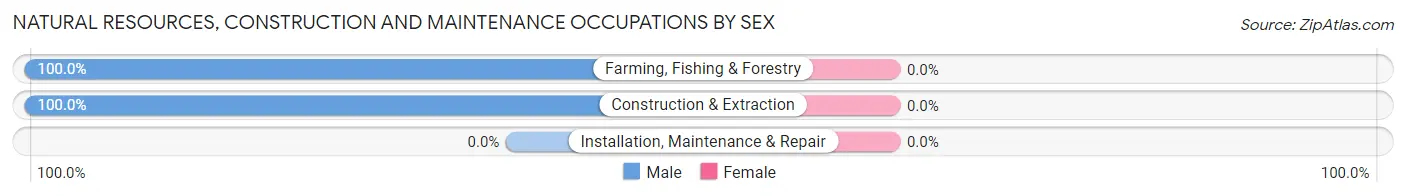
Natural Resources, Construction and Maintenance Occupations by Sex
| Occupation | Male | Female |
| Farming, Fishing & Forestry | 11 (100.0%) | 0 (0.0%) |
| Construction & Extraction | 17 (100.0%) | 0 (0.0%) |
| Installation, Maintenance & Repair | 0 (0.0%) | 0 (0.0%) |
| Total (Category) | 28 (100.0%) | 0 (0.0%) |
| Total (Overall) | 945 (49.1%) | 978 (50.9%) |
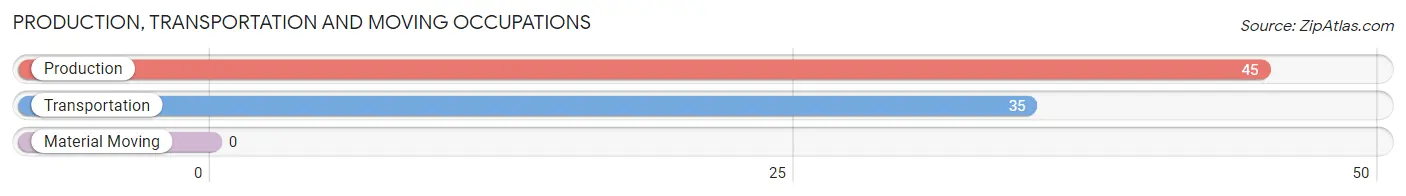
Production, Transportation and Moving Occupations
The most common Production, Transportation and Moving occupations in Collinsville are Production (45 | 2.3%), and Transportation (35 | 1.8%).
Production, Transportation and Moving Occupations by Sex
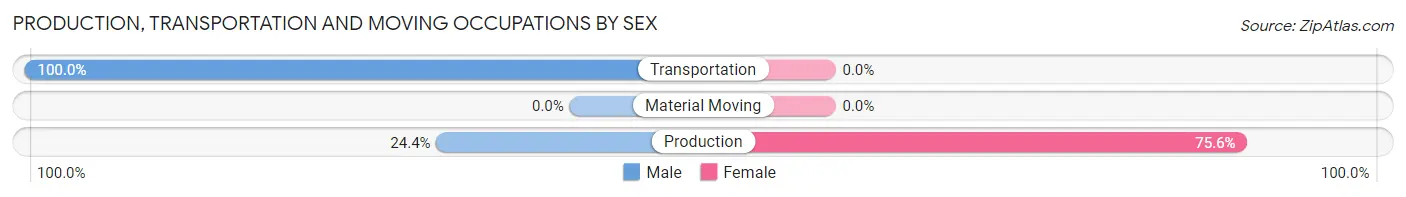
| Occupation | Male | Female |
| Production | 11 (24.4%) | 34 (75.6%) |
| Transportation | 35 (100.0%) | 0 (0.0%) |
| Material Moving | 0 (0.0%) | 0 (0.0%) |
| Total (Category) | 46 (57.5%) | 34 (42.5%) |
| Total (Overall) | 945 (49.1%) | 978 (50.9%) |
Employment Industries by Sex in Collinsville
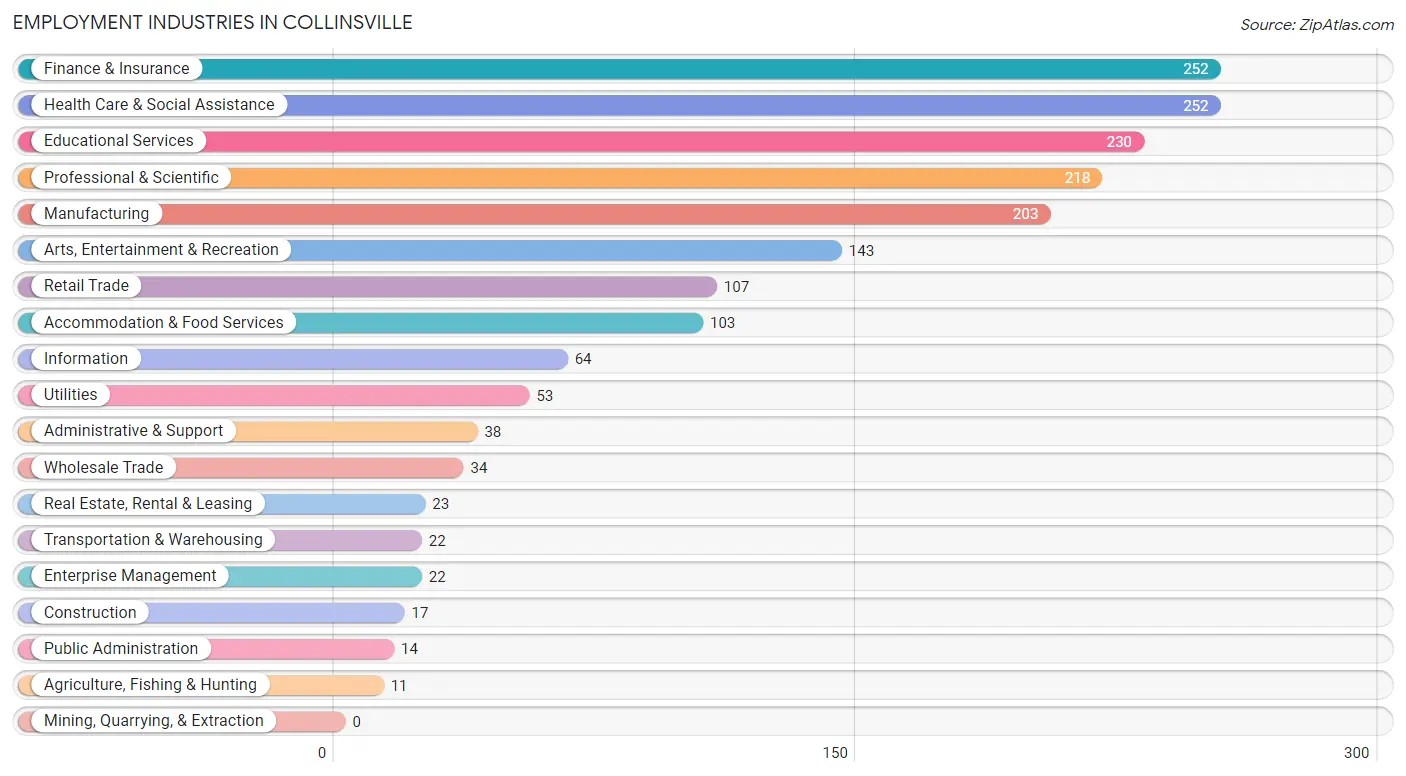
Employment Industries in Collinsville
The major employment industries in Collinsville include Finance & Insurance (252 | 13.1%), Health Care & Social Assistance (252 | 13.1%), Educational Services (230 | 12.0%), Professional & Scientific (218 | 11.3%), and Manufacturing (203 | 10.6%).
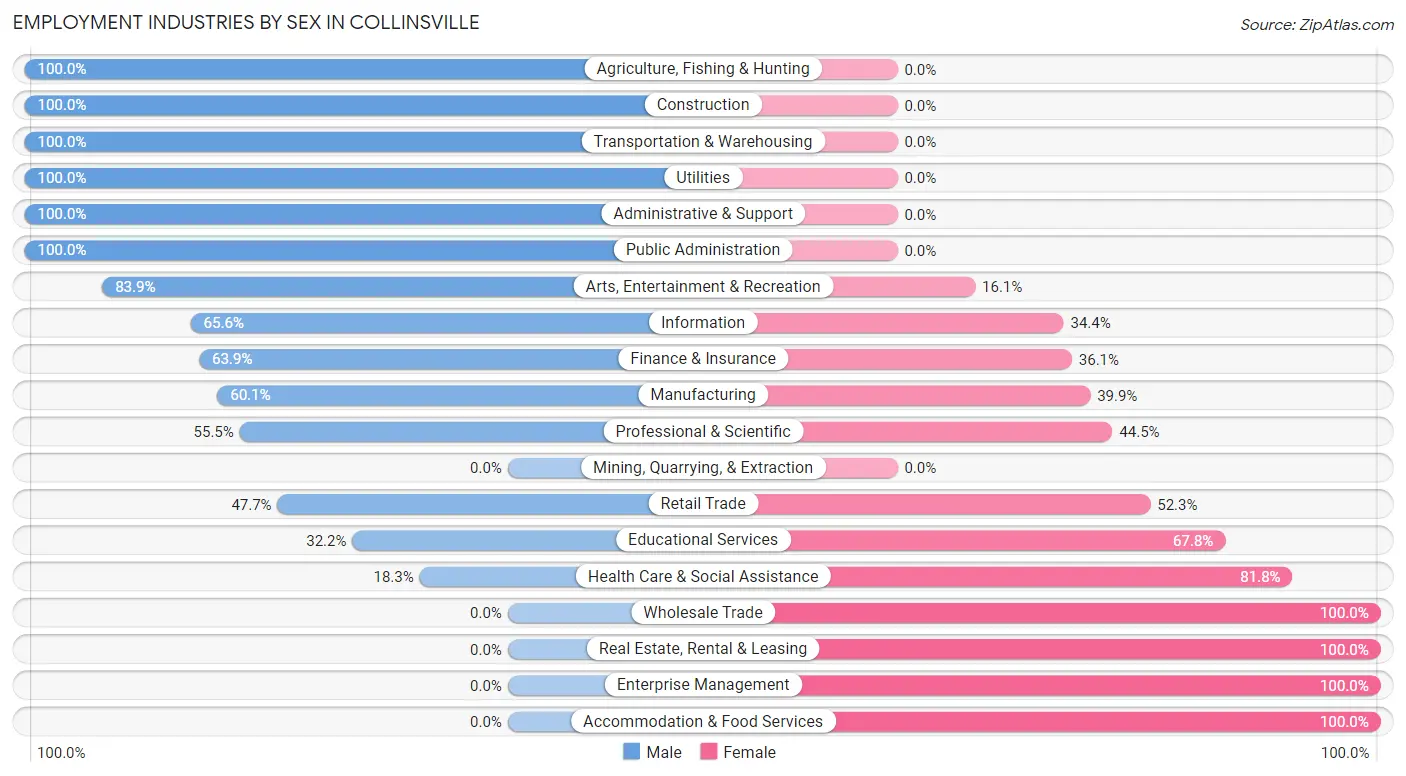
Employment Industries by Sex in Collinsville
The Collinsville industries that see more men than women are Agriculture, Fishing & Hunting (100.0%), Construction (100.0%), and Transportation & Warehousing (100.0%), whereas the industries that tend to have a higher number of women are Wholesale Trade (100.0%), Real Estate, Rental & Leasing (100.0%), and Enterprise Management (100.0%).
| Industry | Male | Female |
| Agriculture, Fishing & Hunting | 11 (100.0%) | 0 (0.0%) |
| Mining, Quarrying, & Extraction | 0 (0.0%) | 0 (0.0%) |
| Construction | 17 (100.0%) | 0 (0.0%) |
| Manufacturing | 122 (60.1%) | 81 (39.9%) |
| Wholesale Trade | 0 (0.0%) | 34 (100.0%) |
| Retail Trade | 51 (47.7%) | 56 (52.3%) |
| Transportation & Warehousing | 22 (100.0%) | 0 (0.0%) |
| Utilities | 53 (100.0%) | 0 (0.0%) |
| Information | 42 (65.6%) | 22 (34.4%) |
| Finance & Insurance | 161 (63.9%) | 91 (36.1%) |
| Real Estate, Rental & Leasing | 0 (0.0%) | 23 (100.0%) |
| Professional & Scientific | 121 (55.5%) | 97 (44.5%) |
| Enterprise Management | 0 (0.0%) | 22 (100.0%) |
| Administrative & Support | 38 (100.0%) | 0 (0.0%) |
| Educational Services | 74 (32.2%) | 156 (67.8%) |
| Health Care & Social Assistance | 46 (18.2%) | 206 (81.8%) |
| Arts, Entertainment & Recreation | 120 (83.9%) | 23 (16.1%) |
| Accommodation & Food Services | 0 (0.0%) | 103 (100.0%) |
| Public Administration | 14 (100.0%) | 0 (0.0%) |
| Total | 945 (49.1%) | 978 (50.9%) |
Education in Collinsville
School Enrollment in Collinsville
The most common levels of schooling among the 1,049 students in Collinsville are middle school (225 | 21.4%), high school (219 | 20.9%), and elementary school (151 | 14.4%).
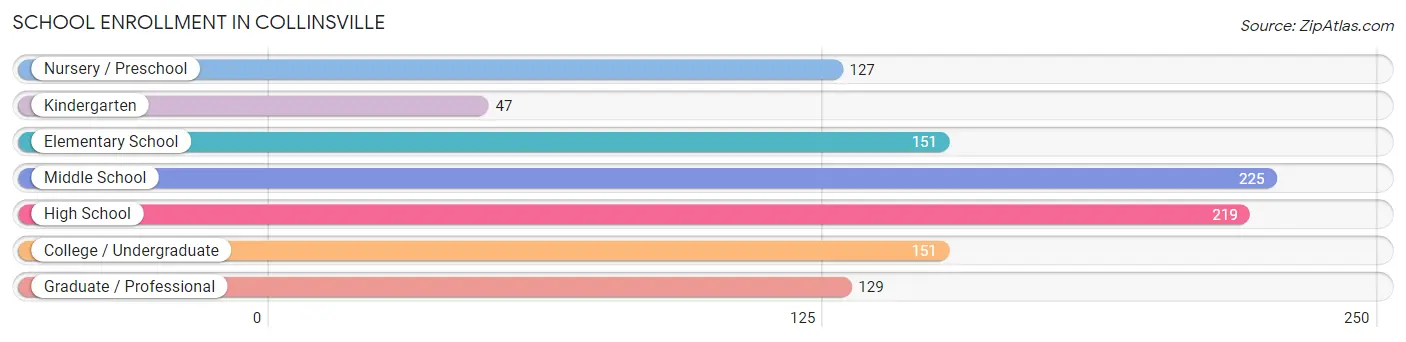
| School Level | # Students | % Students |
| Nursery / Preschool | 127 | 12.1% |
| Kindergarten | 47 | 4.5% |
| Elementary School | 151 | 14.4% |
| Middle School | 225 | 21.4% |
| High School | 219 | 20.9% |
| College / Undergraduate | 151 | 14.4% |
| Graduate / Professional | 129 | 12.3% |
| Total | 1,049 | 100.0% |
School Enrollment by Age by Funding Source in Collinsville
Out of a total of 1,049 students who are enrolled in schools in Collinsville, 223 (21.3%) attend a private institution, while the remaining 826 (78.7%) are enrolled in public schools. The age group of 18 to 19 year olds has the highest likelihood of being enrolled in private schools, with 34 (100.0% in the age bracket) enrolled. Conversely, the age group of 5 to 9 year old has the lowest likelihood of being enrolled in a private school, with 171 (100.0% in the age bracket) attending a public institution.
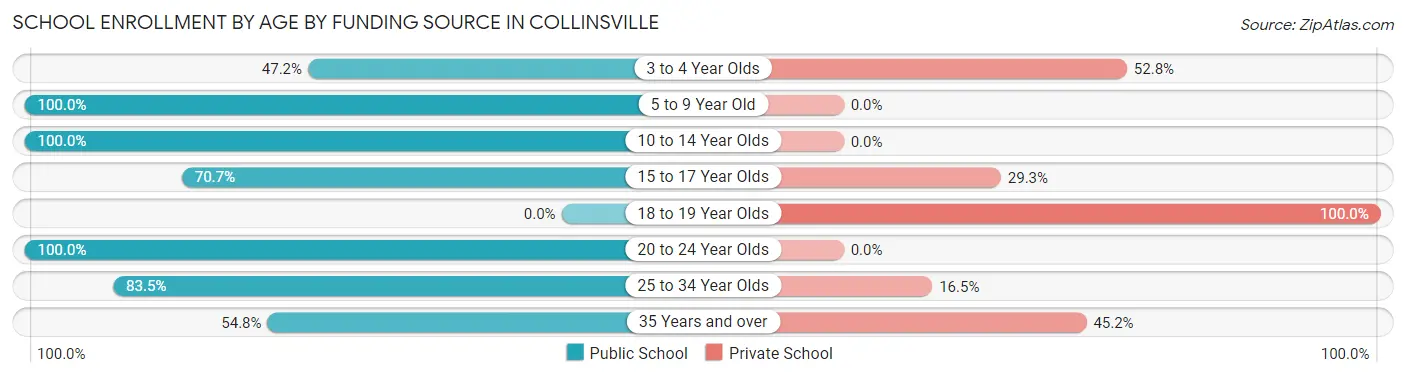
| Age Bracket | Public School | Private School |
| 3 to 4 Year Olds | 60 (47.2%) | 67 (52.8%) |
| 5 to 9 Year Old | 171 (100.0%) | 0 (0.0%) |
| 10 to 14 Year Olds | 290 (100.0%) | 0 (0.0%) |
| 15 to 17 Year Olds | 128 (70.7%) | 53 (29.3%) |
| 18 to 19 Year Olds | 0 (0.0%) | 34 (100.0%) |
| 20 to 24 Year Olds | 28 (100.0%) | 0 (0.0%) |
| 25 to 34 Year Olds | 86 (83.5%) | 17 (16.5%) |
| 35 Years and over | 63 (54.8%) | 52 (45.2%) |
| Total | 826 (78.7%) | 223 (21.3%) |
Educational Attainment by Field of Study in Collinsville
Business (306 | 15.7%), social sciences (235 | 12.0%), literature & languages (219 | 11.2%), science & technology (216 | 11.1%), and liberal arts & history (153 | 7.8%) are the most common fields of study among 1,951 individuals in Collinsville who have obtained a bachelor's degree or higher.
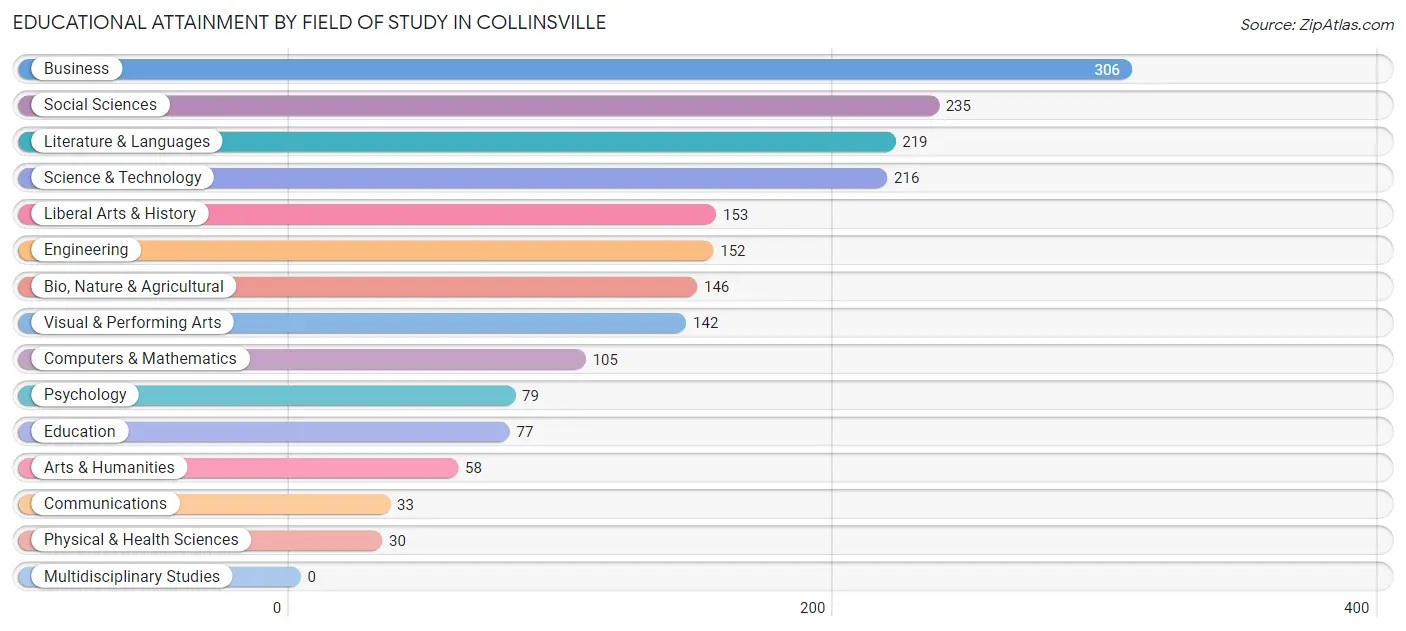
| Field of Study | # Graduates | % Graduates |
| Computers & Mathematics | 105 | 5.4% |
| Bio, Nature & Agricultural | 146 | 7.5% |
| Physical & Health Sciences | 30 | 1.5% |
| Psychology | 79 | 4.1% |
| Social Sciences | 235 | 12.0% |
| Engineering | 152 | 7.8% |
| Multidisciplinary Studies | 0 | 0.0% |
| Science & Technology | 216 | 11.1% |
| Business | 306 | 15.7% |
| Education | 77 | 4.0% |
| Literature & Languages | 219 | 11.2% |
| Liberal Arts & History | 153 | 7.8% |
| Visual & Performing Arts | 142 | 7.3% |
| Communications | 33 | 1.7% |
| Arts & Humanities | 58 | 3.0% |
| Total | 1,951 | 100.0% |
Transportation & Commute in Collinsville
Vehicle Availability by Sex in Collinsville
The most prevalent vehicle ownership categories in Collinsville are males with 2 vehicles (376, accounting for 41.0%) and females with 2 vehicles (392, making up 41.6%).
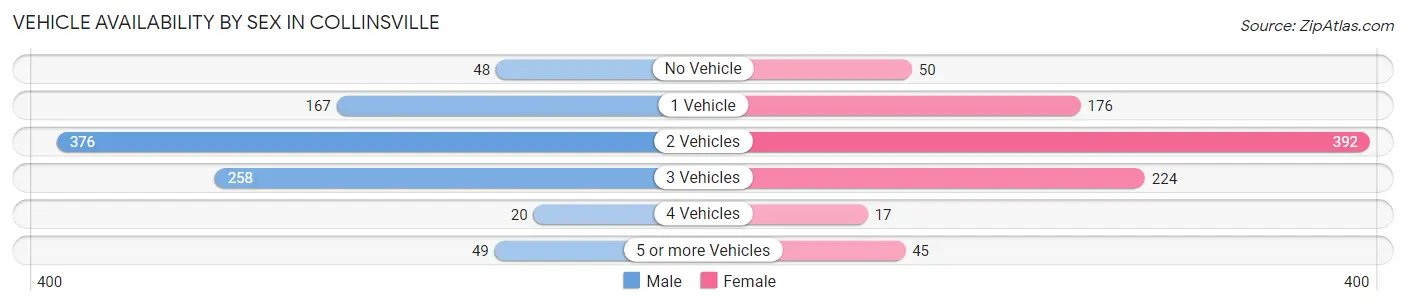
| Vehicles Available | Male | Female |
| No Vehicle | 48 (5.2%) | 50 (5.5%) |
| 1 Vehicle | 167 (18.2%) | 176 (19.5%) |
| 2 Vehicles | 376 (41.0%) | 392 (43.4%) |
| 3 Vehicles | 258 (28.1%) | 224 (24.8%) |
| 4 Vehicles | 20 (2.2%) | 17 (1.9%) |
| 5 or more Vehicles | 49 (5.3%) | 45 (5.0%) |
| Total | 918 (100.0%) | 904 (100.0%) |
Commute Time in Collinsville
The most frequently occuring commute durations in Collinsville are 30 to 34 minutes (338 commuters, 23.3%), 45 to 59 minutes (228 commuters, 15.7%), and 20 to 24 minutes (172 commuters, 11.8%).
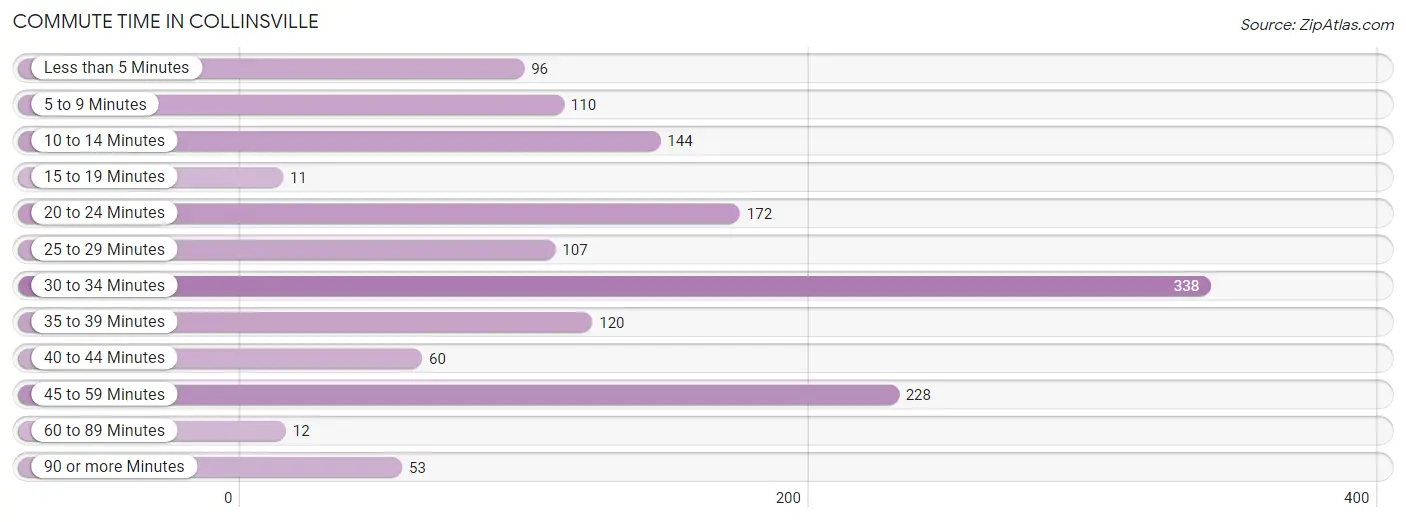
| Commute Time | # Commuters | % Commuters |
| Less than 5 Minutes | 96 | 6.6% |
| 5 to 9 Minutes | 110 | 7.6% |
| 10 to 14 Minutes | 144 | 9.9% |
| 15 to 19 Minutes | 11 | 0.8% |
| 20 to 24 Minutes | 172 | 11.8% |
| 25 to 29 Minutes | 107 | 7.4% |
| 30 to 34 Minutes | 338 | 23.3% |
| 35 to 39 Minutes | 120 | 8.3% |
| 40 to 44 Minutes | 60 | 4.1% |
| 45 to 59 Minutes | 228 | 15.7% |
| 60 to 89 Minutes | 12 | 0.8% |
| 90 or more Minutes | 53 | 3.6% |
Commute Time by Sex in Collinsville
The most common commute times in Collinsville are 30 to 34 minutes (204 commuters, 28.7%) for males and 20 to 24 minutes (151 commuters, 20.4%) for females.
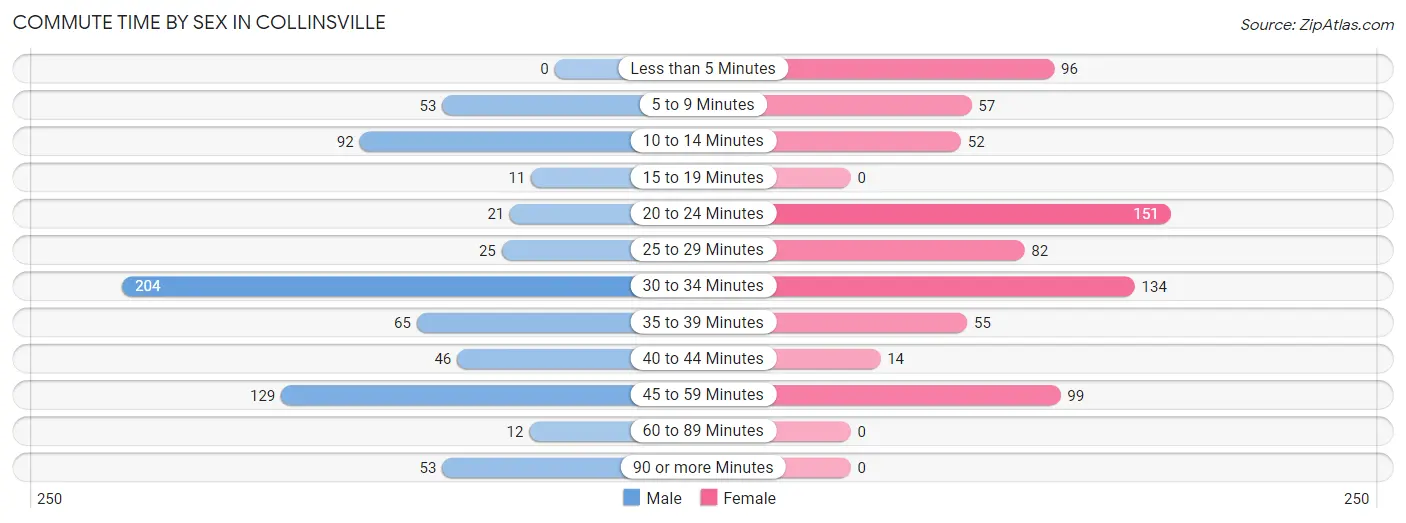
| Commute Time | Male | Female |
| Less than 5 Minutes | 0 (0.0%) | 96 (13.0%) |
| 5 to 9 Minutes | 53 (7.4%) | 57 (7.7%) |
| 10 to 14 Minutes | 92 (12.9%) | 52 (7.0%) |
| 15 to 19 Minutes | 11 (1.5%) | 0 (0.0%) |
| 20 to 24 Minutes | 21 (2.9%) | 151 (20.4%) |
| 25 to 29 Minutes | 25 (3.5%) | 82 (11.1%) |
| 30 to 34 Minutes | 204 (28.7%) | 134 (18.1%) |
| 35 to 39 Minutes | 65 (9.1%) | 55 (7.4%) |
| 40 to 44 Minutes | 46 (6.5%) | 14 (1.9%) |
| 45 to 59 Minutes | 129 (18.1%) | 99 (13.4%) |
| 60 to 89 Minutes | 12 (1.7%) | 0 (0.0%) |
| 90 or more Minutes | 53 (7.4%) | 0 (0.0%) |
Time of Departure to Work by Sex in Collinsville
The most frequent times of departure to work in Collinsville are 7:30 AM to 7:59 AM (191, 26.9%) for males and 12:00 PM to 3:59 PM (132, 17.8%) for females.
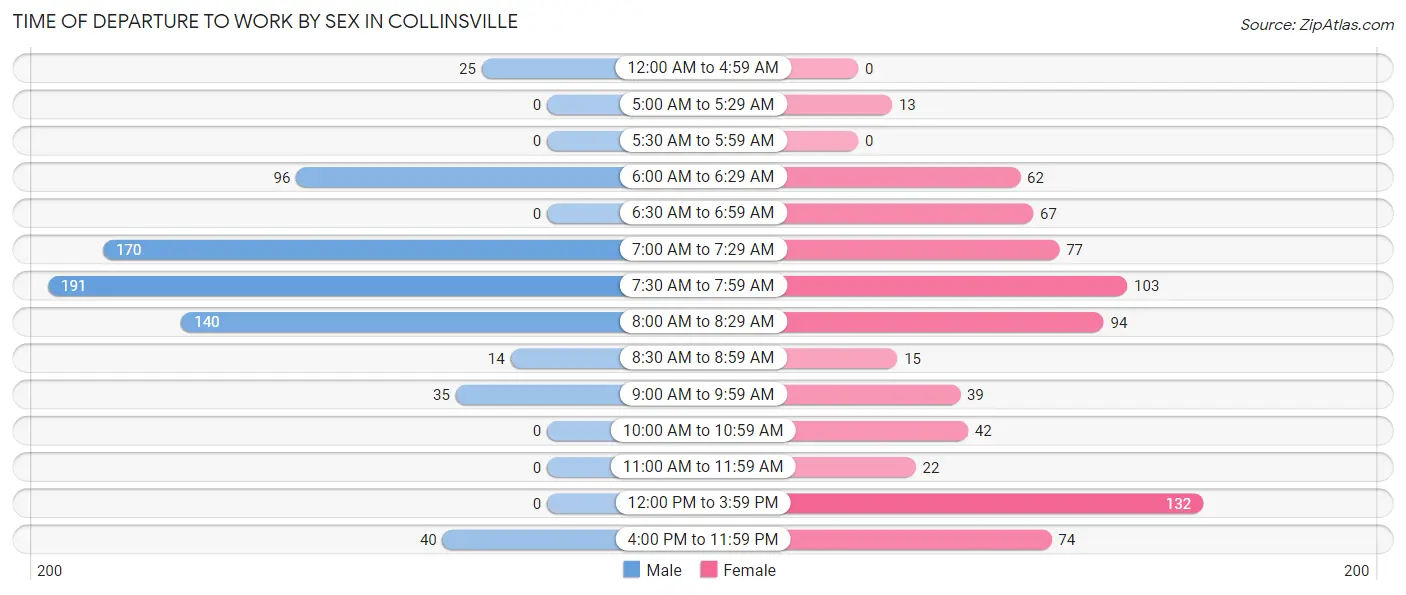
| Time of Departure | Male | Female |
| 12:00 AM to 4:59 AM | 25 (3.5%) | 0 (0.0%) |
| 5:00 AM to 5:29 AM | 0 (0.0%) | 13 (1.8%) |
| 5:30 AM to 5:59 AM | 0 (0.0%) | 0 (0.0%) |
| 6:00 AM to 6:29 AM | 96 (13.5%) | 62 (8.4%) |
| 6:30 AM to 6:59 AM | 0 (0.0%) | 67 (9.0%) |
| 7:00 AM to 7:29 AM | 170 (23.9%) | 77 (10.4%) |
| 7:30 AM to 7:59 AM | 191 (26.9%) | 103 (13.9%) |
| 8:00 AM to 8:29 AM | 140 (19.7%) | 94 (12.7%) |
| 8:30 AM to 8:59 AM | 14 (2.0%) | 15 (2.0%) |
| 9:00 AM to 9:59 AM | 35 (4.9%) | 39 (5.3%) |
| 10:00 AM to 10:59 AM | 0 (0.0%) | 42 (5.7%) |
| 11:00 AM to 11:59 AM | 0 (0.0%) | 22 (3.0%) |
| 12:00 PM to 3:59 PM | 0 (0.0%) | 132 (17.8%) |
| 4:00 PM to 11:59 PM | 40 (5.6%) | 74 (10.0%) |
| Total | 711 (100.0%) | 740 (100.0%) |
Housing Occupancy in Collinsville
Occupancy by Ownership in Collinsville
Of the total 1,583 dwellings in Collinsville, owner-occupied units account for 1,182 (74.7%), while renter-occupied units make up 401 (25.3%).
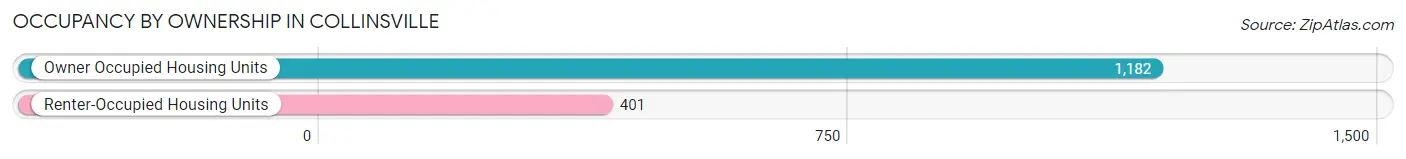
| Occupancy | # Housing Units | % Housing Units |
| Owner Occupied Housing Units | 1,182 | 74.7% |
| Renter-Occupied Housing Units | 401 | 25.3% |
| Total Occupied Housing Units | 1,583 | 100.0% |
Occupancy by Household Size in Collinsville
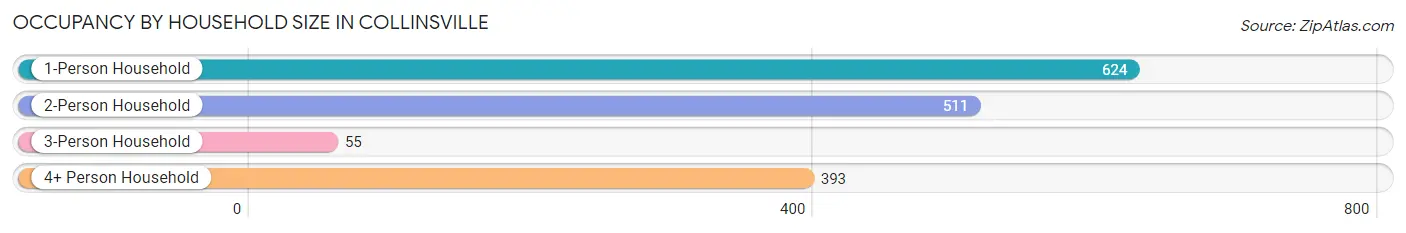
| Household Size | # Housing Units | % Housing Units |
| 1-Person Household | 624 | 39.4% |
| 2-Person Household | 511 | 32.3% |
| 3-Person Household | 55 | 3.5% |
| 4+ Person Household | 393 | 24.8% |
| Total Housing Units | 1,583 | 100.0% |
Occupancy by Ownership by Household Size in Collinsville
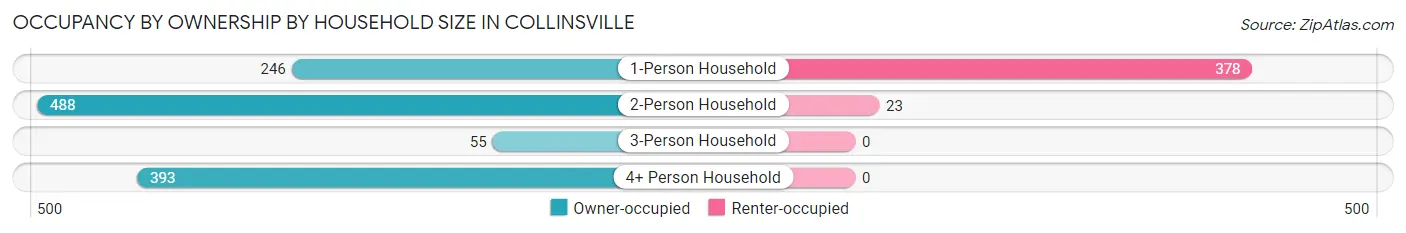
| Household Size | Owner-occupied | Renter-occupied |
| 1-Person Household | 246 (39.4%) | 378 (60.6%) |
| 2-Person Household | 488 (95.5%) | 23 (4.5%) |
| 3-Person Household | 55 (100.0%) | 0 (0.0%) |
| 4+ Person Household | 393 (100.0%) | 0 (0.0%) |
| Total Housing Units | 1,182 (74.7%) | 401 (25.3%) |
Occupancy by Educational Attainment in Collinsville
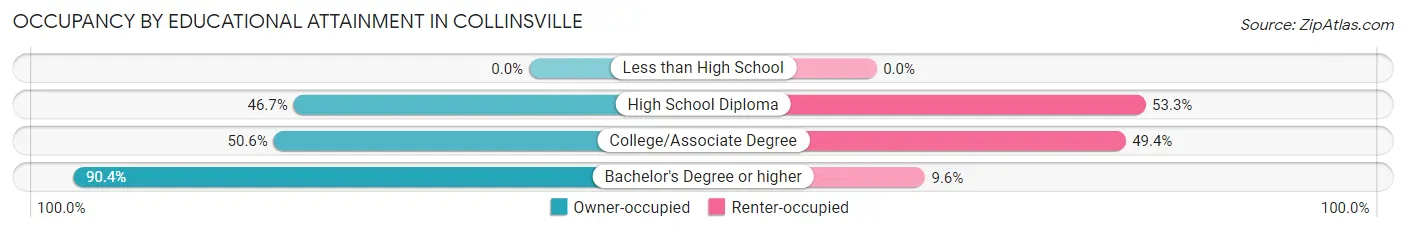
| Household Size | Owner-occupied | Renter-occupied |
| Less than High School | 0 (0.0%) | 0 (0.0%) |
| High School Diploma | 63 (46.7%) | 72 (53.3%) |
| College/Associate Degree | 242 (50.6%) | 236 (49.4%) |
| Bachelor's Degree or higher | 877 (90.4%) | 93 (9.6%) |
Occupancy by Age of Householder in Collinsville
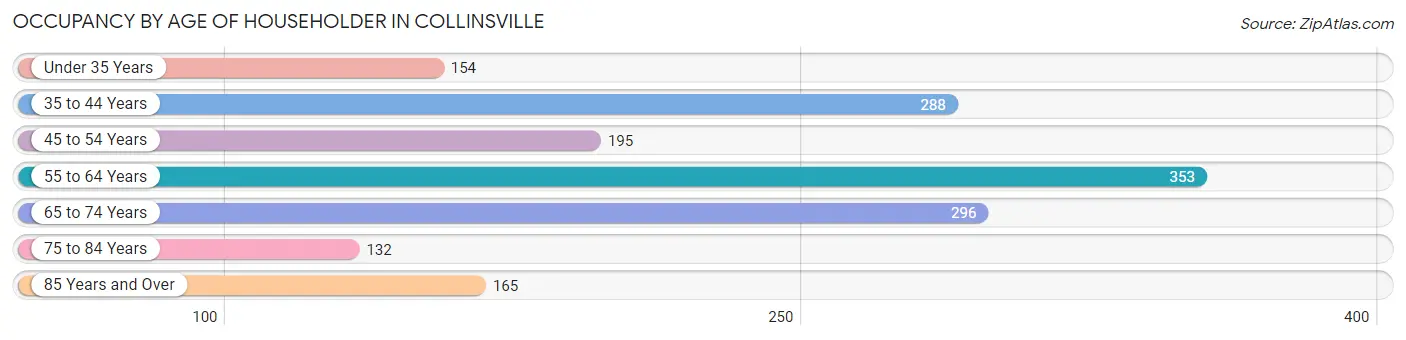
| Age Bracket | # Households | % Households |
| Under 35 Years | 154 | 9.7% |
| 35 to 44 Years | 288 | 18.2% |
| 45 to 54 Years | 195 | 12.3% |
| 55 to 64 Years | 353 | 22.3% |
| 65 to 74 Years | 296 | 18.7% |
| 75 to 84 Years | 132 | 8.3% |
| 85 Years and Over | 165 | 10.4% |
| Total | 1,583 | 100.0% |
Housing Finances in Collinsville
Median Income by Occupancy in Collinsville
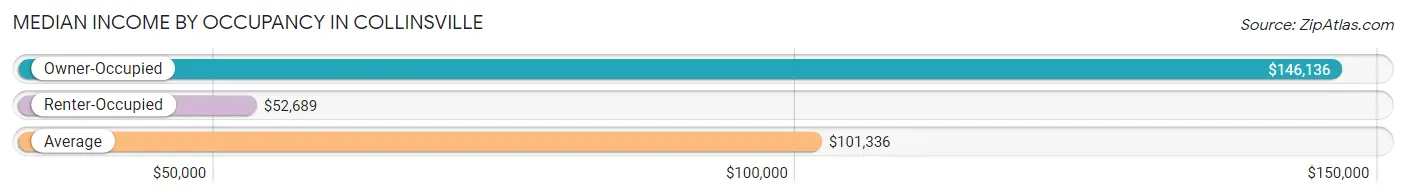
| Occupancy Type | # Households | Median Income |
| Owner-Occupied | 1,182 (74.7%) | $146,136 |
| Renter-Occupied | 401 (25.3%) | $52,689 |
| Average | 1,583 (100.0%) | $101,336 |
Occupancy by Householder Income Bracket in Collinsville
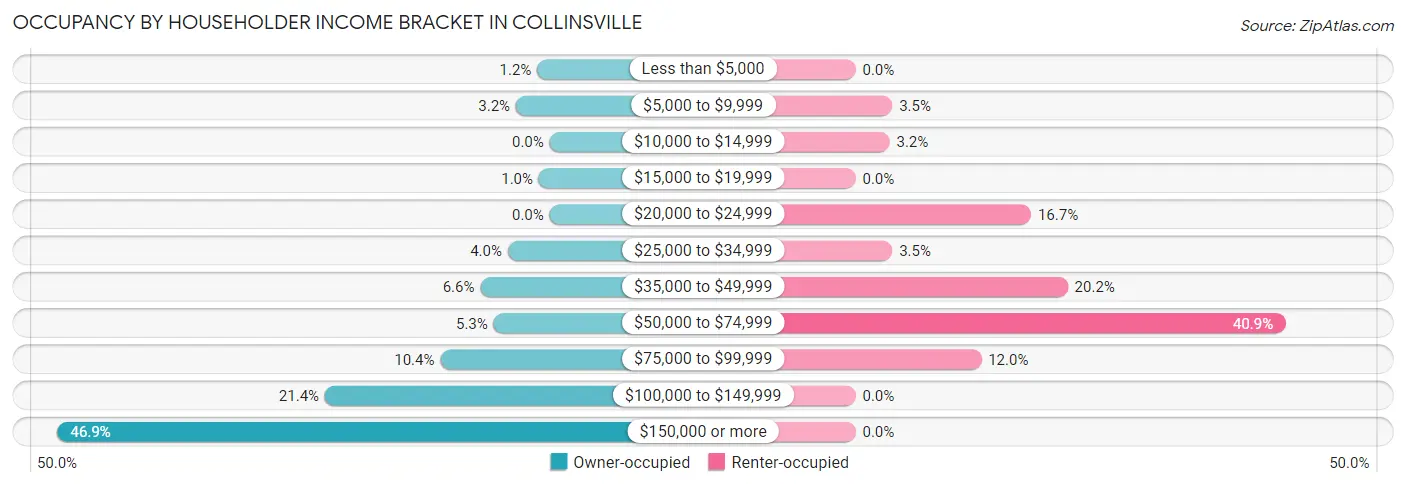
| Income Bracket | Owner-occupied | Renter-occupied |
| Less than $5,000 | 14 (1.2%) | 0 (0.0%) |
| $5,000 to $9,999 | 38 (3.2%) | 14 (3.5%) |
| $10,000 to $14,999 | 0 (0.0%) | 13 (3.2%) |
| $15,000 to $19,999 | 12 (1.0%) | 0 (0.0%) |
| $20,000 to $24,999 | 0 (0.0%) | 67 (16.7%) |
| $25,000 to $34,999 | 47 (4.0%) | 14 (3.5%) |
| $35,000 to $49,999 | 78 (6.6%) | 81 (20.2%) |
| $50,000 to $74,999 | 63 (5.3%) | 164 (40.9%) |
| $75,000 to $99,999 | 123 (10.4%) | 48 (12.0%) |
| $100,000 to $149,999 | 253 (21.4%) | 0 (0.0%) |
| $150,000 or more | 554 (46.9%) | 0 (0.0%) |
| Total | 1,182 (100.0%) | 401 (100.0%) |
Monthly Housing Cost Tiers in Collinsville
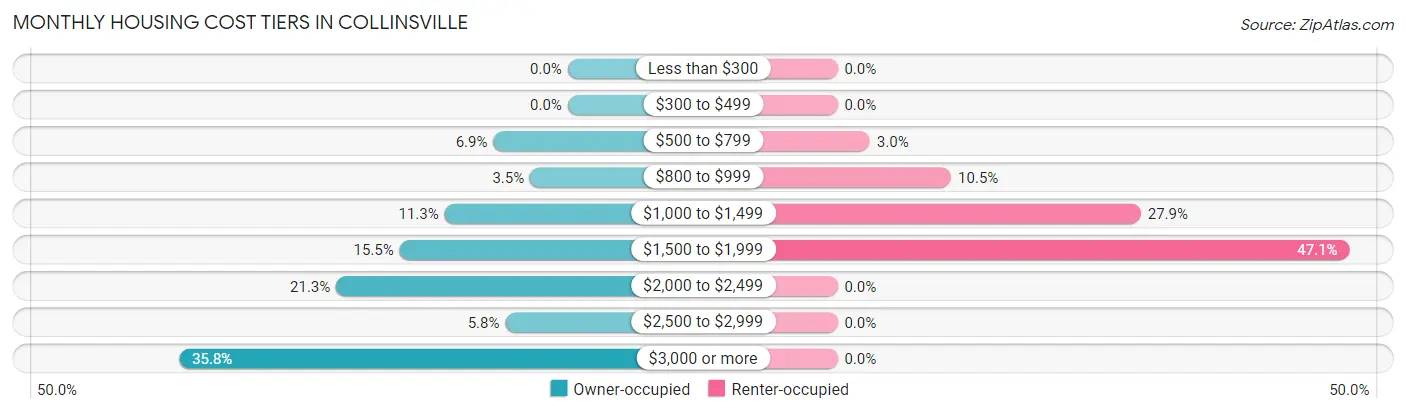
| Monthly Cost | Owner-occupied | Renter-occupied |
| Less than $300 | 0 (0.0%) | 0 (0.0%) |
| $300 to $499 | 0 (0.0%) | 0 (0.0%) |
| $500 to $799 | 81 (6.9%) | 12 (3.0%) |
| $800 to $999 | 41 (3.5%) | 42 (10.5%) |
| $1,000 to $1,499 | 134 (11.3%) | 112 (27.9%) |
| $1,500 to $1,999 | 183 (15.5%) | 189 (47.1%) |
| $2,000 to $2,499 | 252 (21.3%) | 0 (0.0%) |
| $2,500 to $2,999 | 68 (5.8%) | 0 (0.0%) |
| $3,000 or more | 423 (35.8%) | 0 (0.0%) |
| Total | 1,182 (100.0%) | 401 (100.0%) |
Physical Housing Characteristics in Collinsville
Housing Structures in Collinsville
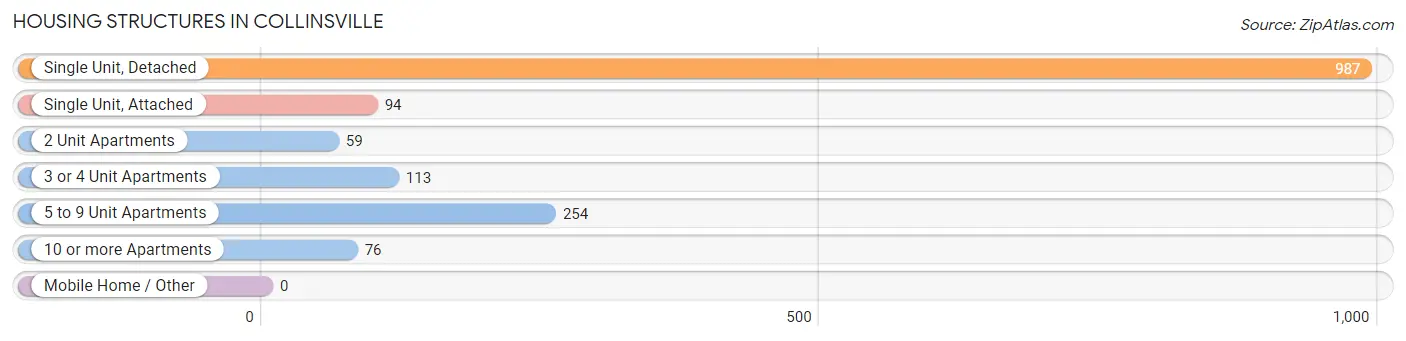
| Structure Type | # Housing Units | % Housing Units |
| Single Unit, Detached | 987 | 62.4% |
| Single Unit, Attached | 94 | 5.9% |
| 2 Unit Apartments | 59 | 3.7% |
| 3 or 4 Unit Apartments | 113 | 7.1% |
| 5 to 9 Unit Apartments | 254 | 16.1% |
| 10 or more Apartments | 76 | 4.8% |
| Mobile Home / Other | 0 | 0.0% |
| Total | 1,583 | 100.0% |
Housing Structures by Occupancy in Collinsville
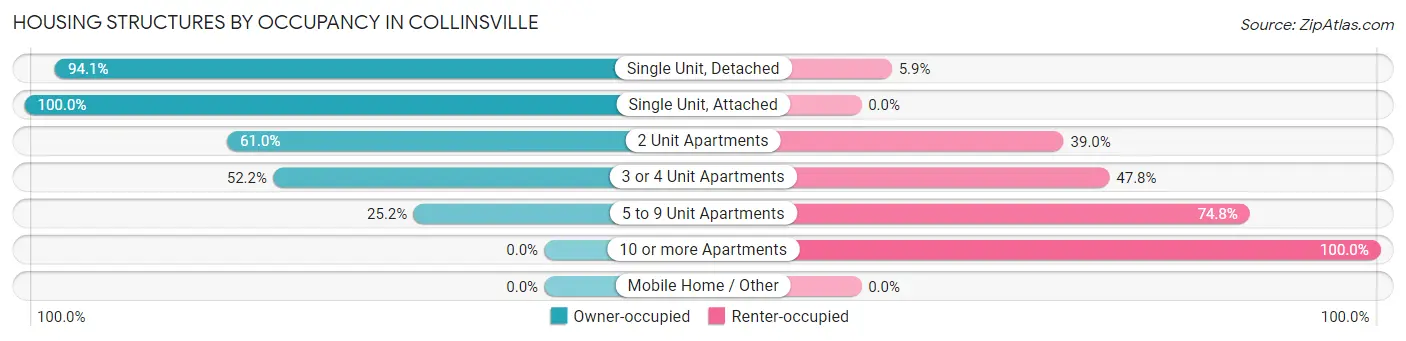
| Structure Type | Owner-occupied | Renter-occupied |
| Single Unit, Detached | 929 (94.1%) | 58 (5.9%) |
| Single Unit, Attached | 94 (100.0%) | 0 (0.0%) |
| 2 Unit Apartments | 36 (61.0%) | 23 (39.0%) |
| 3 or 4 Unit Apartments | 59 (52.2%) | 54 (47.8%) |
| 5 to 9 Unit Apartments | 64 (25.2%) | 190 (74.8%) |
| 10 or more Apartments | 0 (0.0%) | 76 (100.0%) |
| Mobile Home / Other | 0 (0.0%) | 0 (0.0%) |
| Total | 1,182 (74.7%) | 401 (25.3%) |
Housing Structures by Number of Rooms in Collinsville
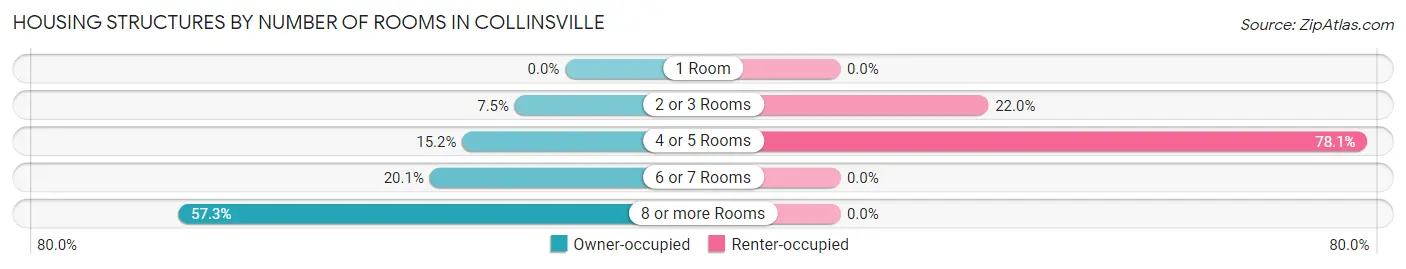
| Number of Rooms | Owner-occupied | Renter-occupied |
| 1 Room | 0 (0.0%) | 0 (0.0%) |
| 2 or 3 Rooms | 88 (7.4%) | 88 (22.0%) |
| 4 or 5 Rooms | 180 (15.2%) | 313 (78.0%) |
| 6 or 7 Rooms | 237 (20.1%) | 0 (0.0%) |
| 8 or more Rooms | 677 (57.3%) | 0 (0.0%) |
| Total | 1,182 (100.0%) | 401 (100.0%) |
Housing Structure by Heating Type in Collinsville
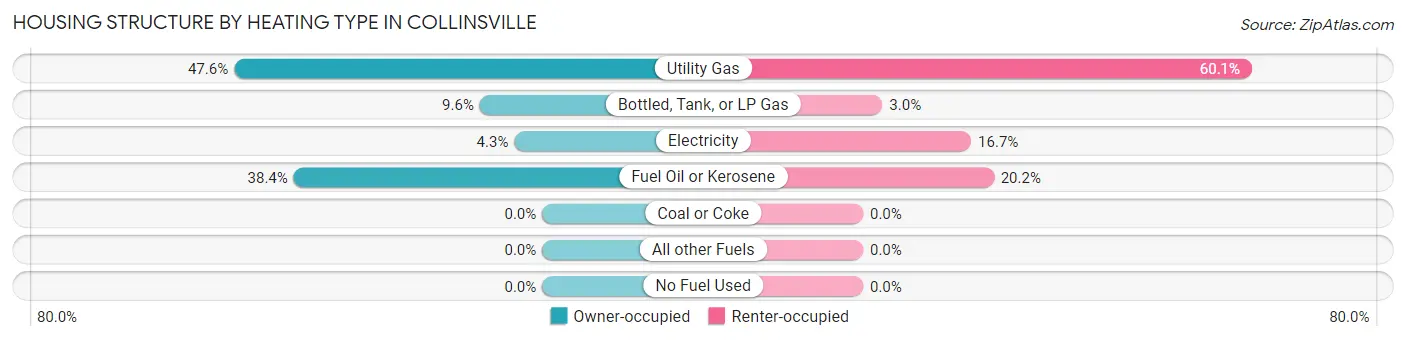
| Heating Type | Owner-occupied | Renter-occupied |
| Utility Gas | 563 (47.6%) | 241 (60.1%) |
| Bottled, Tank, or LP Gas | 114 (9.6%) | 12 (3.0%) |
| Electricity | 51 (4.3%) | 67 (16.7%) |
| Fuel Oil or Kerosene | 454 (38.4%) | 81 (20.2%) |
| Coal or Coke | 0 (0.0%) | 0 (0.0%) |
| All other Fuels | 0 (0.0%) | 0 (0.0%) |
| No Fuel Used | 0 (0.0%) | 0 (0.0%) |
| Total | 1,182 (100.0%) | 401 (100.0%) |
Household Vehicle Usage in Collinsville
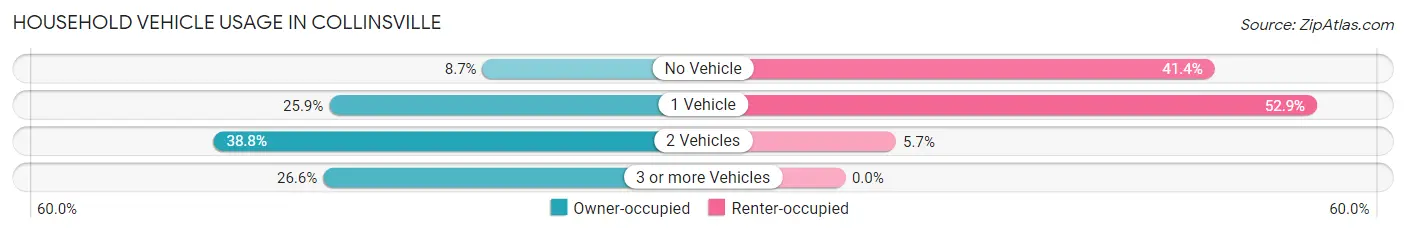
| Vehicles per Household | Owner-occupied | Renter-occupied |
| No Vehicle | 103 (8.7%) | 166 (41.4%) |
| 1 Vehicle | 306 (25.9%) | 212 (52.9%) |
| 2 Vehicles | 459 (38.8%) | 23 (5.7%) |
| 3 or more Vehicles | 314 (26.6%) | 0 (0.0%) |
| Total | 1,182 (100.0%) | 401 (100.0%) |
Real Estate & Mortgages in Collinsville
Real Estate and Mortgage Overview in Collinsville
| Characteristic | Without Mortgage | With Mortgage |
| Housing Units | 229 | 953 |
| Median Property Value | $286,000 | $370,900 |
| Median Household Income | $131,477 | $453 |
| Monthly Housing Costs | $1,192 | $423 |
| Real Estate Taxes | $7,212 | $38 |
Property Value by Mortgage Status in Collinsville
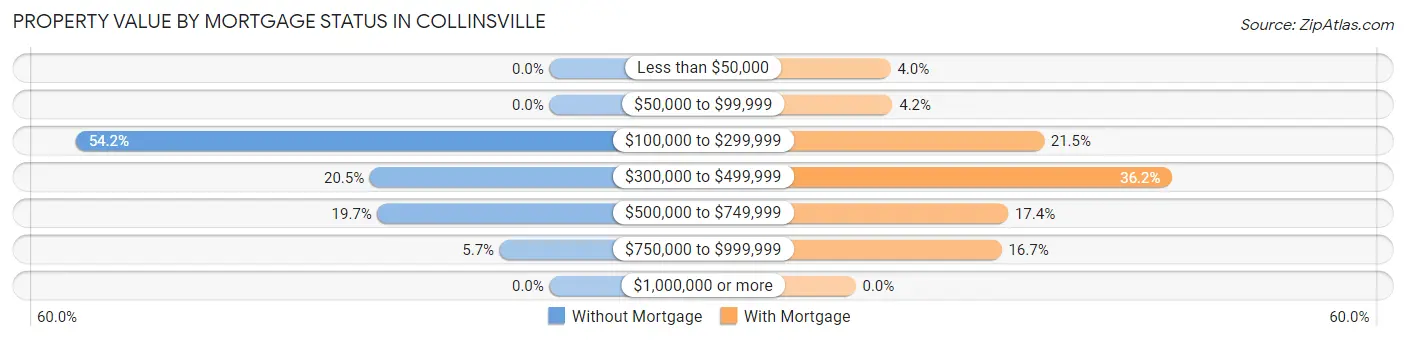
| Property Value | Without Mortgage | With Mortgage |
| Less than $50,000 | 0 (0.0%) | 38 (4.0%) |
| $50,000 to $99,999 | 0 (0.0%) | 40 (4.2%) |
| $100,000 to $299,999 | 124 (54.1%) | 205 (21.5%) |
| $300,000 to $499,999 | 47 (20.5%) | 345 (36.2%) |
| $500,000 to $749,999 | 45 (19.7%) | 166 (17.4%) |
| $750,000 to $999,999 | 13 (5.7%) | 159 (16.7%) |
| $1,000,000 or more | 0 (0.0%) | 0 (0.0%) |
| Total | 229 (100.0%) | 953 (100.0%) |
Household Income by Mortgage Status in Collinsville
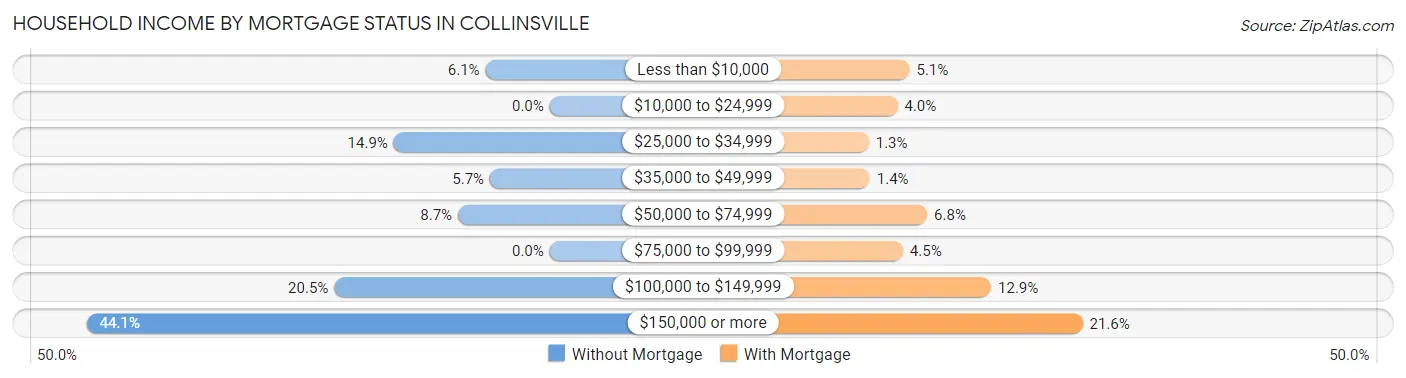
| Household Income | Without Mortgage | With Mortgage |
| Less than $10,000 | 14 (6.1%) | 49 (5.1%) |
| $10,000 to $24,999 | 0 (0.0%) | 38 (4.0%) |
| $25,000 to $34,999 | 34 (14.8%) | 12 (1.3%) |
| $35,000 to $49,999 | 13 (5.7%) | 13 (1.4%) |
| $50,000 to $74,999 | 20 (8.7%) | 65 (6.8%) |
| $75,000 to $99,999 | 0 (0.0%) | 43 (4.5%) |
| $100,000 to $149,999 | 47 (20.5%) | 123 (12.9%) |
| $150,000 or more | 101 (44.1%) | 206 (21.6%) |
| Total | 229 (100.0%) | 953 (100.0%) |
Property Value to Household Income Ratio in Collinsville
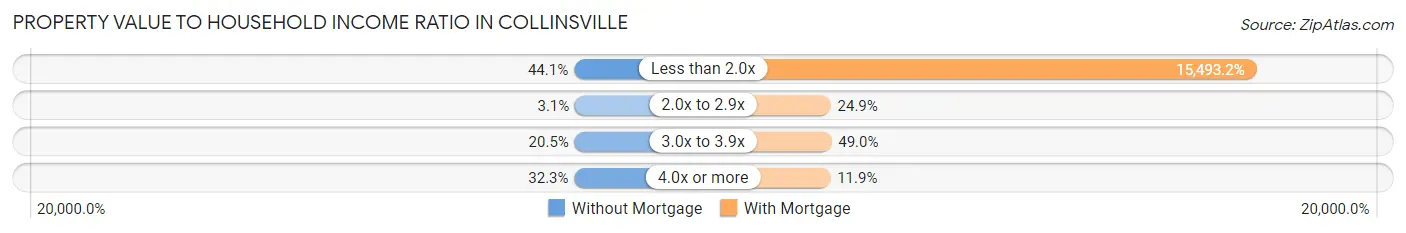
| Value-to-Income Ratio | Without Mortgage | With Mortgage |
| Less than 2.0x | 101 (44.1%) | 147,650 (15,493.2%) |
| 2.0x to 2.9x | 7 (3.1%) | 237 (24.9%) |
| 3.0x to 3.9x | 47 (20.5%) | 467 (49.0%) |
| 4.0x or more | 74 (32.3%) | 113 (11.9%) |
| Total | 229 (100.0%) | 953 (100.0%) |
Real Estate Taxes by Mortgage Status in Collinsville
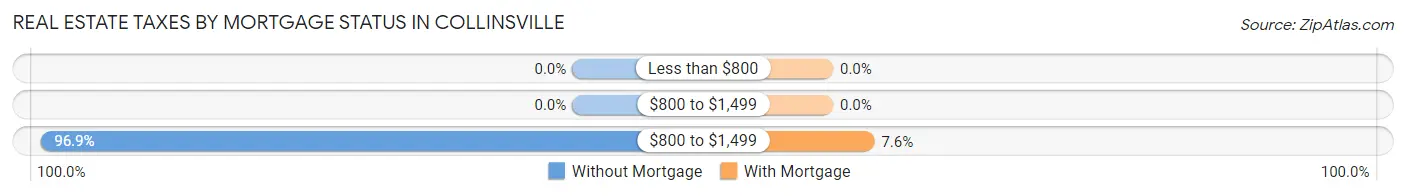
| Property Taxes | Without Mortgage | With Mortgage |
| Less than $800 | 0 (0.0%) | 0 (0.0%) |
| $800 to $1,499 | 0 (0.0%) | 0 (0.0%) |
| $800 to $1,499 | 222 (96.9%) | 72 (7.6%) |
| Total | 229 (100.0%) | 953 (100.0%) |
Health & Disability in Collinsville
Health Insurance Coverage by Age in Collinsville
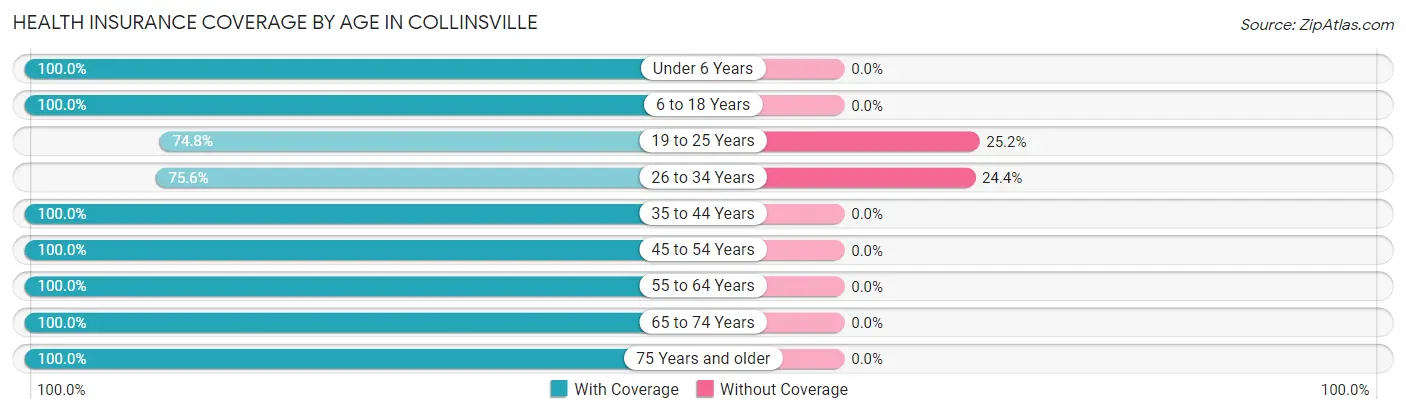
| Age Bracket | With Coverage | Without Coverage |
| Under 6 Years | 203 (100.0%) | 0 (0.0%) |
| 6 to 18 Years | 642 (100.0%) | 0 (0.0%) |
| 19 to 25 Years | 211 (74.8%) | 71 (25.2%) |
| 26 to 34 Years | 186 (75.6%) | 60 (24.4%) |
| 35 to 44 Years | 543 (100.0%) | 0 (0.0%) |
| 45 to 54 Years | 334 (100.0%) | 0 (0.0%) |
| 55 to 64 Years | 640 (100.0%) | 0 (0.0%) |
| 65 to 74 Years | 351 (100.0%) | 0 (0.0%) |
| 75 Years and older | 410 (100.0%) | 0 (0.0%) |
| Total | 3,520 (96.4%) | 131 (3.6%) |
Health Insurance Coverage by Citizenship Status in Collinsville
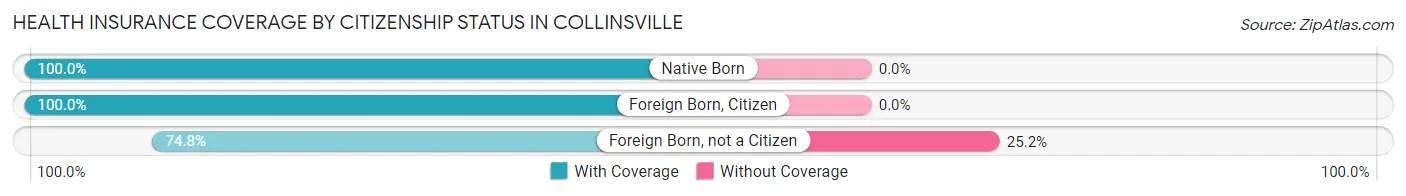
| Citizenship Status | With Coverage | Without Coverage |
| Native Born | 203 (100.0%) | 0 (0.0%) |
| Foreign Born, Citizen | 642 (100.0%) | 0 (0.0%) |
| Foreign Born, not a Citizen | 211 (74.8%) | 71 (25.2%) |
Health Insurance Coverage by Household Income in Collinsville
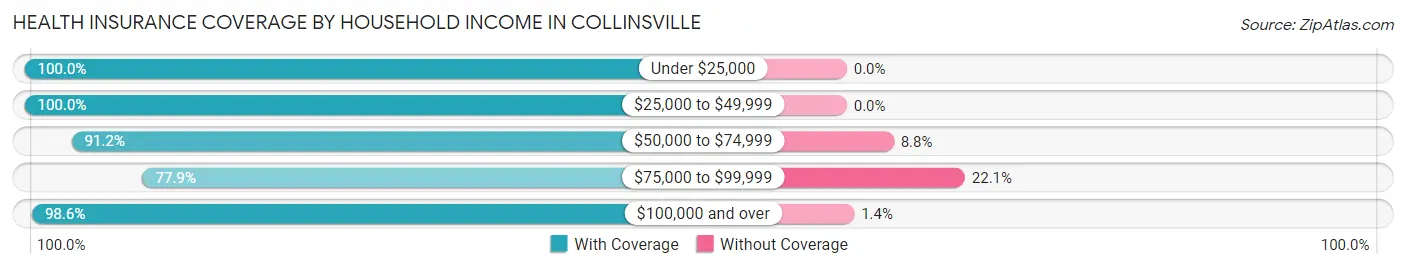
| Household Income | With Coverage | Without Coverage |
| Under $25,000 | 158 (100.0%) | 0 (0.0%) |
| $25,000 to $49,999 | 303 (100.0%) | 0 (0.0%) |
| $50,000 to $74,999 | 249 (91.2%) | 24 (8.8%) |
| $75,000 to $99,999 | 250 (77.9%) | 71 (22.1%) |
| $100,000 and over | 2,555 (98.6%) | 36 (1.4%) |
Public vs Private Health Insurance Coverage by Age in Collinsville
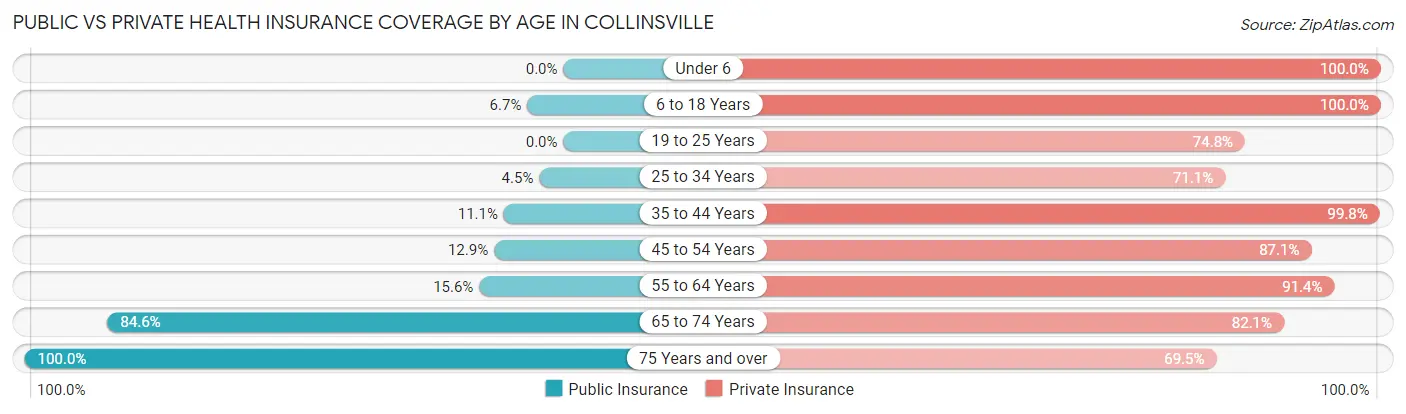
| Age Bracket | Public Insurance | Private Insurance |
| Under 6 | 0 (0.0%) | 203 (100.0%) |
| 6 to 18 Years | 43 (6.7%) | 642 (100.0%) |
| 19 to 25 Years | 0 (0.0%) | 211 (74.8%) |
| 25 to 34 Years | 11 (4.5%) | 175 (71.1%) |
| 35 to 44 Years | 60 (11.1%) | 542 (99.8%) |
| 45 to 54 Years | 43 (12.9%) | 291 (87.1%) |
| 55 to 64 Years | 100 (15.6%) | 585 (91.4%) |
| 65 to 74 Years | 297 (84.6%) | 288 (82.1%) |
| 75 Years and over | 410 (100.0%) | 285 (69.5%) |
| Total | 964 (26.4%) | 3,222 (88.2%) |
Disability Status by Sex by Age in Collinsville
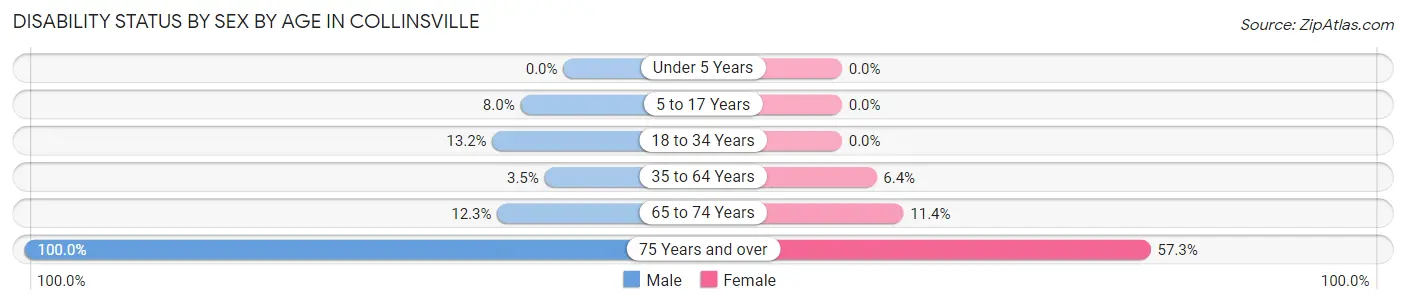
| Age Bracket | Male | Female |
| Under 5 Years | 0 (0.0%) | 0 (0.0%) |
| 5 to 17 Years | 25 (8.0%) | 0 (0.0%) |
| 18 to 34 Years | 22 (13.2%) | 0 (0.0%) |
| 35 to 64 Years | 30 (3.5%) | 42 (6.4%) |
| 65 to 74 Years | 13 (12.3%) | 28 (11.4%) |
| 75 Years and over | 89 (100.0%) | 184 (57.3%) |
Disability Class by Sex by Age in Collinsville
Disability Class: Hearing Difficulty
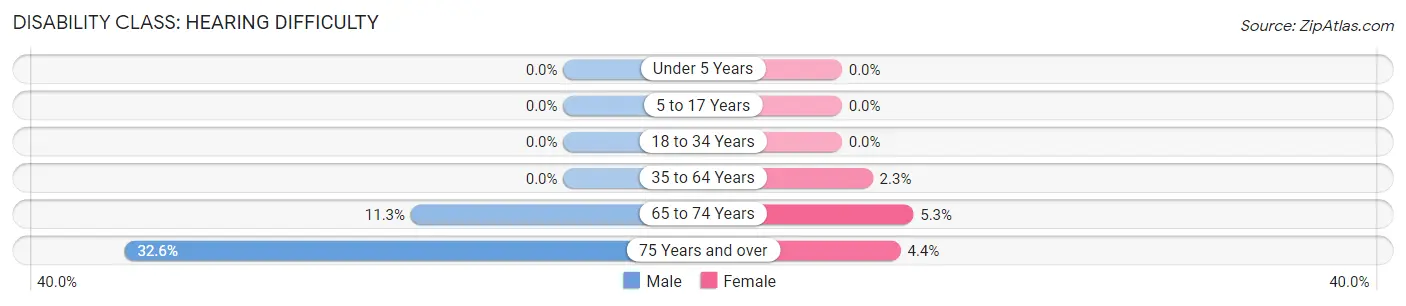
| Age Bracket | Male | Female |
| Under 5 Years | 0 (0.0%) | 0 (0.0%) |
| 5 to 17 Years | 0 (0.0%) | 0 (0.0%) |
| 18 to 34 Years | 0 (0.0%) | 0 (0.0%) |
| 35 to 64 Years | 0 (0.0%) | 15 (2.3%) |
| 65 to 74 Years | 12 (11.3%) | 13 (5.3%) |
| 75 Years and over | 29 (32.6%) | 14 (4.4%) |
Disability Class: Vision Difficulty
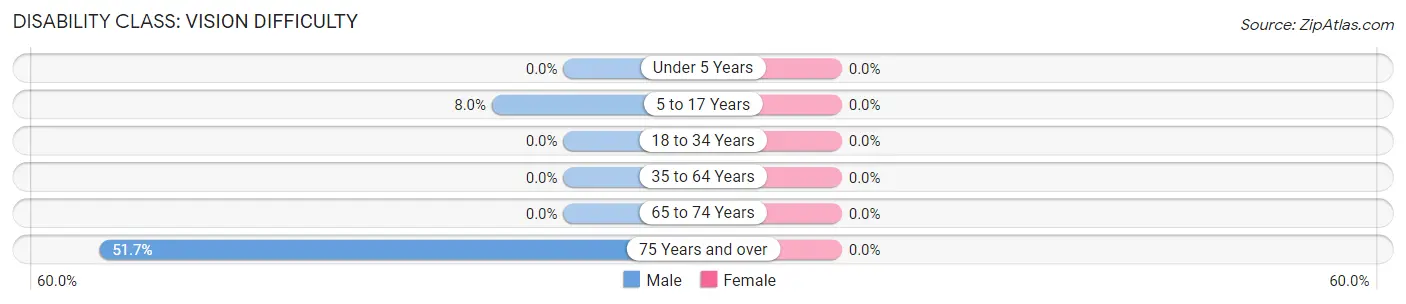
| Age Bracket | Male | Female |
| Under 5 Years | 0 (0.0%) | 0 (0.0%) |
| 5 to 17 Years | 25 (8.0%) | 0 (0.0%) |
| 18 to 34 Years | 0 (0.0%) | 0 (0.0%) |
| 35 to 64 Years | 0 (0.0%) | 0 (0.0%) |
| 65 to 74 Years | 0 (0.0%) | 0 (0.0%) |
| 75 Years and over | 46 (51.7%) | 0 (0.0%) |
Disability Class: Cognitive Difficulty
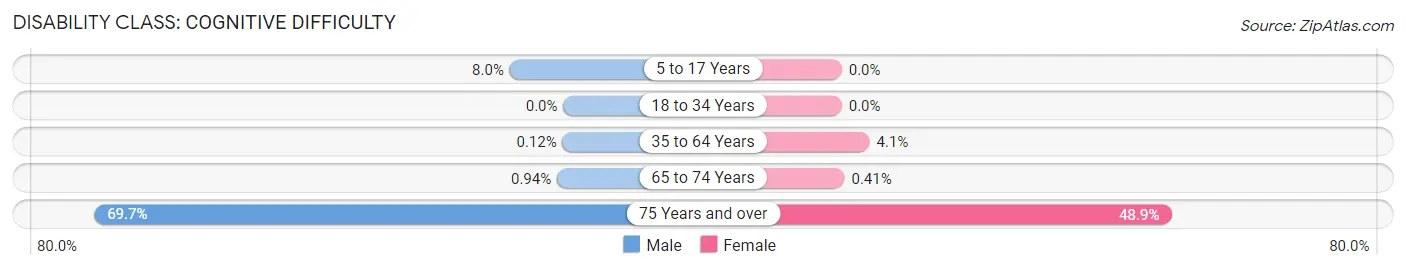
| Age Bracket | Male | Female |
| 5 to 17 Years | 25 (8.0%) | 0 (0.0%) |
| 18 to 34 Years | 0 (0.0%) | 0 (0.0%) |
| 35 to 64 Years | 1 (0.1%) | 27 (4.1%) |
| 65 to 74 Years | 1 (0.9%) | 1 (0.4%) |
| 75 Years and over | 62 (69.7%) | 157 (48.9%) |
Disability Class: Ambulatory Difficulty
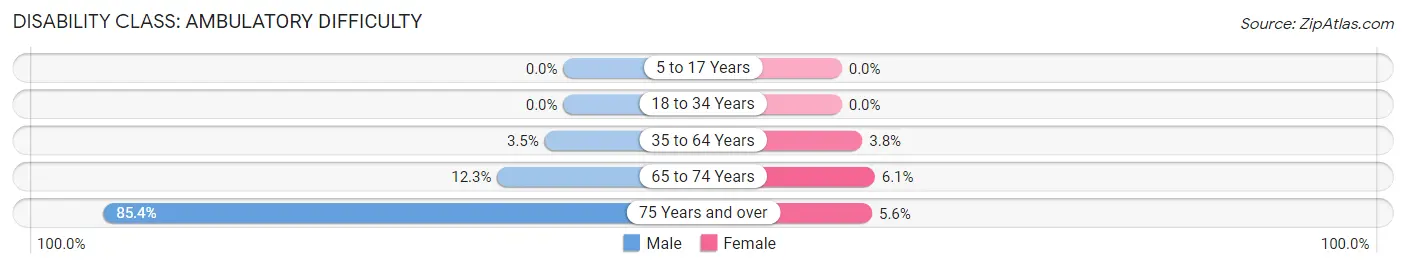
| Age Bracket | Male | Female |
| 5 to 17 Years | 0 (0.0%) | 0 (0.0%) |
| 18 to 34 Years | 0 (0.0%) | 0 (0.0%) |
| 35 to 64 Years | 30 (3.5%) | 25 (3.8%) |
| 65 to 74 Years | 13 (12.3%) | 15 (6.1%) |
| 75 Years and over | 76 (85.4%) | 18 (5.6%) |
Disability Class: Self-Care Difficulty
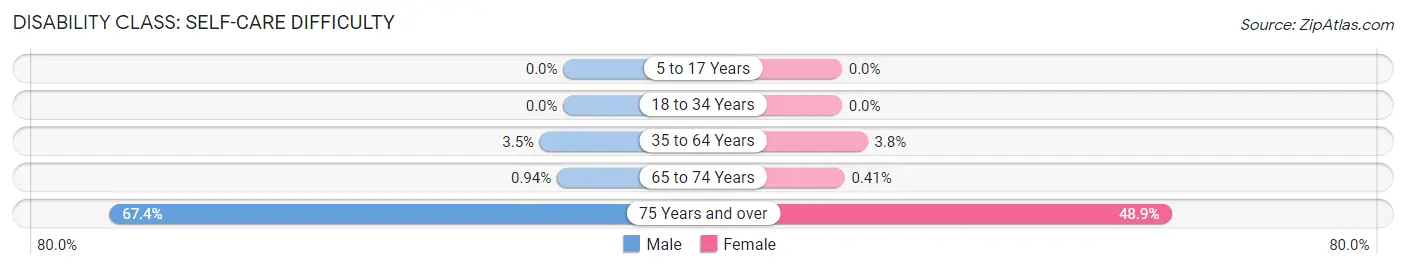
| Age Bracket | Male | Female |
| 5 to 17 Years | 0 (0.0%) | 0 (0.0%) |
| 18 to 34 Years | 0 (0.0%) | 0 (0.0%) |
| 35 to 64 Years | 30 (3.5%) | 25 (3.8%) |
| 65 to 74 Years | 1 (0.9%) | 1 (0.4%) |
| 75 Years and over | 60 (67.4%) | 157 (48.9%) |
Technology Access in Collinsville
Computing Device Access in Collinsville
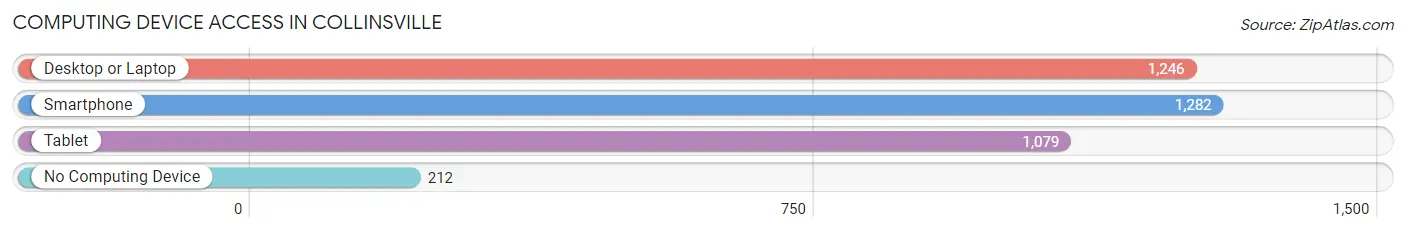
| Device Type | # Households | % Households |
| Desktop or Laptop | 1,246 | 78.7% |
| Smartphone | 1,282 | 81.0% |
| Tablet | 1,079 | 68.2% |
| No Computing Device | 212 | 13.4% |
| Total | 1,583 | 100.0% |
Internet Access in Collinsville
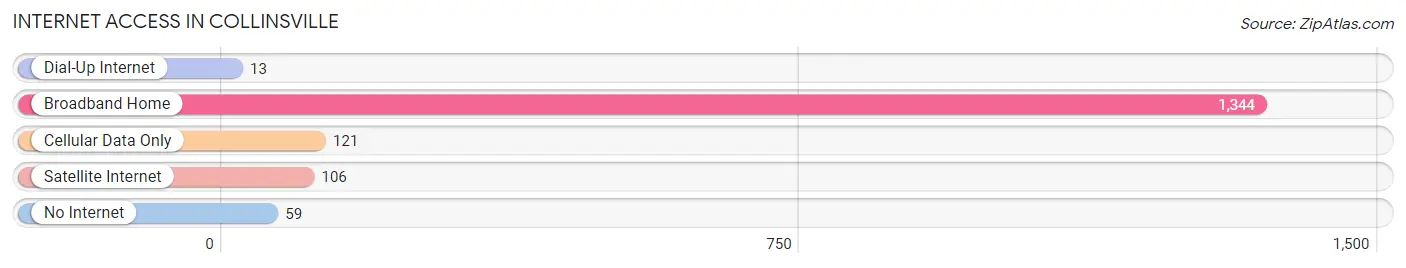
| Internet Type | # Households | % Households |
| Dial-Up Internet | 13 | 0.8% |
| Broadband Home | 1,344 | 84.9% |
| Cellular Data Only | 121 | 7.6% |
| Satellite Internet | 106 | 6.7% |
| No Internet | 59 | 3.7% |
| Total | 1,583 | 100.0% |
Collinsville Summary
Connville, Connecticut is a small town located in Hartford County, Connecticut. It is situated in the northeast corner of the state, just south of the Massachusetts border. The town was founded in 1672 and is the oldest continuously inhabited settlement in the state. The town is named after the Connecticut River, which runs through it.
History
The area that is now Collinsville was originally inhabited by the Wangunks, a Native American tribe. The Wangunks were part of the Algonquin Nation and were known for their farming and fishing. The first European settlers arrived in the area in 1672 and established a trading post. The settlement was named Collinsville after the Connecticut River, which runs through it.
The town was officially incorporated in 1796 and was primarily an agricultural community. The town was known for its tobacco, corn, and dairy farms. In the 19th century, the town began to industrialize and several factories were built. The Collins Company, which manufactured tools and machinery, was one of the most successful businesses in the town.
Geography
Collinsville is located in the northeast corner of Connecticut, just south of the Massachusetts border. The town is situated on the banks of the Connecticut River and is bordered by the towns of Canton, Burlington, and Barkhamsted. The town has a total area of 8.3 square miles, of which 8.2 square miles is land and 0.1 square miles is water.
The terrain of the town is mostly flat, with some rolling hills. The highest point in the town is the summit of Talcott Mountain, which has an elevation of 1,072 feet. The town is home to several parks, including the Collinsville Historic District, which is listed on the National Register of Historic Places.
Economy
Collinsville has a diverse economy, with a mix of manufacturing, retail, and service industries. The town is home to several large employers, including the Collins Company, which manufactures tools and machinery, and the Collinsville Savings Bank. The town also has a number of small businesses, including restaurants, shops, and professional services.
The town is also home to several tourist attractions, including the Collinsville Canoe and Kayak Race, which is held annually in June. The race attracts thousands of visitors each year and is one of the town’s biggest events.
Demographics
As of the 2010 census, the town had a population of 4,741. The racial makeup of the town was 94.3% White, 1.7% African American, 0.3% Native American, 1.2% Asian, 0.1% Pacific Islander, 0.7% from other races, and 1.9% from two or more races. Hispanic or Latino of any race were 3.2% of the population.
The median income for a household in the town was $60,938, and the median income for a family was $71,944. The per capita income for the town was $27,945. About 4.3% of families and 5.7% of the population were below the poverty line, including 6.3% of those under age 18 and 4.2% of those age 65 or over.
Collinsville is a small town with a rich history and a diverse economy. The town is home to several large employers and a number of small businesses. The town also has a number of tourist attractions, including the Collinsville Canoe and Kayak Race. The town has a population of 4,741, with a median income of $60,938.
Common Questions
What is Per Capita Income in Collinsville?
Per Capita income in Collinsville is $71,983.
What is the Median Family Income in Collinsville?
Median Family Income in Collinsville is $191,250.
What is the Median Household income in Collinsville?
Median Household Income in Collinsville is $101,336.
What is Income or Wage Gap in Collinsville?
Income or Wage Gap in Collinsville is 20.6%.
Women in Collinsville earn 79.4 cents for every dollar earned by a man.
What is Inequality or Gini Index in Collinsville?
Inequality or Gini Index in Collinsville is 0.52.
What is the Total Population of Collinsville?
Total Population of Collinsville is 3,750.
What is the Total Male Population of Collinsville?
Total Male Population of Collinsville is 1,688.
What is the Total Female Population of Collinsville?
Total Female Population of Collinsville is 2,062.
What is the Ratio of Males per 100 Females in Collinsville?
There are 81.86 Males per 100 Females in Collinsville.
What is the Ratio of Females per 100 Males in Collinsville?
There are 122.16 Females per 100 Males in Collinsville.
What is the Median Population Age in Collinsville?
Median Population Age in Collinsville is 42.4 Years.
What is the Average Family Size in Collinsville
Average Family Size in Collinsville is 3.2 People.
What is the Average Household Size in Collinsville
Average Household Size in Collinsville is 2.3 People.
How Large is the Labor Force in Collinsville?
There are 1,968 People in the Labor Forcein in Collinsville.
What is the Percentage of People in the Labor Force in Collinsville?
64.3% of People are in the Labor Force in Collinsville.
What is the Unemployment Rate in Collinsville?
Unemployment Rate in Collinsville is 2.2%.