DuBois, PA Map & Demographics
DuBois Map
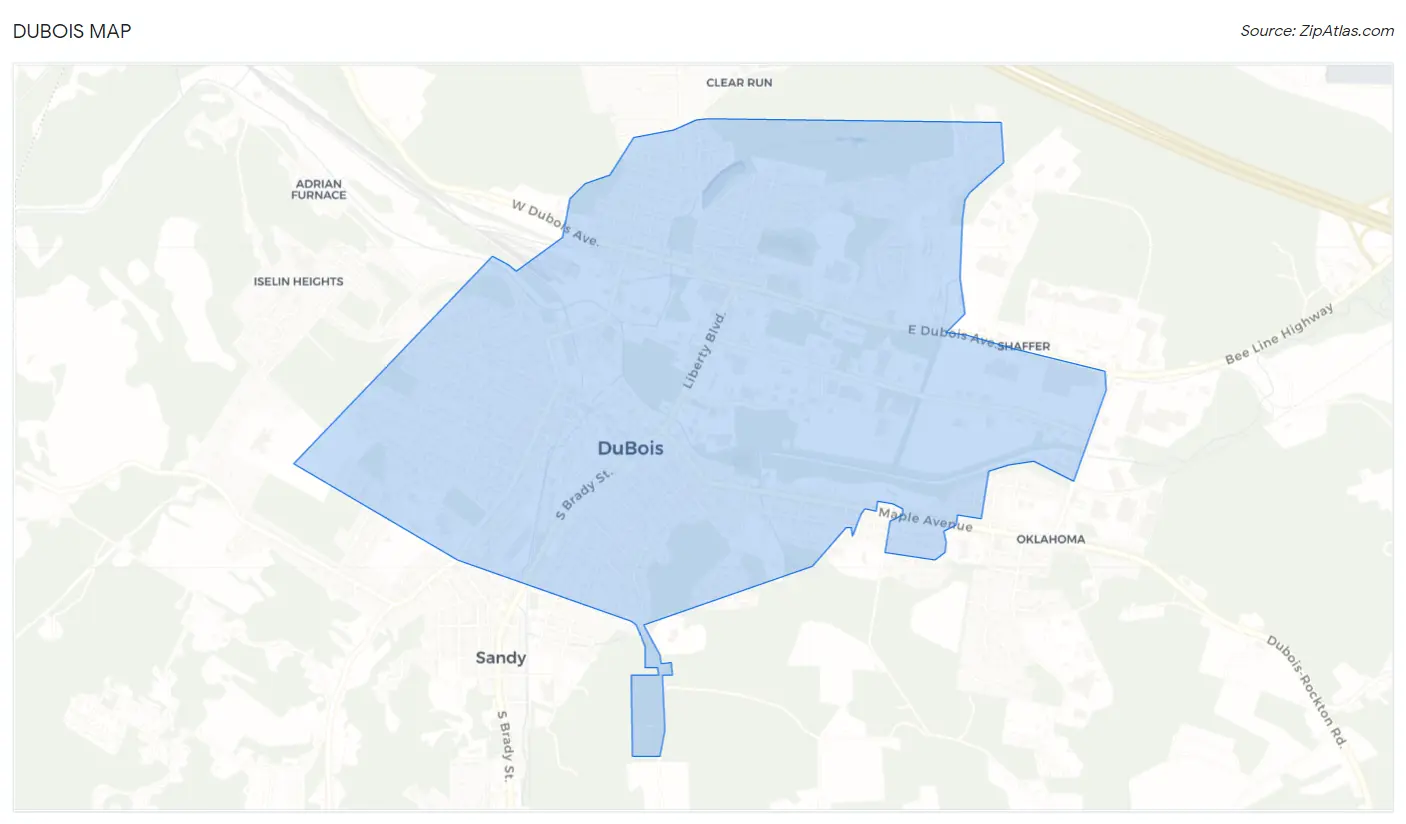
DuBois Overview
$30,041
PER CAPITA INCOME
$65,530
AVG FAMILY INCOME
$55,580
AVG HOUSEHOLD INCOME
22.4%
WAGE / INCOME GAP [ % ]
77.6¢/ $1
WAGE / INCOME GAP [ $ ]
$5,153
FAMILY INCOME DEFICIT
0.38
INEQUALITY / GINI INDEX
7,509
TOTAL POPULATION
3,758
MALE POPULATION
3,751
FEMALE POPULATION
100.19
MALES / 100 FEMALES
99.81
FEMALES / 100 MALES
37.7
MEDIAN AGE
3.1
AVG FAMILY SIZE
2.2
AVG HOUSEHOLD SIZE
4,077
LABOR FORCE [ PEOPLE ]
65.6%
PERCENT IN LABOR FORCE
4.7%
UNEMPLOYMENT RATE
DuBois Area Codes
Income in DuBois
Income Overview in DuBois
Per Capita Income in DuBois is $30,041, while median incomes of families and households are $65,530 and $55,580 respectively.
| Characteristic | Number | Measure |
| Per Capita Income | 7,509 | $30,041 |
| Median Family Income | 1,738 | $65,530 |
| Mean Family Income | 1,738 | $81,779 |
| Median Household Income | 3,372 | $55,580 |
| Mean Household Income | 3,372 | $64,308 |
| Income Deficit | 1,738 | $5,153 |
| Wage / Income Gap (%) | 7,509 | 22.39% |
| Wage / Income Gap ($) | 7,509 | 77.61¢ per $1 |
| Gini / Inequality Index | 7,509 | 0.38 |
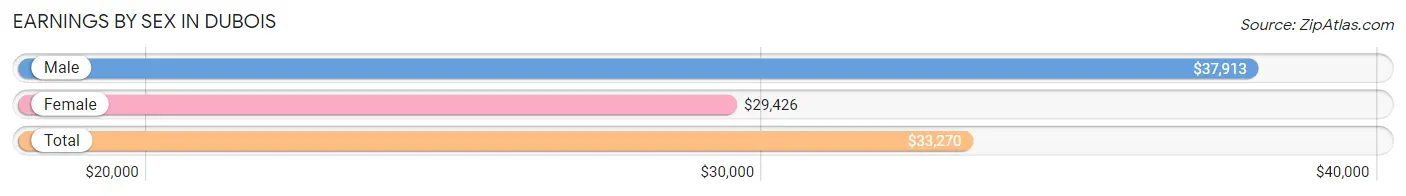
Earnings by Sex in DuBois
Average Earnings in DuBois are $33,270, $37,913 for men and $29,426 for women, a difference of 22.4%.
| Sex | Number | Average Earnings |
| Male | 2,292 (55.5%) | $37,913 |
| Female | 1,840 (44.5%) | $29,426 |
| Total | 4,132 (100.0%) | $33,270 |
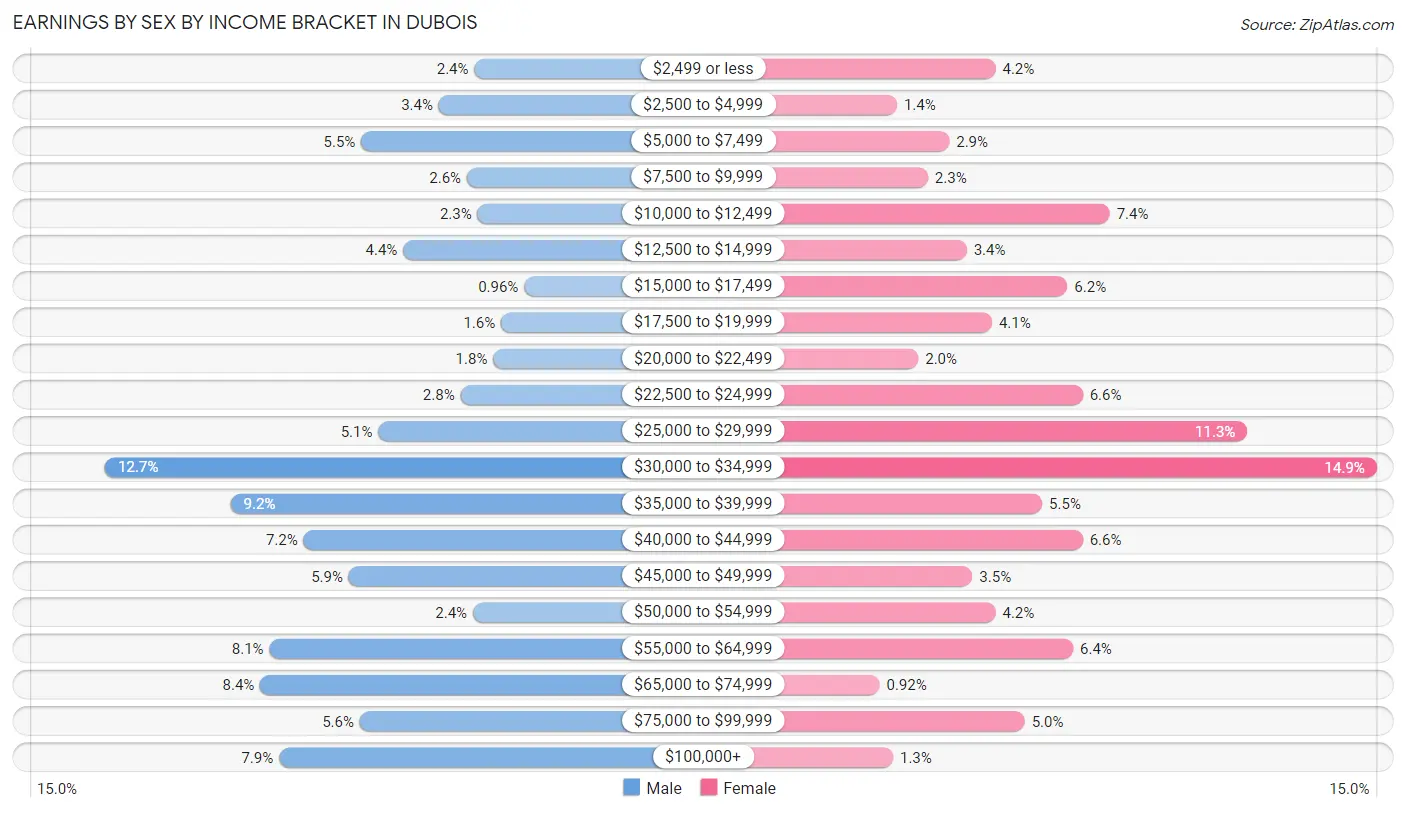
Earnings by Sex by Income Bracket in DuBois
The most common earnings brackets in DuBois are $30,000 to $34,999 for men (292 | 12.7%) and $30,000 to $34,999 for women (274 | 14.9%).
| Income | Male | Female |
| $2,499 or less | 54 (2.4%) | 77 (4.2%) |
| $2,500 to $4,999 | 77 (3.4%) | 26 (1.4%) |
| $5,000 to $7,499 | 127 (5.5%) | 53 (2.9%) |
| $7,500 to $9,999 | 59 (2.6%) | 42 (2.3%) |
| $10,000 to $12,499 | 52 (2.3%) | 136 (7.4%) |
| $12,500 to $14,999 | 100 (4.4%) | 62 (3.4%) |
| $15,000 to $17,499 | 22 (1.0%) | 114 (6.2%) |
| $17,500 to $19,999 | 37 (1.6%) | 75 (4.1%) |
| $20,000 to $22,499 | 42 (1.8%) | 37 (2.0%) |
| $22,500 to $24,999 | 63 (2.8%) | 122 (6.6%) |
| $25,000 to $29,999 | 116 (5.1%) | 207 (11.3%) |
| $30,000 to $34,999 | 292 (12.7%) | 274 (14.9%) |
| $35,000 to $39,999 | 211 (9.2%) | 101 (5.5%) |
| $40,000 to $44,999 | 164 (7.2%) | 122 (6.6%) |
| $45,000 to $49,999 | 135 (5.9%) | 65 (3.5%) |
| $50,000 to $54,999 | 55 (2.4%) | 77 (4.2%) |
| $55,000 to $64,999 | 186 (8.1%) | 117 (6.4%) |
| $65,000 to $74,999 | 192 (8.4%) | 17 (0.9%) |
| $75,000 to $99,999 | 128 (5.6%) | 92 (5.0%) |
| $100,000+ | 180 (7.9%) | 24 (1.3%) |
| Total | 2,292 (100.0%) | 1,840 (100.0%) |
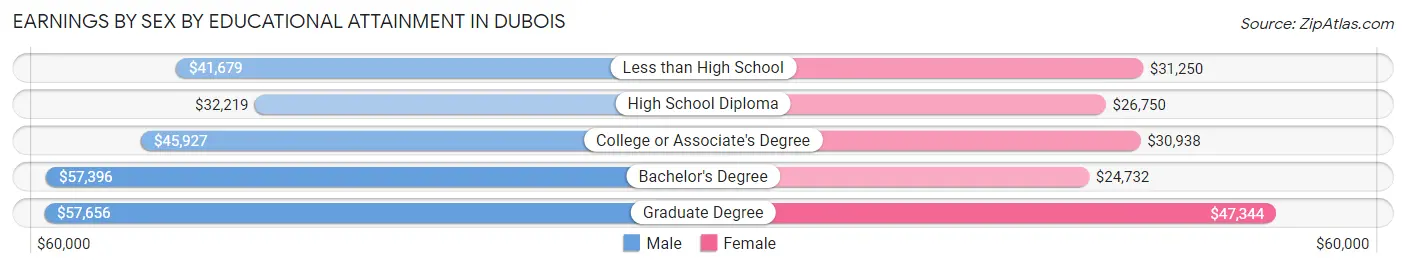
Earnings by Sex by Educational Attainment in DuBois
Average earnings in DuBois are $43,452 for men and $29,352 for women, a difference of 32.5%. Men with an educational attainment of graduate degree enjoy the highest average annual earnings of $57,656, while those with high school diploma education earn the least with $32,219. Women with an educational attainment of graduate degree earn the most with the average annual earnings of $47,344, while those with bachelor's degree education have the smallest earnings of $24,732.
| Educational Attainment | Male Income | Female Income |
| Less than High School | $41,679 | $31,250 |
| High School Diploma | $32,219 | $26,750 |
| College or Associate's Degree | $45,927 | $30,938 |
| Bachelor's Degree | $57,396 | $24,732 |
| Graduate Degree | $57,656 | $47,344 |
| Total | $43,452 | $29,352 |
Family Income in DuBois
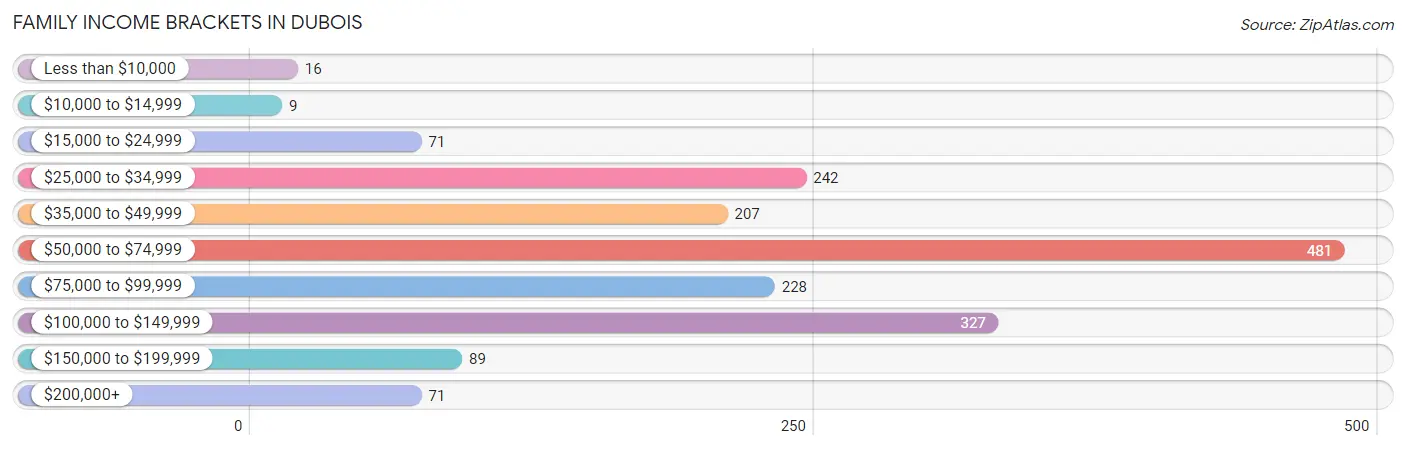
Family Income Brackets in DuBois
According to the DuBois family income data, there are 481 families falling into the $50,000 to $74,999 income range, which is the most common income bracket and makes up 27.7% of all families. Conversely, the $10,000 to $14,999 income bracket is the least frequent group with only 9 families (0.5%) belonging to this category.
| Income Bracket | # Families | % Families |
| Less than $10,000 | 16 | 0.9% |
| $10,000 to $14,999 | 9 | 0.5% |
| $15,000 to $24,999 | 71 | 4.1% |
| $25,000 to $34,999 | 242 | 13.9% |
| $35,000 to $49,999 | 207 | 11.9% |
| $50,000 to $74,999 | 481 | 27.7% |
| $75,000 to $99,999 | 228 | 13.1% |
| $100,000 to $149,999 | 327 | 18.8% |
| $150,000 to $199,999 | 89 | 5.1% |
| $200,000+ | 71 | 4.1% |
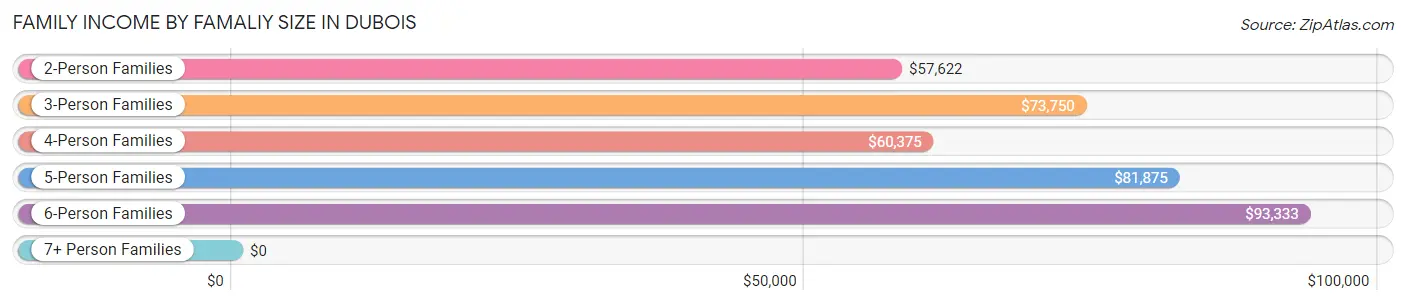
Family Income by Famaliy Size in DuBois
6-person families (110 | 6.3%) account for the highest median family income in DuBois with $93,333 per family, while 2-person families (842 | 48.4%) have the highest median income of $28,811 per family member.
| Income Bracket | # Families | Median Income |
| 2-Person Families | 842 (48.4%) | $57,622 |
| 3-Person Families | 431 (24.8%) | $73,750 |
| 4-Person Families | 248 (14.3%) | $60,375 |
| 5-Person Families | 92 (5.3%) | $81,875 |
| 6-Person Families | 110 (6.3%) | $93,333 |
| 7+ Person Families | 15 (0.9%) | $0 |
| Total | 1,738 (100.0%) | $65,530 |
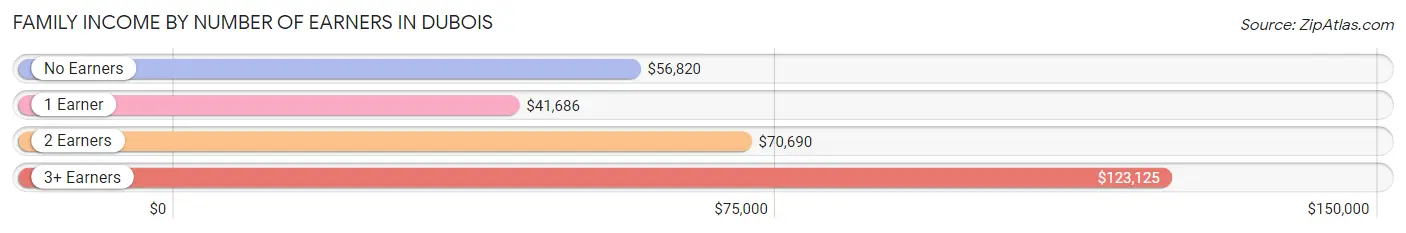
Family Income by Number of Earners in DuBois
The median family income in DuBois is $65,530, with families comprising 3+ earners (263) having the highest median family income of $123,125, while families with 1 earner (654) have the lowest median family income of $41,686, accounting for 15.1% and 37.6% of families, respectively.
| Number of Earners | # Families | Median Income |
| No Earners | 245 (14.1%) | $56,820 |
| 1 Earner | 654 (37.6%) | $41,686 |
| 2 Earners | 576 (33.1%) | $70,690 |
| 3+ Earners | 263 (15.1%) | $123,125 |
| Total | 1,738 (100.0%) | $65,530 |
Household Income in DuBois
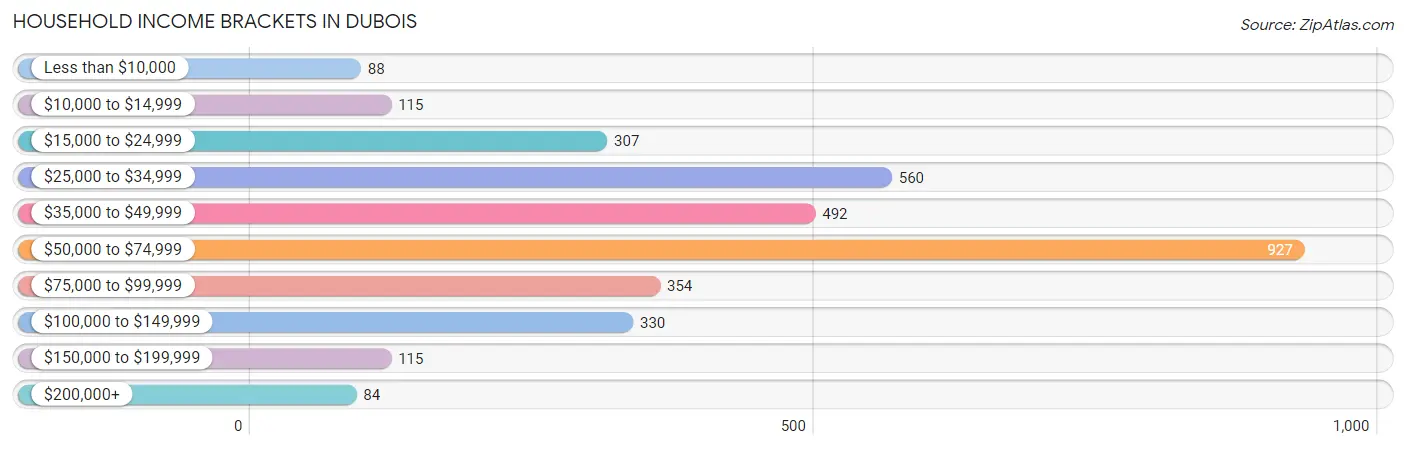
Household Income Brackets in DuBois
With 927 households falling in the category, the $50,000 to $74,999 income range is the most frequent in DuBois, accounting for 27.5% of all households. In contrast, only 84 households (2.5%) fall into the $200,000+ income bracket, making it the least populous group.
| Income Bracket | # Households | % Households |
| Less than $10,000 | 88 | 2.6% |
| $10,000 to $14,999 | 115 | 3.4% |
| $15,000 to $24,999 | 307 | 9.1% |
| $25,000 to $34,999 | 560 | 16.6% |
| $35,000 to $49,999 | 492 | 14.6% |
| $50,000 to $74,999 | 927 | 27.5% |
| $75,000 to $99,999 | 354 | 10.5% |
| $100,000 to $149,999 | 330 | 9.8% |
| $150,000 to $199,999 | 115 | 3.4% |
| $200,000+ | 84 | 2.5% |
Household Income by Householder Age in DuBois
The median household income in DuBois is $55,580, with the highest median household income of $58,355 found in the 45 to 64 years age bracket for the primary householder. A total of 1,104 households (32.7%) fall into this category. Meanwhile, the 15 to 24 years age bracket for the primary householder has the lowest median household income of $42,282, with 253 households (7.5%) in this group.
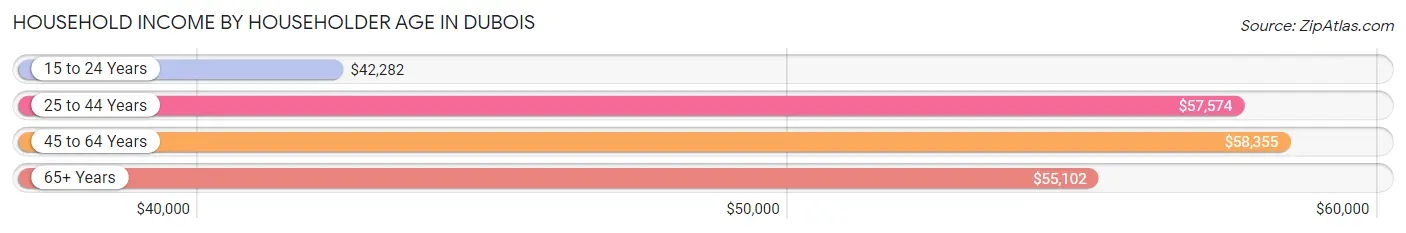
| Income Bracket | # Households | Median Income |
| 15 to 24 Years | 253 (7.5%) | $42,282 |
| 25 to 44 Years | 1,112 (33.0%) | $57,574 |
| 45 to 64 Years | 1,104 (32.7%) | $58,355 |
| 65+ Years | 903 (26.8%) | $55,102 |
| Total | 3,372 (100.0%) | $55,580 |
Poverty in DuBois
Income Below Poverty by Sex and Age in DuBois
With 8.1% poverty level for males and 11.3% for females among the residents of DuBois, 12 to 14 year old males and 15 year old females are the most vulnerable to poverty, with 32 males (22.7%) and 48 females (66.7%) in their respective age groups living below the poverty level.
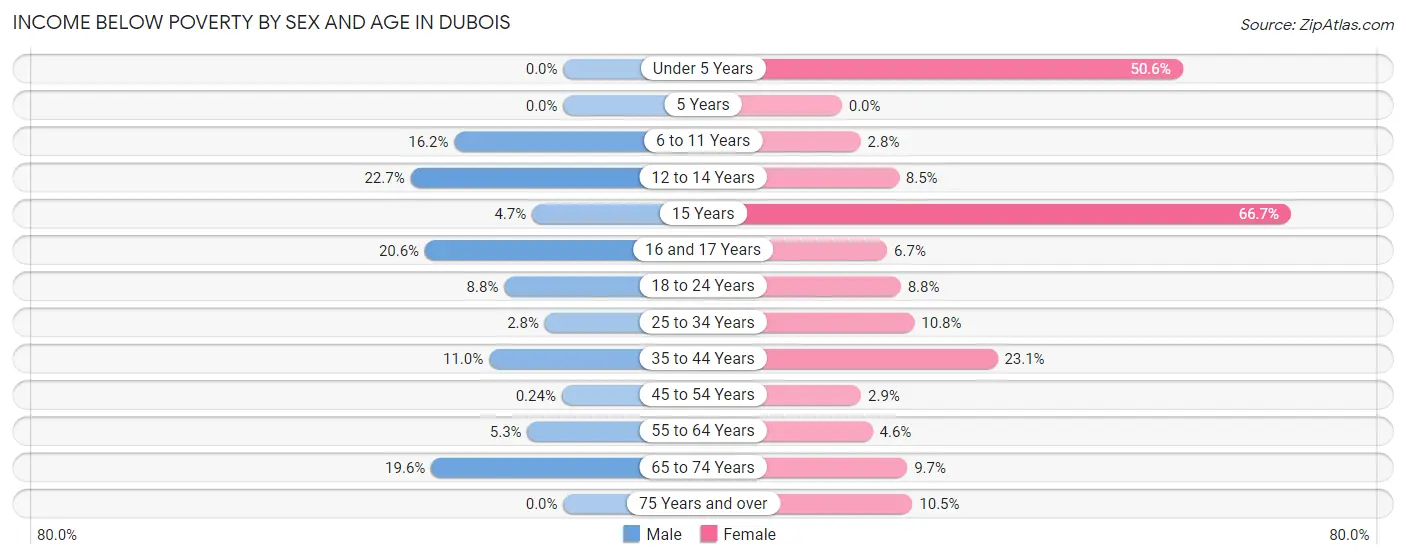
| Age Bracket | Male | Female |
| Under 5 Years | 0 (0.0%) | 43 (50.6%) |
| 5 Years | 0 (0.0%) | 0 (0.0%) |
| 6 to 11 Years | 29 (16.2%) | 7 (2.8%) |
| 12 to 14 Years | 32 (22.7%) | 20 (8.5%) |
| 15 Years | 2 (4.6%) | 48 (66.7%) |
| 16 and 17 Years | 30 (20.5%) | 6 (6.7%) |
| 18 to 24 Years | 39 (8.8%) | 26 (8.7%) |
| 25 to 34 Years | 19 (2.8%) | 55 (10.8%) |
| 35 to 44 Years | 43 (11.0%) | 101 (23.1%) |
| 45 to 54 Years | 1 (0.2%) | 11 (2.9%) |
| 55 to 64 Years | 22 (5.3%) | 26 (4.6%) |
| 65 to 74 Years | 84 (19.6%) | 40 (9.7%) |
| 75 Years and over | 0 (0.0%) | 33 (10.5%) |
| Total | 301 (8.1%) | 416 (11.3%) |
Income Above Poverty by Sex and Age in DuBois
According to the poverty statistics in DuBois, males aged under 5 years and females aged 5 years are the age groups that are most secure financially, with 100.0% of males and 100.0% of females in these age groups living above the poverty line.
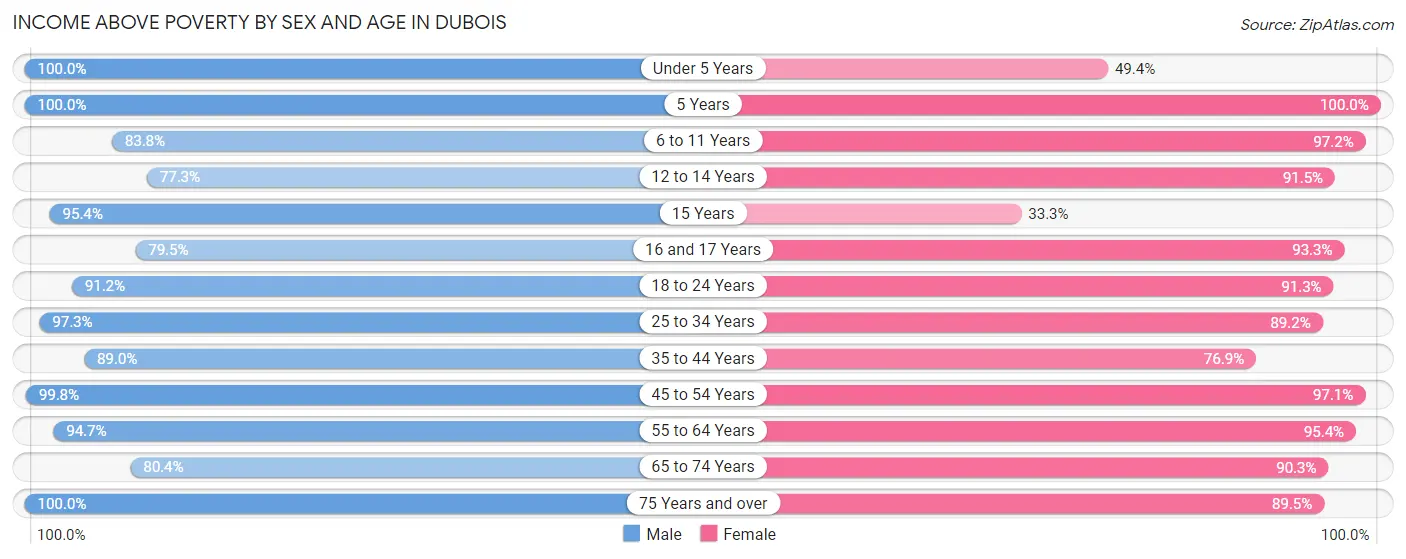
| Age Bracket | Male | Female |
| Under 5 Years | 152 (100.0%) | 42 (49.4%) |
| 5 Years | 66 (100.0%) | 44 (100.0%) |
| 6 to 11 Years | 150 (83.8%) | 243 (97.2%) |
| 12 to 14 Years | 109 (77.3%) | 216 (91.5%) |
| 15 Years | 41 (95.4%) | 24 (33.3%) |
| 16 and 17 Years | 116 (79.4%) | 83 (93.3%) |
| 18 to 24 Years | 405 (91.2%) | 271 (91.2%) |
| 25 to 34 Years | 672 (97.3%) | 455 (89.2%) |
| 35 to 44 Years | 347 (89.0%) | 336 (76.9%) |
| 45 to 54 Years | 410 (99.8%) | 372 (97.1%) |
| 55 to 64 Years | 391 (94.7%) | 543 (95.4%) |
| 65 to 74 Years | 344 (80.4%) | 372 (90.3%) |
| 75 Years and over | 219 (100.0%) | 282 (89.5%) |
| Total | 3,422 (91.9%) | 3,283 (88.7%) |
Income Below Poverty Among Married-Couple Families in DuBois
The poverty statistics for married-couple families in DuBois show that 2.2% or 26 of the total 1,187 families live below the poverty line. Families with 5 or more children have the highest poverty rate of 100.0%, comprising of 8 families. On the other hand, families with no children have the lowest poverty rate of 0.0%, which includes 0 families.
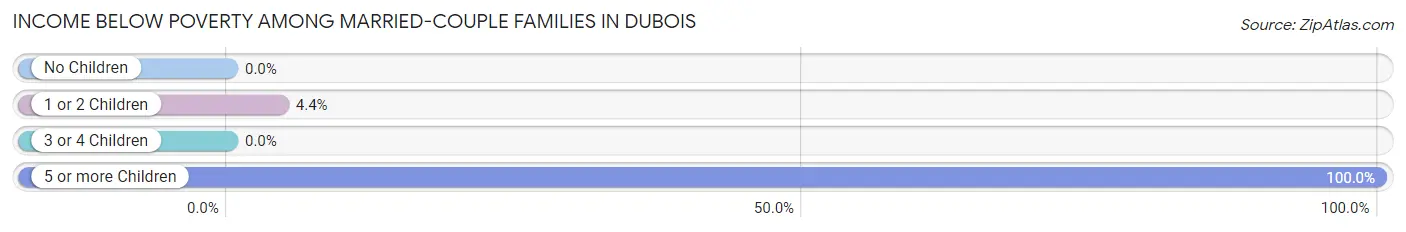
| Children | Above Poverty | Below Poverty |
| No Children | 676 (100.0%) | 0 (0.0%) |
| 1 or 2 Children | 389 (95.6%) | 18 (4.4%) |
| 3 or 4 Children | 96 (100.0%) | 0 (0.0%) |
| 5 or more Children | 0 (0.0%) | 8 (100.0%) |
| Total | 1,161 (97.8%) | 26 (2.2%) |
Income Below Poverty Among Single-Parent Households in DuBois
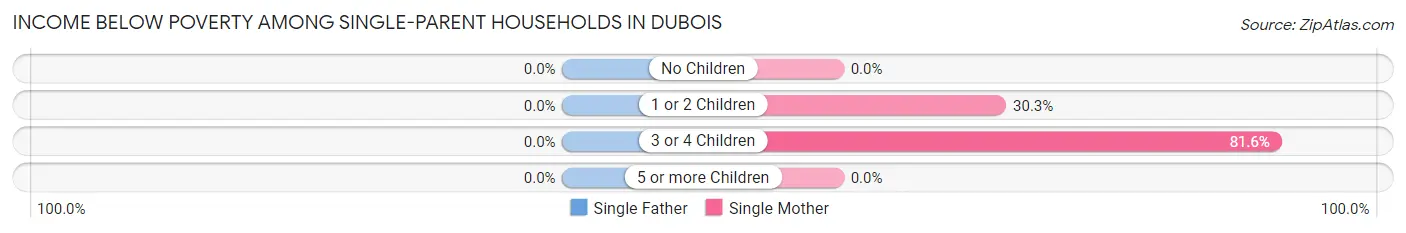
| Children | Single Father | Single Mother |
| No Children | 0 (0.0%) | 0 (0.0%) |
| 1 or 2 Children | 0 (0.0%) | 46 (30.3%) |
| 3 or 4 Children | 0 (0.0%) | 31 (81.6%) |
| 5 or more Children | 0 (0.0%) | 0 (0.0%) |
| Total | 0 (0.0%) | 77 (20.2%) |
Income Below Poverty Among Married-Couple vs Single-Parent Households in DuBois
The poverty data for DuBois shows that 26 of the married-couple family households (2.2%) and 77 of the single-parent households (14.0%) are living below the poverty level. Within the married-couple family households, those with 5 or more children have the highest poverty rate, with 8 households (100.0%) falling below the poverty line. Among the single-parent households, those with 3 or 4 children have the highest poverty rate, with 31 household (81.6%) living below poverty.
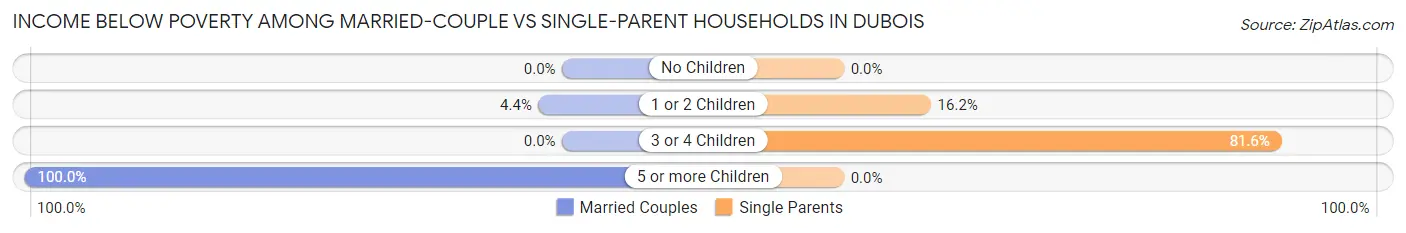
| Children | Married-Couple Families | Single-Parent Households |
| No Children | 0 (0.0%) | 0 (0.0%) |
| 1 or 2 Children | 18 (4.4%) | 46 (16.2%) |
| 3 or 4 Children | 0 (0.0%) | 31 (81.6%) |
| 5 or more Children | 8 (100.0%) | 0 (0.0%) |
| Total | 26 (2.2%) | 77 (14.0%) |
Race in DuBois
The most populous races in DuBois are White / Caucasian (7,193 | 95.8%), Two or more Races (190 | 2.5%), and Hispanic or Latino (147 | 2.0%).
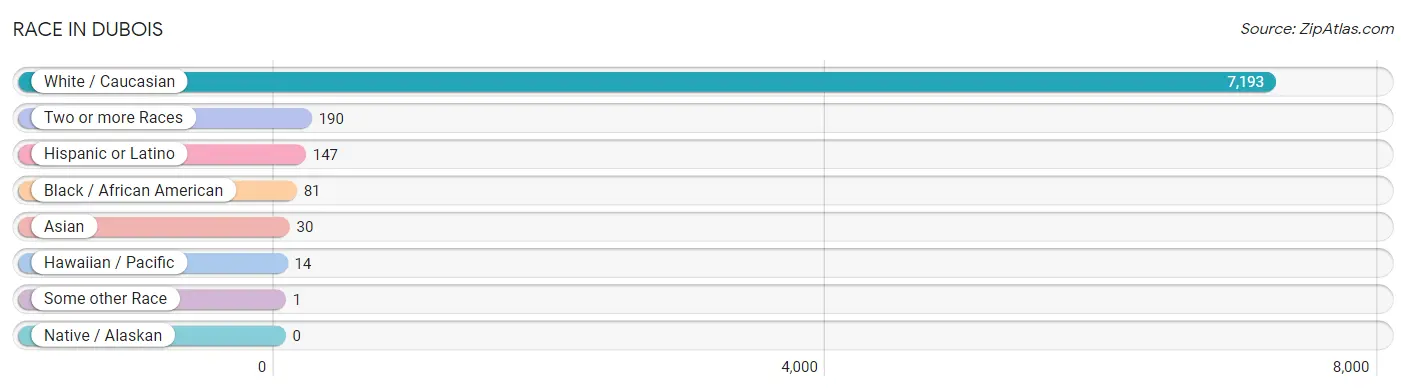
| Race | # Population | % Population |
| Asian | 30 | 0.4% |
| Black / African American | 81 | 1.1% |
| Hawaiian / Pacific | 14 | 0.2% |
| Hispanic or Latino | 147 | 2.0% |
| Native / Alaskan | 0 | 0.0% |
| White / Caucasian | 7,193 | 95.8% |
| Two or more Races | 190 | 2.5% |
| Some other Race | 1 | 0.0% |
| Total | 7,509 | 100.0% |
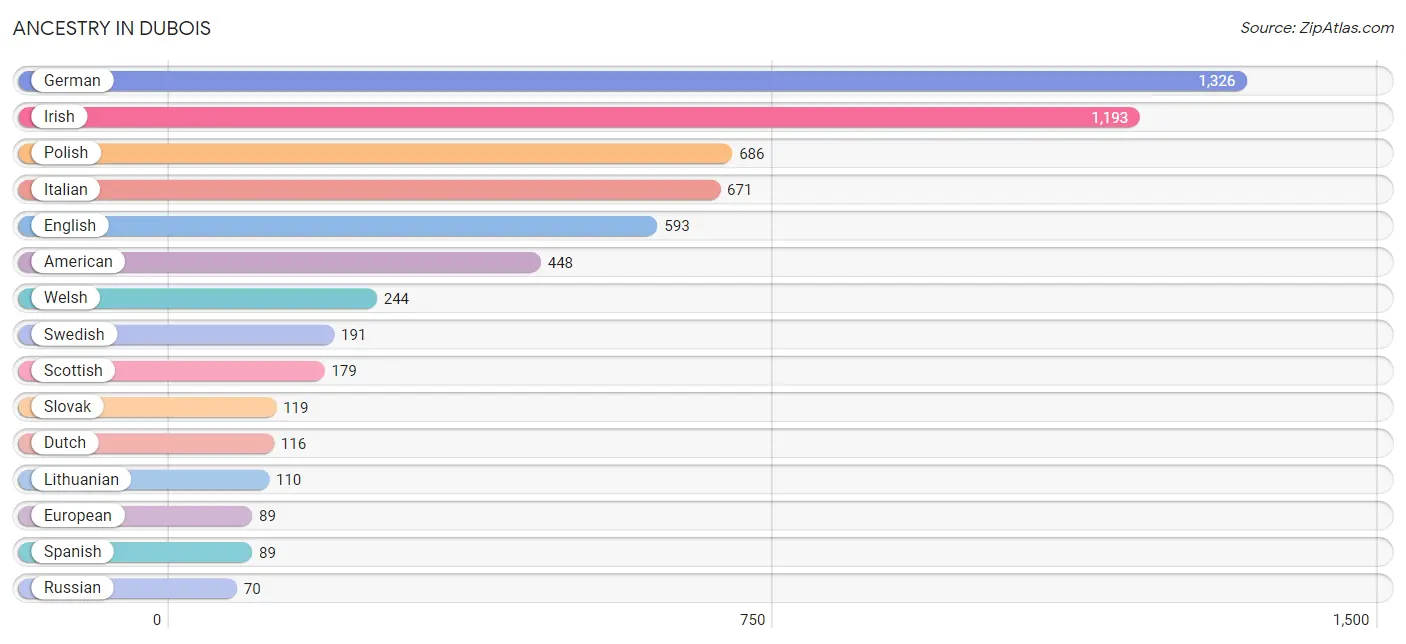
Ancestry in DuBois
The most populous ancestries reported in DuBois are German (1,326 | 17.7%), Irish (1,193 | 15.9%), Polish (686 | 9.1%), Italian (671 | 8.9%), and English (593 | 7.9%), together accounting for 59.5% of all DuBois residents.
| Ancestry | # Population | % Population |
| African | 35 | 0.5% |
| American | 448 | 6.0% |
| Arab | 40 | 0.5% |
| Austrian | 12 | 0.2% |
| British | 63 | 0.8% |
| Cherokee | 1 | 0.0% |
| Croatian | 7 | 0.1% |
| Cuban | 11 | 0.2% |
| Czech | 10 | 0.1% |
| Dutch | 116 | 1.5% |
| Eastern European | 7 | 0.1% |
| English | 593 | 7.9% |
| European | 89 | 1.2% |
| French | 36 | 0.5% |
| French Canadian | 10 | 0.1% |
| German | 1,326 | 17.7% |
| Greek | 36 | 0.5% |
| Haitian | 10 | 0.1% |
| Hungarian | 16 | 0.2% |
| Irish | 1,193 | 15.9% |
| Italian | 671 | 8.9% |
| Lebanese | 34 | 0.4% |
| Lithuanian | 110 | 1.5% |
| Mexican | 15 | 0.2% |
| Norwegian | 30 | 0.4% |
| Pennsylvania German | 68 | 0.9% |
| Polish | 686 | 9.1% |
| Puerto Rican | 32 | 0.4% |
| Russian | 70 | 0.9% |
| Samoan | 14 | 0.2% |
| Scandinavian | 42 | 0.6% |
| Scotch-Irish | 19 | 0.3% |
| Scottish | 179 | 2.4% |
| Slavic | 13 | 0.2% |
| Slovak | 119 | 1.6% |
| Slovene | 23 | 0.3% |
| Spanish | 89 | 1.2% |
| Sri Lankan | 7 | 0.1% |
| Subsaharan African | 35 | 0.5% |
| Swedish | 191 | 2.5% |
| Syrian | 6 | 0.1% |
| Thai | 23 | 0.3% |
| Ukrainian | 17 | 0.2% |
| Welsh | 244 | 3.3% | View All 44 Rows |
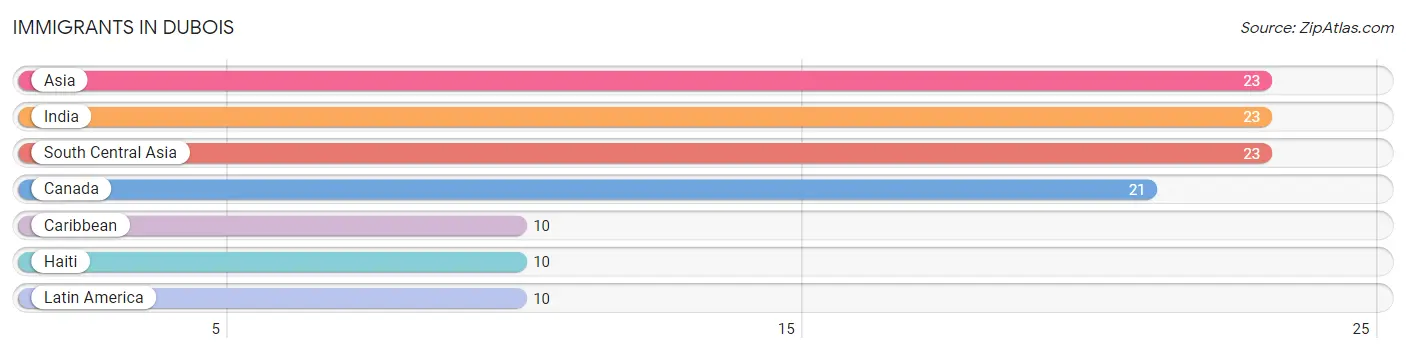
Immigrants in DuBois
The most numerous immigrant groups reported in DuBois came from Asia (23 | 0.3%), India (23 | 0.3%), South Central Asia (23 | 0.3%), Canada (21 | 0.3%), and Caribbean (10 | 0.1%), together accounting for 1.3% of all DuBois residents.
| Immigration Origin | # Population | % Population |
| Asia | 23 | 0.3% |
| Canada | 21 | 0.3% |
| Caribbean | 10 | 0.1% |
| Haiti | 10 | 0.1% |
| India | 23 | 0.3% |
| Latin America | 10 | 0.1% |
| South Central Asia | 23 | 0.3% | View All 7 Rows |
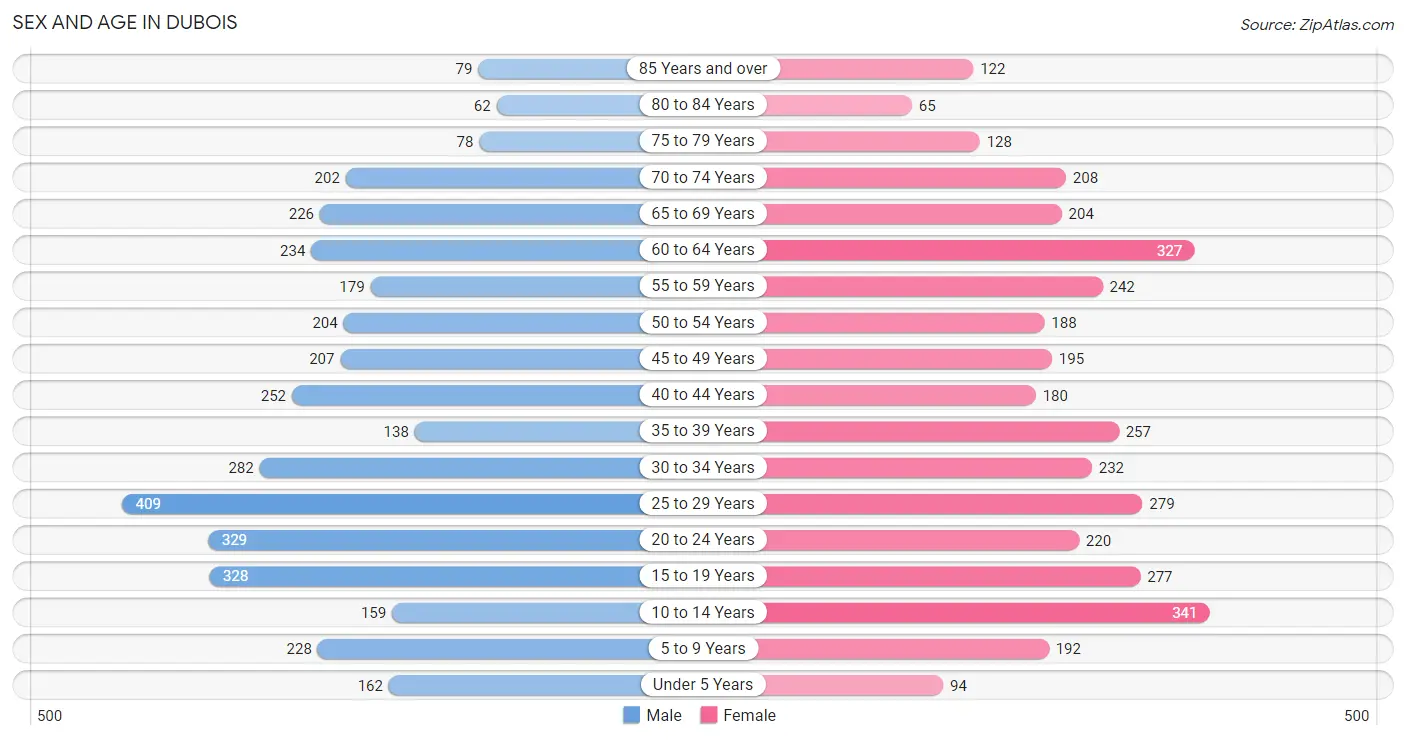
Sex and Age in DuBois
Sex and Age in DuBois
The most populous age groups in DuBois are 25 to 29 Years (409 | 10.9%) for men and 10 to 14 Years (341 | 9.1%) for women.
| Age Bracket | Male | Female |
| Under 5 Years | 162 (4.3%) | 94 (2.5%) |
| 5 to 9 Years | 228 (6.1%) | 192 (5.1%) |
| 10 to 14 Years | 159 (4.2%) | 341 (9.1%) |
| 15 to 19 Years | 328 (8.7%) | 277 (7.4%) |
| 20 to 24 Years | 329 (8.7%) | 220 (5.9%) |
| 25 to 29 Years | 409 (10.9%) | 279 (7.4%) |
| 30 to 34 Years | 282 (7.5%) | 232 (6.2%) |
| 35 to 39 Years | 138 (3.7%) | 257 (6.9%) |
| 40 to 44 Years | 252 (6.7%) | 180 (4.8%) |
| 45 to 49 Years | 207 (5.5%) | 195 (5.2%) |
| 50 to 54 Years | 204 (5.4%) | 188 (5.0%) |
| 55 to 59 Years | 179 (4.8%) | 242 (6.5%) |
| 60 to 64 Years | 234 (6.2%) | 327 (8.7%) |
| 65 to 69 Years | 226 (6.0%) | 204 (5.4%) |
| 70 to 74 Years | 202 (5.4%) | 208 (5.6%) |
| 75 to 79 Years | 78 (2.1%) | 128 (3.4%) |
| 80 to 84 Years | 62 (1.7%) | 65 (1.7%) |
| 85 Years and over | 79 (2.1%) | 122 (3.3%) |
| Total | 3,758 (100.0%) | 3,751 (100.0%) |
Families and Households in DuBois
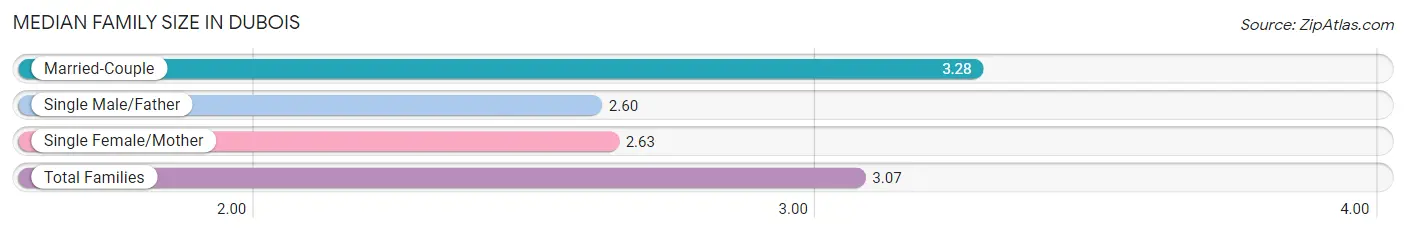
Median Family Size in DuBois
The median family size in DuBois is 3.07 persons per family, with married-couple families (1,187 | 68.3%) accounting for the largest median family size of 3.28 persons per family. On the other hand, single male/father families (170 | 9.8%) represent the smallest median family size with 2.60 persons per family.
| Family Type | # Families | Family Size |
| Married-Couple | 1,187 (68.3%) | 3.28 |
| Single Male/Father | 170 (9.8%) | 2.60 |
| Single Female/Mother | 381 (21.9%) | 2.63 |
| Total Families | 1,738 (100.0%) | 3.07 |
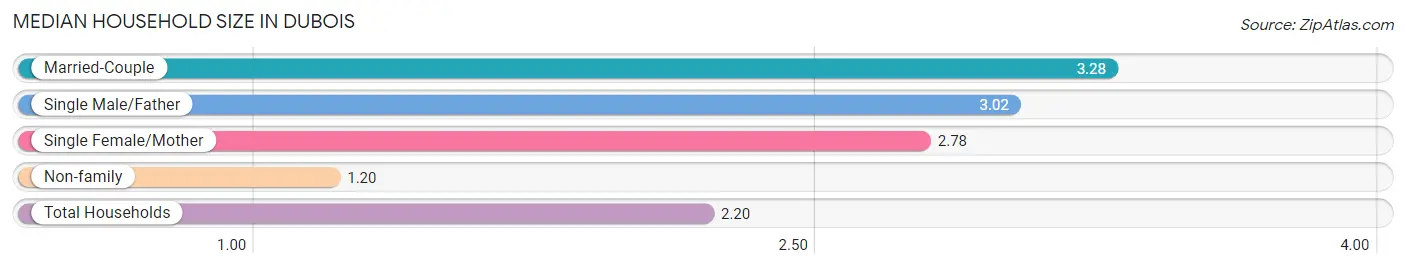
Median Household Size in DuBois
The median household size in DuBois is 2.20 persons per household, with married-couple households (1,187 | 35.2%) accounting for the largest median household size of 3.28 persons per household. non-family households (1,634 | 48.5%) represent the smallest median household size with 1.20 persons per household.
| Household Type | # Households | Household Size |
| Married-Couple | 1,187 (35.2%) | 3.28 |
| Single Male/Father | 170 (5.0%) | 3.02 |
| Single Female/Mother | 381 (11.3%) | 2.78 |
| Non-family | 1,634 (48.5%) | 1.20 |
| Total Households | 3,372 (100.0%) | 2.20 |
Household Size by Marriage Status in DuBois
Out of a total of 3,372 households in DuBois, 1,738 (51.5%) are family households, while 1,634 (48.5%) are nonfamily households. The most numerous type of family households are 2-person households, comprising 749, and the most common type of nonfamily households are 1-person households, comprising 1,332.
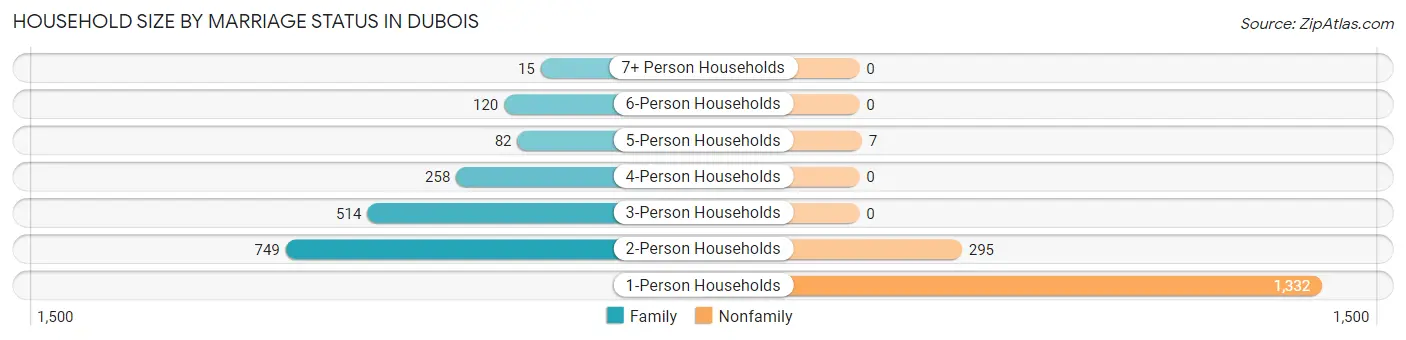
| Household Size | Family Households | Nonfamily Households |
| 1-Person Households | - | 1,332 (39.5%) |
| 2-Person Households | 749 (22.2%) | 295 (8.7%) |
| 3-Person Households | 514 (15.2%) | 0 (0.0%) |
| 4-Person Households | 258 (7.6%) | 0 (0.0%) |
| 5-Person Households | 82 (2.4%) | 7 (0.2%) |
| 6-Person Households | 120 (3.6%) | 0 (0.0%) |
| 7+ Person Households | 15 (0.4%) | 0 (0.0%) |
| Total | 1,738 (51.5%) | 1,634 (48.5%) |
Female Fertility in DuBois
Fertility by Age in DuBois
Average fertility rate in DuBois is 70.0 births per 1,000 women. Women in the age bracket of 20 to 34 years have the highest fertility rate with 109.0 births per 1,000 women. Women in the age bracket of 20 to 34 years acount for 68.4% of all women with births.
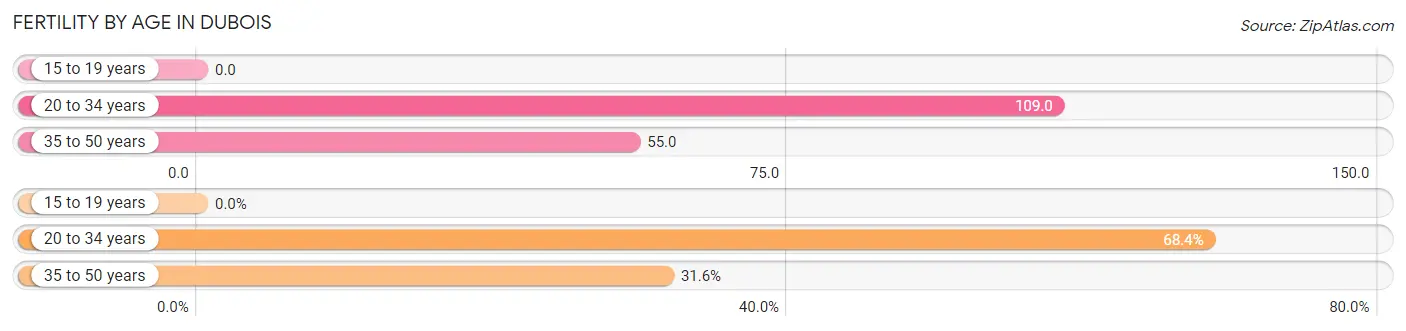
| Age Bracket | Women with Births | Births / 1,000 Women |
| 15 to 19 years | 0 (0.0%) | 0.0 |
| 20 to 34 years | 80 (68.4%) | 109.0 |
| 35 to 50 years | 37 (31.6%) | 55.0 |
| Total | 117 (100.0%) | 70.0 |
Fertility by Age by Marriage Status in DuBois
39.3% of women with births (117) in DuBois are married. The highest percentage of unmarried women with births falls into 20 to 34 years age bracket with 88.7% of them unmarried at the time of birth, while the lowest percentage of unmarried women with births belong to 35 to 50 years age bracket with 0.0% of them unmarried.
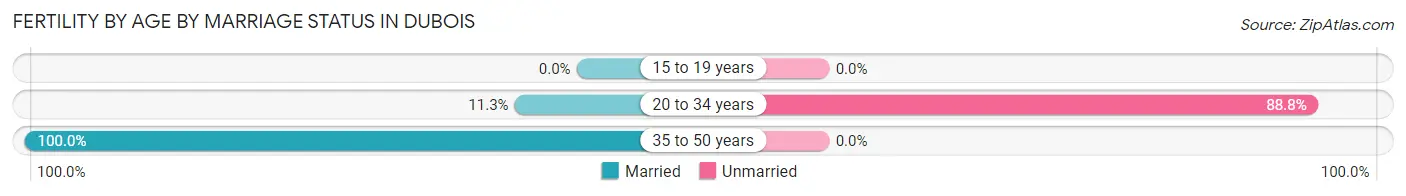
| Age Bracket | Married | Unmarried |
| 15 to 19 years | 0 (0.0%) | 0 (0.0%) |
| 20 to 34 years | 9 (11.3%) | 71 (88.7%) |
| 35 to 50 years | 37 (100.0%) | 0 (0.0%) |
| Total | 46 (39.3%) | 71 (60.7%) |
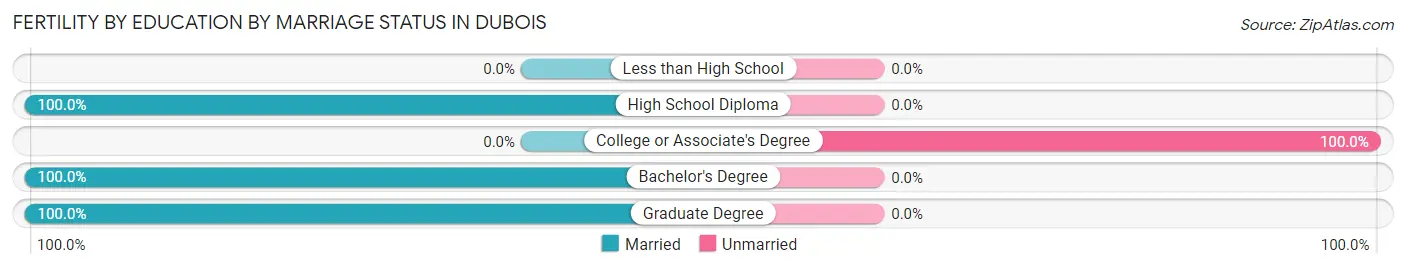
Fertility by Education in DuBois
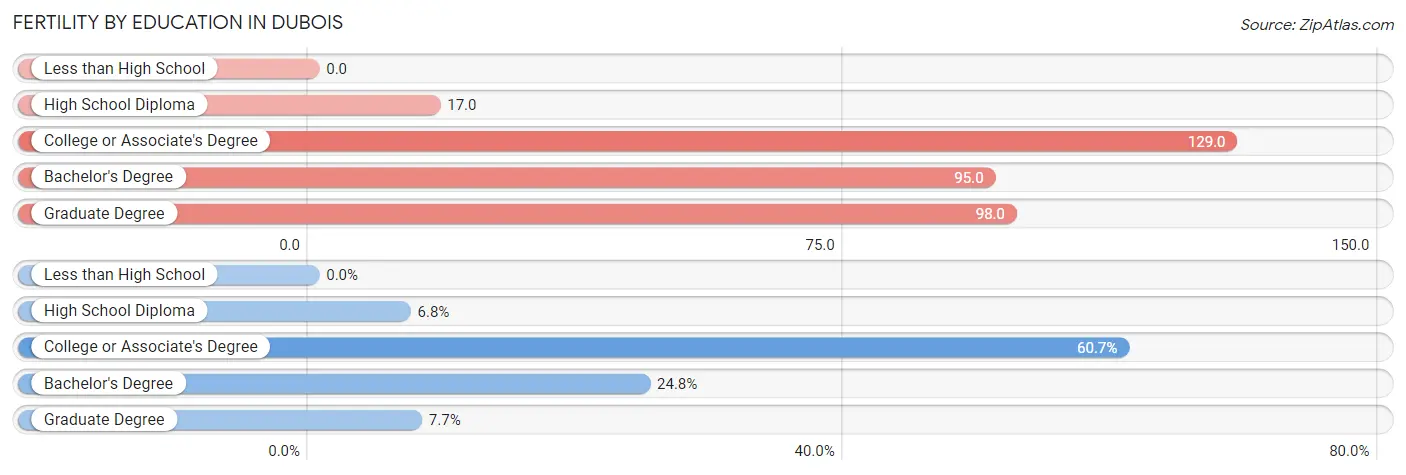
| Educational Attainment | Women with Births | Births / 1,000 Women |
| Less than High School | 0 (0.0%) | 0.0 |
| High School Diploma | 8 (6.8%) | 17.0 |
| College or Associate's Degree | 71 (60.7%) | 129.0 |
| Bachelor's Degree | 29 (24.8%) | 95.0 |
| Graduate Degree | 9 (7.7%) | 98.0 |
| Total | 117 (100.0%) | 70.0 |
Fertility by Education by Marriage Status in DuBois
60.7% of women with births in DuBois are unmarried. Women with the educational attainment of high school diploma are most likely to be married with 100.0% of them married at childbirth, while women with the educational attainment of college or associate's degree are least likely to be married with 100.0% of them unmarried at childbirth.
| Educational Attainment | Married | Unmarried |
| Less than High School | 0 (0.0%) | 0 (0.0%) |
| High School Diploma | 8 (100.0%) | 0 (0.0%) |
| College or Associate's Degree | 0 (0.0%) | 71 (100.0%) |
| Bachelor's Degree | 29 (100.0%) | 0 (0.0%) |
| Graduate Degree | 9 (100.0%) | 0 (0.0%) |
| Total | 46 (39.3%) | 71 (60.7%) |
Employment Characteristics in DuBois
Employment by Class of Employer in DuBois
Among the 3,823 employed individuals in DuBois, private company employees (2,927 | 76.6%), not-for-profit organizations (479 | 12.5%), and state government employees (198 | 5.2%) make up the most common classes of employment.
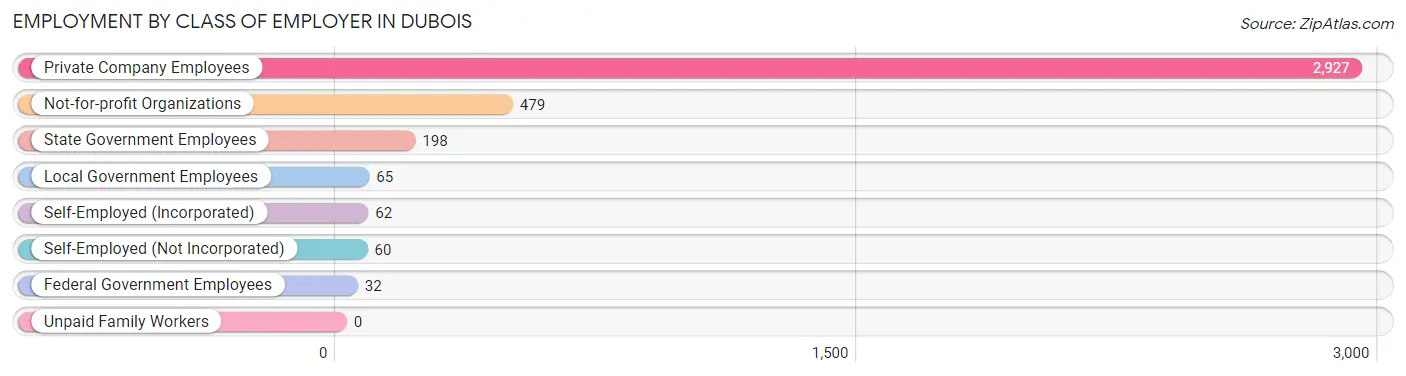
| Employer Class | # Employees | % Employees |
| Private Company Employees | 2,927 | 76.6% |
| Self-Employed (Incorporated) | 62 | 1.6% |
| Self-Employed (Not Incorporated) | 60 | 1.6% |
| Not-for-profit Organizations | 479 | 12.5% |
| Local Government Employees | 65 | 1.7% |
| State Government Employees | 198 | 5.2% |
| Federal Government Employees | 32 | 0.8% |
| Unpaid Family Workers | 0 | 0.0% |
| Total | 3,823 | 100.0% |
Employment Status by Age in DuBois
According to the labor force statistics for DuBois, out of the total population over 16 years of age (6,215), 65.6% or 4,077 individuals are in the labor force, with 4.7% or 192 of them unemployed. The age group with the highest labor force participation rate is 45 to 54 years, with 90.6% or 719 individuals in the labor force. Within the labor force, the 16 to 19 years age range has the highest percentage of unemployed individuals, with 23.1% or 65 of them being unemployed.
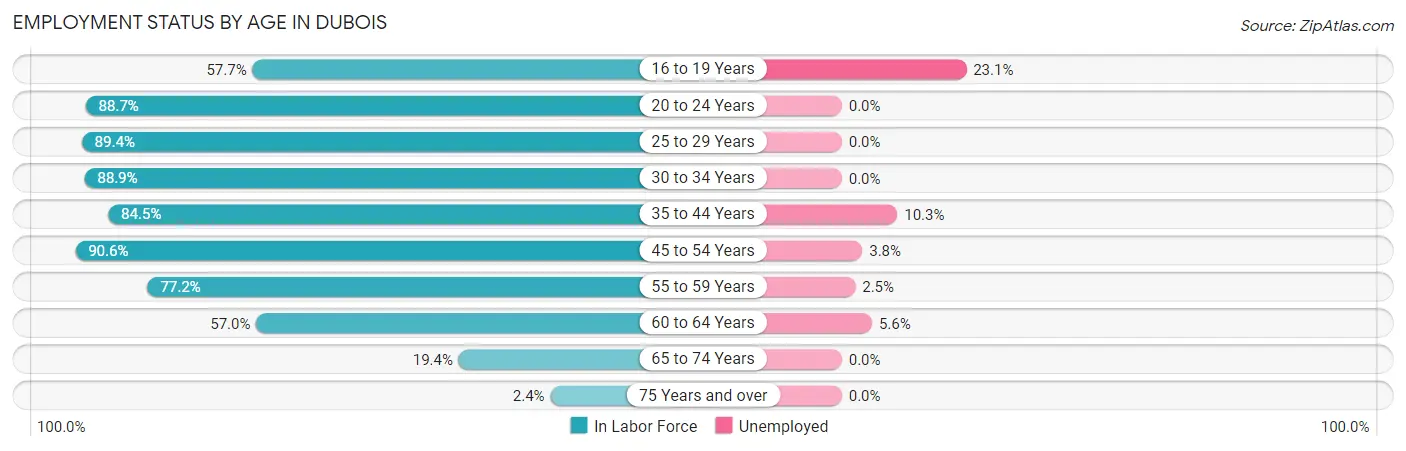
| Age Bracket | In Labor Force | Unemployed |
| 16 to 19 Years | 281 (57.7%) | 65 (23.1%) |
| 20 to 24 Years | 487 (88.7%) | 0 (0.0%) |
| 25 to 29 Years | 615 (89.4%) | 0 (0.0%) |
| 30 to 34 Years | 457 (88.9%) | 0 (0.0%) |
| 35 to 44 Years | 699 (84.5%) | 72 (10.3%) |
| 45 to 54 Years | 719 (90.6%) | 27 (3.8%) |
| 55 to 59 Years | 325 (77.2%) | 8 (2.5%) |
| 60 to 64 Years | 320 (57.0%) | 18 (5.6%) |
| 65 to 74 Years | 163 (19.4%) | 0 (0.0%) |
| 75 Years and over | 13 (2.4%) | 0 (0.0%) |
| Total | 4,077 (65.6%) | 192 (4.7%) |
Employment Status by Educational Attainment in DuBois
According to labor force statistics for DuBois, 82.4% of individuals (3,135) out of the total population between 25 and 64 years of age (3,805) are in the labor force, with 4.0% or 125 of them being unemployed. The group with the highest labor force participation rate are those with the educational attainment of bachelor's degree or higher, with 93.4% or 1,095 individuals in the labor force. Within the labor force, individuals with college / associate degree education have the highest percentage of unemployment, with 6.5% or 67 of them being unemployed.
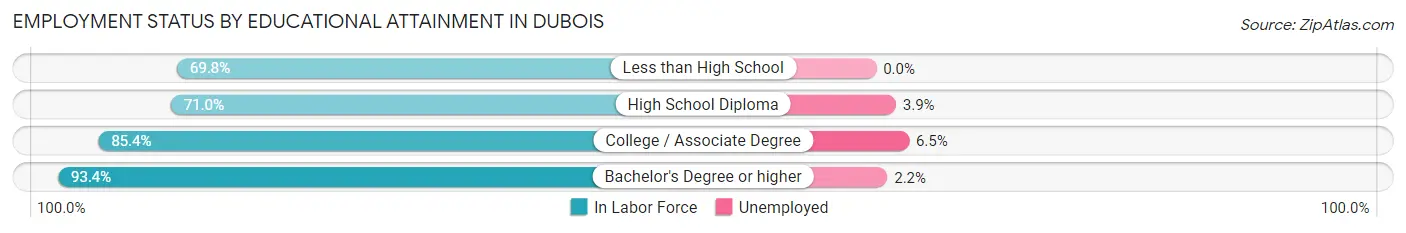
| Educational Attainment | In Labor Force | Unemployed |
| Less than High School | 141 (69.8%) | 0 (0.0%) |
| High School Diploma | 874 (71.0%) | 48 (3.9%) |
| College / Associate Degree | 1,025 (85.4%) | 78 (6.5%) |
| Bachelor's Degree or higher | 1,095 (93.4%) | 26 (2.2%) |
| Total | 3,135 (82.4%) | 152 (4.0%) |
Employment Occupations by Sex in DuBois
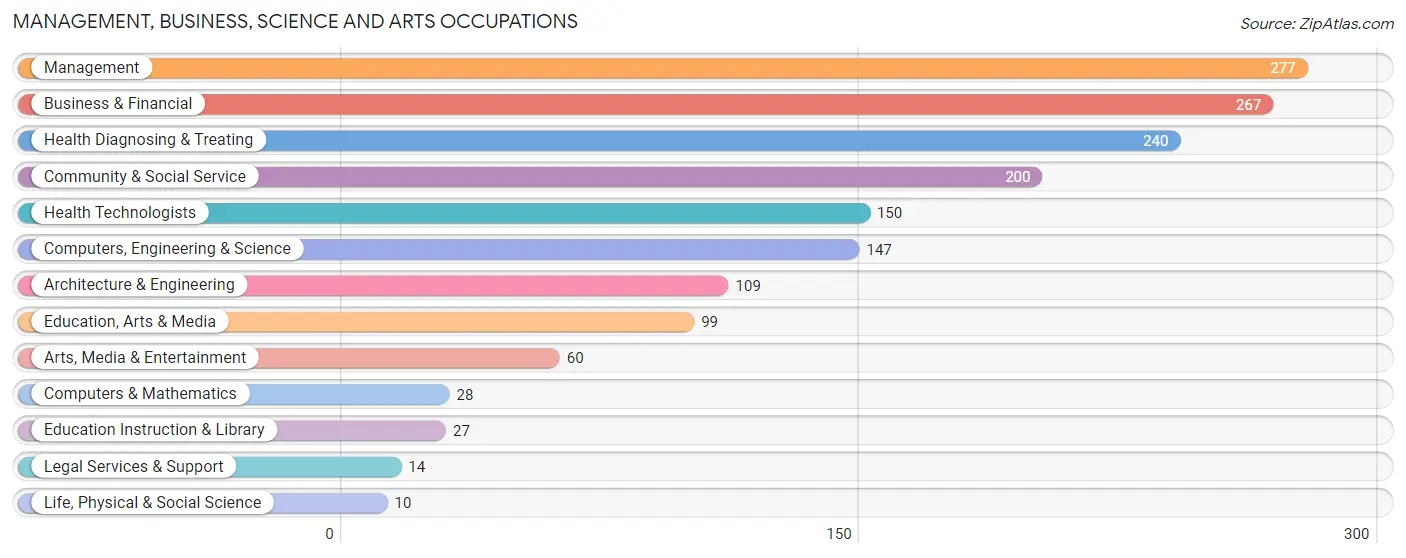
Management, Business, Science and Arts Occupations
The most common Management, Business, Science and Arts occupations in DuBois are Management (277 | 7.1%), Business & Financial (267 | 6.9%), Health Diagnosing & Treating (240 | 6.2%), Community & Social Service (200 | 5.1%), and Health Technologists (150 | 3.9%).
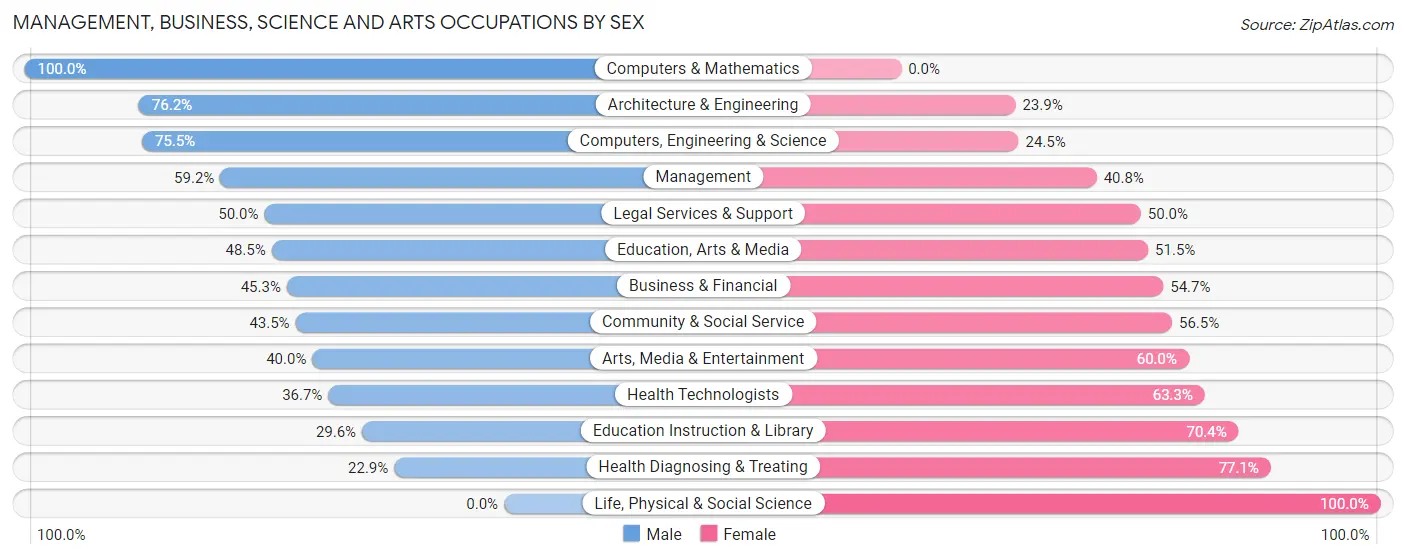
Management, Business, Science and Arts Occupations by Sex
Within the Management, Business, Science and Arts occupations in DuBois, the most male-oriented occupations are Computers & Mathematics (100.0%), Architecture & Engineering (76.1%), and Computers, Engineering & Science (75.5%), while the most female-oriented occupations are Life, Physical & Social Science (100.0%), Health Diagnosing & Treating (77.1%), and Education Instruction & Library (70.4%).
| Occupation | Male | Female |
| Management | 164 (59.2%) | 113 (40.8%) |
| Business & Financial | 121 (45.3%) | 146 (54.7%) |
| Computers, Engineering & Science | 111 (75.5%) | 36 (24.5%) |
| Computers & Mathematics | 28 (100.0%) | 0 (0.0%) |
| Architecture & Engineering | 83 (76.1%) | 26 (23.8%) |
| Life, Physical & Social Science | 0 (0.0%) | 10 (100.0%) |
| Community & Social Service | 87 (43.5%) | 113 (56.5%) |
| Education, Arts & Media | 48 (48.5%) | 51 (51.5%) |
| Legal Services & Support | 7 (50.0%) | 7 (50.0%) |
| Education Instruction & Library | 8 (29.6%) | 19 (70.4%) |
| Arts, Media & Entertainment | 24 (40.0%) | 36 (60.0%) |
| Health Diagnosing & Treating | 55 (22.9%) | 185 (77.1%) |
| Health Technologists | 55 (36.7%) | 95 (63.3%) |
| Total (Category) | 538 (47.6%) | 593 (52.4%) |
| Total (Overall) | 2,167 (55.7%) | 1,722 (44.3%) |
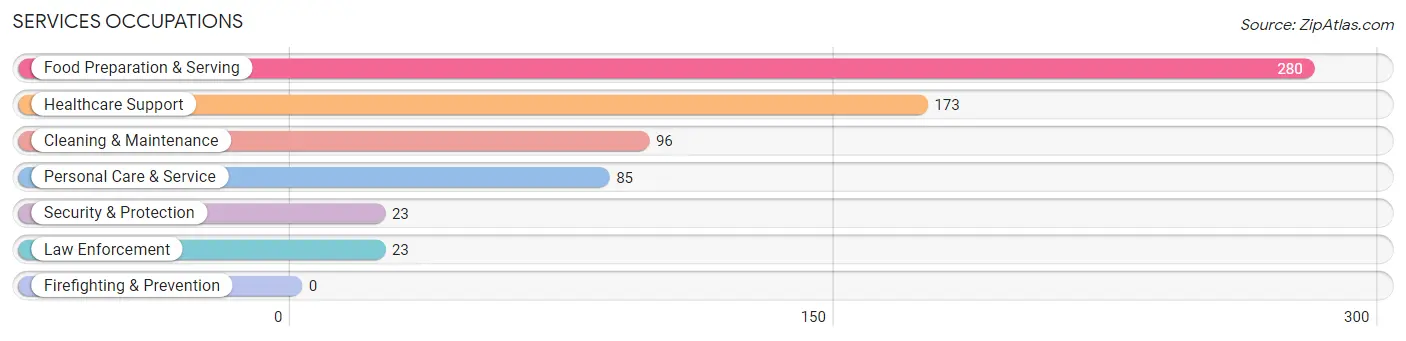
Services Occupations
The most common Services occupations in DuBois are Food Preparation & Serving (280 | 7.2%), Healthcare Support (173 | 4.4%), Cleaning & Maintenance (96 | 2.5%), Personal Care & Service (85 | 2.2%), and Security & Protection (23 | 0.6%).
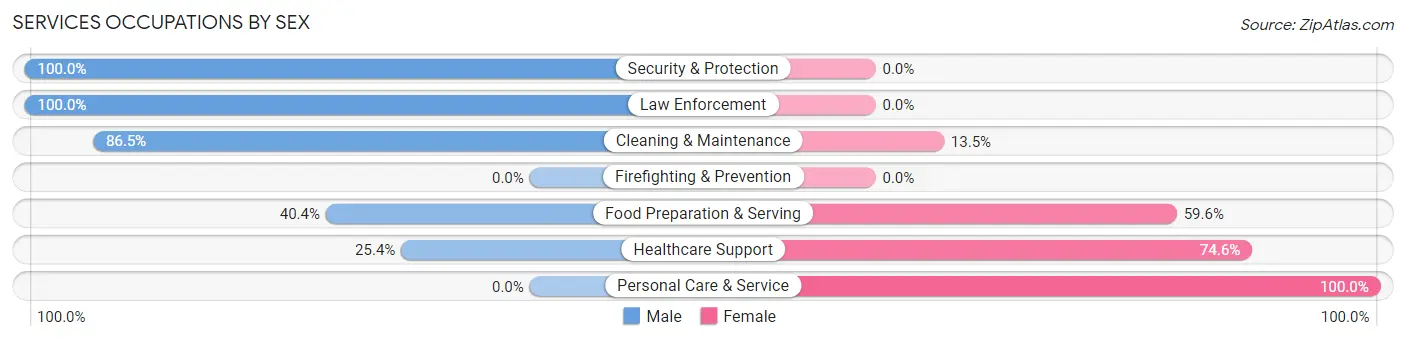
Services Occupations by Sex
Within the Services occupations in DuBois, the most male-oriented occupations are Security & Protection (100.0%), Law Enforcement (100.0%), and Cleaning & Maintenance (86.5%), while the most female-oriented occupations are Personal Care & Service (100.0%), Healthcare Support (74.6%), and Food Preparation & Serving (59.6%).
| Occupation | Male | Female |
| Healthcare Support | 44 (25.4%) | 129 (74.6%) |
| Security & Protection | 23 (100.0%) | 0 (0.0%) |
| Firefighting & Prevention | 0 (0.0%) | 0 (0.0%) |
| Law Enforcement | 23 (100.0%) | 0 (0.0%) |
| Food Preparation & Serving | 113 (40.4%) | 167 (59.6%) |
| Cleaning & Maintenance | 83 (86.5%) | 13 (13.5%) |
| Personal Care & Service | 0 (0.0%) | 85 (100.0%) |
| Total (Category) | 263 (40.0%) | 394 (60.0%) |
| Total (Overall) | 2,167 (55.7%) | 1,722 (44.3%) |
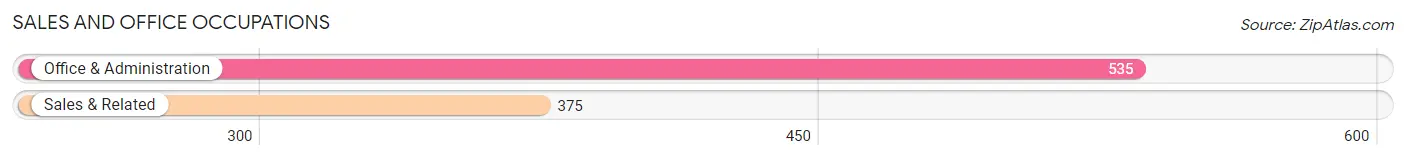
Sales and Office Occupations
The most common Sales and Office occupations in DuBois are Office & Administration (535 | 13.8%), and Sales & Related (375 | 9.6%).
Sales and Office Occupations by Sex
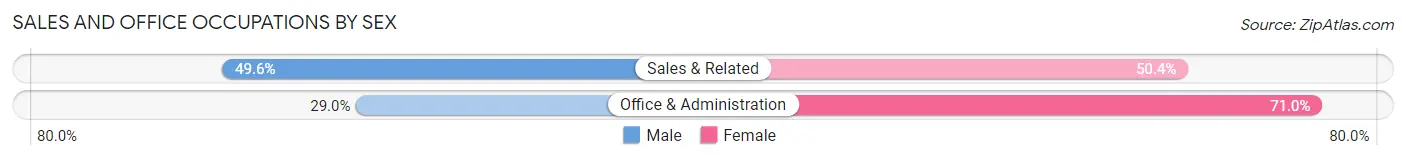
| Occupation | Male | Female |
| Sales & Related | 186 (49.6%) | 189 (50.4%) |
| Office & Administration | 155 (29.0%) | 380 (71.0%) |
| Total (Category) | 341 (37.5%) | 569 (62.5%) |
| Total (Overall) | 2,167 (55.7%) | 1,722 (44.3%) |
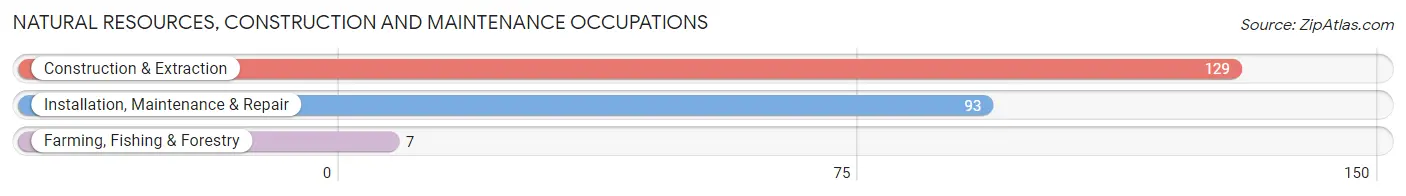
Natural Resources, Construction and Maintenance Occupations
The most common Natural Resources, Construction and Maintenance occupations in DuBois are Construction & Extraction (129 | 3.3%), Installation, Maintenance & Repair (93 | 2.4%), and Farming, Fishing & Forestry (7 | 0.2%).
Natural Resources, Construction and Maintenance Occupations by Sex
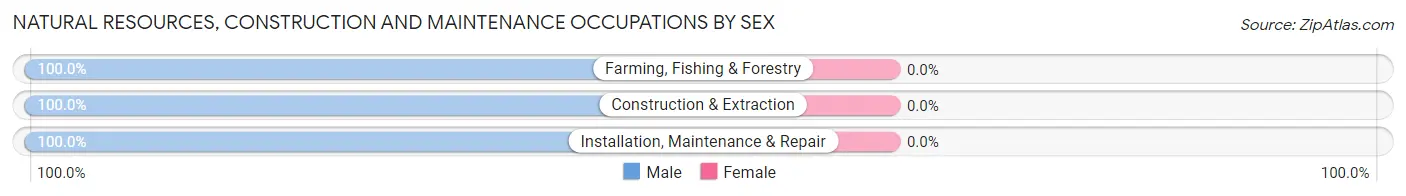
| Occupation | Male | Female |
| Farming, Fishing & Forestry | 7 (100.0%) | 0 (0.0%) |
| Construction & Extraction | 129 (100.0%) | 0 (0.0%) |
| Installation, Maintenance & Repair | 93 (100.0%) | 0 (0.0%) |
| Total (Category) | 229 (100.0%) | 0 (0.0%) |
| Total (Overall) | 2,167 (55.7%) | 1,722 (44.3%) |
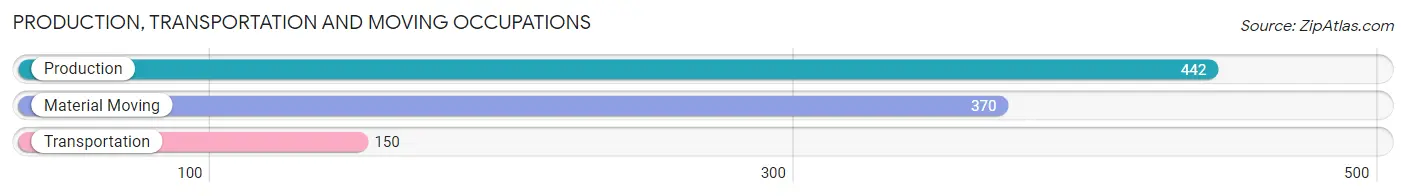
Production, Transportation and Moving Occupations
The most common Production, Transportation and Moving occupations in DuBois are Production (442 | 11.4%), Material Moving (370 | 9.5%), and Transportation (150 | 3.9%).
Production, Transportation and Moving Occupations by Sex
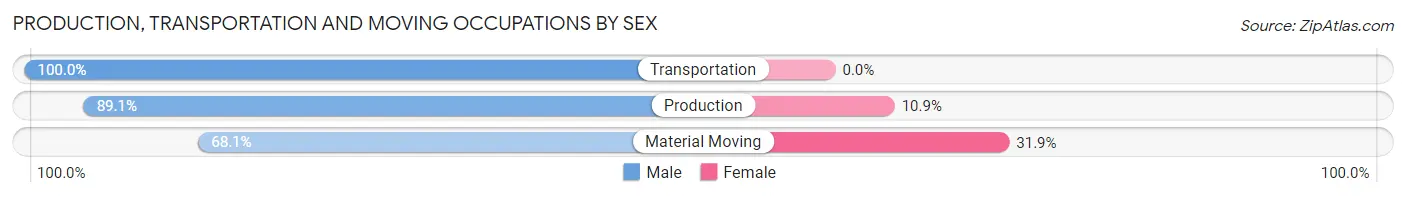
| Occupation | Male | Female |
| Production | 394 (89.1%) | 48 (10.9%) |
| Transportation | 150 (100.0%) | 0 (0.0%) |
| Material Moving | 252 (68.1%) | 118 (31.9%) |
| Total (Category) | 796 (82.7%) | 166 (17.3%) |
| Total (Overall) | 2,167 (55.7%) | 1,722 (44.3%) |
Employment Industries by Sex in DuBois
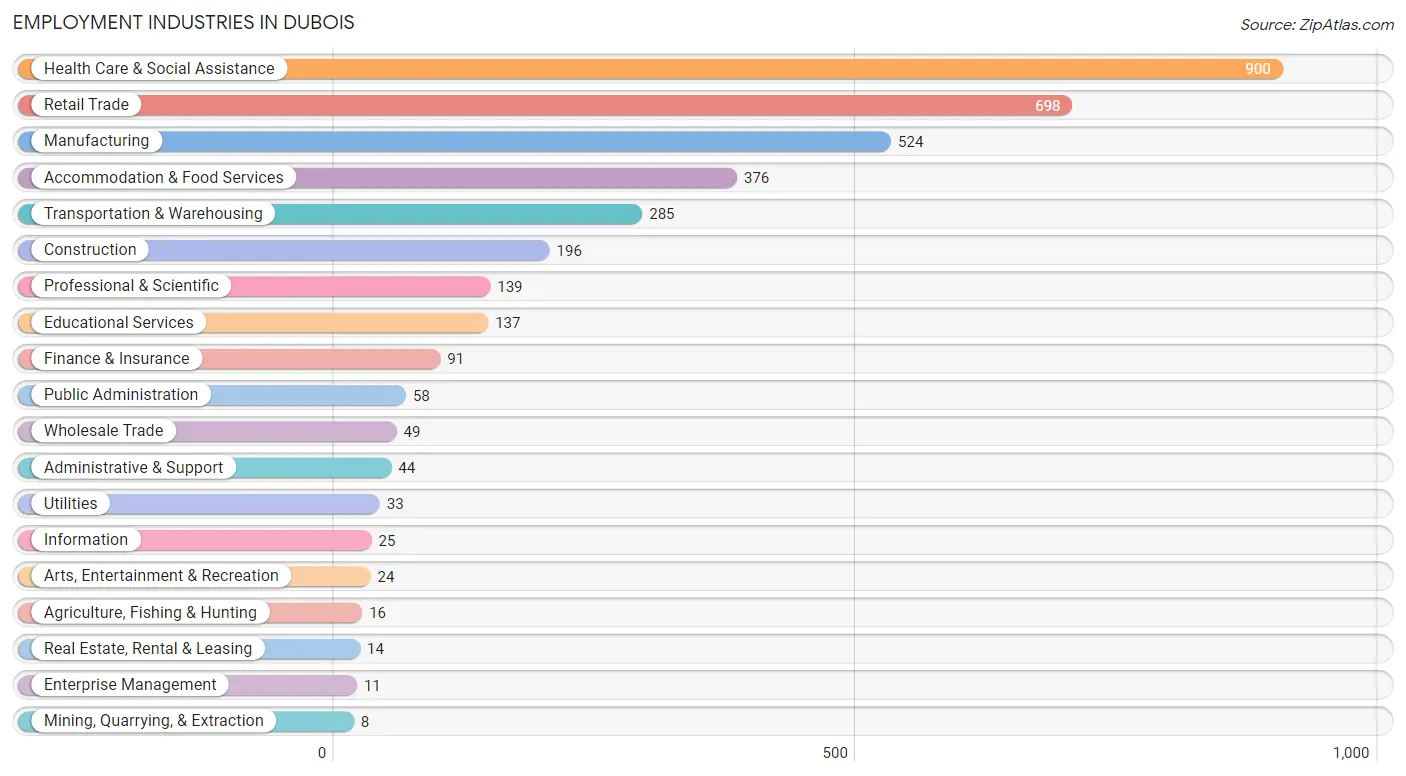
Employment Industries in DuBois
The major employment industries in DuBois include Health Care & Social Assistance (900 | 23.1%), Retail Trade (698 | 17.9%), Manufacturing (524 | 13.5%), Accommodation & Food Services (376 | 9.7%), and Transportation & Warehousing (285 | 7.3%).
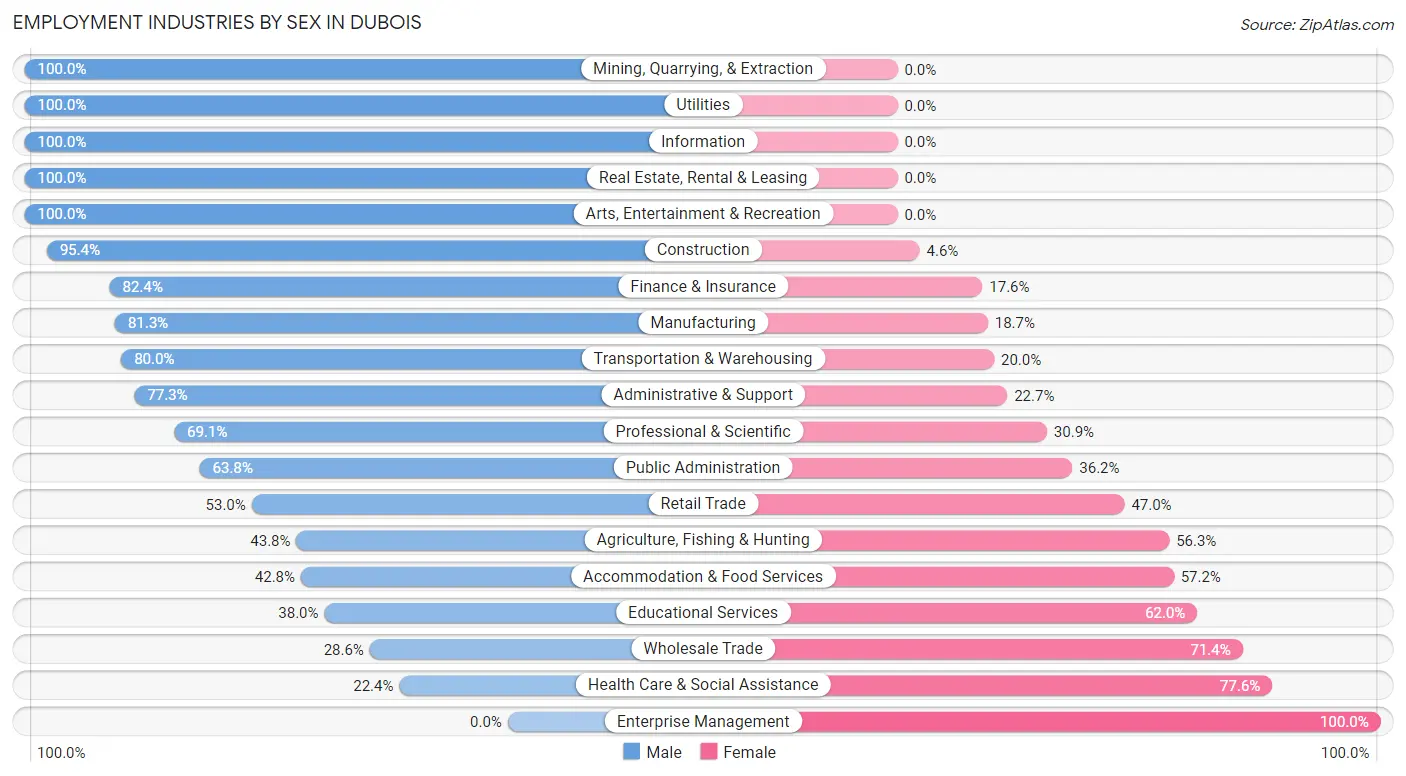
Employment Industries by Sex in DuBois
The DuBois industries that see more men than women are Mining, Quarrying, & Extraction (100.0%), Utilities (100.0%), and Information (100.0%), whereas the industries that tend to have a higher number of women are Enterprise Management (100.0%), Health Care & Social Assistance (77.6%), and Wholesale Trade (71.4%).
| Industry | Male | Female |
| Agriculture, Fishing & Hunting | 7 (43.8%) | 9 (56.2%) |
| Mining, Quarrying, & Extraction | 8 (100.0%) | 0 (0.0%) |
| Construction | 187 (95.4%) | 9 (4.6%) |
| Manufacturing | 426 (81.3%) | 98 (18.7%) |
| Wholesale Trade | 14 (28.6%) | 35 (71.4%) |
| Retail Trade | 370 (53.0%) | 328 (47.0%) |
| Transportation & Warehousing | 228 (80.0%) | 57 (20.0%) |
| Utilities | 33 (100.0%) | 0 (0.0%) |
| Information | 25 (100.0%) | 0 (0.0%) |
| Finance & Insurance | 75 (82.4%) | 16 (17.6%) |
| Real Estate, Rental & Leasing | 14 (100.0%) | 0 (0.0%) |
| Professional & Scientific | 96 (69.1%) | 43 (30.9%) |
| Enterprise Management | 0 (0.0%) | 11 (100.0%) |
| Administrative & Support | 34 (77.3%) | 10 (22.7%) |
| Educational Services | 52 (38.0%) | 85 (62.0%) |
| Health Care & Social Assistance | 202 (22.4%) | 698 (77.6%) |
| Arts, Entertainment & Recreation | 24 (100.0%) | 0 (0.0%) |
| Accommodation & Food Services | 161 (42.8%) | 215 (57.2%) |
| Public Administration | 37 (63.8%) | 21 (36.2%) |
| Total | 2,167 (55.7%) | 1,722 (44.3%) |
Education in DuBois
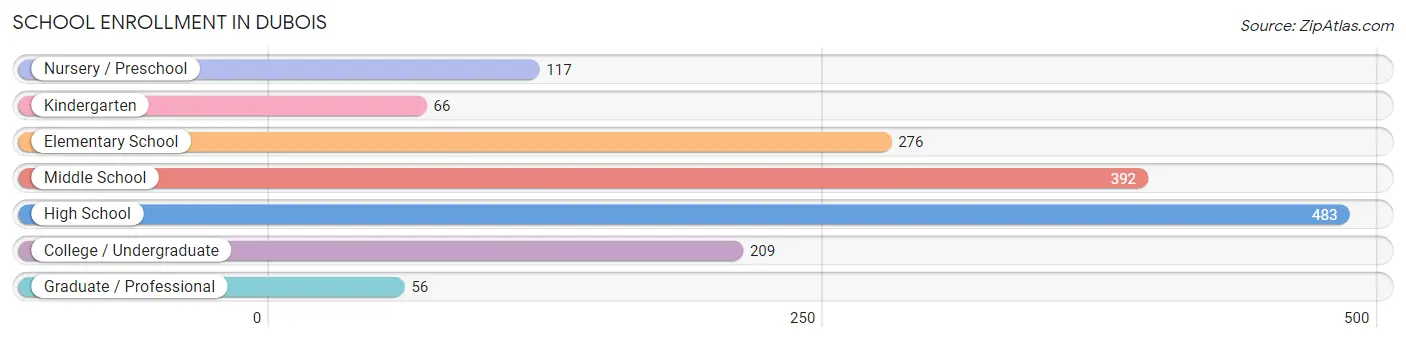
School Enrollment in DuBois
The most common levels of schooling among the 1,599 students in DuBois are high school (483 | 30.2%), middle school (392 | 24.5%), and elementary school (276 | 17.3%).
| School Level | # Students | % Students |
| Nursery / Preschool | 117 | 7.3% |
| Kindergarten | 66 | 4.1% |
| Elementary School | 276 | 17.3% |
| Middle School | 392 | 24.5% |
| High School | 483 | 30.2% |
| College / Undergraduate | 209 | 13.1% |
| Graduate / Professional | 56 | 3.5% |
| Total | 1,599 | 100.0% |
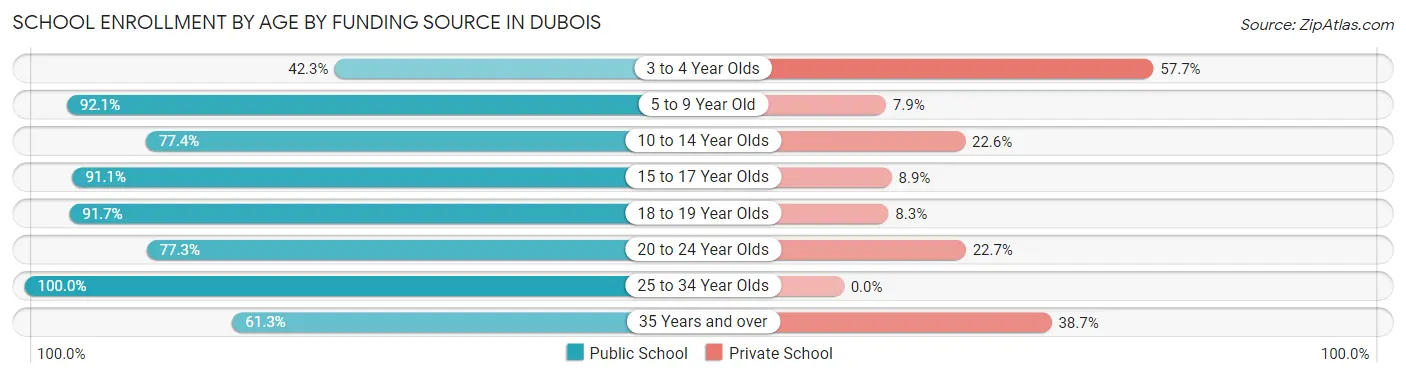
School Enrollment by Age by Funding Source in DuBois
Out of a total of 1,599 students who are enrolled in schools in DuBois, 249 (15.6%) attend a private institution, while the remaining 1,350 (84.4%) are enrolled in public schools. The age group of 3 to 4 year olds has the highest likelihood of being enrolled in private schools, with 15 (57.7% in the age bracket) enrolled. Conversely, the age group of 25 to 34 year olds has the lowest likelihood of being enrolled in a private school, with 25 (100.0% in the age bracket) attending a public institution.
| Age Bracket | Public School | Private School |
| 3 to 4 Year Olds | 11 (42.3%) | 15 (57.7%) |
| 5 to 9 Year Old | 363 (92.1%) | 31 (7.9%) |
| 10 to 14 Year Olds | 380 (77.4%) | 111 (22.6%) |
| 15 to 17 Year Olds | 316 (91.1%) | 31 (8.9%) |
| 18 to 19 Year Olds | 132 (91.7%) | 12 (8.3%) |
| 20 to 24 Year Olds | 85 (77.3%) | 25 (22.7%) |
| 25 to 34 Year Olds | 25 (100.0%) | 0 (0.0%) |
| 35 Years and over | 38 (61.3%) | 24 (38.7%) |
| Total | 1,350 (84.4%) | 249 (15.6%) |
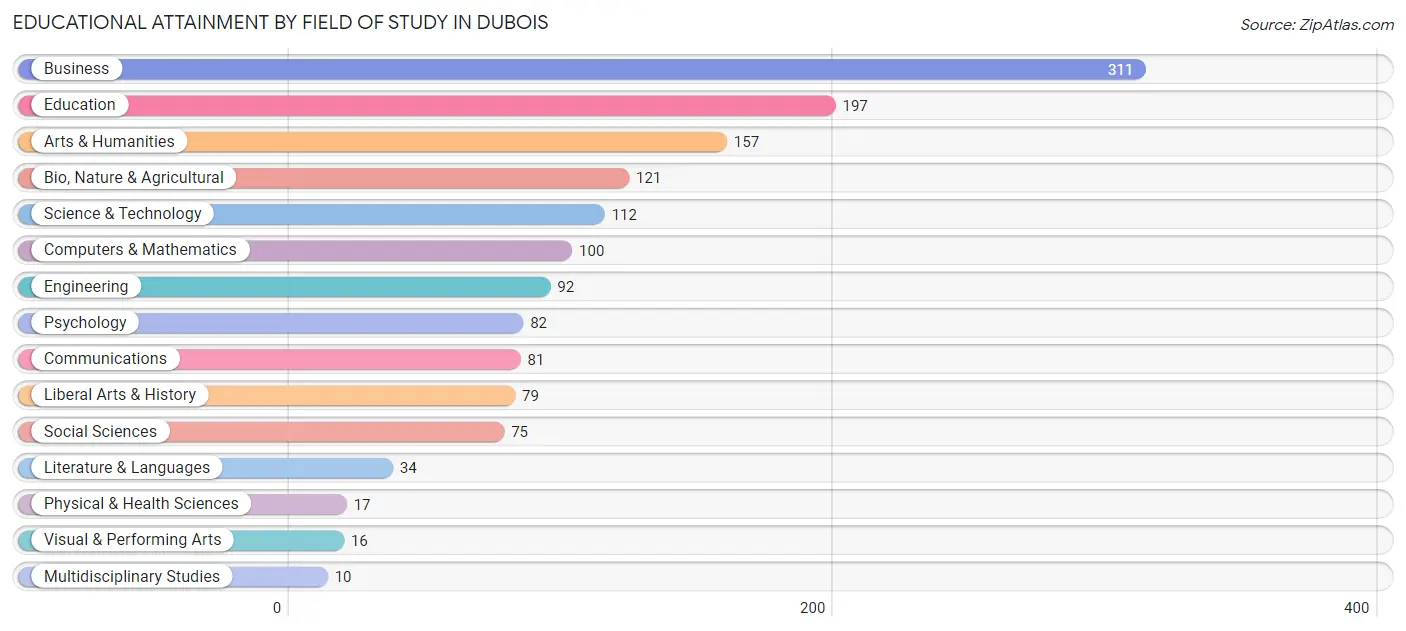
Educational Attainment by Field of Study in DuBois
Business (311 | 21.0%), education (197 | 13.3%), arts & humanities (157 | 10.6%), bio, nature & agricultural (121 | 8.2%), and science & technology (112 | 7.5%) are the most common fields of study among 1,484 individuals in DuBois who have obtained a bachelor's degree or higher.
| Field of Study | # Graduates | % Graduates |
| Computers & Mathematics | 100 | 6.7% |
| Bio, Nature & Agricultural | 121 | 8.2% |
| Physical & Health Sciences | 17 | 1.1% |
| Psychology | 82 | 5.5% |
| Social Sciences | 75 | 5.1% |
| Engineering | 92 | 6.2% |
| Multidisciplinary Studies | 10 | 0.7% |
| Science & Technology | 112 | 7.5% |
| Business | 311 | 21.0% |
| Education | 197 | 13.3% |
| Literature & Languages | 34 | 2.3% |
| Liberal Arts & History | 79 | 5.3% |
| Visual & Performing Arts | 16 | 1.1% |
| Communications | 81 | 5.5% |
| Arts & Humanities | 157 | 10.6% |
| Total | 1,484 | 100.0% |
Transportation & Commute in DuBois
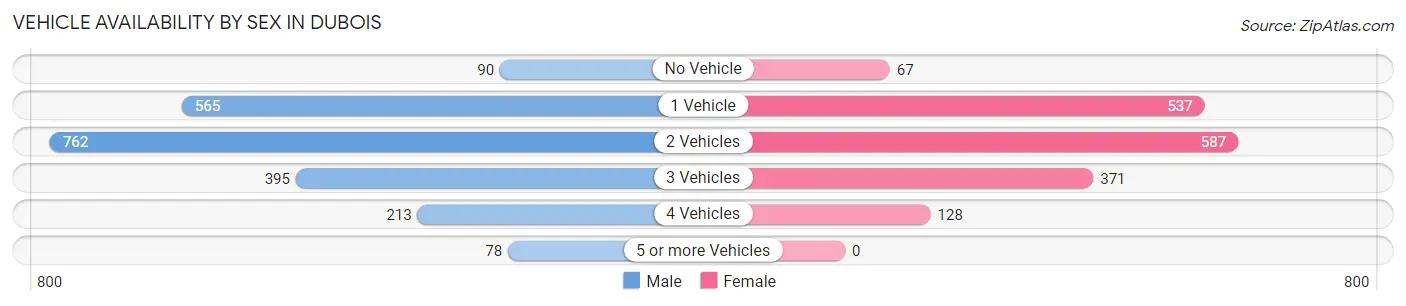
Vehicle Availability by Sex in DuBois
The most prevalent vehicle ownership categories in DuBois are males with 2 vehicles (762, accounting for 36.2%) and females with 2 vehicles (587, making up 45.1%).
| Vehicles Available | Male | Female |
| No Vehicle | 90 (4.3%) | 67 (4.0%) |
| 1 Vehicle | 565 (26.9%) | 537 (31.8%) |
| 2 Vehicles | 762 (36.2%) | 587 (34.7%) |
| 3 Vehicles | 395 (18.8%) | 371 (22.0%) |
| 4 Vehicles | 213 (10.1%) | 128 (7.6%) |
| 5 or more Vehicles | 78 (3.7%) | 0 (0.0%) |
| Total | 2,103 (100.0%) | 1,690 (100.0%) |
Commute Time in DuBois
The most frequently occuring commute durations in DuBois are 5 to 9 minutes (1,210 commuters, 33.6%), 10 to 14 minutes (611 commuters, 17.0%), and 15 to 19 minutes (486 commuters, 13.5%).
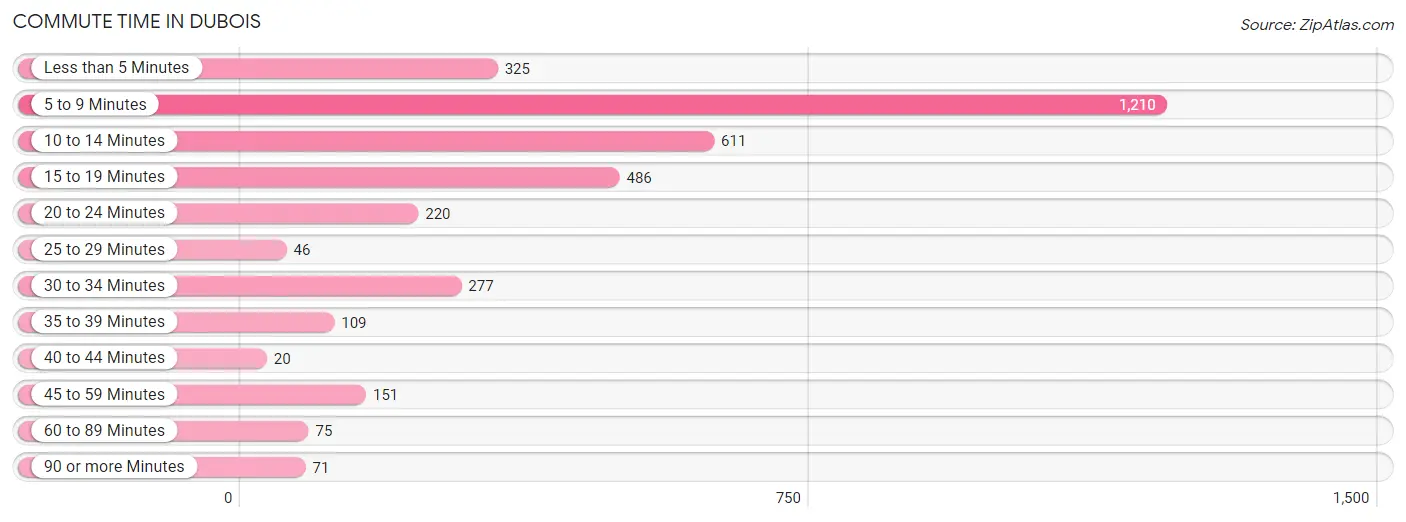
| Commute Time | # Commuters | % Commuters |
| Less than 5 Minutes | 325 | 9.0% |
| 5 to 9 Minutes | 1,210 | 33.6% |
| 10 to 14 Minutes | 611 | 17.0% |
| 15 to 19 Minutes | 486 | 13.5% |
| 20 to 24 Minutes | 220 | 6.1% |
| 25 to 29 Minutes | 46 | 1.3% |
| 30 to 34 Minutes | 277 | 7.7% |
| 35 to 39 Minutes | 109 | 3.0% |
| 40 to 44 Minutes | 20 | 0.6% |
| 45 to 59 Minutes | 151 | 4.2% |
| 60 to 89 Minutes | 75 | 2.1% |
| 90 or more Minutes | 71 | 2.0% |
Commute Time by Sex in DuBois
The most common commute times in DuBois are 5 to 9 minutes (473 commuters, 23.2%) for males and 5 to 9 minutes (737 commuters, 47.3%) for females.
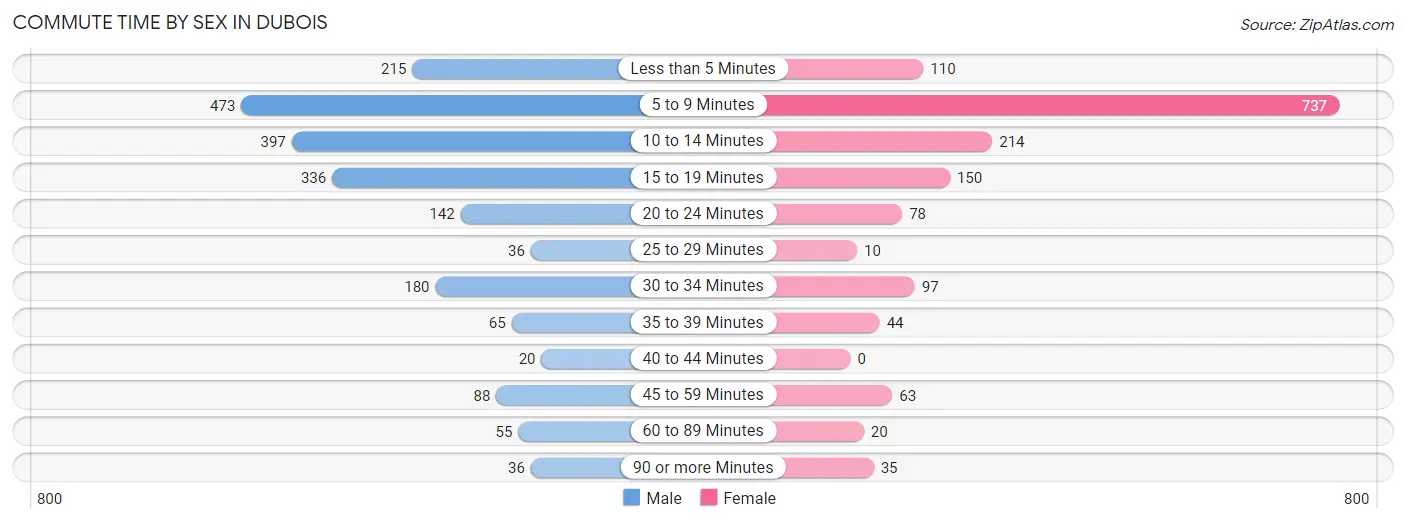
| Commute Time | Male | Female |
| Less than 5 Minutes | 215 (10.5%) | 110 (7.1%) |
| 5 to 9 Minutes | 473 (23.2%) | 737 (47.3%) |
| 10 to 14 Minutes | 397 (19.4%) | 214 (13.7%) |
| 15 to 19 Minutes | 336 (16.5%) | 150 (9.6%) |
| 20 to 24 Minutes | 142 (7.0%) | 78 (5.0%) |
| 25 to 29 Minutes | 36 (1.8%) | 10 (0.6%) |
| 30 to 34 Minutes | 180 (8.8%) | 97 (6.2%) |
| 35 to 39 Minutes | 65 (3.2%) | 44 (2.8%) |
| 40 to 44 Minutes | 20 (1.0%) | 0 (0.0%) |
| 45 to 59 Minutes | 88 (4.3%) | 63 (4.0%) |
| 60 to 89 Minutes | 55 (2.7%) | 20 (1.3%) |
| 90 or more Minutes | 36 (1.8%) | 35 (2.2%) |
Time of Departure to Work by Sex in DuBois
The most frequent times of departure to work in DuBois are 7:00 AM to 7:29 AM (364, 17.8%) for males and 7:30 AM to 7:59 AM (345, 22.1%) for females.
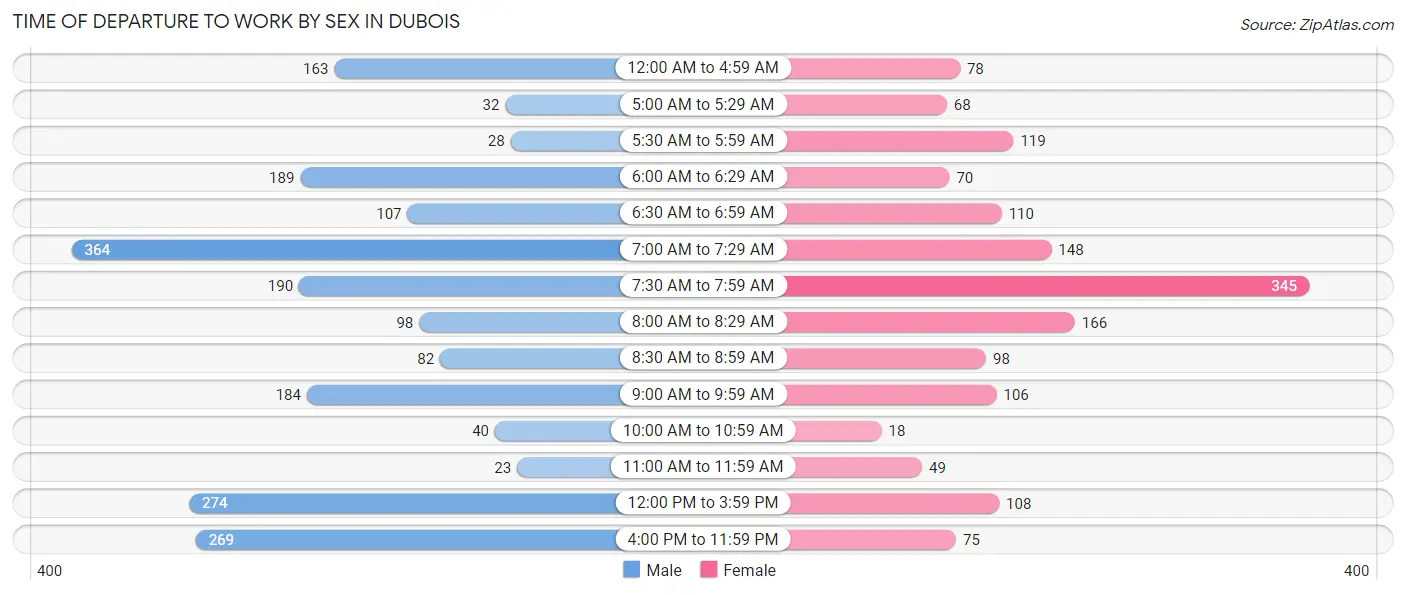
| Time of Departure | Male | Female |
| 12:00 AM to 4:59 AM | 163 (8.0%) | 78 (5.0%) |
| 5:00 AM to 5:29 AM | 32 (1.6%) | 68 (4.4%) |
| 5:30 AM to 5:59 AM | 28 (1.4%) | 119 (7.6%) |
| 6:00 AM to 6:29 AM | 189 (9.2%) | 70 (4.5%) |
| 6:30 AM to 6:59 AM | 107 (5.2%) | 110 (7.1%) |
| 7:00 AM to 7:29 AM | 364 (17.8%) | 148 (9.5%) |
| 7:30 AM to 7:59 AM | 190 (9.3%) | 345 (22.1%) |
| 8:00 AM to 8:29 AM | 98 (4.8%) | 166 (10.6%) |
| 8:30 AM to 8:59 AM | 82 (4.0%) | 98 (6.3%) |
| 9:00 AM to 9:59 AM | 184 (9.0%) | 106 (6.8%) |
| 10:00 AM to 10:59 AM | 40 (2.0%) | 18 (1.2%) |
| 11:00 AM to 11:59 AM | 23 (1.1%) | 49 (3.2%) |
| 12:00 PM to 3:59 PM | 274 (13.4%) | 108 (6.9%) |
| 4:00 PM to 11:59 PM | 269 (13.2%) | 75 (4.8%) |
| Total | 2,043 (100.0%) | 1,558 (100.0%) |
Housing Occupancy in DuBois
Occupancy by Ownership in DuBois
Of the total 3,372 dwellings in DuBois, owner-occupied units account for 2,028 (60.1%), while renter-occupied units make up 1,344 (39.9%).
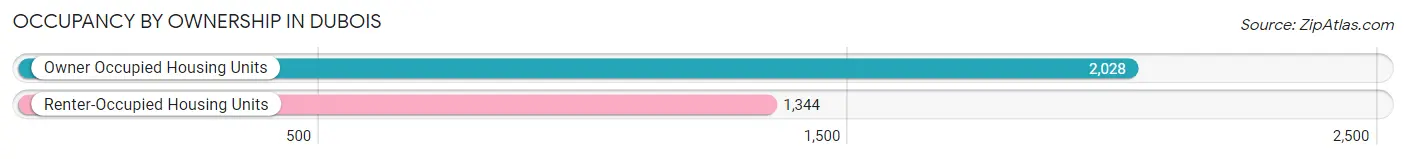
| Occupancy | # Housing Units | % Housing Units |
| Owner Occupied Housing Units | 2,028 | 60.1% |
| Renter-Occupied Housing Units | 1,344 | 39.9% |
| Total Occupied Housing Units | 3,372 | 100.0% |
Occupancy by Household Size in DuBois
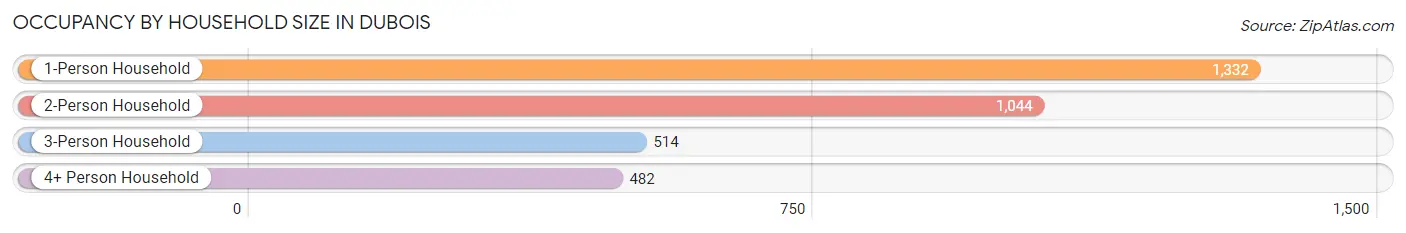
| Household Size | # Housing Units | % Housing Units |
| 1-Person Household | 1,332 | 39.5% |
| 2-Person Household | 1,044 | 31.0% |
| 3-Person Household | 514 | 15.2% |
| 4+ Person Household | 482 | 14.3% |
| Total Housing Units | 3,372 | 100.0% |
Occupancy by Ownership by Household Size in DuBois
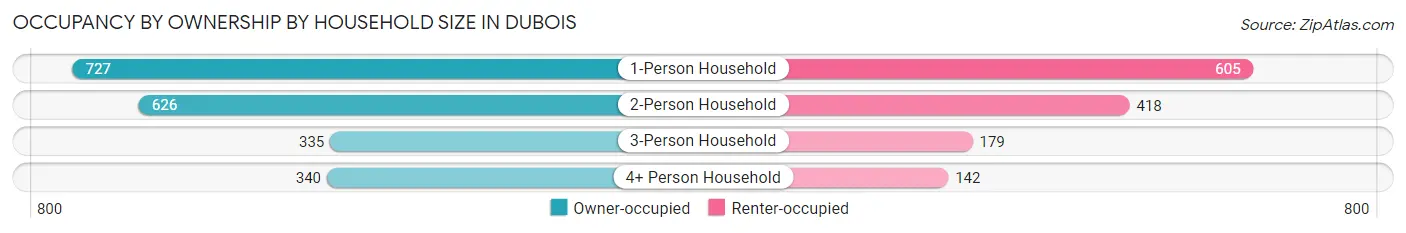
| Household Size | Owner-occupied | Renter-occupied |
| 1-Person Household | 727 (54.6%) | 605 (45.4%) |
| 2-Person Household | 626 (60.0%) | 418 (40.0%) |
| 3-Person Household | 335 (65.2%) | 179 (34.8%) |
| 4+ Person Household | 340 (70.5%) | 142 (29.5%) |
| Total Housing Units | 2,028 (60.1%) | 1,344 (39.9%) |
Occupancy by Educational Attainment in DuBois
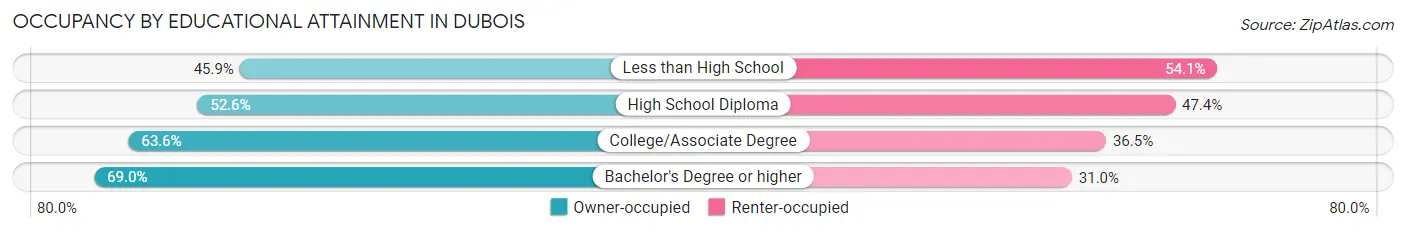
| Household Size | Owner-occupied | Renter-occupied |
| Less than High School | 89 (45.9%) | 105 (54.1%) |
| High School Diploma | 648 (52.6%) | 584 (47.4%) |
| College/Associate Degree | 598 (63.5%) | 343 (36.4%) |
| Bachelor's Degree or higher | 693 (69.0%) | 312 (31.0%) |
Occupancy by Age of Householder in DuBois
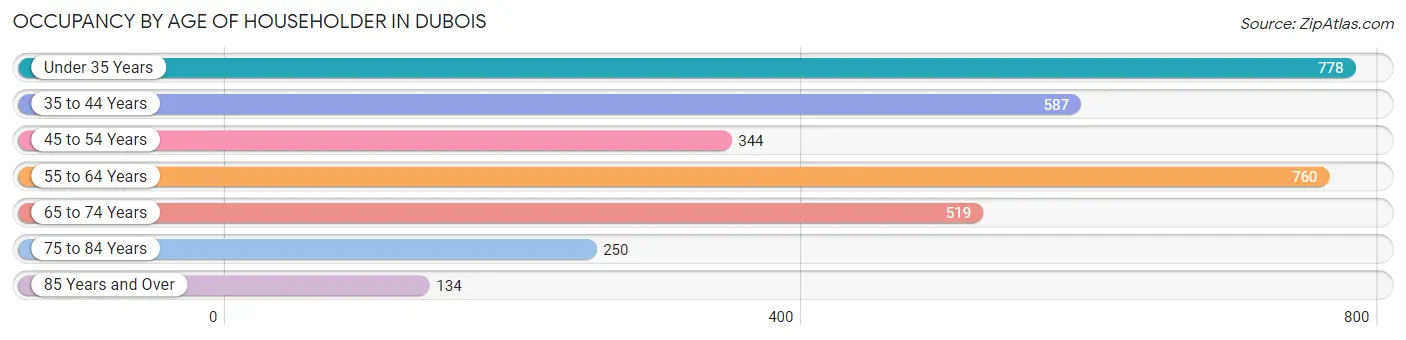
| Age Bracket | # Households | % Households |
| Under 35 Years | 778 | 23.1% |
| 35 to 44 Years | 587 | 17.4% |
| 45 to 54 Years | 344 | 10.2% |
| 55 to 64 Years | 760 | 22.5% |
| 65 to 74 Years | 519 | 15.4% |
| 75 to 84 Years | 250 | 7.4% |
| 85 Years and Over | 134 | 4.0% |
| Total | 3,372 | 100.0% |
Housing Finances in DuBois
Median Income by Occupancy in DuBois
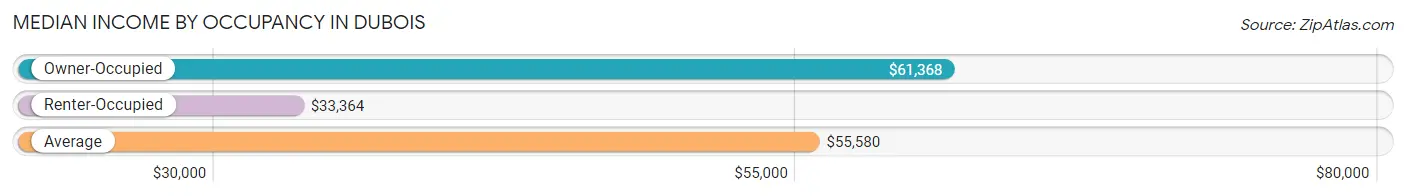
| Occupancy Type | # Households | Median Income |
| Owner-Occupied | 2,028 (60.1%) | $61,368 |
| Renter-Occupied | 1,344 (39.9%) | $33,364 |
| Average | 3,372 (100.0%) | $55,580 |
Occupancy by Householder Income Bracket in DuBois
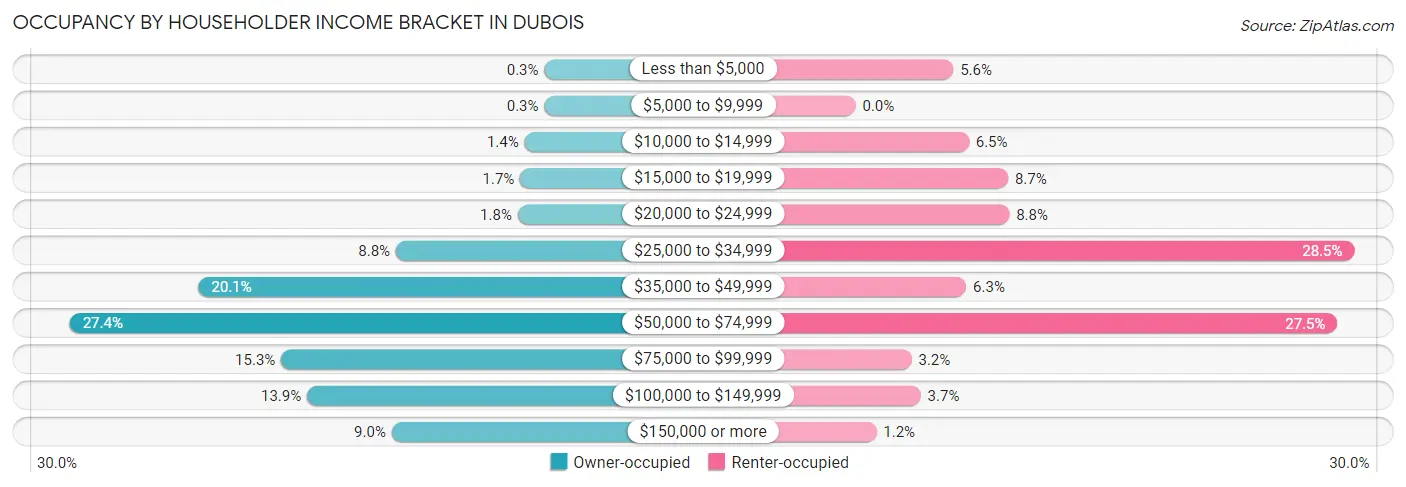
| Income Bracket | Owner-occupied | Renter-occupied |
| Less than $5,000 | 6 (0.3%) | 75 (5.6%) |
| $5,000 to $9,999 | 6 (0.3%) | 0 (0.0%) |
| $10,000 to $14,999 | 29 (1.4%) | 87 (6.5%) |
| $15,000 to $19,999 | 34 (1.7%) | 117 (8.7%) |
| $20,000 to $24,999 | 37 (1.8%) | 118 (8.8%) |
| $25,000 to $34,999 | 178 (8.8%) | 383 (28.5%) |
| $35,000 to $49,999 | 407 (20.1%) | 85 (6.3%) |
| $50,000 to $74,999 | 556 (27.4%) | 370 (27.5%) |
| $75,000 to $99,999 | 311 (15.3%) | 43 (3.2%) |
| $100,000 to $149,999 | 281 (13.9%) | 50 (3.7%) |
| $150,000 or more | 183 (9.0%) | 16 (1.2%) |
| Total | 2,028 (100.0%) | 1,344 (100.0%) |
Monthly Housing Cost Tiers in DuBois
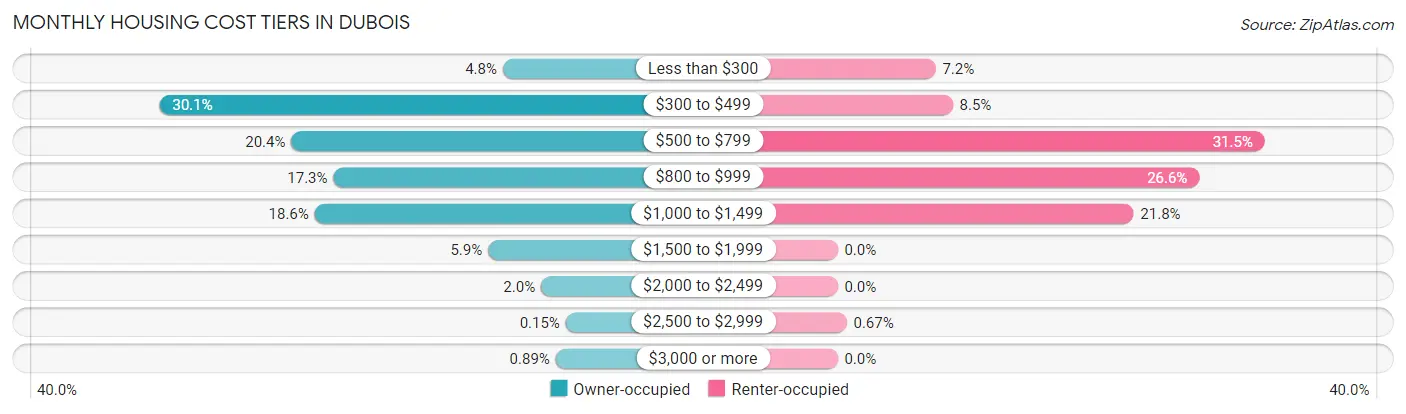
| Monthly Cost | Owner-occupied | Renter-occupied |
| Less than $300 | 97 (4.8%) | 97 (7.2%) |
| $300 to $499 | 610 (30.1%) | 114 (8.5%) |
| $500 to $799 | 413 (20.4%) | 423 (31.5%) |
| $800 to $999 | 350 (17.3%) | 358 (26.6%) |
| $1,000 to $1,499 | 378 (18.6%) | 293 (21.8%) |
| $1,500 to $1,999 | 119 (5.9%) | 0 (0.0%) |
| $2,000 to $2,499 | 40 (2.0%) | 0 (0.0%) |
| $2,500 to $2,999 | 3 (0.2%) | 9 (0.7%) |
| $3,000 or more | 18 (0.9%) | 0 (0.0%) |
| Total | 2,028 (100.0%) | 1,344 (100.0%) |
Physical Housing Characteristics in DuBois
Housing Structures in DuBois
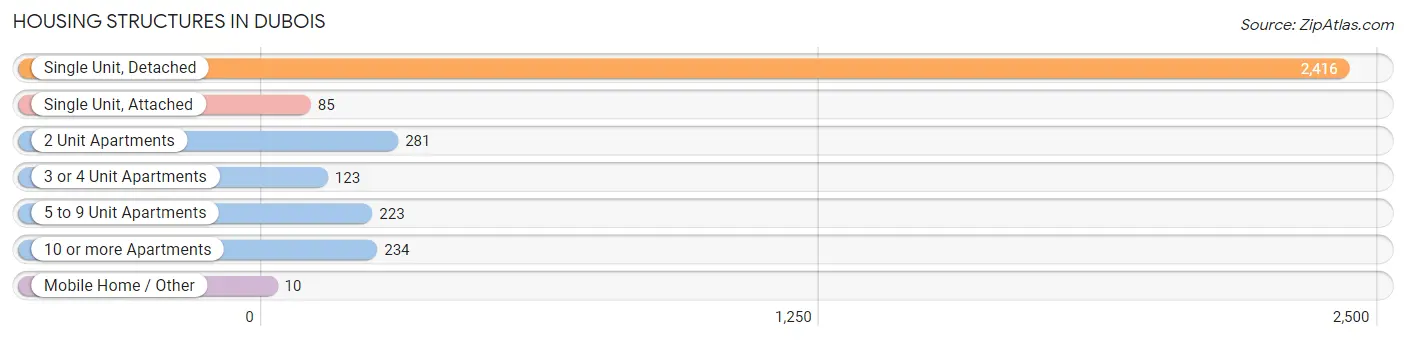
| Structure Type | # Housing Units | % Housing Units |
| Single Unit, Detached | 2,416 | 71.7% |
| Single Unit, Attached | 85 | 2.5% |
| 2 Unit Apartments | 281 | 8.3% |
| 3 or 4 Unit Apartments | 123 | 3.6% |
| 5 to 9 Unit Apartments | 223 | 6.6% |
| 10 or more Apartments | 234 | 6.9% |
| Mobile Home / Other | 10 | 0.3% |
| Total | 3,372 | 100.0% |
Housing Structures by Occupancy in DuBois
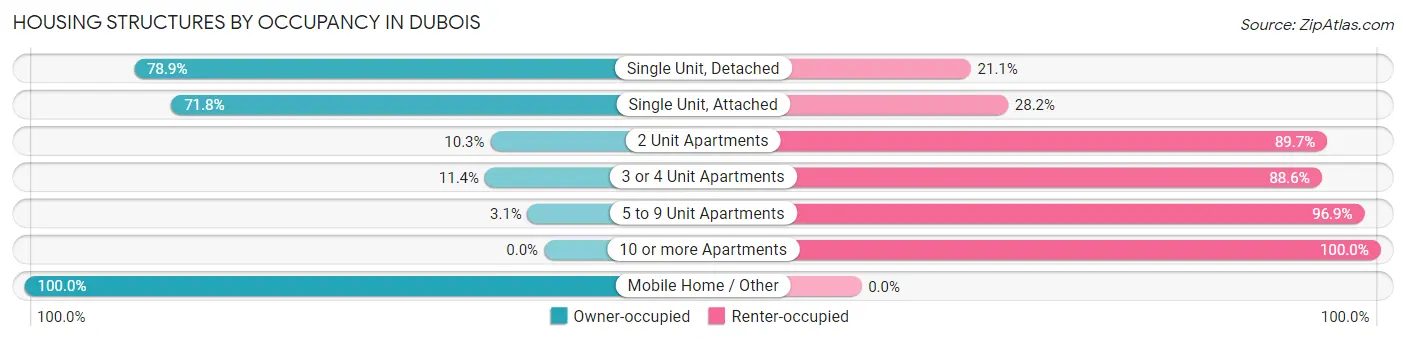
| Structure Type | Owner-occupied | Renter-occupied |
| Single Unit, Detached | 1,907 (78.9%) | 509 (21.1%) |
| Single Unit, Attached | 61 (71.8%) | 24 (28.2%) |
| 2 Unit Apartments | 29 (10.3%) | 252 (89.7%) |
| 3 or 4 Unit Apartments | 14 (11.4%) | 109 (88.6%) |
| 5 to 9 Unit Apartments | 7 (3.1%) | 216 (96.9%) |
| 10 or more Apartments | 0 (0.0%) | 234 (100.0%) |
| Mobile Home / Other | 10 (100.0%) | 0 (0.0%) |
| Total | 2,028 (60.1%) | 1,344 (39.9%) |
Housing Structures by Number of Rooms in DuBois
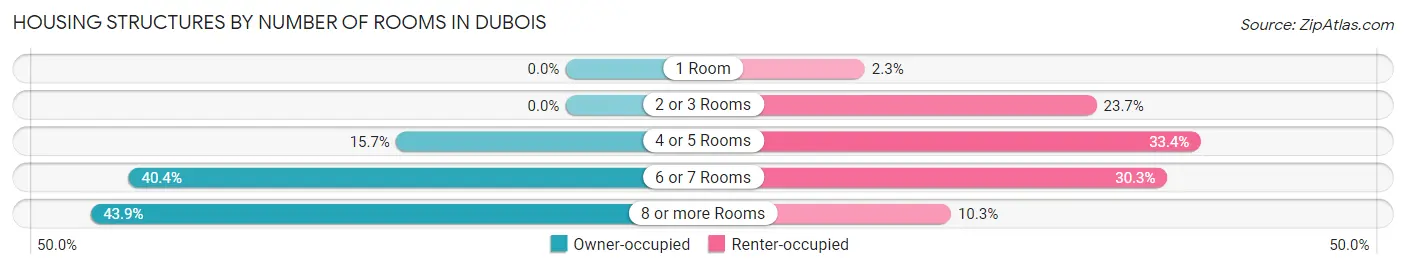
| Number of Rooms | Owner-occupied | Renter-occupied |
| 1 Room | 0 (0.0%) | 31 (2.3%) |
| 2 or 3 Rooms | 0 (0.0%) | 319 (23.7%) |
| 4 or 5 Rooms | 318 (15.7%) | 449 (33.4%) |
| 6 or 7 Rooms | 819 (40.4%) | 407 (30.3%) |
| 8 or more Rooms | 891 (43.9%) | 138 (10.3%) |
| Total | 2,028 (100.0%) | 1,344 (100.0%) |
Housing Structure by Heating Type in DuBois
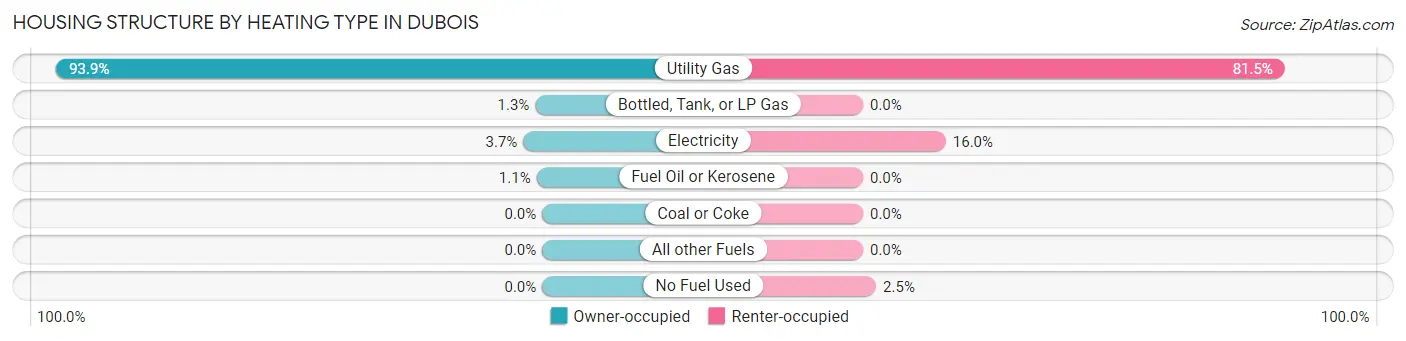
| Heating Type | Owner-occupied | Renter-occupied |
| Utility Gas | 1,905 (93.9%) | 1,095 (81.5%) |
| Bottled, Tank, or LP Gas | 27 (1.3%) | 0 (0.0%) |
| Electricity | 74 (3.6%) | 215 (16.0%) |
| Fuel Oil or Kerosene | 22 (1.1%) | 0 (0.0%) |
| Coal or Coke | 0 (0.0%) | 0 (0.0%) |
| All other Fuels | 0 (0.0%) | 0 (0.0%) |
| No Fuel Used | 0 (0.0%) | 34 (2.5%) |
| Total | 2,028 (100.0%) | 1,344 (100.0%) |
Household Vehicle Usage in DuBois
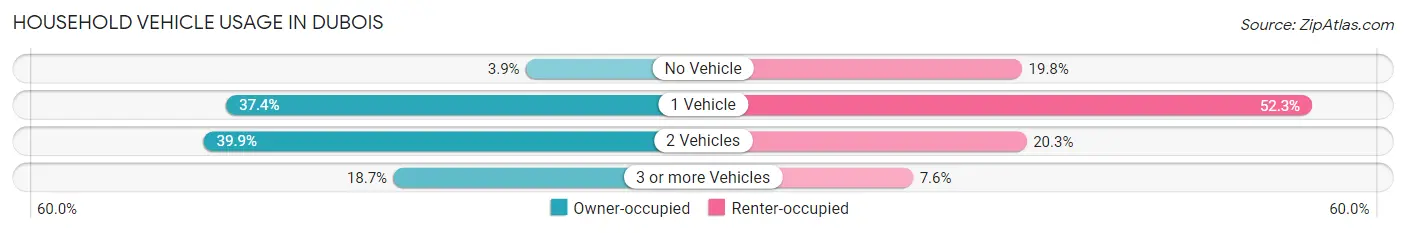
| Vehicles per Household | Owner-occupied | Renter-occupied |
| No Vehicle | 79 (3.9%) | 266 (19.8%) |
| 1 Vehicle | 759 (37.4%) | 703 (52.3%) |
| 2 Vehicles | 810 (39.9%) | 273 (20.3%) |
| 3 or more Vehicles | 380 (18.7%) | 102 (7.6%) |
| Total | 2,028 (100.0%) | 1,344 (100.0%) |
Real Estate & Mortgages in DuBois
Real Estate and Mortgage Overview in DuBois
| Characteristic | Without Mortgage | With Mortgage |
| Housing Units | 1,008 | 1,020 |
| Median Property Value | $117,800 | $107,500 |
| Median Household Income | $56,711 | $104 |
| Monthly Housing Costs | $437 | $18 |
| Real Estate Taxes | $1,250 | $0 |
Property Value by Mortgage Status in DuBois
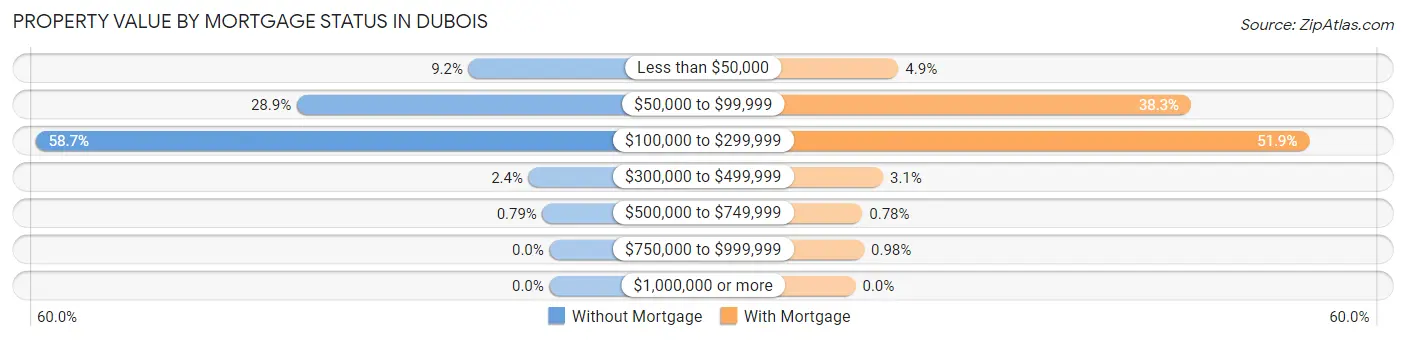
| Property Value | Without Mortgage | With Mortgage |
| Less than $50,000 | 93 (9.2%) | 50 (4.9%) |
| $50,000 to $99,999 | 291 (28.9%) | 391 (38.3%) |
| $100,000 to $299,999 | 592 (58.7%) | 529 (51.9%) |
| $300,000 to $499,999 | 24 (2.4%) | 32 (3.1%) |
| $500,000 to $749,999 | 8 (0.8%) | 8 (0.8%) |
| $750,000 to $999,999 | 0 (0.0%) | 10 (1.0%) |
| $1,000,000 or more | 0 (0.0%) | 0 (0.0%) |
| Total | 1,008 (100.0%) | 1,020 (100.0%) |
Household Income by Mortgage Status in DuBois
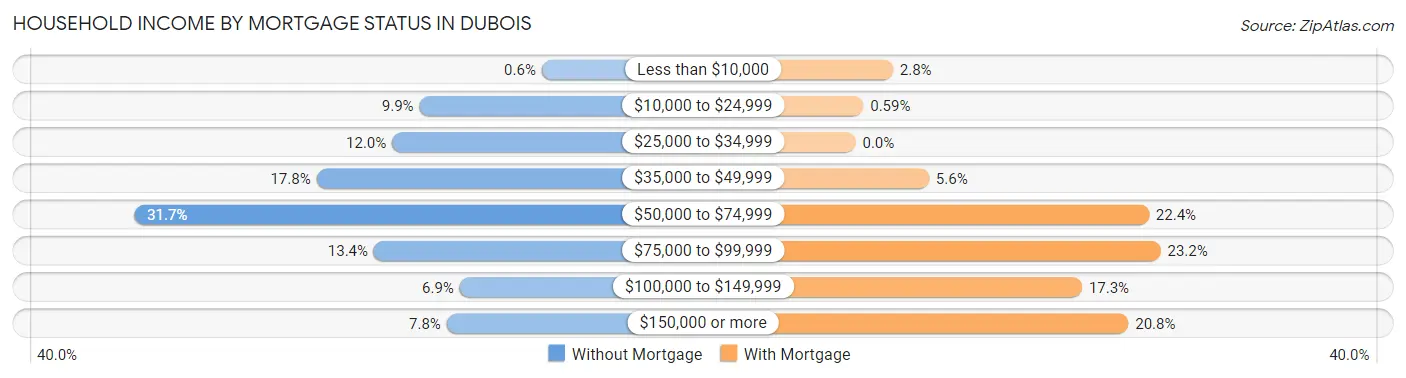
| Household Income | Without Mortgage | With Mortgage |
| Less than $10,000 | 6 (0.6%) | 29 (2.8%) |
| $10,000 to $24,999 | 100 (9.9%) | 6 (0.6%) |
| $25,000 to $34,999 | 121 (12.0%) | 0 (0.0%) |
| $35,000 to $49,999 | 179 (17.8%) | 57 (5.6%) |
| $50,000 to $74,999 | 319 (31.7%) | 228 (22.4%) |
| $75,000 to $99,999 | 135 (13.4%) | 237 (23.2%) |
| $100,000 to $149,999 | 69 (6.9%) | 176 (17.2%) |
| $150,000 or more | 79 (7.8%) | 212 (20.8%) |
| Total | 1,008 (100.0%) | 1,020 (100.0%) |
Property Value to Household Income Ratio in DuBois
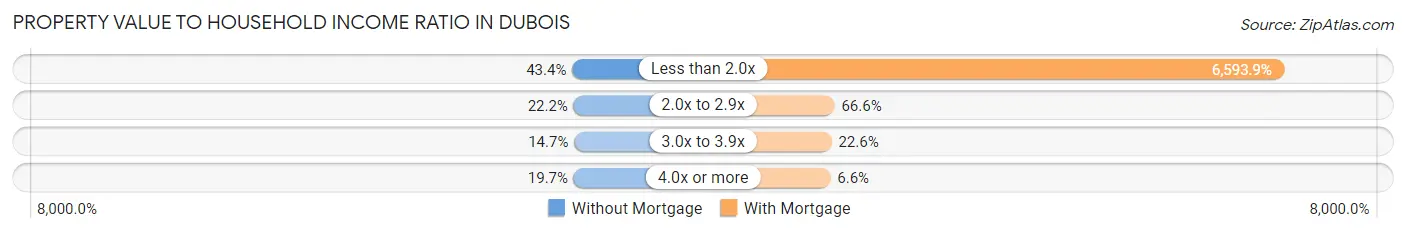
| Value-to-Income Ratio | Without Mortgage | With Mortgage |
| Less than 2.0x | 437 (43.3%) | 67,258 (6,593.9%) |
| 2.0x to 2.9x | 224 (22.2%) | 679 (66.6%) |
| 3.0x to 3.9x | 148 (14.7%) | 230 (22.6%) |
| 4.0x or more | 199 (19.7%) | 67 (6.6%) |
| Total | 1,008 (100.0%) | 1,020 (100.0%) |
Real Estate Taxes by Mortgage Status in DuBois
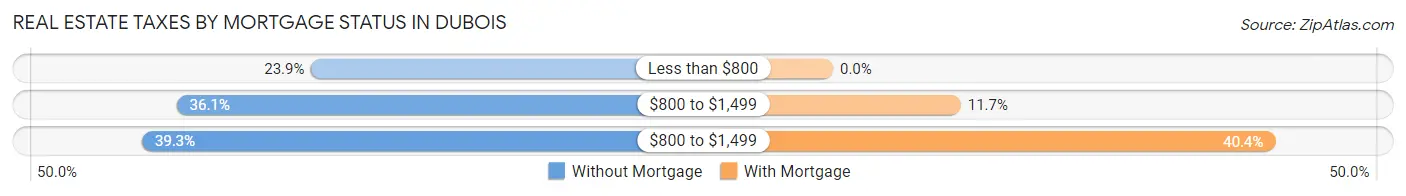
| Property Taxes | Without Mortgage | With Mortgage |
| Less than $800 | 241 (23.9%) | 0 (0.0%) |
| $800 to $1,499 | 364 (36.1%) | 119 (11.7%) |
| $800 to $1,499 | 396 (39.3%) | 412 (40.4%) |
| Total | 1,008 (100.0%) | 1,020 (100.0%) |
Health & Disability in DuBois
Health Insurance Coverage by Age in DuBois
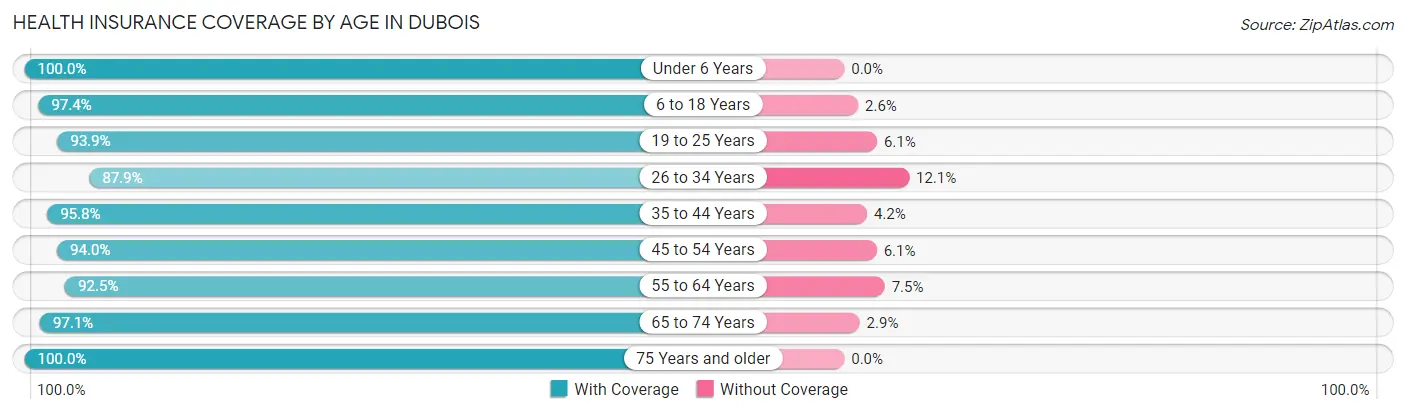
| Age Bracket | With Coverage | Without Coverage |
| Under 6 Years | 366 (100.0%) | 0 (0.0%) |
| 6 to 18 Years | 1,286 (97.4%) | 34 (2.6%) |
| 19 to 25 Years | 877 (93.9%) | 57 (6.1%) |
| 26 to 34 Years | 787 (87.9%) | 108 (12.1%) |
| 35 to 44 Years | 792 (95.8%) | 35 (4.2%) |
| 45 to 54 Years | 746 (94.0%) | 48 (6.0%) |
| 55 to 64 Years | 908 (92.5%) | 74 (7.5%) |
| 65 to 74 Years | 816 (97.1%) | 24 (2.9%) |
| 75 Years and older | 534 (100.0%) | 0 (0.0%) |
| Total | 7,112 (94.9%) | 380 (5.1%) |
Health Insurance Coverage by Citizenship Status in DuBois
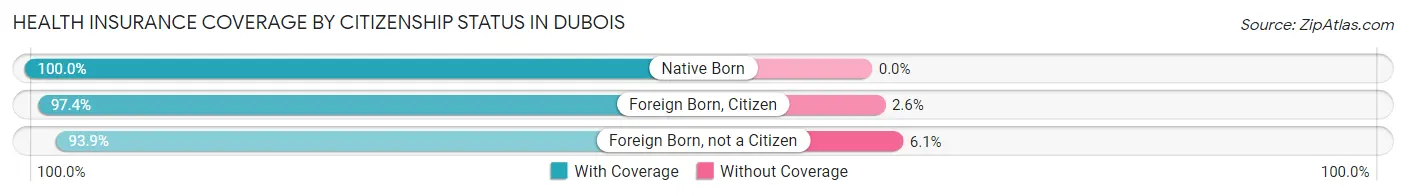
| Citizenship Status | With Coverage | Without Coverage |
| Native Born | 366 (100.0%) | 0 (0.0%) |
| Foreign Born, Citizen | 1,286 (97.4%) | 34 (2.6%) |
| Foreign Born, not a Citizen | 877 (93.9%) | 57 (6.1%) |
Health Insurance Coverage by Household Income in DuBois
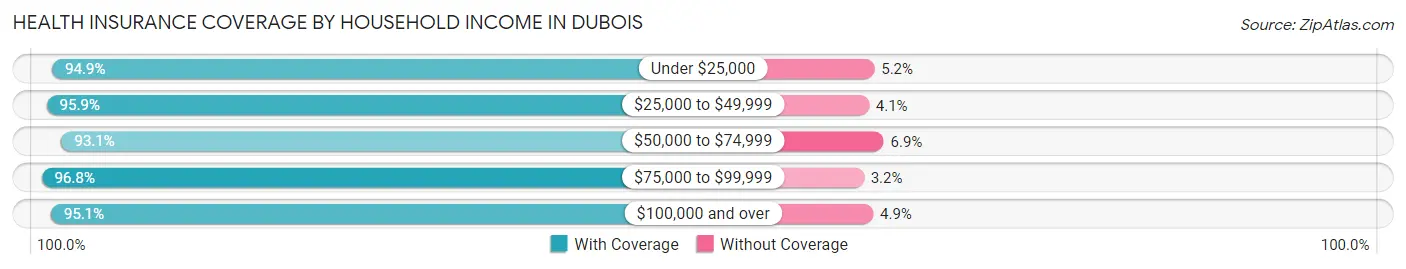
| Household Income | With Coverage | Without Coverage |
| Under $25,000 | 608 (94.9%) | 33 (5.1%) |
| $25,000 to $49,999 | 1,810 (95.9%) | 78 (4.1%) |
| $50,000 to $74,999 | 2,117 (93.1%) | 157 (6.9%) |
| $75,000 to $99,999 | 947 (96.8%) | 31 (3.2%) |
| $100,000 and over | 1,562 (95.1%) | 81 (4.9%) |
Public vs Private Health Insurance Coverage by Age in DuBois
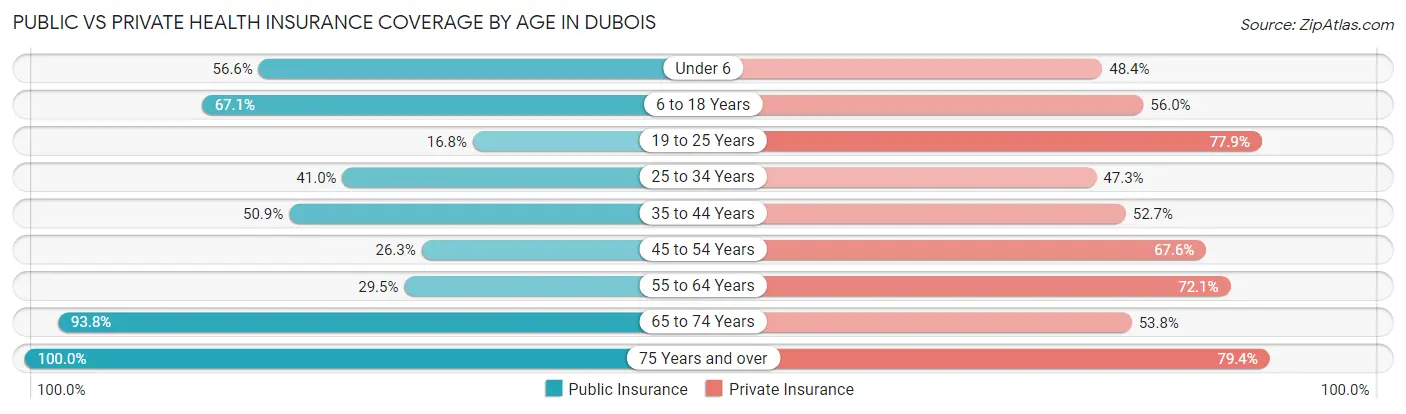
| Age Bracket | Public Insurance | Private Insurance |
| Under 6 | 207 (56.6%) | 177 (48.4%) |
| 6 to 18 Years | 886 (67.1%) | 739 (56.0%) |
| 19 to 25 Years | 157 (16.8%) | 728 (77.9%) |
| 25 to 34 Years | 367 (41.0%) | 423 (47.3%) |
| 35 to 44 Years | 421 (50.9%) | 436 (52.7%) |
| 45 to 54 Years | 209 (26.3%) | 537 (67.6%) |
| 55 to 64 Years | 290 (29.5%) | 708 (72.1%) |
| 65 to 74 Years | 788 (93.8%) | 452 (53.8%) |
| 75 Years and over | 534 (100.0%) | 424 (79.4%) |
| Total | 3,859 (51.5%) | 4,624 (61.7%) |
Disability Status by Sex by Age in DuBois
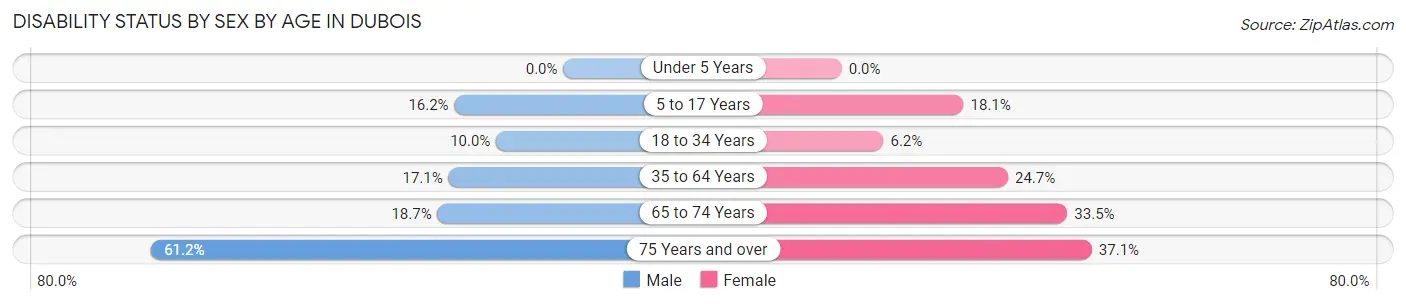
| Age Bracket | Male | Female |
| Under 5 Years | 0 (0.0%) | 0 (0.0%) |
| 5 to 17 Years | 93 (16.2%) | 125 (18.1%) |
| 18 to 34 Years | 115 (10.0%) | 52 (6.2%) |
| 35 to 64 Years | 207 (17.1%) | 343 (24.7%) |
| 65 to 74 Years | 80 (18.7%) | 138 (33.5%) |
| 75 Years and over | 134 (61.2%) | 117 (37.1%) |
Disability Class by Sex by Age in DuBois
Disability Class: Hearing Difficulty
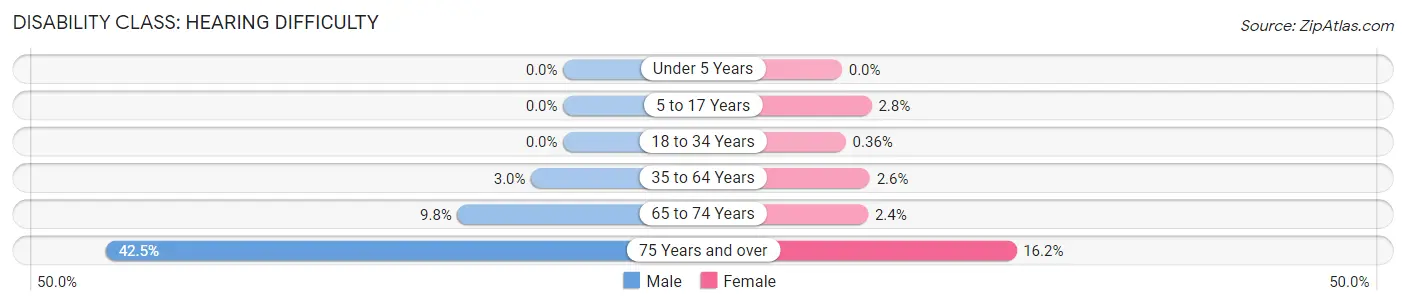
| Age Bracket | Male | Female |
| Under 5 Years | 0 (0.0%) | 0 (0.0%) |
| 5 to 17 Years | 0 (0.0%) | 19 (2.8%) |
| 18 to 34 Years | 0 (0.0%) | 3 (0.4%) |
| 35 to 64 Years | 36 (3.0%) | 36 (2.6%) |
| 65 to 74 Years | 42 (9.8%) | 10 (2.4%) |
| 75 Years and over | 93 (42.5%) | 51 (16.2%) |
Disability Class: Vision Difficulty
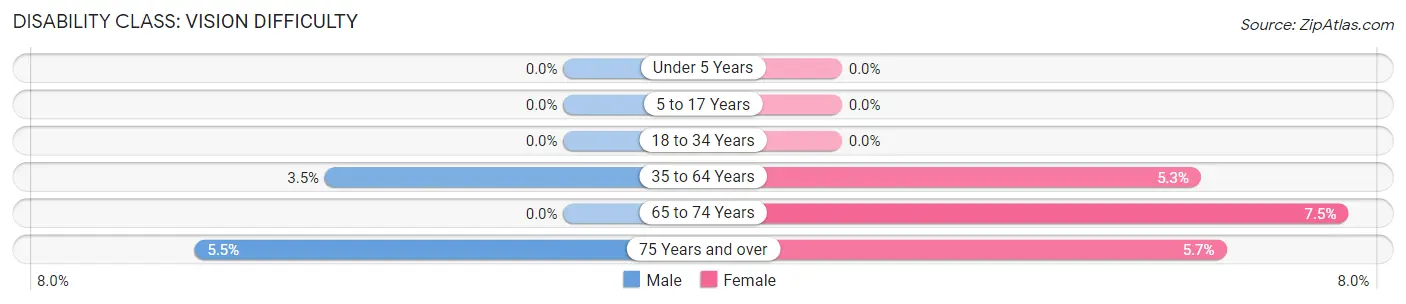
| Age Bracket | Male | Female |
| Under 5 Years | 0 (0.0%) | 0 (0.0%) |
| 5 to 17 Years | 0 (0.0%) | 0 (0.0%) |
| 18 to 34 Years | 0 (0.0%) | 0 (0.0%) |
| 35 to 64 Years | 43 (3.5%) | 74 (5.3%) |
| 65 to 74 Years | 0 (0.0%) | 31 (7.5%) |
| 75 Years and over | 12 (5.5%) | 18 (5.7%) |
Disability Class: Cognitive Difficulty
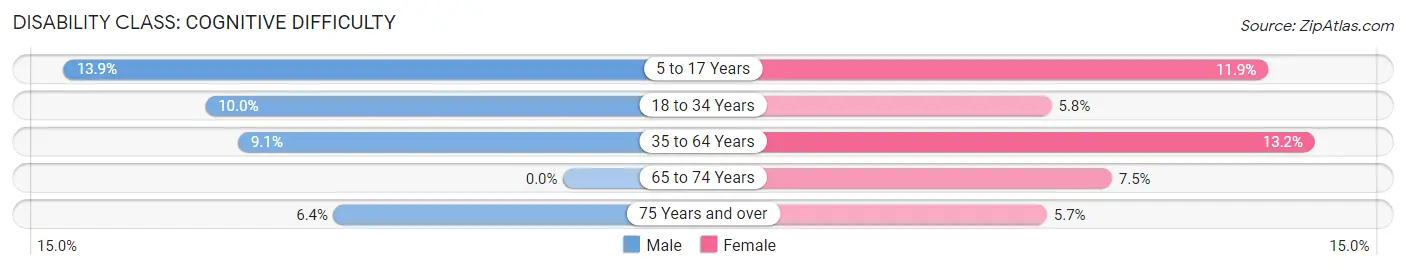
| Age Bracket | Male | Female |
| 5 to 17 Years | 80 (13.9%) | 82 (11.9%) |
| 18 to 34 Years | 115 (10.0%) | 49 (5.8%) |
| 35 to 64 Years | 110 (9.1%) | 183 (13.2%) |
| 65 to 74 Years | 0 (0.0%) | 31 (7.5%) |
| 75 Years and over | 14 (6.4%) | 18 (5.7%) |
Disability Class: Ambulatory Difficulty
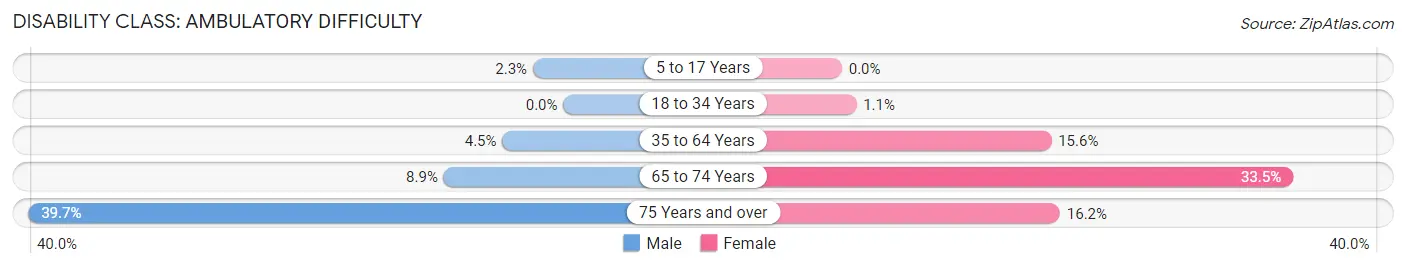
| Age Bracket | Male | Female |
| 5 to 17 Years | 13 (2.3%) | 0 (0.0%) |
| 18 to 34 Years | 0 (0.0%) | 9 (1.1%) |
| 35 to 64 Years | 55 (4.5%) | 216 (15.5%) |
| 65 to 74 Years | 38 (8.9%) | 138 (33.5%) |
| 75 Years and over | 87 (39.7%) | 51 (16.2%) |
Disability Class: Self-Care Difficulty
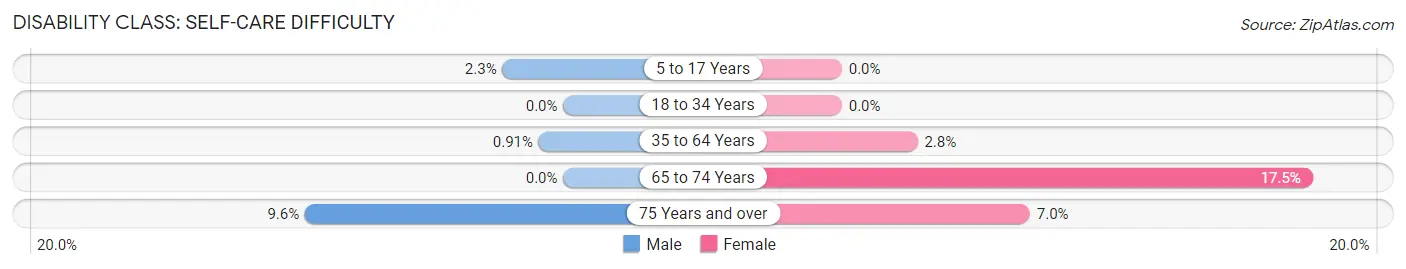
| Age Bracket | Male | Female |
| 5 to 17 Years | 13 (2.3%) | 0 (0.0%) |
| 18 to 34 Years | 0 (0.0%) | 0 (0.0%) |
| 35 to 64 Years | 11 (0.9%) | 39 (2.8%) |
| 65 to 74 Years | 0 (0.0%) | 72 (17.5%) |
| 75 Years and over | 21 (9.6%) | 22 (7.0%) |
Technology Access in DuBois
Computing Device Access in DuBois
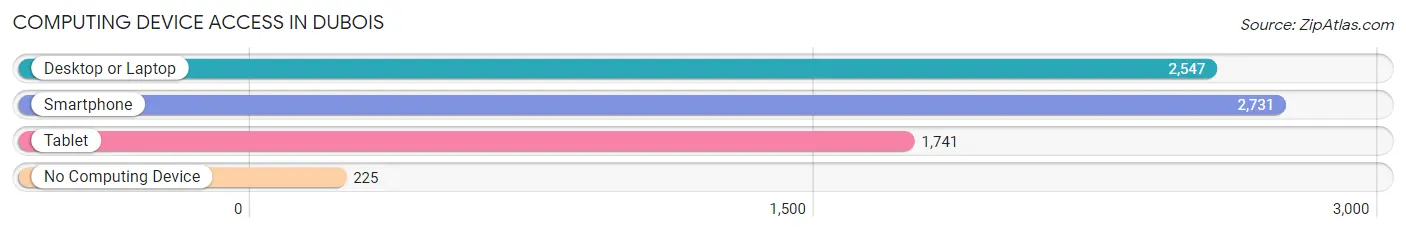
| Device Type | # Households | % Households |
| Desktop or Laptop | 2,547 | 75.5% |
| Smartphone | 2,731 | 81.0% |
| Tablet | 1,741 | 51.6% |
| No Computing Device | 225 | 6.7% |
| Total | 3,372 | 100.0% |
Internet Access in DuBois
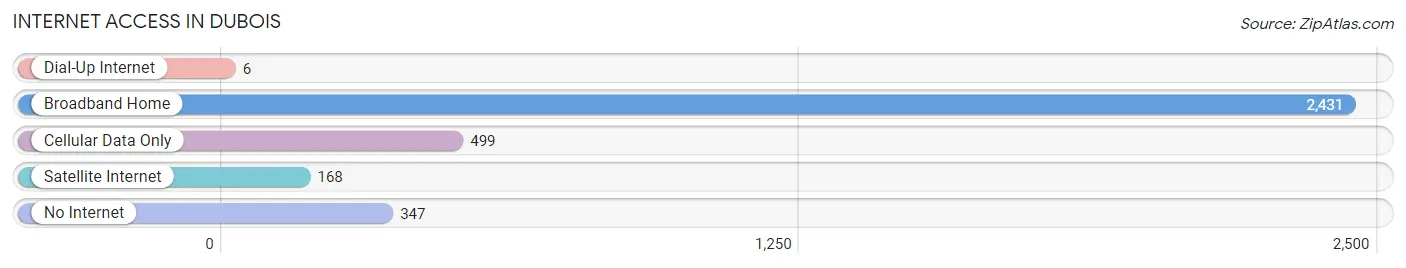
| Internet Type | # Households | % Households |
| Dial-Up Internet | 6 | 0.2% |
| Broadband Home | 2,431 | 72.1% |
| Cellular Data Only | 499 | 14.8% |
| Satellite Internet | 168 | 5.0% |
| No Internet | 347 | 10.3% |
| Total | 3,372 | 100.0% |
DuBois Summary
DuBois, Pennsylvania is a small city located in Clearfield County in the state of Pennsylvania. It is situated in the foothills of the Allegheny Mountains and is the largest city in the county. The city was founded in 1812 and was named after the French explorer, Pierre-Charles DuBois. The city has a population of 8,123 as of the 2020 census.
Geography
DuBois is located in the foothills of the Allegheny Mountains in Clearfield County, Pennsylvania. The city is situated at an elevation of 1,845 feet above sea level and is located at the intersection of Interstate 80 and U.S. Route 219. The city is surrounded by the townships of Sandy, Brady, Union, and Lawrence. The city is located approximately 75 miles northeast of Pittsburgh and is part of the DuBois, PA Metropolitan Statistical Area.
The city is located in a valley surrounded by hills and mountains. The city is located in a humid continental climate zone and experiences four distinct seasons. The average annual temperature is around 50 degrees Fahrenheit and the average annual precipitation is around 40 inches.
Economy
DuBois is a small city with a diverse economy. The city is home to several large employers, including Penn State DuBois, DuBois Regional Medical Center, and the DuBois Area School District. The city is also home to several small businesses, including restaurants, retail stores, and professional services.
The city is also home to several manufacturing companies, including DuBois Chemicals, DuBois Plastics, and DuBois Foundry. The city is also home to several energy companies, including DuBois Energy and DuBois Wind Energy.
Demographics
As of the 2020 census, the population of DuBois was 8,123. The city has a population density of 1,845 people per square mile. The median age of the population is 41.7 years old. The median household income is $41,945 and the median family income is $50,945.
The racial makeup of the city is 95.2% White, 1.2% African American, 0.3% Native American, 0.7% Asian, 0.1% Pacific Islander, 0.7% from other races, and 1.9% from two or more races. The population is also 2.2% Hispanic or Latino of any race.
Conclusion
DuBois, Pennsylvania is a small city located in Clearfield County in the state of Pennsylvania. It is situated in the foothills of the Allegheny Mountains and is the largest city in the county. The city was founded in 1812 and was named after the French explorer, Pierre-Charles DuBois. The city has a population of 8,123 as of the 2020 census. The city is located in a valley surrounded by hills and mountains and experiences a humid continental climate. The city has a diverse economy with several large employers and small businesses. The population is 95.2% White, 1.2% African American, 0.3% Native American, 0.7% Asian, 0.1% Pacific Islander, 0.7% from other races, and 1.9% from two or more races. The median age of the population is 41.7 years old and the median household income is $41,945.
Common Questions
What is Per Capita Income in DuBois?
Per Capita income in DuBois is $30,041.
What is the Median Family Income in DuBois?
Median Family Income in DuBois is $65,530.
What is the Median Household income in DuBois?
Median Household Income in DuBois is $55,580.
What is Income or Wage Gap in DuBois?
Income or Wage Gap in DuBois is 22.4%.
Women in DuBois earn 77.6 cents for every dollar earned by a man.
What is Family Income Deficit in DuBois?
Family Income Deficit in DuBois is $5,153.
Families that are below poverty line in DuBois earn $5,153 less on average than the poverty threshold level.
What is Inequality or Gini Index in DuBois?
Inequality or Gini Index in DuBois is 0.38.
What is the Total Population of DuBois?
Total Population of DuBois is 7,509.
What is the Total Male Population of DuBois?
Total Male Population of DuBois is 3,758.
What is the Total Female Population of DuBois?
Total Female Population of DuBois is 3,751.
What is the Ratio of Males per 100 Females in DuBois?
There are 100.19 Males per 100 Females in DuBois.
What is the Ratio of Females per 100 Males in DuBois?
There are 99.81 Females per 100 Males in DuBois.
What is the Median Population Age in DuBois?
Median Population Age in DuBois is 37.7 Years.
What is the Average Family Size in DuBois
Average Family Size in DuBois is 3.1 People.
What is the Average Household Size in DuBois
Average Household Size in DuBois is 2.2 People.
How Large is the Labor Force in DuBois?
There are 4,077 People in the Labor Forcein in DuBois.
What is the Percentage of People in the Labor Force in DuBois?
65.6% of People are in the Labor Force in DuBois.
What is the Unemployment Rate in DuBois?
Unemployment Rate in DuBois is 4.7%.