Tullytown borough, PA Map & Demographics
Tullytown borough Overview
$44,443
PER CAPITA INCOME
$89,318
AVG FAMILY INCOME
$68,898
AVG HOUSEHOLD INCOME
46.0%
WAGE / INCOME GAP [ % ]
54.0¢/ $1
WAGE / INCOME GAP [ $ ]
0.51
INEQUALITY / GINI INDEX
2,321
TOTAL POPULATION
1,183
MALE POPULATION
1,138
FEMALE POPULATION
103.95
MALES / 100 FEMALES
96.20
FEMALES / 100 MALES
40.0
MEDIAN AGE
3.0
AVG FAMILY SIZE
2.5
AVG HOUSEHOLD SIZE
1,244
LABOR FORCE [ PEOPLE ]
66.6%
PERCENT IN LABOR FORCE
3.3%
UNEMPLOYMENT RATE
Income in Tullytown borough
Income Overview in Tullytown borough
Per Capita Income in Tullytown borough is $44,443, while median incomes of families and households are $89,318 and $68,898 respectively.
| Characteristic | Number | Measure |
| Per Capita Income | 2,321 | $44,443 |
| Median Family Income | 632 | $89,318 |
| Mean Family Income | 632 | $122,554 |
| Median Household Income | 913 | $68,898 |
| Mean Household Income | 913 | $108,646 |
| Income Deficit | 632 | $0 |
| Wage / Income Gap (%) | 2,321 | 45.99% |
| Wage / Income Gap ($) | 2,321 | 54.01¢ per $1 |
| Gini / Inequality Index | 2,321 | 0.51 |
Earnings by Sex in Tullytown borough
Average Earnings in Tullytown borough are $45,349, $54,016 for men and $29,172 for women, a difference of 46.0%.
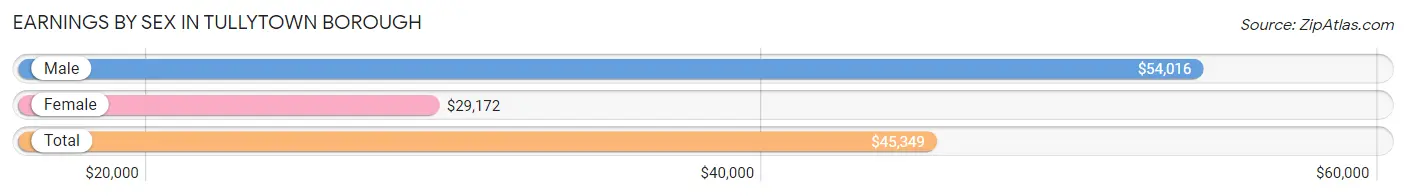
| Sex | Number | Average Earnings |
| Male | 771 (60.2%) | $54,016 |
| Female | 509 (39.8%) | $29,172 |
| Total | 1,280 (100.0%) | $45,349 |
Earnings by Sex by Income Bracket in Tullytown borough
The most common earnings brackets in Tullytown borough are $100,000+ for men (128 | 16.6%) and $25,000 to $29,999 for women (84 | 16.5%).
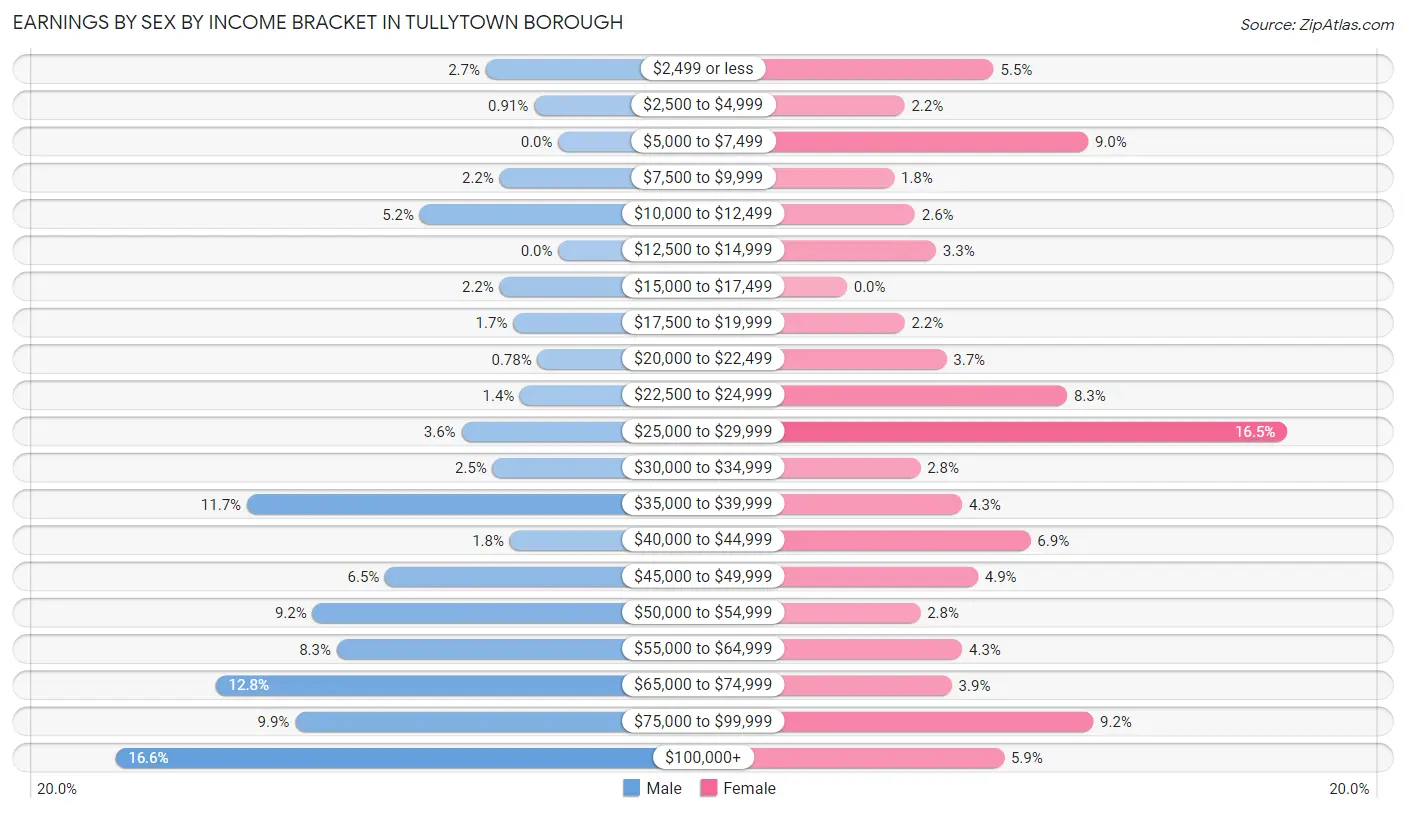
| Income | Male | Female |
| $2,499 or less | 21 (2.7%) | 28 (5.5%) |
| $2,500 to $4,999 | 7 (0.9%) | 11 (2.2%) |
| $5,000 to $7,499 | 0 (0.0%) | 46 (9.0%) |
| $7,500 to $9,999 | 17 (2.2%) | 9 (1.8%) |
| $10,000 to $12,499 | 40 (5.2%) | 13 (2.5%) |
| $12,500 to $14,999 | 0 (0.0%) | 17 (3.3%) |
| $15,000 to $17,499 | 17 (2.2%) | 0 (0.0%) |
| $17,500 to $19,999 | 13 (1.7%) | 11 (2.2%) |
| $20,000 to $22,499 | 6 (0.8%) | 19 (3.7%) |
| $22,500 to $24,999 | 11 (1.4%) | 42 (8.3%) |
| $25,000 to $29,999 | 28 (3.6%) | 84 (16.5%) |
| $30,000 to $34,999 | 19 (2.5%) | 14 (2.8%) |
| $35,000 to $39,999 | 90 (11.7%) | 22 (4.3%) |
| $40,000 to $44,999 | 14 (1.8%) | 35 (6.9%) |
| $45,000 to $49,999 | 50 (6.5%) | 25 (4.9%) |
| $50,000 to $54,999 | 71 (9.2%) | 14 (2.8%) |
| $55,000 to $64,999 | 64 (8.3%) | 22 (4.3%) |
| $65,000 to $74,999 | 99 (12.8%) | 20 (3.9%) |
| $75,000 to $99,999 | 76 (9.9%) | 47 (9.2%) |
| $100,000+ | 128 (16.6%) | 30 (5.9%) |
| Total | 771 (100.0%) | 509 (100.0%) |
Earnings by Sex by Educational Attainment in Tullytown borough
Average earnings in Tullytown borough are $59,695 for men and $39,911 for women, a difference of 33.1%. Men with an educational attainment of high school diploma enjoy the highest average annual earnings of $65,288, while those with graduate degree education earn the least with $11,474. Women with an educational attainment of graduate degree earn the most with the average annual earnings of $66,964, while those with less than high school education have the smallest earnings of $24,688.
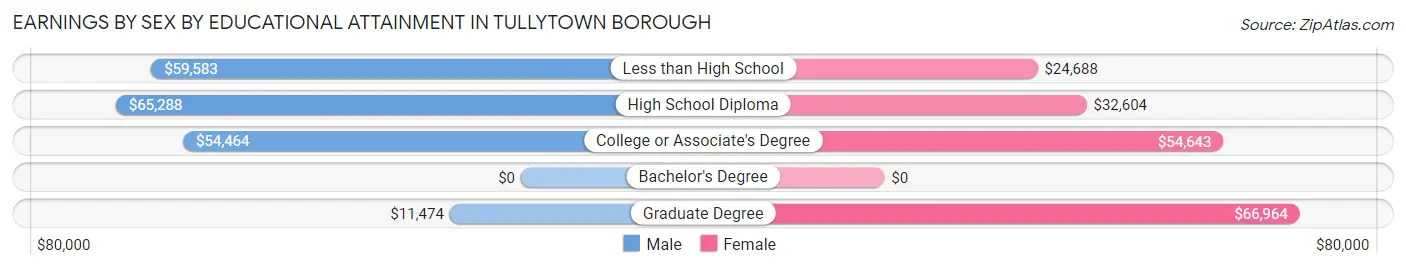
| Educational Attainment | Male Income | Female Income |
| Less than High School | $59,583 | $24,688 |
| High School Diploma | $65,288 | $32,604 |
| College or Associate's Degree | $54,464 | $54,643 |
| Bachelor's Degree | - | - |
| Graduate Degree | $11,474 | $66,964 |
| Total | $59,695 | $39,911 |
Family Income in Tullytown borough
Family Income Brackets in Tullytown borough
According to the Tullytown borough family income data, there are 161 families falling into the $50,000 to $74,999 income range, which is the most common income bracket and makes up 25.5% of all families. Conversely, the $10,000 to $14,999 income bracket is the least frequent group with only 9 families (1.4%) belonging to this category.
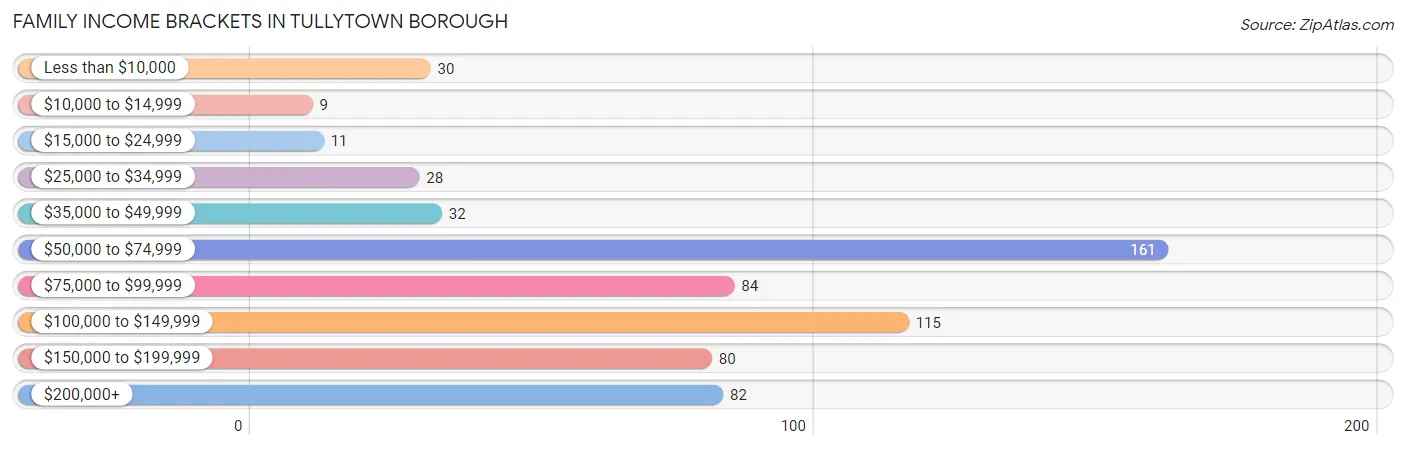
| Income Bracket | # Families | % Families |
| Less than $10,000 | 30 | 4.7% |
| $10,000 to $14,999 | 9 | 1.4% |
| $15,000 to $24,999 | 11 | 1.7% |
| $25,000 to $34,999 | 28 | 4.4% |
| $35,000 to $49,999 | 32 | 5.1% |
| $50,000 to $74,999 | 161 | 25.5% |
| $75,000 to $99,999 | 84 | 13.3% |
| $100,000 to $149,999 | 115 | 18.2% |
| $150,000 to $199,999 | 80 | 12.7% |
| $200,000+ | 82 | 13.0% |
Family Income by Famaliy Size in Tullytown borough
5-person families (42 | 6.7%) account for the highest median family income in Tullytown borough with $172,833 per family, while 3-person families (130 | 20.6%) have the highest median income of $45,227 per family member.
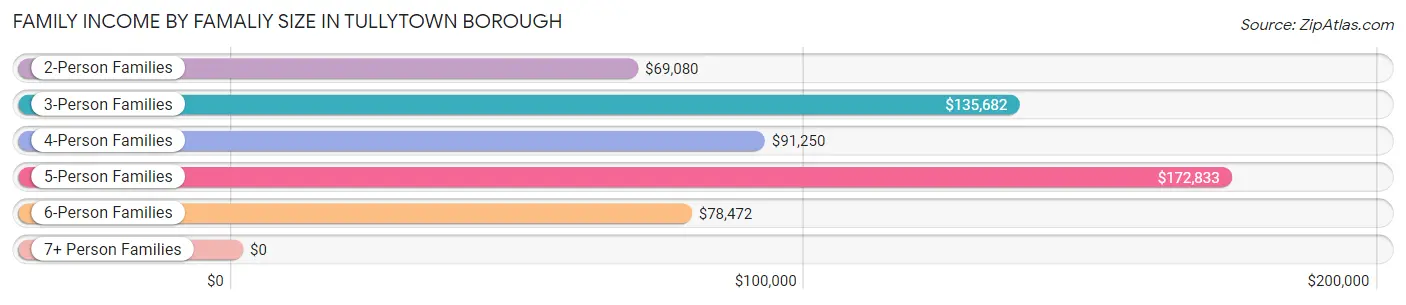
| Income Bracket | # Families | Median Income |
| 2-Person Families | 331 (52.4%) | $69,080 |
| 3-Person Families | 130 (20.6%) | $135,682 |
| 4-Person Families | 100 (15.8%) | $91,250 |
| 5-Person Families | 42 (6.7%) | $172,833 |
| 6-Person Families | 25 (4.0%) | $78,472 |
| 7+ Person Families | 4 (0.6%) | $0 |
| Total | 632 (100.0%) | $89,318 |
Family Income by Number of Earners in Tullytown borough
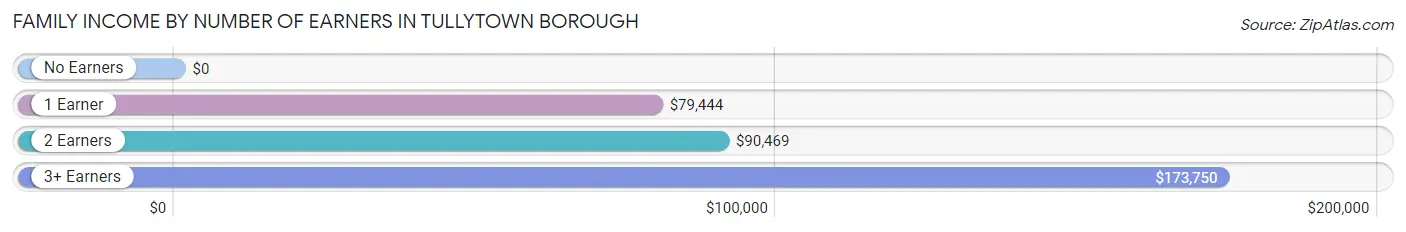
| Number of Earners | # Families | Median Income |
| No Earners | 77 (12.2%) | $0 |
| 1 Earner | 200 (31.7%) | $79,444 |
| 2 Earners | 281 (44.5%) | $90,469 |
| 3+ Earners | 74 (11.7%) | $173,750 |
| Total | 632 (100.0%) | $89,318 |
Household Income in Tullytown borough
Household Income Brackets in Tullytown borough
With 211 households falling in the category, the $50,000 to $74,999 income range is the most frequent in Tullytown borough, accounting for 23.1% of all households. In contrast, only 41 households (4.5%) fall into the less than $10,000 income bracket, making it the least populous group.
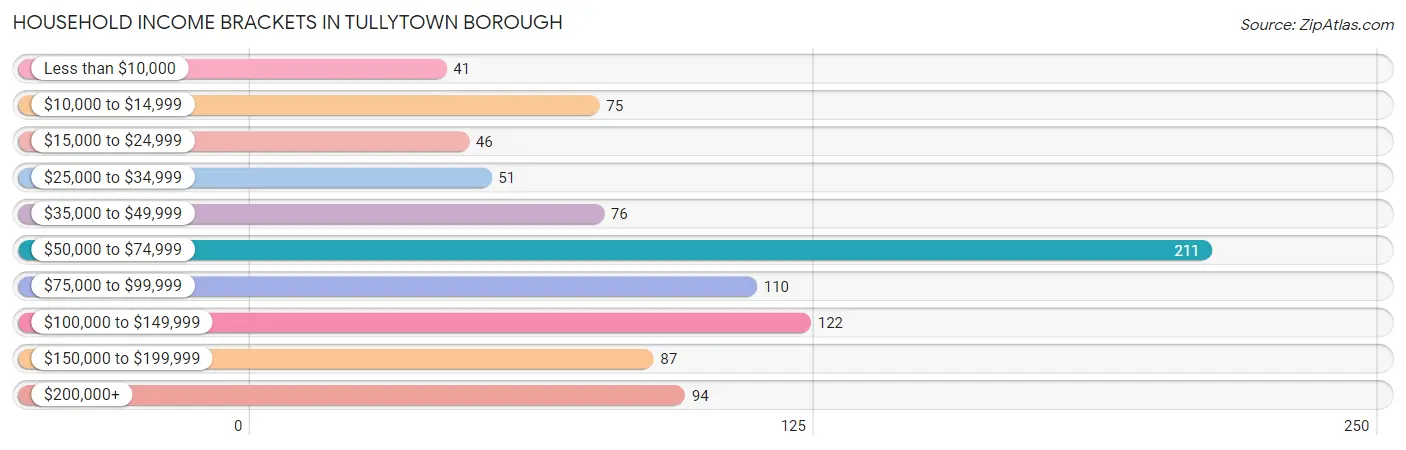
| Income Bracket | # Households | % Households |
| Less than $10,000 | 41 | 4.5% |
| $10,000 to $14,999 | 75 | 8.2% |
| $15,000 to $24,999 | 46 | 5.0% |
| $25,000 to $34,999 | 51 | 5.6% |
| $35,000 to $49,999 | 76 | 8.3% |
| $50,000 to $74,999 | 211 | 23.1% |
| $75,000 to $99,999 | 110 | 12.0% |
| $100,000 to $149,999 | 122 | 13.4% |
| $150,000 to $199,999 | 87 | 9.5% |
| $200,000+ | 94 | 10.3% |
Household Income by Householder Age in Tullytown borough
The median household income in Tullytown borough is $68,898, with the highest median household income of $101,071 found in the 45 to 64 years age bracket for the primary householder. A total of 262 households (28.7%) fall into this category. Meanwhile, the 65+ years age bracket for the primary householder has the lowest median household income of $41,923, with 252 households (27.6%) in this group.
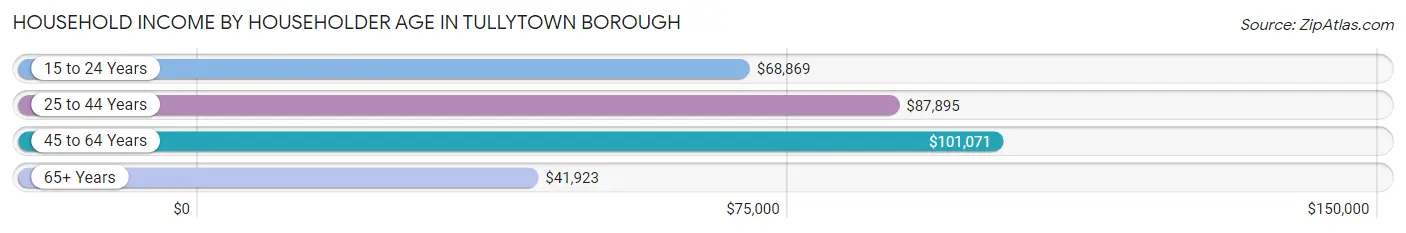
| Income Bracket | # Households | Median Income |
| 15 to 24 Years | 81 (8.9%) | $68,869 |
| 25 to 44 Years | 318 (34.8%) | $87,895 |
| 45 to 64 Years | 262 (28.7%) | $101,071 |
| 65+ Years | 252 (27.6%) | $41,923 |
| Total | 913 (100.0%) | $68,898 |
Poverty in Tullytown borough
Income Below Poverty by Sex and Age in Tullytown borough
With 10.4% poverty level for males and 15.5% for females among the residents of Tullytown borough, 6 to 11 year old males and 6 to 11 year old females are the most vulnerable to poverty, with 17 males (29.8%) and 30 females (50.0%) in their respective age groups living below the poverty level.
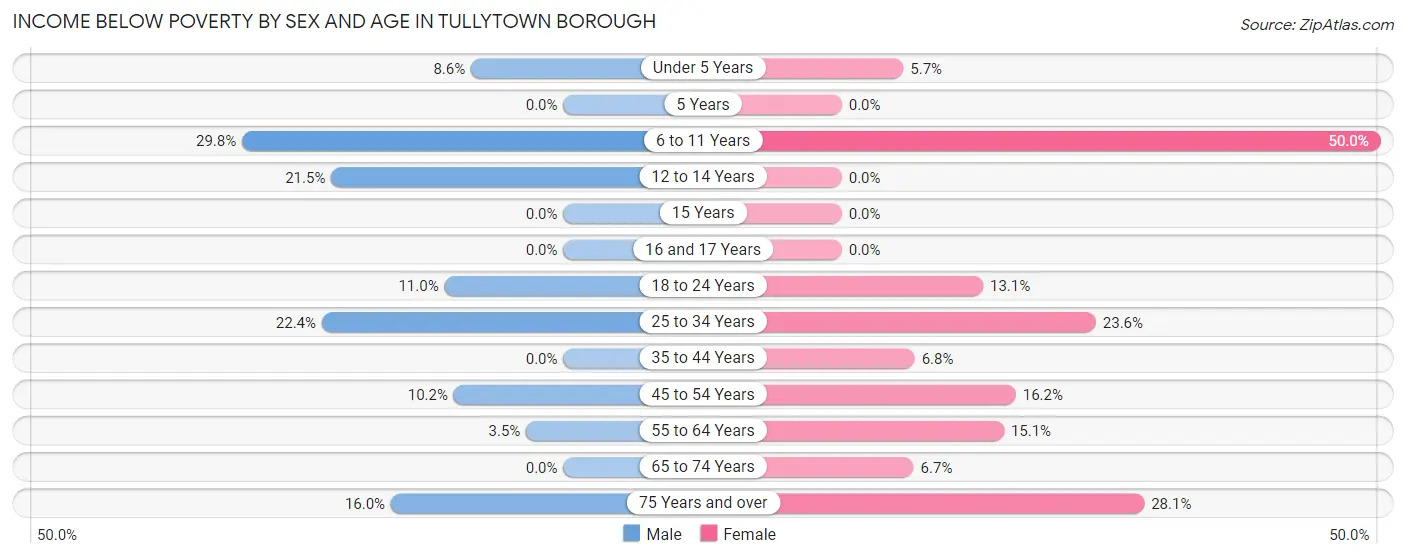
| Age Bracket | Male | Female |
| Under 5 Years | 9 (8.6%) | 6 (5.7%) |
| 5 Years | 0 (0.0%) | 0 (0.0%) |
| 6 to 11 Years | 17 (29.8%) | 30 (50.0%) |
| 12 to 14 Years | 14 (21.5%) | 0 (0.0%) |
| 15 Years | 0 (0.0%) | 0 (0.0%) |
| 16 and 17 Years | 0 (0.0%) | 0 (0.0%) |
| 18 to 24 Years | 15 (11.0%) | 16 (13.1%) |
| 25 to 34 Years | 39 (22.4%) | 29 (23.6%) |
| 35 to 44 Years | 0 (0.0%) | 9 (6.8%) |
| 45 to 54 Years | 12 (10.2%) | 21 (16.2%) |
| 55 to 64 Years | 5 (3.5%) | 28 (15.0%) |
| 65 to 74 Years | 0 (0.0%) | 6 (6.7%) |
| 75 Years and over | 12 (16.0%) | 32 (28.1%) |
| Total | 123 (10.4%) | 177 (15.5%) |
Income Above Poverty by Sex and Age in Tullytown borough
According to the poverty statistics in Tullytown borough, males aged 5 years and females aged 5 years are the age groups that are most secure financially, with 100.0% of males and 100.0% of females in these age groups living above the poverty line.
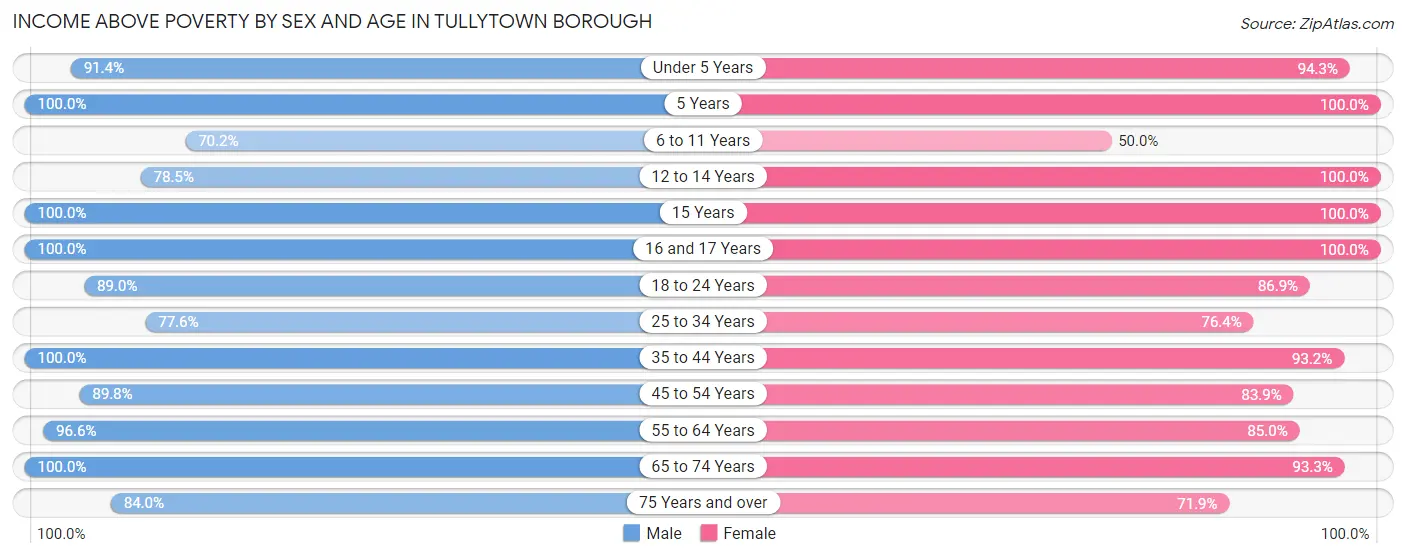
| Age Bracket | Male | Female |
| Under 5 Years | 96 (91.4%) | 99 (94.3%) |
| 5 Years | 4 (100.0%) | 10 (100.0%) |
| 6 to 11 Years | 40 (70.2%) | 30 (50.0%) |
| 12 to 14 Years | 51 (78.5%) | 38 (100.0%) |
| 15 Years | 2 (100.0%) | 7 (100.0%) |
| 16 and 17 Years | 18 (100.0%) | 20 (100.0%) |
| 18 to 24 Years | 121 (89.0%) | 106 (86.9%) |
| 25 to 34 Years | 135 (77.6%) | 94 (76.4%) |
| 35 to 44 Years | 206 (100.0%) | 124 (93.2%) |
| 45 to 54 Years | 106 (89.8%) | 109 (83.9%) |
| 55 to 64 Years | 140 (96.6%) | 158 (85.0%) |
| 65 to 74 Years | 78 (100.0%) | 84 (93.3%) |
| 75 Years and over | 63 (84.0%) | 82 (71.9%) |
| Total | 1,060 (89.6%) | 961 (84.5%) |
Income Below Poverty Among Married-Couple Families in Tullytown borough
The poverty statistics for married-couple families in Tullytown borough show that 2.2% or 11 of the total 503 families live below the poverty line. Families with 1 or 2 children have the highest poverty rate of 4.3%, comprising of 7 families. On the other hand, families with 3 or 4 children have the lowest poverty rate of 0.0%, which includes 0 families.
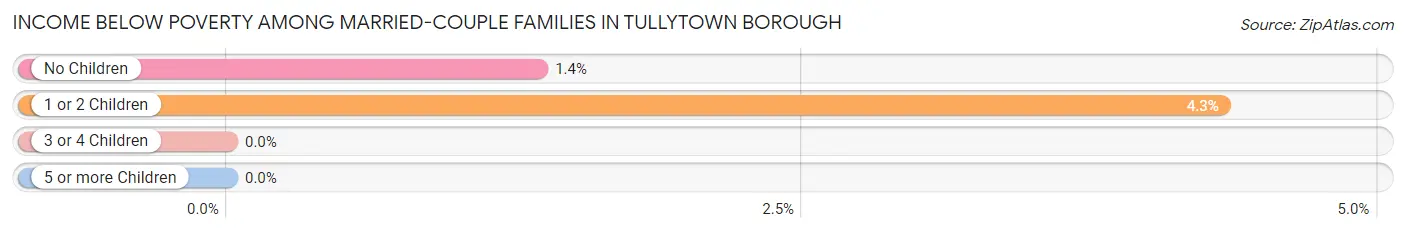
| Children | Above Poverty | Below Poverty |
| No Children | 293 (98.7%) | 4 (1.3%) |
| 1 or 2 Children | 155 (95.7%) | 7 (4.3%) |
| 3 or 4 Children | 44 (100.0%) | 0 (0.0%) |
| 5 or more Children | 0 (0.0%) | 0 (0.0%) |
| Total | 492 (97.8%) | 11 (2.2%) |
Income Below Poverty Among Single-Parent Households in Tullytown borough
According to the poverty data in Tullytown borough, 29.8% or 17 single-father households and 37.5% or 27 single-mother households are living below the poverty line. Among single-father households, those with 1 or 2 children have the highest poverty rate, with 12 households (30.8%) experiencing poverty. Likewise, among single-mother households, those with 3 or 4 children have the highest poverty rate, with 9 households (100.0%) falling below the poverty line.
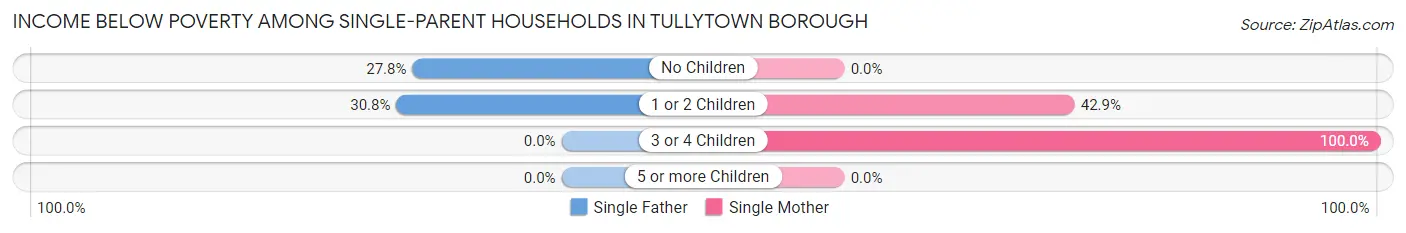
| Children | Single Father | Single Mother |
| No Children | 5 (27.8%) | 0 (0.0%) |
| 1 or 2 Children | 12 (30.8%) | 18 (42.9%) |
| 3 or 4 Children | 0 (0.0%) | 9 (100.0%) |
| 5 or more Children | 0 (0.0%) | 0 (0.0%) |
| Total | 17 (29.8%) | 27 (37.5%) |
Income Below Poverty Among Married-Couple vs Single-Parent Households in Tullytown borough
The poverty data for Tullytown borough shows that 11 of the married-couple family households (2.2%) and 44 of the single-parent households (34.1%) are living below the poverty level. Within the married-couple family households, those with 1 or 2 children have the highest poverty rate, with 7 households (4.3%) falling below the poverty line. Among the single-parent households, those with 3 or 4 children have the highest poverty rate, with 9 household (100.0%) living below poverty.
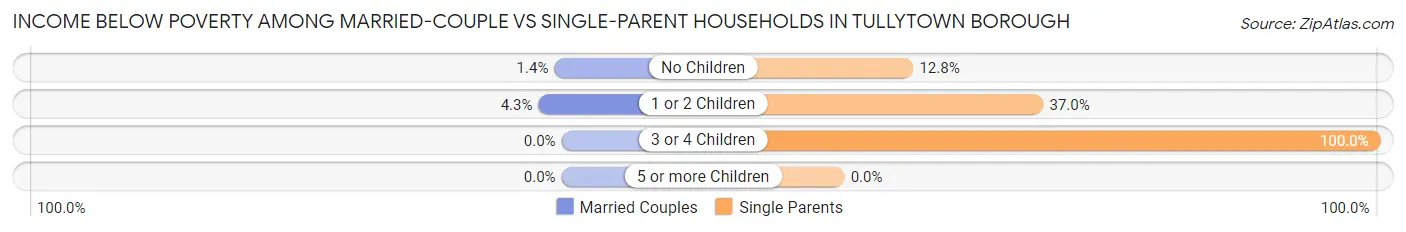
| Children | Married-Couple Families | Single-Parent Households |
| No Children | 4 (1.3%) | 5 (12.8%) |
| 1 or 2 Children | 7 (4.3%) | 30 (37.0%) |
| 3 or 4 Children | 0 (0.0%) | 9 (100.0%) |
| 5 or more Children | 0 (0.0%) | 0 (0.0%) |
| Total | 11 (2.2%) | 44 (34.1%) |
Race in Tullytown borough
The most populous races in Tullytown borough are White / Caucasian (2,238 | 96.4%), Hispanic or Latino (128 | 5.5%), and Black / African American (57 | 2.5%).
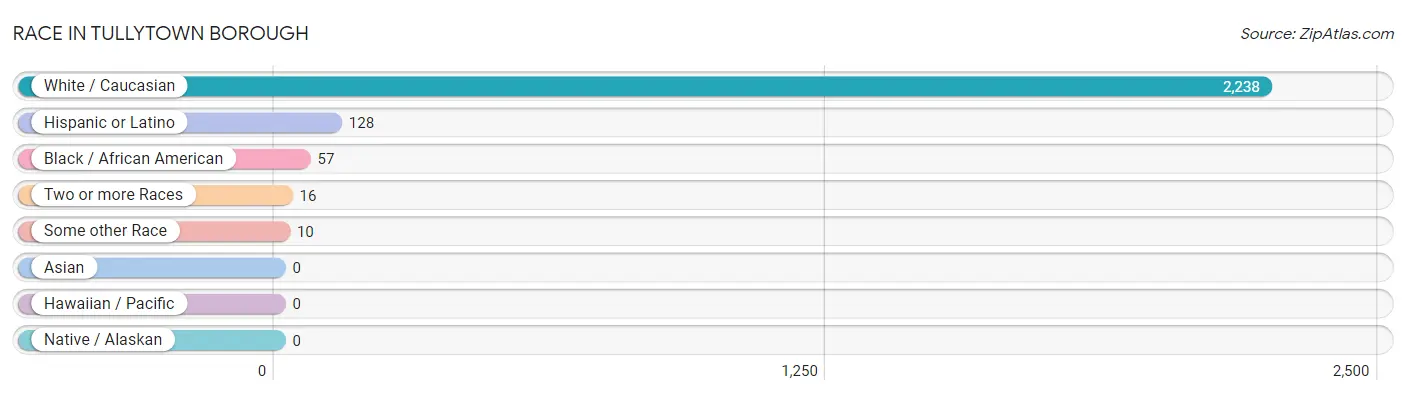
| Race | # Population | % Population |
| Asian | 0 | 0.0% |
| Black / African American | 57 | 2.5% |
| Hawaiian / Pacific | 0 | 0.0% |
| Hispanic or Latino | 128 | 5.5% |
| Native / Alaskan | 0 | 0.0% |
| White / Caucasian | 2,238 | 96.4% |
| Two or more Races | 16 | 0.7% |
| Some other Race | 10 | 0.4% |
| Total | 2,321 | 100.0% |
Ancestry in Tullytown borough
The most populous ancestries reported in Tullytown borough are Irish (791 | 34.1%), Italian (584 | 25.2%), German (553 | 23.8%), English (317 | 13.7%), and Polish (196 | 8.4%), together accounting for 105.2% of all Tullytown borough residents.
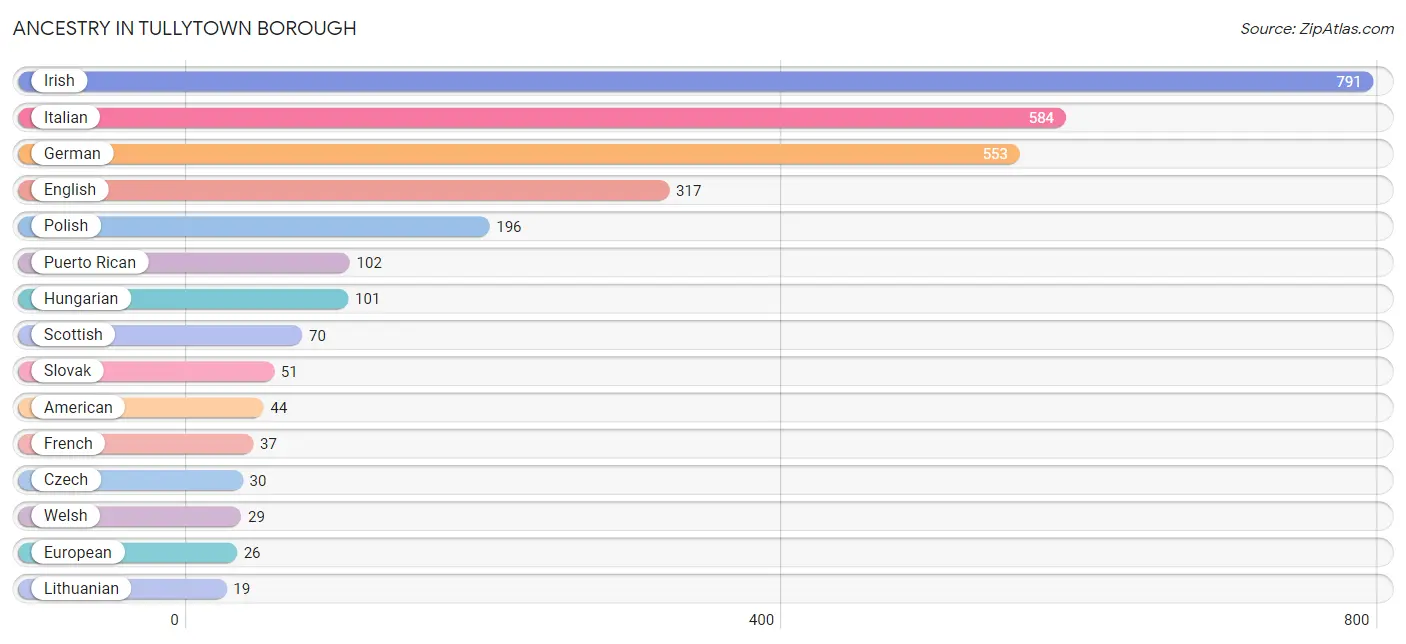
| Ancestry | # Population | % Population |
| African | 1 | 0.0% |
| American | 44 | 1.9% |
| Austrian | 5 | 0.2% |
| Central American | 6 | 0.3% |
| Czech | 30 | 1.3% |
| Czechoslovakian | 18 | 0.8% |
| Dutch | 9 | 0.4% |
| Eastern European | 9 | 0.4% |
| English | 317 | 13.7% |
| European | 26 | 1.1% |
| French | 37 | 1.6% |
| French Canadian | 9 | 0.4% |
| German | 553 | 23.8% |
| Haitian | 13 | 0.6% |
| Hungarian | 101 | 4.3% |
| Irish | 791 | 34.1% |
| Italian | 584 | 25.2% |
| Lithuanian | 19 | 0.8% |
| Mexican | 15 | 0.6% |
| Panamanian | 6 | 0.3% |
| Pennsylvania German | 16 | 0.7% |
| Polish | 196 | 8.4% |
| Puerto Rican | 102 | 4.4% |
| Scottish | 70 | 3.0% |
| Slovak | 51 | 2.2% |
| Subsaharan African | 1 | 0.0% |
| Swedish | 13 | 0.6% |
| Swiss | 4 | 0.2% |
| Ukrainian | 9 | 0.4% |
| Welsh | 29 | 1.3% | View All 30 Rows |
Immigrants in Tullytown borough
The most numerous immigrant groups reported in Tullytown borough came from Latin America (18 | 0.8%), Europe (13 | 0.6%), Italy (13 | 0.6%), Southern Europe (13 | 0.6%), and Central America (11 | 0.5%), together accounting for 2.9% of all Tullytown borough residents.
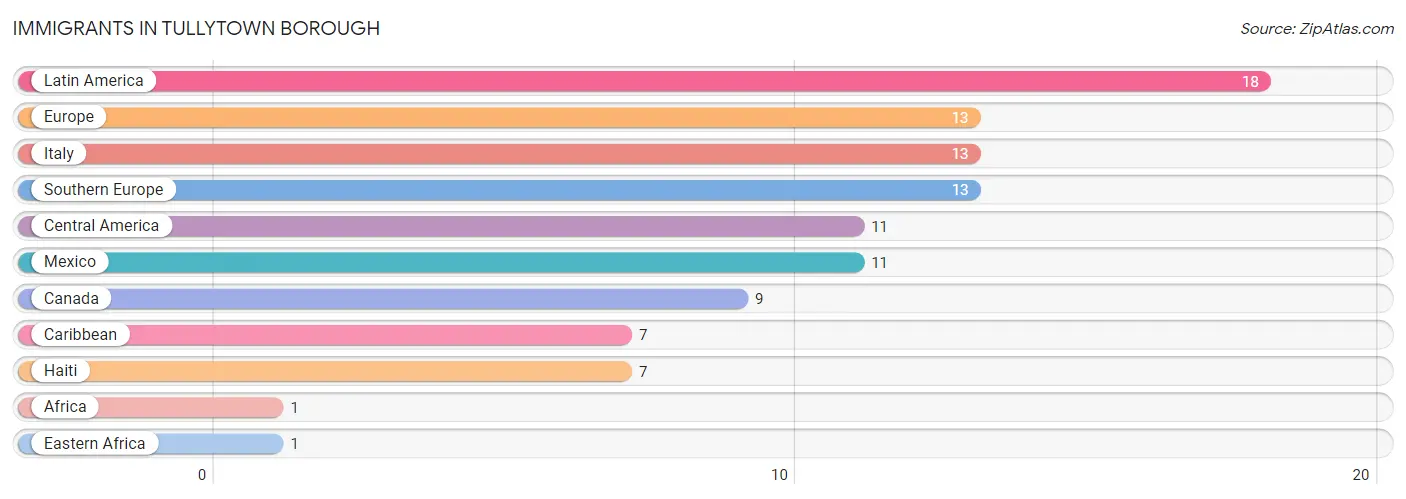
| Immigration Origin | # Population | % Population |
| Africa | 1 | 0.0% |
| Canada | 9 | 0.4% |
| Caribbean | 7 | 0.3% |
| Central America | 11 | 0.5% |
| Eastern Africa | 1 | 0.0% |
| Europe | 13 | 0.6% |
| Haiti | 7 | 0.3% |
| Italy | 13 | 0.6% |
| Latin America | 18 | 0.8% |
| Mexico | 11 | 0.5% |
| Southern Europe | 13 | 0.6% | View All 11 Rows |
Sex and Age in Tullytown borough
Sex and Age in Tullytown borough
The most populous age groups in Tullytown borough are 40 to 44 Years (137 | 11.6%) for men and Under 5 Years (105 | 9.2%) for women.
| Age Bracket | Male | Female |
| Under 5 Years | 105 (8.9%) | 105 (9.2%) |
| 5 to 9 Years | 38 (3.2%) | 52 (4.6%) |
| 10 to 14 Years | 88 (7.4%) | 56 (4.9%) |
| 15 to 19 Years | 44 (3.7%) | 63 (5.5%) |
| 20 to 24 Years | 112 (9.5%) | 86 (7.6%) |
| 25 to 29 Years | 90 (7.6%) | 40 (3.5%) |
| 30 to 34 Years | 84 (7.1%) | 83 (7.3%) |
| 35 to 39 Years | 69 (5.8%) | 42 (3.7%) |
| 40 to 44 Years | 137 (11.6%) | 91 (8.0%) |
| 45 to 49 Years | 54 (4.6%) | 58 (5.1%) |
| 50 to 54 Years | 64 (5.4%) | 72 (6.3%) |
| 55 to 59 Years | 57 (4.8%) | 97 (8.5%) |
| 60 to 64 Years | 88 (7.4%) | 89 (7.8%) |
| 65 to 69 Years | 41 (3.5%) | 56 (4.9%) |
| 70 to 74 Years | 37 (3.1%) | 34 (3.0%) |
| 75 to 79 Years | 32 (2.7%) | 56 (4.9%) |
| 80 to 84 Years | 8 (0.7%) | 29 (2.5%) |
| 85 Years and over | 35 (3.0%) | 29 (2.5%) |
| Total | 1,183 (100.0%) | 1,138 (100.0%) |
Families and Households in Tullytown borough
Median Family Size in Tullytown borough
The median family size in Tullytown borough is 3.04 persons per family, with married-couple families (503 | 79.6%) accounting for the largest median family size of 3.15 persons per family. On the other hand, single male/father families (57 | 9.0%) represent the smallest median family size with 2.11 persons per family.
| Family Type | # Families | Family Size |
| Married-Couple | 503 (79.6%) | 3.15 |
| Single Male/Father | 57 (9.0%) | 2.11 |
| Single Female/Mother | 72 (11.4%) | 2.97 |
| Total Families | 632 (100.0%) | 3.04 |
Median Household Size in Tullytown borough
The median household size in Tullytown borough is 2.54 persons per household, with single female/mother households (72 | 7.9%) accounting for the largest median household size of 3.72 persons per household. non-family households (281 | 30.8%) represent the smallest median household size with 1.11 persons per household.

| Household Type | # Households | Household Size |
| Married-Couple | 503 (55.1%) | 3.17 |
| Single Male/Father | 57 (6.2%) | 2.47 |
| Single Female/Mother | 72 (7.9%) | 3.72 |
| Non-family | 281 (30.8%) | 1.11 |
| Total Households | 913 (100.0%) | 2.54 |
Household Size by Marriage Status in Tullytown borough
Out of a total of 913 households in Tullytown borough, 632 (69.2%) are family households, while 281 (30.8%) are nonfamily households. The most numerous type of family households are 2-person households, comprising 289, and the most common type of nonfamily households are 1-person households, comprising 248.
| Household Size | Family Households | Nonfamily Households |
| 1-Person Households | - | 248 (27.2%) |
| 2-Person Households | 289 (31.7%) | 33 (3.6%) |
| 3-Person Households | 163 (17.8%) | 0 (0.0%) |
| 4-Person Households | 104 (11.4%) | 0 (0.0%) |
| 5-Person Households | 40 (4.4%) | 0 (0.0%) |
| 6-Person Households | 23 (2.5%) | 0 (0.0%) |
| 7+ Person Households | 13 (1.4%) | 0 (0.0%) |
| Total | 632 (69.2%) | 281 (30.8%) |
Female Fertility in Tullytown borough
Fertility by Age in Tullytown borough
Average fertility rate in Tullytown borough is 149.0 births per 1,000 women. Women in the age bracket of 35 to 50 years have the highest fertility rate with 205.0 births per 1,000 women. Women in the age bracket of 35 to 50 years acount for 59.7% of all women with births.
| Age Bracket | Women with Births | Births / 1,000 Women |
| 15 to 19 years | 0 (0.0%) | 0.0 |
| 20 to 34 years | 29 (40.3%) | 139.0 |
| 35 to 50 years | 43 (59.7%) | 205.0 |
| Total | 72 (100.0%) | 149.0 |
Fertility by Age by Marriage Status in Tullytown borough
98.6% of women with births (72) in Tullytown borough are married. The highest percentage of unmarried women with births falls into 20 to 34 years age bracket with 3.5% of them unmarried at the time of birth, while the lowest percentage of unmarried women with births belong to 35 to 50 years age bracket with 0.0% of them unmarried.
| Age Bracket | Married | Unmarried |
| 15 to 19 years | 0 (0.0%) | 0 (0.0%) |
| 20 to 34 years | 28 (96.6%) | 1 (3.5%) |
| 35 to 50 years | 43 (100.0%) | 0 (0.0%) |
| Total | 71 (98.6%) | 1 (1.4%) |
Fertility by Education in Tullytown borough
| Educational Attainment | Women with Births | Births / 1,000 Women |
| Less than High School | 0 (0.0%) | 0.0 |
| High School Diploma | 19 (26.4%) | 107.0 |
| College or Associate's Degree | 8 (11.1%) | 54.0 |
| Bachelor's Degree | 45 (62.5%) | 511.0 |
| Graduate Degree | 0 (0.0%) | 0.0 |
| Total | 72 (100.0%) | 149.0 |
Fertility by Education by Marriage Status in Tullytown borough
1.4% of women with births in Tullytown borough are unmarried. Women with the educational attainment of high school diploma are most likely to be married with 100.0% of them married at childbirth, while women with the educational attainment of college or associate's degree are least likely to be married with 12.5% of them unmarried at childbirth.
| Educational Attainment | Married | Unmarried |
| Less than High School | 0 (0.0%) | 0 (0.0%) |
| High School Diploma | 19 (100.0%) | 0 (0.0%) |
| College or Associate's Degree | 7 (87.5%) | 1 (12.5%) |
| Bachelor's Degree | 45 (100.0%) | 0 (0.0%) |
| Graduate Degree | 0 (0.0%) | 0 (0.0%) |
| Total | 71 (98.6%) | 1 (1.4%) |
Employment Characteristics in Tullytown borough
Employment by Class of Employer in Tullytown borough
Among the 1,185 employed individuals in Tullytown borough, private company employees (979 | 82.6%), local government employees (71 | 6.0%), and not-for-profit organizations (65 | 5.5%) make up the most common classes of employment.
| Employer Class | # Employees | % Employees |
| Private Company Employees | 979 | 82.6% |
| Self-Employed (Incorporated) | 8 | 0.7% |
| Self-Employed (Not Incorporated) | 28 | 2.4% |
| Not-for-profit Organizations | 65 | 5.5% |
| Local Government Employees | 71 | 6.0% |
| State Government Employees | 25 | 2.1% |
| Federal Government Employees | 9 | 0.8% |
| Unpaid Family Workers | 0 | 0.0% |
| Total | 1,185 | 100.0% |
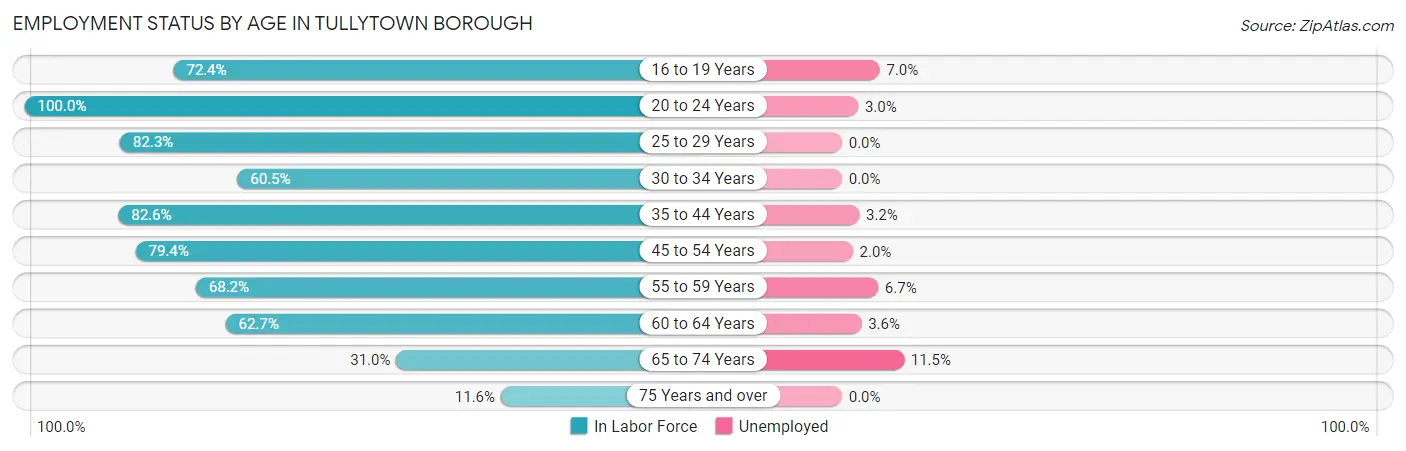
Employment Status by Age in Tullytown borough
According to the labor force statistics for Tullytown borough, out of the total population over 16 years of age (1,868), 66.6% or 1,244 individuals are in the labor force, with 3.3% or 41 of them unemployed. The age group with the highest labor force participation rate is 20 to 24 years, with 100.0% or 198 individuals in the labor force. Within the labor force, the 65 to 74 years age range has the highest percentage of unemployed individuals, with 11.5% or 6 of them being unemployed.
| Age Bracket | In Labor Force | Unemployed |
| 16 to 19 Years | 71 (72.4%) | 5 (7.0%) |
| 20 to 24 Years | 198 (100.0%) | 6 (3.0%) |
| 25 to 29 Years | 107 (82.3%) | 0 (0.0%) |
| 30 to 34 Years | 101 (60.5%) | 0 (0.0%) |
| 35 to 44 Years | 280 (82.6%) | 9 (3.2%) |
| 45 to 54 Years | 197 (79.4%) | 4 (2.0%) |
| 55 to 59 Years | 105 (68.2%) | 7 (6.7%) |
| 60 to 64 Years | 111 (62.7%) | 4 (3.6%) |
| 65 to 74 Years | 52 (31.0%) | 6 (11.5%) |
| 75 Years and over | 22 (11.6%) | 0 (0.0%) |
| Total | 1,244 (66.6%) | 41 (3.3%) |
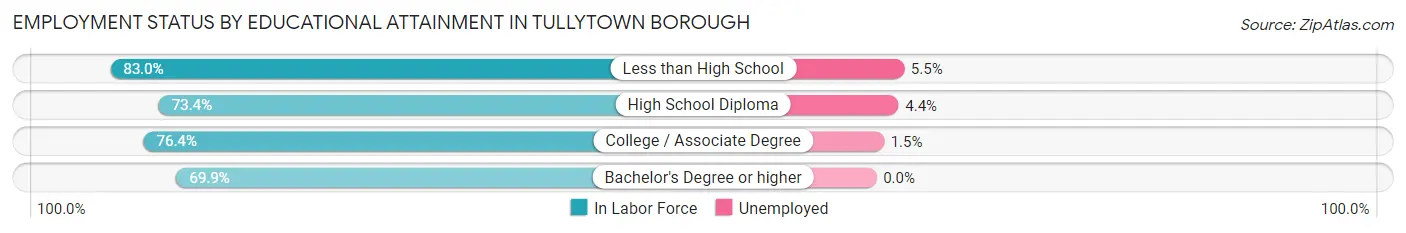
Employment Status by Educational Attainment in Tullytown borough
According to labor force statistics for Tullytown borough, 74.2% of individuals (902) out of the total population between 25 and 64 years of age (1,215) are in the labor force, with 2.7% or 24 of them being unemployed. The group with the highest labor force participation rate are those with the educational attainment of less than high school, with 83.0% or 73 individuals in the labor force. Within the labor force, individuals with less than high school education have the highest percentage of unemployment, with 5.5% or 4 of them being unemployed.
| Educational Attainment | In Labor Force | Unemployed |
| Less than High School | 73 (83.0%) | 5 (5.5%) |
| High School Diploma | 364 (73.4%) | 22 (4.4%) |
| College / Associate Degree | 269 (76.4%) | 5 (1.5%) |
| Bachelor's Degree or higher | 195 (69.9%) | 0 (0.0%) |
| Total | 902 (74.2%) | 33 (2.7%) |
Employment Occupations by Sex in Tullytown borough
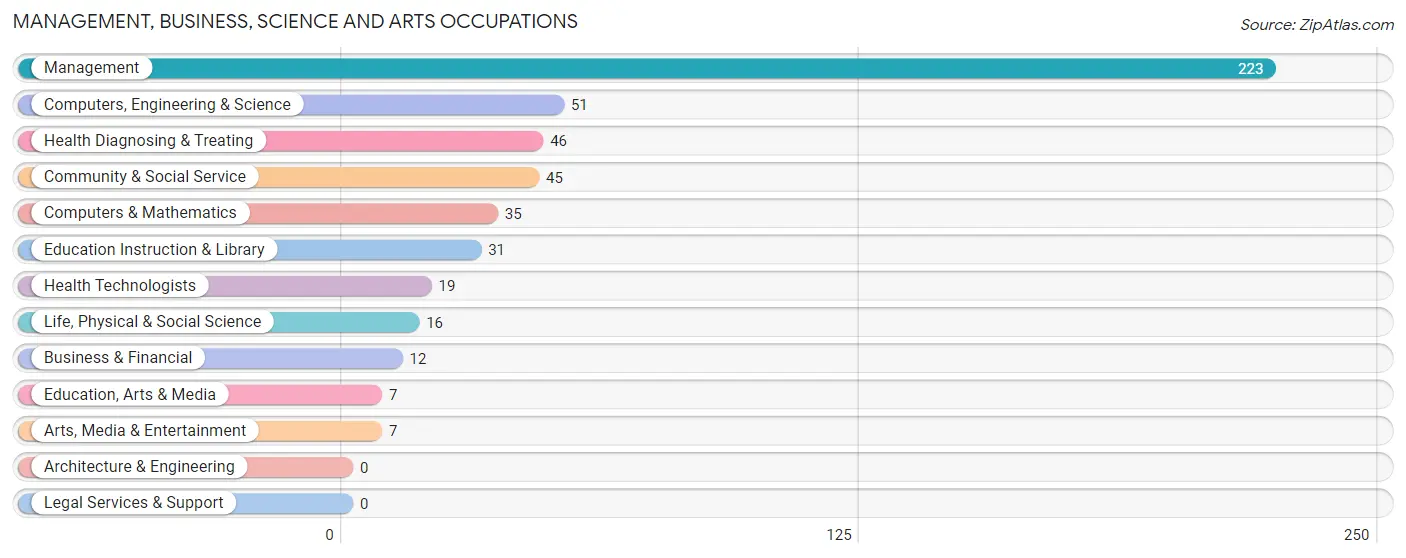
Management, Business, Science and Arts Occupations
The most common Management, Business, Science and Arts occupations in Tullytown borough are Management (223 | 18.5%), Computers, Engineering & Science (51 | 4.2%), Health Diagnosing & Treating (46 | 3.8%), Community & Social Service (45 | 3.7%), and Computers & Mathematics (35 | 2.9%).
Management, Business, Science and Arts Occupations by Sex
Within the Management, Business, Science and Arts occupations in Tullytown borough, the most male-oriented occupations are Life, Physical & Social Science (100.0%), Computers, Engineering & Science (76.5%), and Computers & Mathematics (65.7%), while the most female-oriented occupations are Arts, Media & Entertainment (100.0%), Health Diagnosing & Treating (100.0%), and Health Technologists (100.0%).
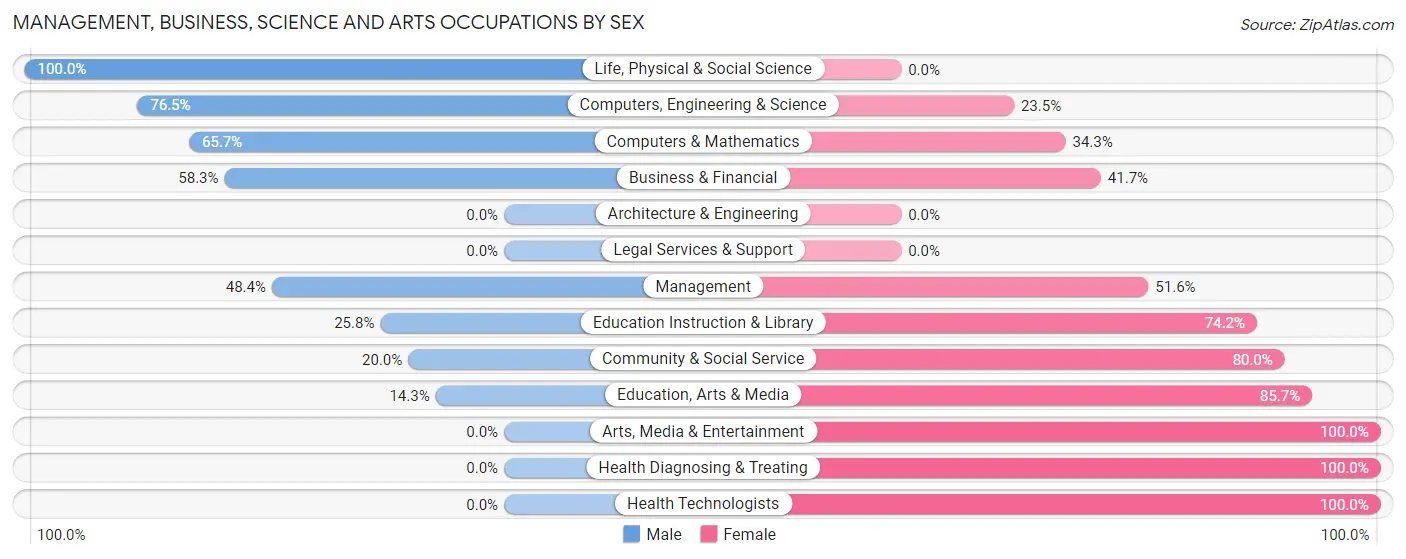
| Occupation | Male | Female |
| Management | 108 (48.4%) | 115 (51.6%) |
| Business & Financial | 7 (58.3%) | 5 (41.7%) |
| Computers, Engineering & Science | 39 (76.5%) | 12 (23.5%) |
| Computers & Mathematics | 23 (65.7%) | 12 (34.3%) |
| Architecture & Engineering | 0 (0.0%) | 0 (0.0%) |
| Life, Physical & Social Science | 16 (100.0%) | 0 (0.0%) |
| Community & Social Service | 9 (20.0%) | 36 (80.0%) |
| Education, Arts & Media | 1 (14.3%) | 6 (85.7%) |
| Legal Services & Support | 0 (0.0%) | 0 (0.0%) |
| Education Instruction & Library | 8 (25.8%) | 23 (74.2%) |
| Arts, Media & Entertainment | 0 (0.0%) | 7 (100.0%) |
| Health Diagnosing & Treating | 0 (0.0%) | 46 (100.0%) |
| Health Technologists | 0 (0.0%) | 19 (100.0%) |
| Total (Category) | 163 (43.2%) | 214 (56.8%) |
| Total (Overall) | 759 (63.1%) | 444 (36.9%) |
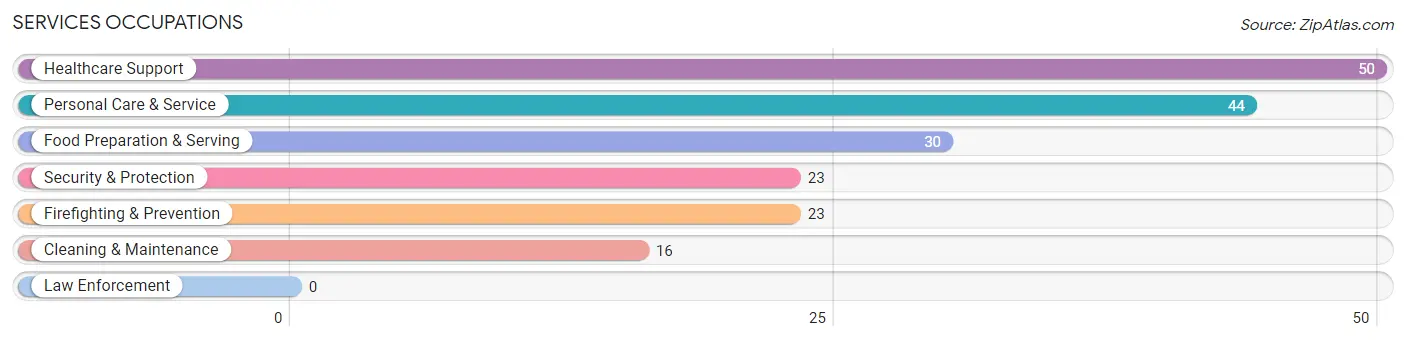
Services Occupations
The most common Services occupations in Tullytown borough are Healthcare Support (50 | 4.2%), Personal Care & Service (44 | 3.7%), Food Preparation & Serving (30 | 2.5%), Security & Protection (23 | 1.9%), and Firefighting & Prevention (23 | 1.9%).
Services Occupations by Sex
Within the Services occupations in Tullytown borough, the most male-oriented occupations are Security & Protection (87.0%), Firefighting & Prevention (87.0%), and Food Preparation & Serving (70.0%), while the most female-oriented occupations are Personal Care & Service (100.0%), Healthcare Support (82.0%), and Cleaning & Maintenance (56.2%).
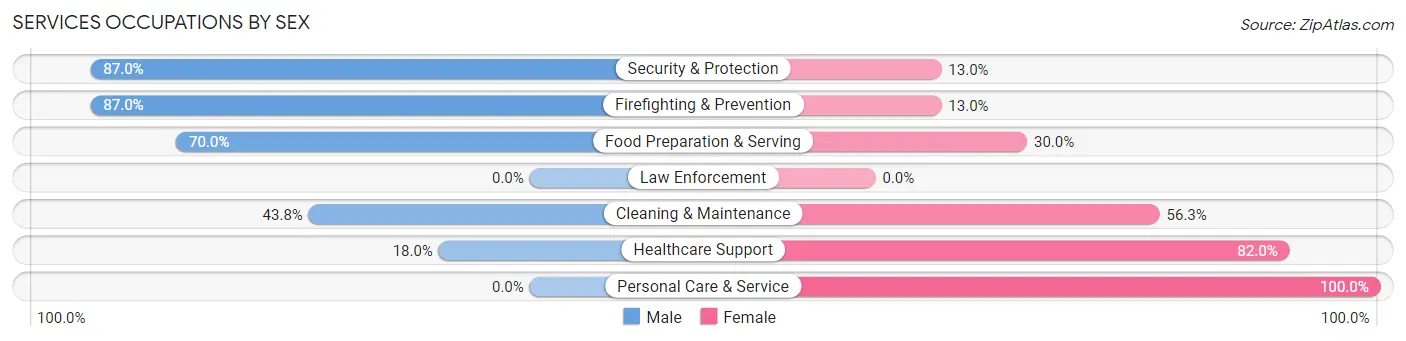
| Occupation | Male | Female |
| Healthcare Support | 9 (18.0%) | 41 (82.0%) |
| Security & Protection | 20 (87.0%) | 3 (13.0%) |
| Firefighting & Prevention | 20 (87.0%) | 3 (13.0%) |
| Law Enforcement | 0 (0.0%) | 0 (0.0%) |
| Food Preparation & Serving | 21 (70.0%) | 9 (30.0%) |
| Cleaning & Maintenance | 7 (43.8%) | 9 (56.2%) |
| Personal Care & Service | 0 (0.0%) | 44 (100.0%) |
| Total (Category) | 57 (35.0%) | 106 (65.0%) |
| Total (Overall) | 759 (63.1%) | 444 (36.9%) |
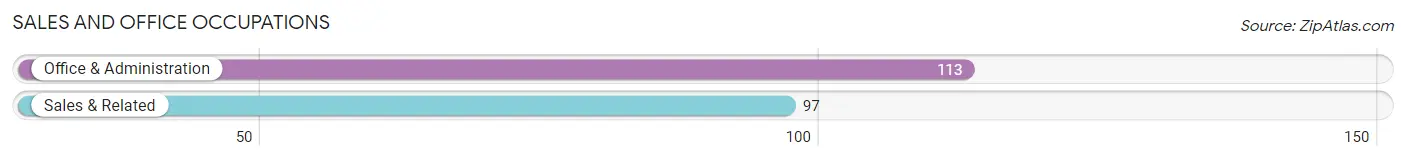
Sales and Office Occupations
The most common Sales and Office occupations in Tullytown borough are Office & Administration (113 | 9.4%), and Sales & Related (97 | 8.1%).
Sales and Office Occupations by Sex
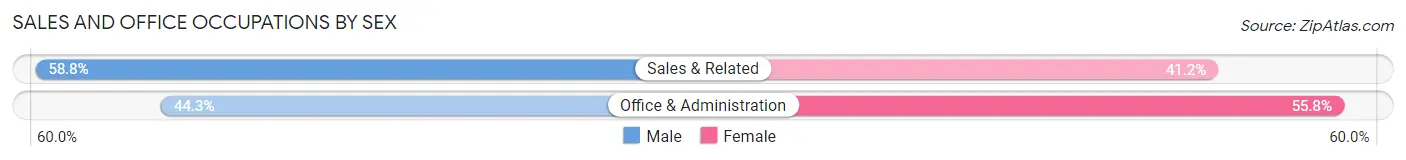
| Occupation | Male | Female |
| Sales & Related | 57 (58.8%) | 40 (41.2%) |
| Office & Administration | 50 (44.3%) | 63 (55.7%) |
| Total (Category) | 107 (50.9%) | 103 (49.0%) |
| Total (Overall) | 759 (63.1%) | 444 (36.9%) |
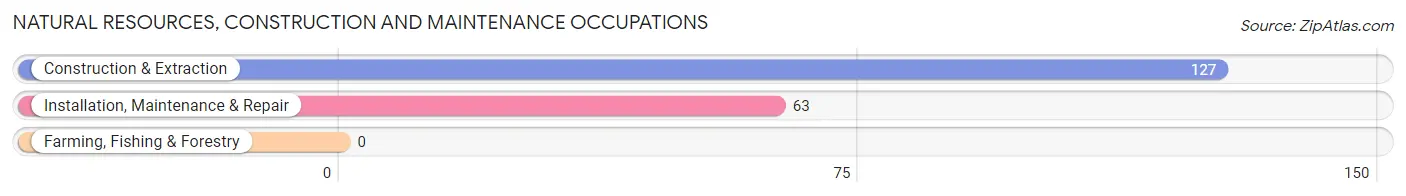
Natural Resources, Construction and Maintenance Occupations
The most common Natural Resources, Construction and Maintenance occupations in Tullytown borough are Construction & Extraction (127 | 10.6%), and Installation, Maintenance & Repair (63 | 5.2%).
Natural Resources, Construction and Maintenance Occupations by Sex

| Occupation | Male | Female |
| Farming, Fishing & Forestry | 0 (0.0%) | 0 (0.0%) |
| Construction & Extraction | 127 (100.0%) | 0 (0.0%) |
| Installation, Maintenance & Repair | 55 (87.3%) | 8 (12.7%) |
| Total (Category) | 182 (95.8%) | 8 (4.2%) |
| Total (Overall) | 759 (63.1%) | 444 (36.9%) |
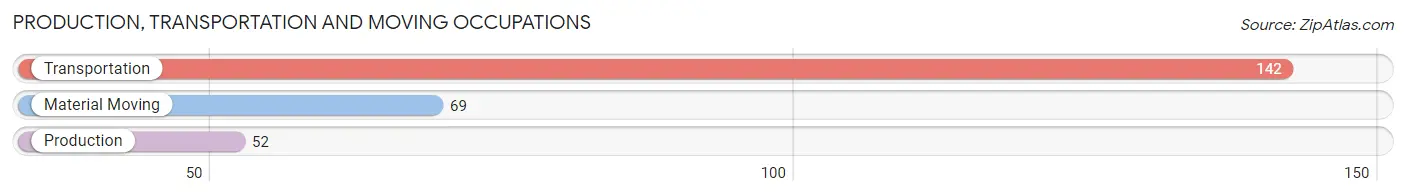
Production, Transportation and Moving Occupations
The most common Production, Transportation and Moving occupations in Tullytown borough are Transportation (142 | 11.8%), Material Moving (69 | 5.7%), and Production (52 | 4.3%).
Production, Transportation and Moving Occupations by Sex
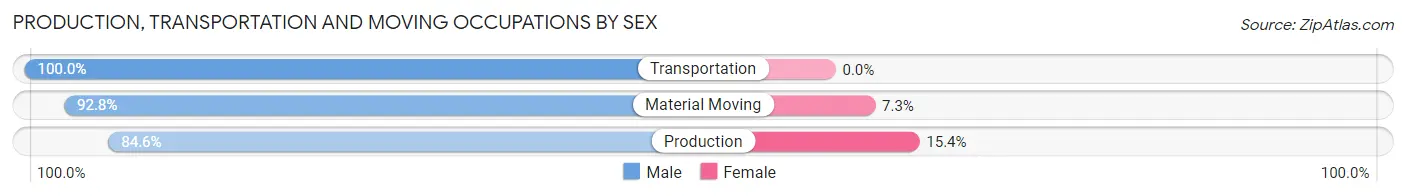
| Occupation | Male | Female |
| Production | 44 (84.6%) | 8 (15.4%) |
| Transportation | 142 (100.0%) | 0 (0.0%) |
| Material Moving | 64 (92.7%) | 5 (7.2%) |
| Total (Category) | 250 (95.1%) | 13 (4.9%) |
| Total (Overall) | 759 (63.1%) | 444 (36.9%) |
Employment Industries by Sex in Tullytown borough
Employment Industries in Tullytown borough
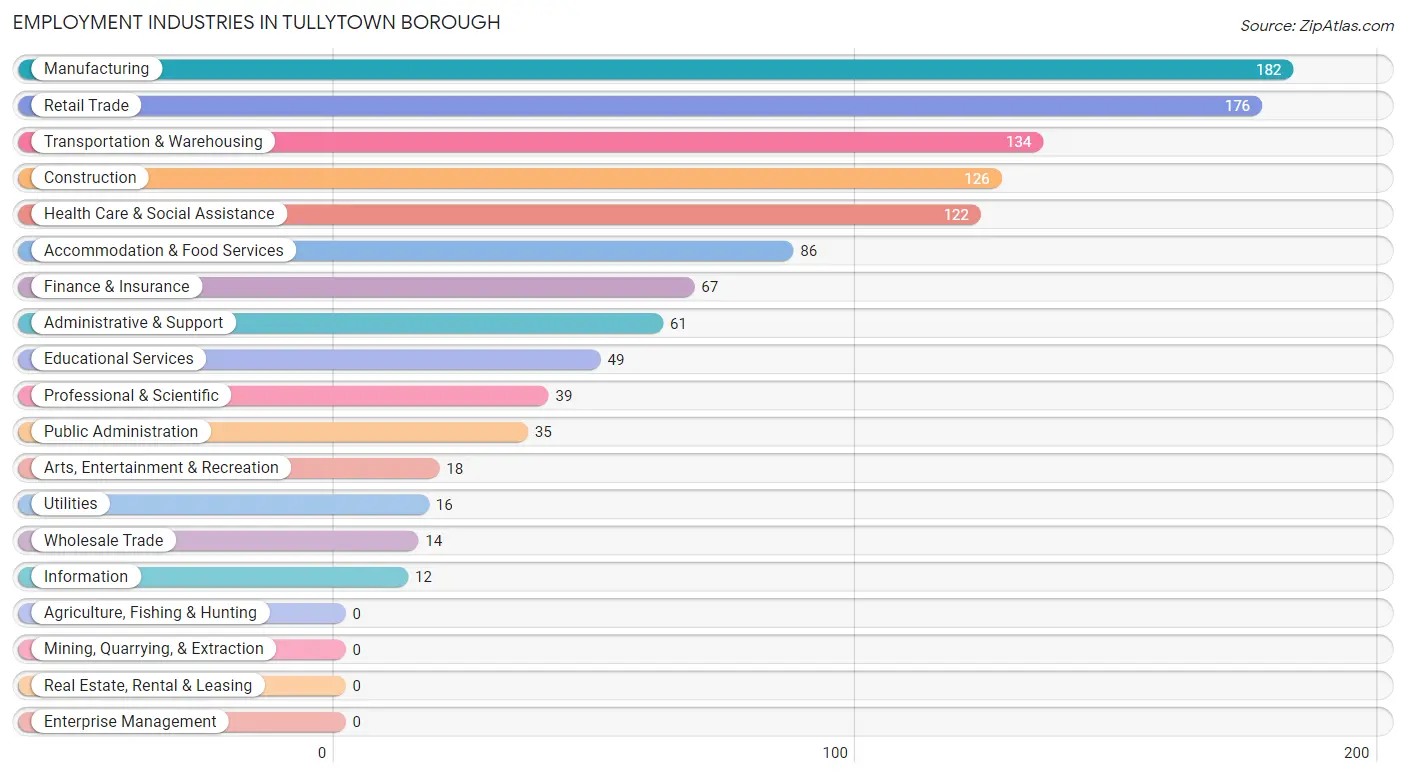
The major employment industries in Tullytown borough include Manufacturing (182 | 15.1%), Retail Trade (176 | 14.6%), Transportation & Warehousing (134 | 11.1%), Construction (126 | 10.5%), and Health Care & Social Assistance (122 | 10.1%).
Employment Industries by Sex in Tullytown borough
The Tullytown borough industries that see more men than women are Wholesale Trade (100.0%), Transportation & Warehousing (100.0%), and Information (100.0%), whereas the industries that tend to have a higher number of women are Health Care & Social Assistance (81.1%), Educational Services (69.4%), and Professional & Scientific (69.2%).
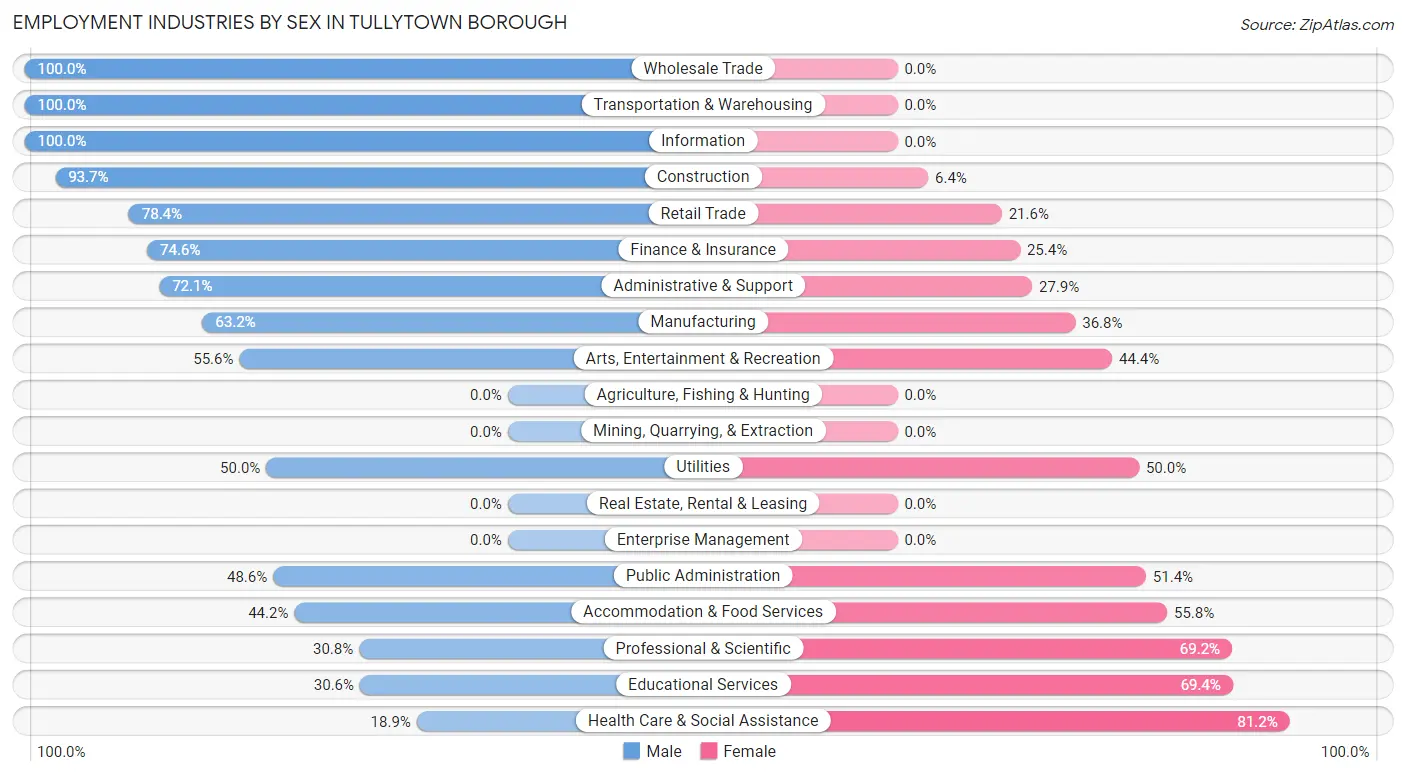
| Industry | Male | Female |
| Agriculture, Fishing & Hunting | 0 (0.0%) | 0 (0.0%) |
| Mining, Quarrying, & Extraction | 0 (0.0%) | 0 (0.0%) |
| Construction | 118 (93.6%) | 8 (6.4%) |
| Manufacturing | 115 (63.2%) | 67 (36.8%) |
| Wholesale Trade | 14 (100.0%) | 0 (0.0%) |
| Retail Trade | 138 (78.4%) | 38 (21.6%) |
| Transportation & Warehousing | 134 (100.0%) | 0 (0.0%) |
| Utilities | 8 (50.0%) | 8 (50.0%) |
| Information | 12 (100.0%) | 0 (0.0%) |
| Finance & Insurance | 50 (74.6%) | 17 (25.4%) |
| Real Estate, Rental & Leasing | 0 (0.0%) | 0 (0.0%) |
| Professional & Scientific | 12 (30.8%) | 27 (69.2%) |
| Enterprise Management | 0 (0.0%) | 0 (0.0%) |
| Administrative & Support | 44 (72.1%) | 17 (27.9%) |
| Educational Services | 15 (30.6%) | 34 (69.4%) |
| Health Care & Social Assistance | 23 (18.9%) | 99 (81.1%) |
| Arts, Entertainment & Recreation | 10 (55.6%) | 8 (44.4%) |
| Accommodation & Food Services | 38 (44.2%) | 48 (55.8%) |
| Public Administration | 17 (48.6%) | 18 (51.4%) |
| Total | 759 (63.1%) | 444 (36.9%) |
Education in Tullytown borough
School Enrollment in Tullytown borough
The most common levels of schooling among the 341 students in Tullytown borough are middle school (87 | 25.5%), high school (82 | 24.0%), and elementary school (68 | 19.9%).
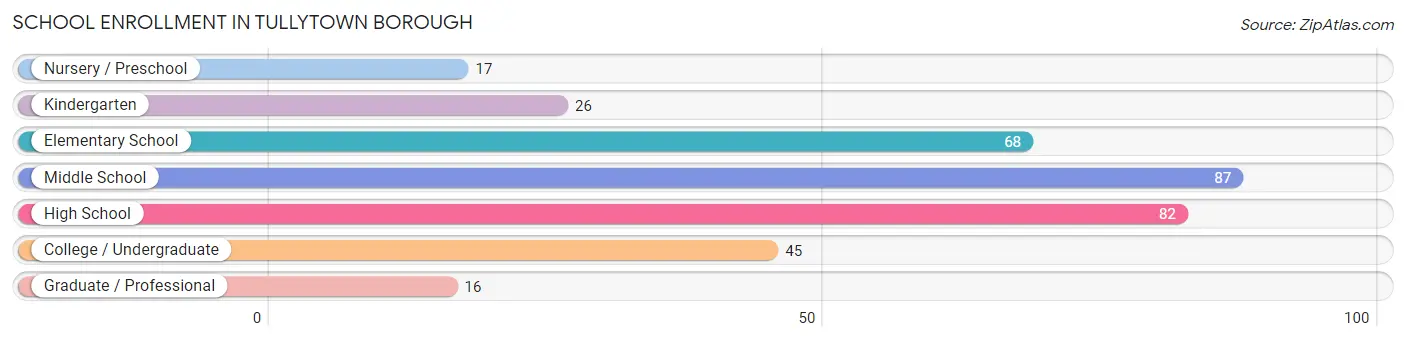
| School Level | # Students | % Students |
| Nursery / Preschool | 17 | 5.0% |
| Kindergarten | 26 | 7.6% |
| Elementary School | 68 | 19.9% |
| Middle School | 87 | 25.5% |
| High School | 82 | 24.0% |
| College / Undergraduate | 45 | 13.2% |
| Graduate / Professional | 16 | 4.7% |
| Total | 341 | 100.0% |
School Enrollment by Age by Funding Source in Tullytown borough
Out of a total of 341 students who are enrolled in schools in Tullytown borough, 33 (9.7%) attend a private institution, while the remaining 308 (90.3%) are enrolled in public schools. The age group of 3 to 4 year olds has the highest likelihood of being enrolled in private schools, with 17 (100.0% in the age bracket) enrolled. Conversely, the age group of 5 to 9 year old has the lowest likelihood of being enrolled in a private school, with 86 (100.0% in the age bracket) attending a public institution.
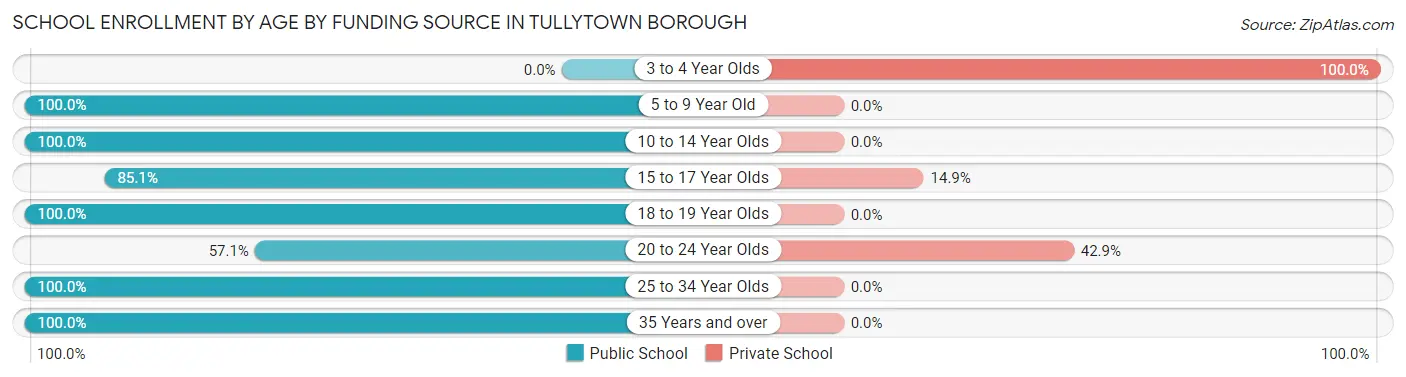
| Age Bracket | Public School | Private School |
| 3 to 4 Year Olds | 0 (0.0%) | 17 (100.0%) |
| 5 to 9 Year Old | 86 (100.0%) | 0 (0.0%) |
| 10 to 14 Year Olds | 121 (100.0%) | 0 (0.0%) |
| 15 to 17 Year Olds | 40 (85.1%) | 7 (14.9%) |
| 18 to 19 Year Olds | 13 (100.0%) | 0 (0.0%) |
| 20 to 24 Year Olds | 12 (57.1%) | 9 (42.9%) |
| 25 to 34 Year Olds | 16 (100.0%) | 0 (0.0%) |
| 35 Years and over | 20 (100.0%) | 0 (0.0%) |
| Total | 308 (90.3%) | 33 (9.7%) |
Educational Attainment by Field of Study in Tullytown borough
Business (119 | 37.9%), liberal arts & history (50 | 15.9%), education (42 | 13.4%), computers & mathematics (26 | 8.3%), and engineering (21 | 6.7%) are the most common fields of study among 314 individuals in Tullytown borough who have obtained a bachelor's degree or higher.
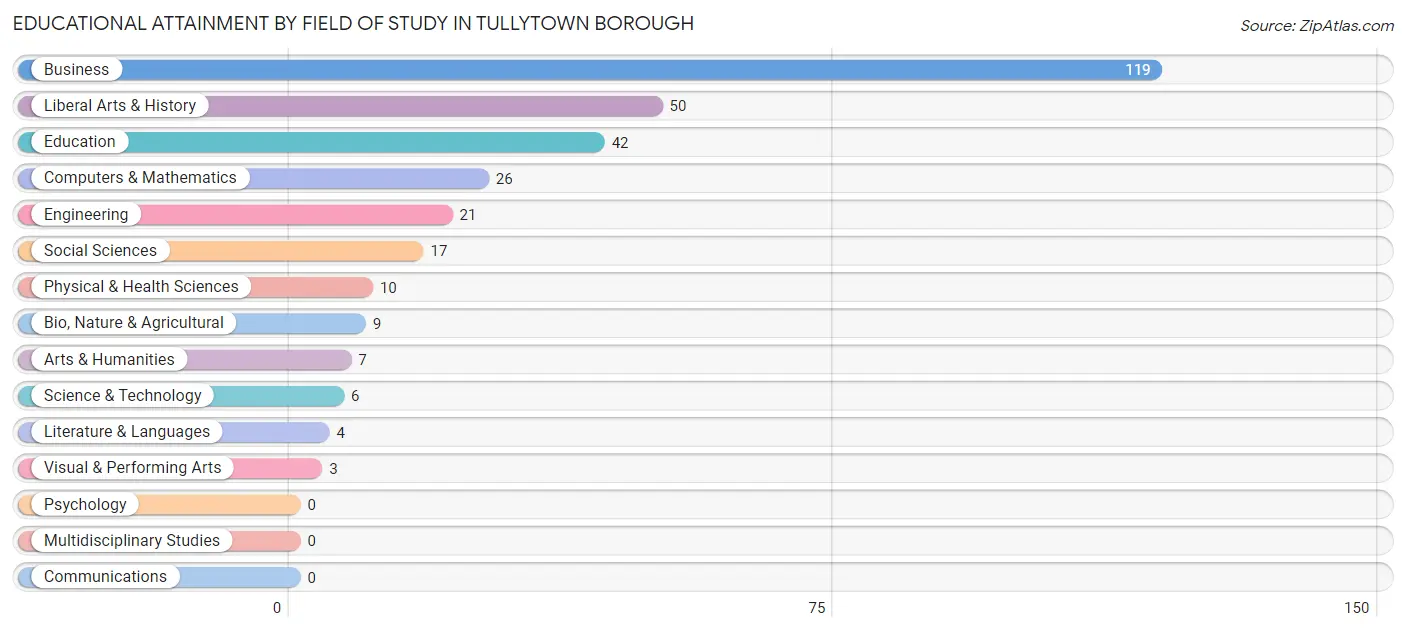
| Field of Study | # Graduates | % Graduates |
| Computers & Mathematics | 26 | 8.3% |
| Bio, Nature & Agricultural | 9 | 2.9% |
| Physical & Health Sciences | 10 | 3.2% |
| Psychology | 0 | 0.0% |
| Social Sciences | 17 | 5.4% |
| Engineering | 21 | 6.7% |
| Multidisciplinary Studies | 0 | 0.0% |
| Science & Technology | 6 | 1.9% |
| Business | 119 | 37.9% |
| Education | 42 | 13.4% |
| Literature & Languages | 4 | 1.3% |
| Liberal Arts & History | 50 | 15.9% |
| Visual & Performing Arts | 3 | 1.0% |
| Communications | 0 | 0.0% |
| Arts & Humanities | 7 | 2.2% |
| Total | 314 | 100.0% |
Transportation & Commute in Tullytown borough
Vehicle Availability by Sex in Tullytown borough
The most prevalent vehicle ownership categories in Tullytown borough are males with 2 vehicles (284, accounting for 38.3%) and females with 2 vehicles (171, making up 64.8%).
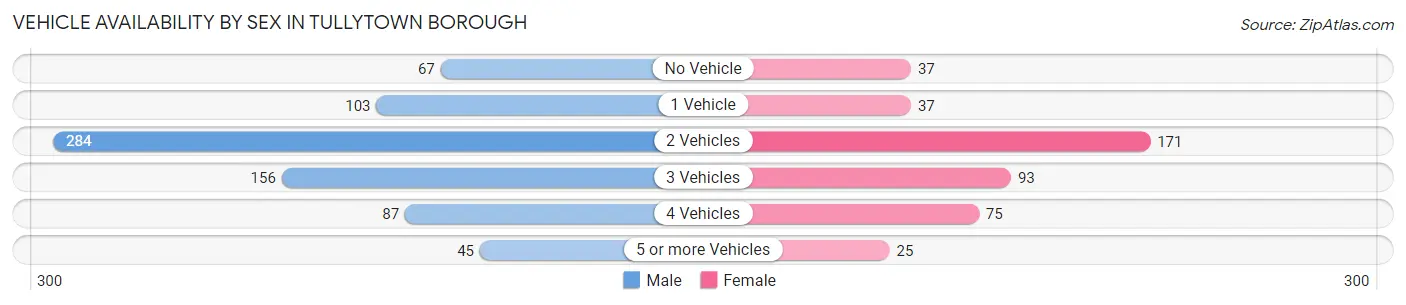
| Vehicles Available | Male | Female |
| No Vehicle | 67 (9.0%) | 37 (8.5%) |
| 1 Vehicle | 103 (13.9%) | 37 (8.5%) |
| 2 Vehicles | 284 (38.3%) | 171 (39.0%) |
| 3 Vehicles | 156 (21.0%) | 93 (21.2%) |
| 4 Vehicles | 87 (11.7%) | 75 (17.1%) |
| 5 or more Vehicles | 45 (6.1%) | 25 (5.7%) |
| Total | 742 (100.0%) | 438 (100.0%) |
Commute Time in Tullytown borough
The most frequently occuring commute durations in Tullytown borough are 10 to 14 minutes (209 commuters, 19.0%), 15 to 19 minutes (200 commuters, 18.2%), and 45 to 59 minutes (197 commuters, 17.9%).
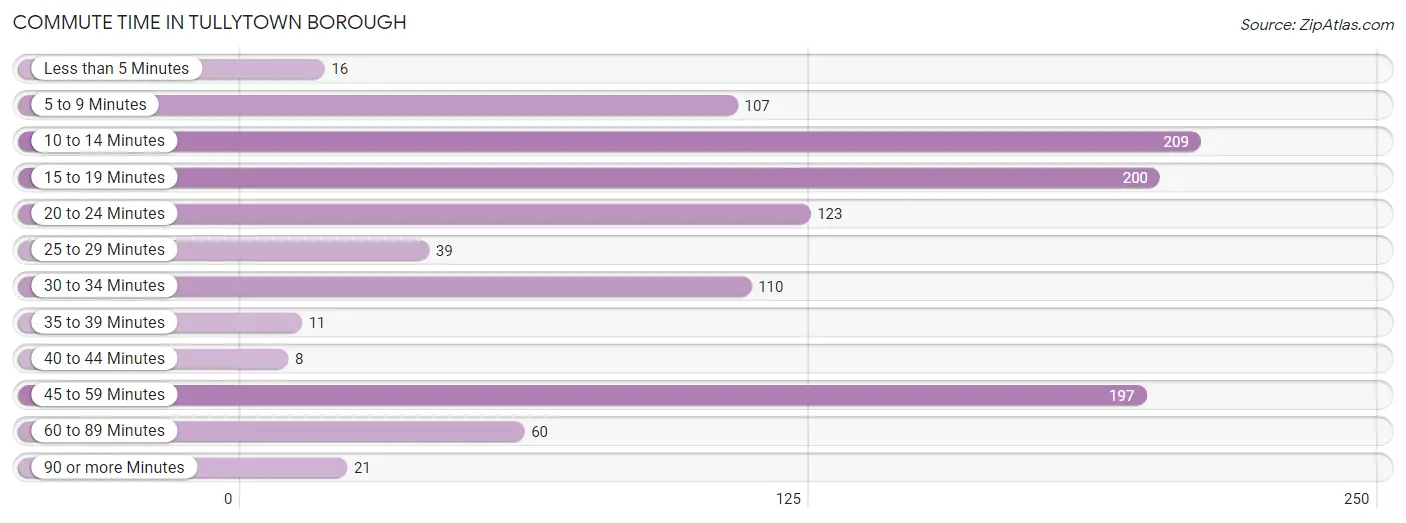
| Commute Time | # Commuters | % Commuters |
| Less than 5 Minutes | 16 | 1.5% |
| 5 to 9 Minutes | 107 | 9.7% |
| 10 to 14 Minutes | 209 | 19.0% |
| 15 to 19 Minutes | 200 | 18.2% |
| 20 to 24 Minutes | 123 | 11.2% |
| 25 to 29 Minutes | 39 | 3.5% |
| 30 to 34 Minutes | 110 | 10.0% |
| 35 to 39 Minutes | 11 | 1.0% |
| 40 to 44 Minutes | 8 | 0.7% |
| 45 to 59 Minutes | 197 | 17.9% |
| 60 to 89 Minutes | 60 | 5.4% |
| 90 or more Minutes | 21 | 1.9% |
Commute Time by Sex in Tullytown borough
The most common commute times in Tullytown borough are 15 to 19 minutes (141 commuters, 20.6%) for males and 10 to 14 minutes (75 commuters, 18.0%) for females.
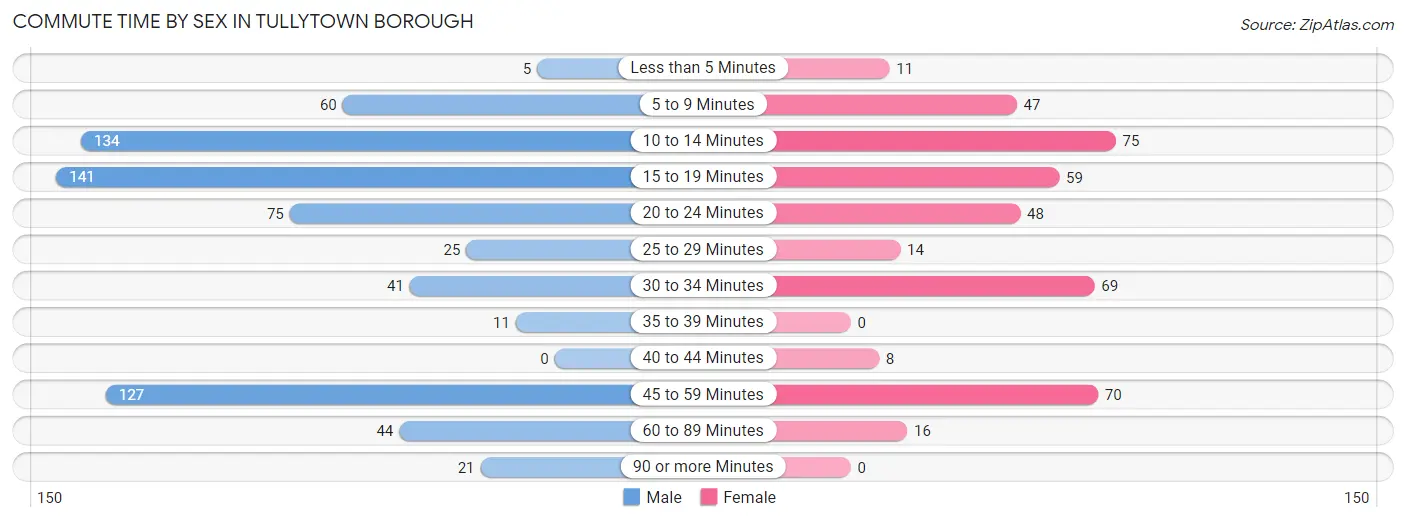
| Commute Time | Male | Female |
| Less than 5 Minutes | 5 (0.7%) | 11 (2.6%) |
| 5 to 9 Minutes | 60 (8.8%) | 47 (11.3%) |
| 10 to 14 Minutes | 134 (19.6%) | 75 (18.0%) |
| 15 to 19 Minutes | 141 (20.6%) | 59 (14.1%) |
| 20 to 24 Minutes | 75 (11.0%) | 48 (11.5%) |
| 25 to 29 Minutes | 25 (3.6%) | 14 (3.4%) |
| 30 to 34 Minutes | 41 (6.0%) | 69 (16.6%) |
| 35 to 39 Minutes | 11 (1.6%) | 0 (0.0%) |
| 40 to 44 Minutes | 0 (0.0%) | 8 (1.9%) |
| 45 to 59 Minutes | 127 (18.6%) | 70 (16.8%) |
| 60 to 89 Minutes | 44 (6.4%) | 16 (3.8%) |
| 90 or more Minutes | 21 (3.1%) | 0 (0.0%) |
Time of Departure to Work by Sex in Tullytown borough
The most frequent times of departure to work in Tullytown borough are 6:00 AM to 6:29 AM (111, 16.2%) for males and 7:30 AM to 7:59 AM (95, 22.8%) for females.
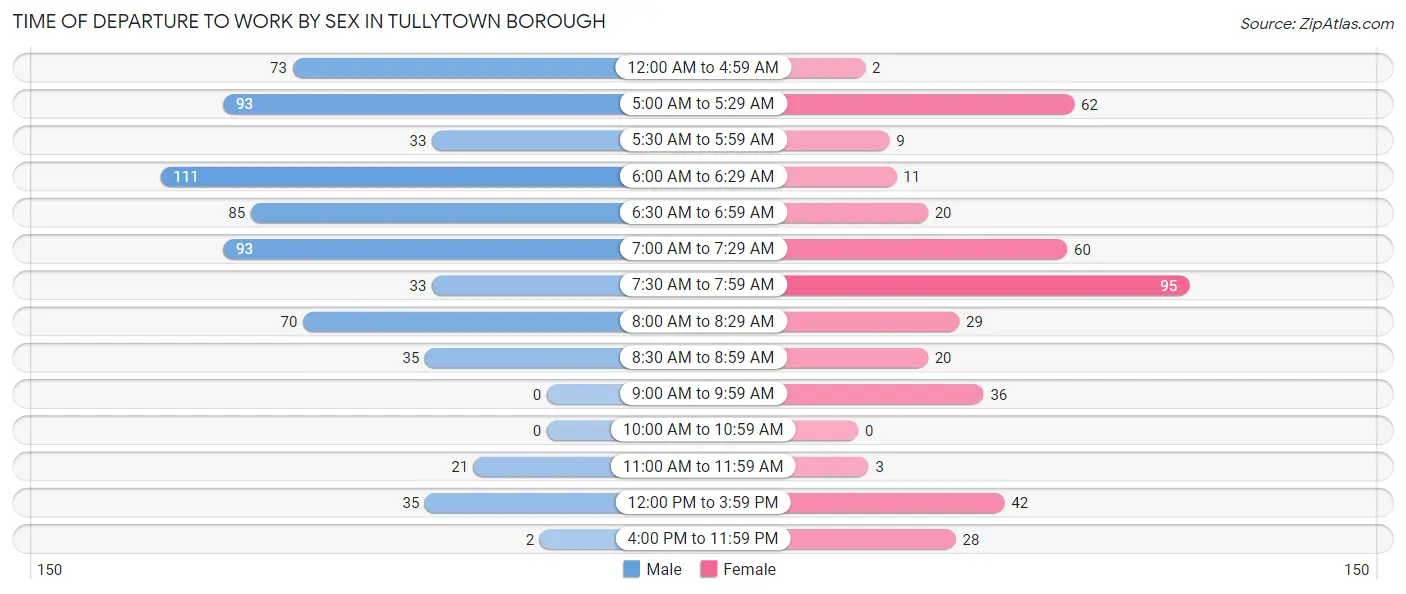
| Time of Departure | Male | Female |
| 12:00 AM to 4:59 AM | 73 (10.7%) | 2 (0.5%) |
| 5:00 AM to 5:29 AM | 93 (13.6%) | 62 (14.9%) |
| 5:30 AM to 5:59 AM | 33 (4.8%) | 9 (2.2%) |
| 6:00 AM to 6:29 AM | 111 (16.2%) | 11 (2.6%) |
| 6:30 AM to 6:59 AM | 85 (12.4%) | 20 (4.8%) |
| 7:00 AM to 7:29 AM | 93 (13.6%) | 60 (14.4%) |
| 7:30 AM to 7:59 AM | 33 (4.8%) | 95 (22.8%) |
| 8:00 AM to 8:29 AM | 70 (10.2%) | 29 (7.0%) |
| 8:30 AM to 8:59 AM | 35 (5.1%) | 20 (4.8%) |
| 9:00 AM to 9:59 AM | 0 (0.0%) | 36 (8.6%) |
| 10:00 AM to 10:59 AM | 0 (0.0%) | 0 (0.0%) |
| 11:00 AM to 11:59 AM | 21 (3.1%) | 3 (0.7%) |
| 12:00 PM to 3:59 PM | 35 (5.1%) | 42 (10.1%) |
| 4:00 PM to 11:59 PM | 2 (0.3%) | 28 (6.7%) |
| Total | 684 (100.0%) | 417 (100.0%) |
Housing Occupancy in Tullytown borough
Occupancy by Ownership in Tullytown borough
Of the total 913 dwellings in Tullytown borough, owner-occupied units account for 463 (50.7%), while renter-occupied units make up 450 (49.3%).
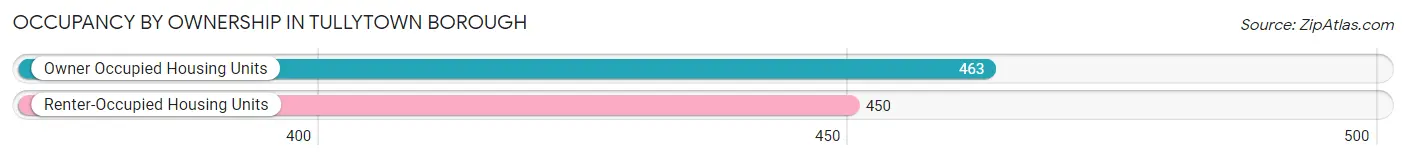
| Occupancy | # Housing Units | % Housing Units |
| Owner Occupied Housing Units | 463 | 50.7% |
| Renter-Occupied Housing Units | 450 | 49.3% |
| Total Occupied Housing Units | 913 | 100.0% |
Occupancy by Household Size in Tullytown borough
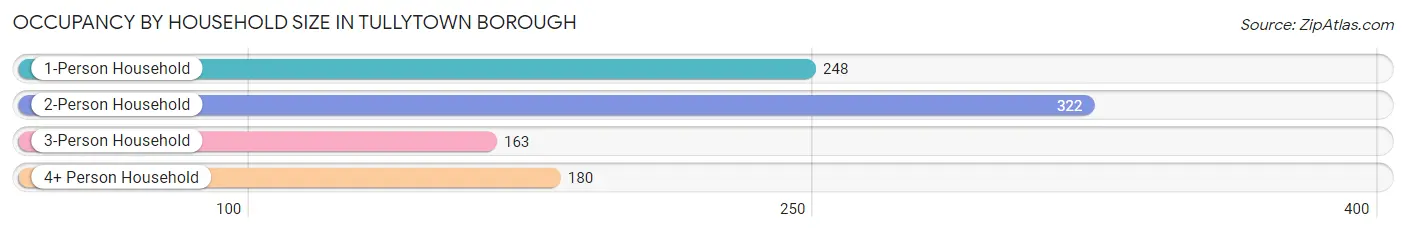
| Household Size | # Housing Units | % Housing Units |
| 1-Person Household | 248 | 27.2% |
| 2-Person Household | 322 | 35.3% |
| 3-Person Household | 163 | 17.8% |
| 4+ Person Household | 180 | 19.7% |
| Total Housing Units | 913 | 100.0% |
Occupancy by Ownership by Household Size in Tullytown borough
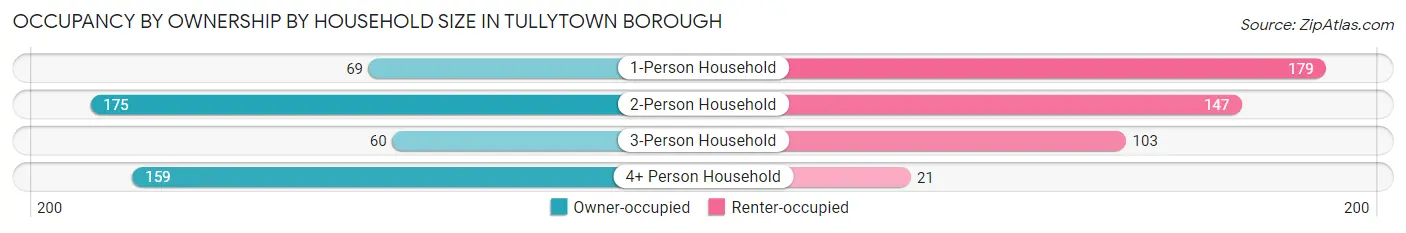
| Household Size | Owner-occupied | Renter-occupied |
| 1-Person Household | 69 (27.8%) | 179 (72.2%) |
| 2-Person Household | 175 (54.3%) | 147 (45.7%) |
| 3-Person Household | 60 (36.8%) | 103 (63.2%) |
| 4+ Person Household | 159 (88.3%) | 21 (11.7%) |
| Total Housing Units | 463 (50.7%) | 450 (49.3%) |
Occupancy by Educational Attainment in Tullytown borough
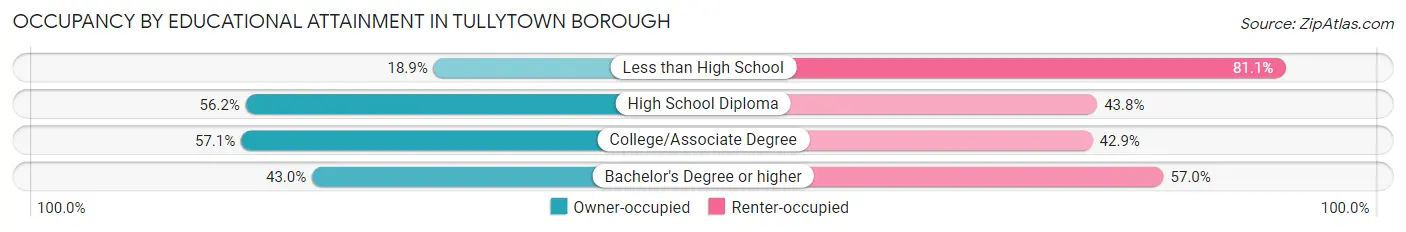
| Household Size | Owner-occupied | Renter-occupied |
| Less than High School | 14 (18.9%) | 60 (81.1%) |
| High School Diploma | 232 (56.2%) | 181 (43.8%) |
| College/Associate Degree | 137 (57.1%) | 103 (42.9%) |
| Bachelor's Degree or higher | 80 (43.0%) | 106 (57.0%) |
Occupancy by Age of Householder in Tullytown borough
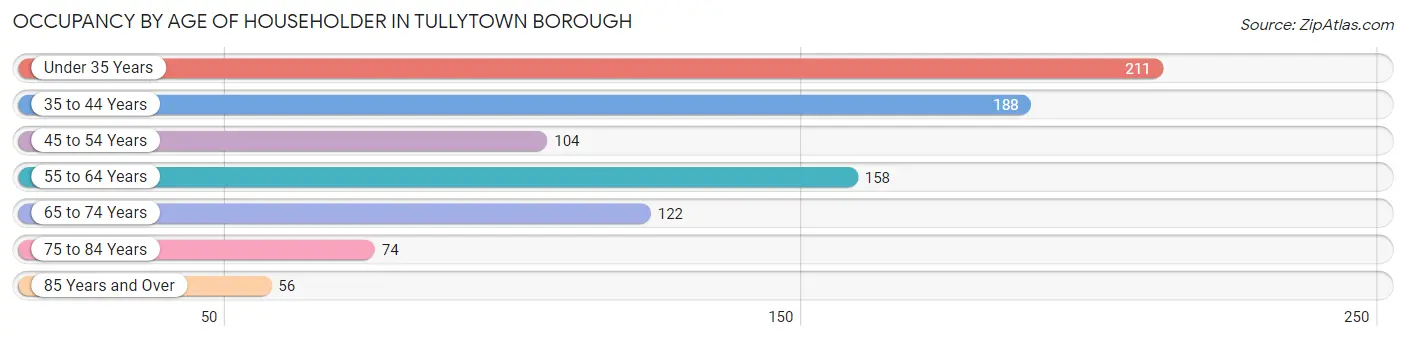
| Age Bracket | # Households | % Households |
| Under 35 Years | 211 | 23.1% |
| 35 to 44 Years | 188 | 20.6% |
| 45 to 54 Years | 104 | 11.4% |
| 55 to 64 Years | 158 | 17.3% |
| 65 to 74 Years | 122 | 13.4% |
| 75 to 84 Years | 74 | 8.1% |
| 85 Years and Over | 56 | 6.1% |
| Total | 913 | 100.0% |
Housing Finances in Tullytown borough
Median Income by Occupancy in Tullytown borough
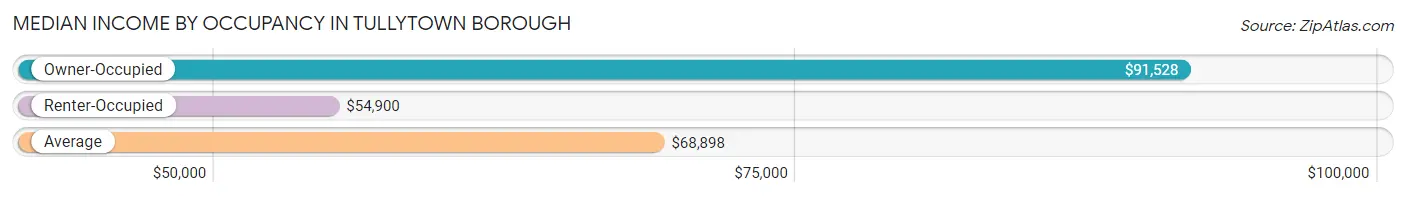
| Occupancy Type | # Households | Median Income |
| Owner-Occupied | 463 (50.7%) | $91,528 |
| Renter-Occupied | 450 (49.3%) | $54,900 |
| Average | 913 (100.0%) | $68,898 |
Occupancy by Householder Income Bracket in Tullytown borough
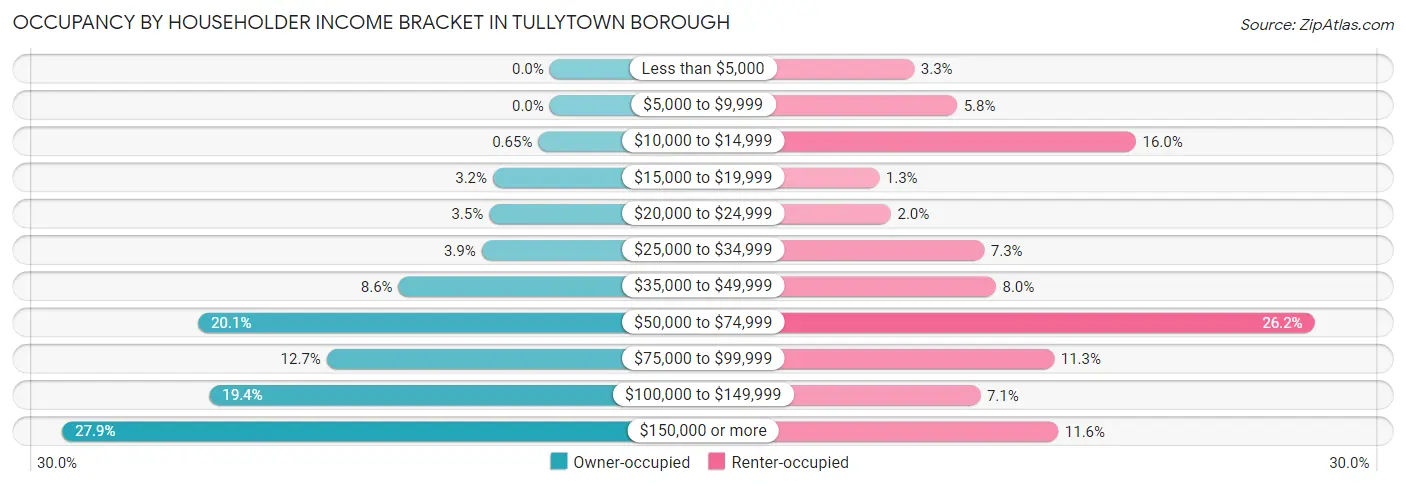
| Income Bracket | Owner-occupied | Renter-occupied |
| Less than $5,000 | 0 (0.0%) | 15 (3.3%) |
| $5,000 to $9,999 | 0 (0.0%) | 26 (5.8%) |
| $10,000 to $14,999 | 3 (0.6%) | 72 (16.0%) |
| $15,000 to $19,999 | 15 (3.2%) | 6 (1.3%) |
| $20,000 to $24,999 | 16 (3.5%) | 9 (2.0%) |
| $25,000 to $34,999 | 18 (3.9%) | 33 (7.3%) |
| $35,000 to $49,999 | 40 (8.6%) | 36 (8.0%) |
| $50,000 to $74,999 | 93 (20.1%) | 118 (26.2%) |
| $75,000 to $99,999 | 59 (12.7%) | 51 (11.3%) |
| $100,000 to $149,999 | 90 (19.4%) | 32 (7.1%) |
| $150,000 or more | 129 (27.9%) | 52 (11.6%) |
| Total | 463 (100.0%) | 450 (100.0%) |
Monthly Housing Cost Tiers in Tullytown borough
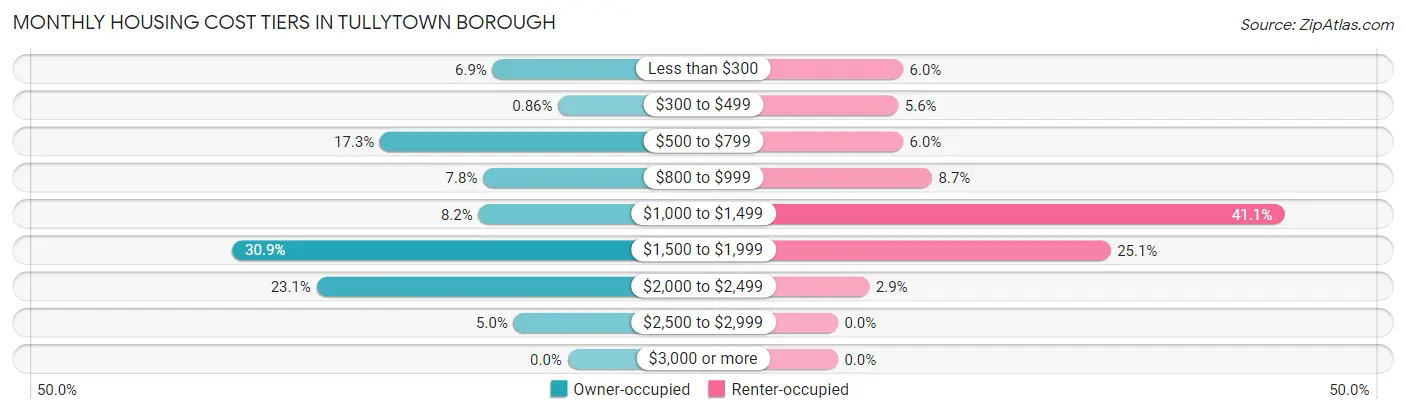
| Monthly Cost | Owner-occupied | Renter-occupied |
| Less than $300 | 32 (6.9%) | 27 (6.0%) |
| $300 to $499 | 4 (0.9%) | 25 (5.6%) |
| $500 to $799 | 80 (17.3%) | 27 (6.0%) |
| $800 to $999 | 36 (7.8%) | 39 (8.7%) |
| $1,000 to $1,499 | 38 (8.2%) | 185 (41.1%) |
| $1,500 to $1,999 | 143 (30.9%) | 113 (25.1%) |
| $2,000 to $2,499 | 107 (23.1%) | 13 (2.9%) |
| $2,500 to $2,999 | 23 (5.0%) | 0 (0.0%) |
| $3,000 or more | 0 (0.0%) | 0 (0.0%) |
| Total | 463 (100.0%) | 450 (100.0%) |
Physical Housing Characteristics in Tullytown borough
Housing Structures in Tullytown borough
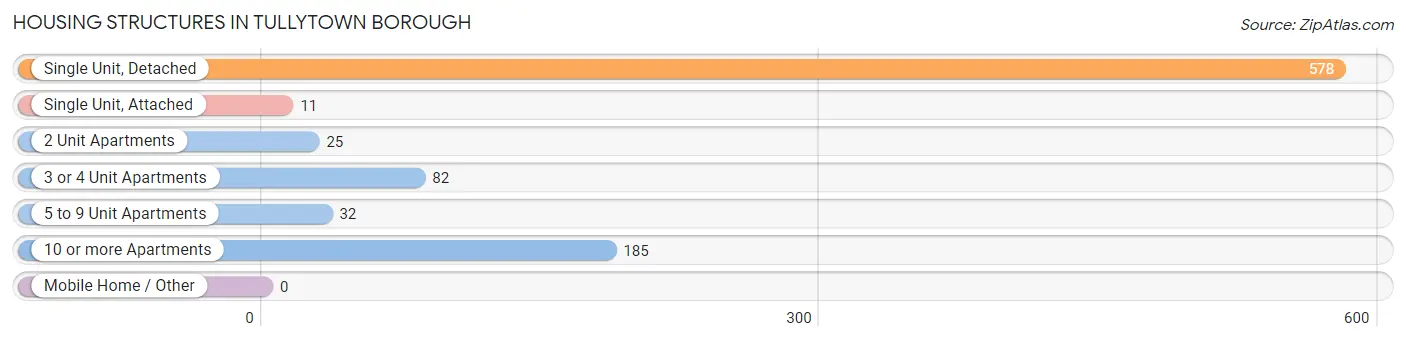
| Structure Type | # Housing Units | % Housing Units |
| Single Unit, Detached | 578 | 63.3% |
| Single Unit, Attached | 11 | 1.2% |
| 2 Unit Apartments | 25 | 2.7% |
| 3 or 4 Unit Apartments | 82 | 9.0% |
| 5 to 9 Unit Apartments | 32 | 3.5% |
| 10 or more Apartments | 185 | 20.3% |
| Mobile Home / Other | 0 | 0.0% |
| Total | 913 | 100.0% |
Housing Structures by Occupancy in Tullytown borough
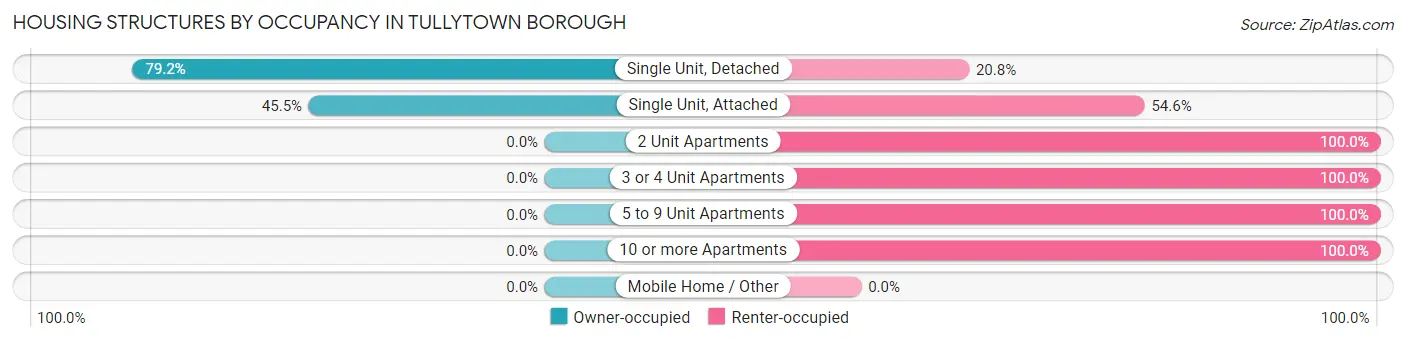
| Structure Type | Owner-occupied | Renter-occupied |
| Single Unit, Detached | 458 (79.2%) | 120 (20.8%) |
| Single Unit, Attached | 5 (45.5%) | 6 (54.5%) |
| 2 Unit Apartments | 0 (0.0%) | 25 (100.0%) |
| 3 or 4 Unit Apartments | 0 (0.0%) | 82 (100.0%) |
| 5 to 9 Unit Apartments | 0 (0.0%) | 32 (100.0%) |
| 10 or more Apartments | 0 (0.0%) | 185 (100.0%) |
| Mobile Home / Other | 0 (0.0%) | 0 (0.0%) |
| Total | 463 (50.7%) | 450 (49.3%) |
Housing Structures by Number of Rooms in Tullytown borough
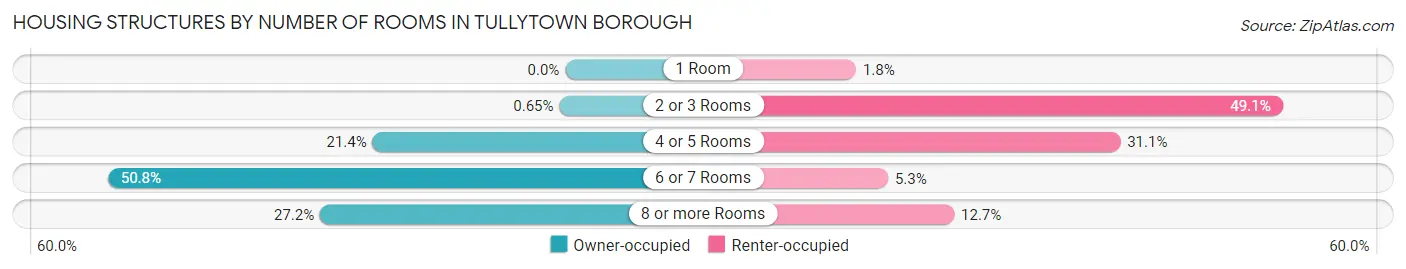
| Number of Rooms | Owner-occupied | Renter-occupied |
| 1 Room | 0 (0.0%) | 8 (1.8%) |
| 2 or 3 Rooms | 3 (0.6%) | 221 (49.1%) |
| 4 or 5 Rooms | 99 (21.4%) | 140 (31.1%) |
| 6 or 7 Rooms | 235 (50.8%) | 24 (5.3%) |
| 8 or more Rooms | 126 (27.2%) | 57 (12.7%) |
| Total | 463 (100.0%) | 450 (100.0%) |
Housing Structure by Heating Type in Tullytown borough
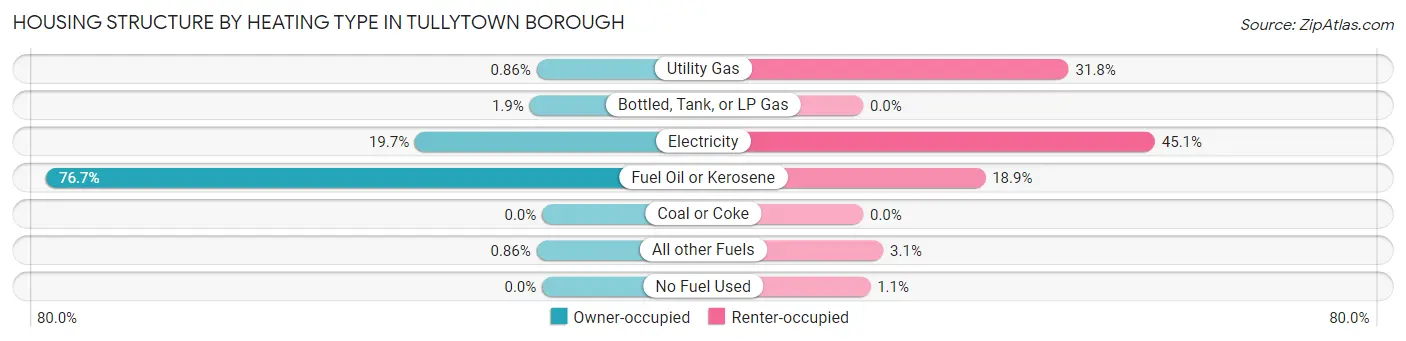
| Heating Type | Owner-occupied | Renter-occupied |
| Utility Gas | 4 (0.9%) | 143 (31.8%) |
| Bottled, Tank, or LP Gas | 9 (1.9%) | 0 (0.0%) |
| Electricity | 91 (19.7%) | 203 (45.1%) |
| Fuel Oil or Kerosene | 355 (76.7%) | 85 (18.9%) |
| Coal or Coke | 0 (0.0%) | 0 (0.0%) |
| All other Fuels | 4 (0.9%) | 14 (3.1%) |
| No Fuel Used | 0 (0.0%) | 5 (1.1%) |
| Total | 463 (100.0%) | 450 (100.0%) |
Household Vehicle Usage in Tullytown borough
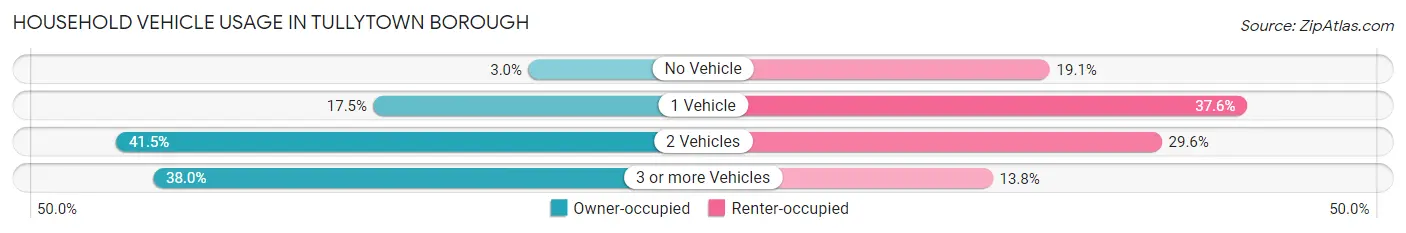
| Vehicles per Household | Owner-occupied | Renter-occupied |
| No Vehicle | 14 (3.0%) | 86 (19.1%) |
| 1 Vehicle | 81 (17.5%) | 169 (37.6%) |
| 2 Vehicles | 192 (41.5%) | 133 (29.6%) |
| 3 or more Vehicles | 176 (38.0%) | 62 (13.8%) |
| Total | 463 (100.0%) | 450 (100.0%) |
Real Estate & Mortgages in Tullytown borough
Real Estate and Mortgage Overview in Tullytown borough
| Characteristic | Without Mortgage | With Mortgage |
| Housing Units | 139 | 324 |
| Median Property Value | $259,800 | $286,400 |
| Median Household Income | $62,083 | $99 |
| Monthly Housing Costs | $656 | $0 |
| Real Estate Taxes | $3,481 | $0 |
Property Value by Mortgage Status in Tullytown borough
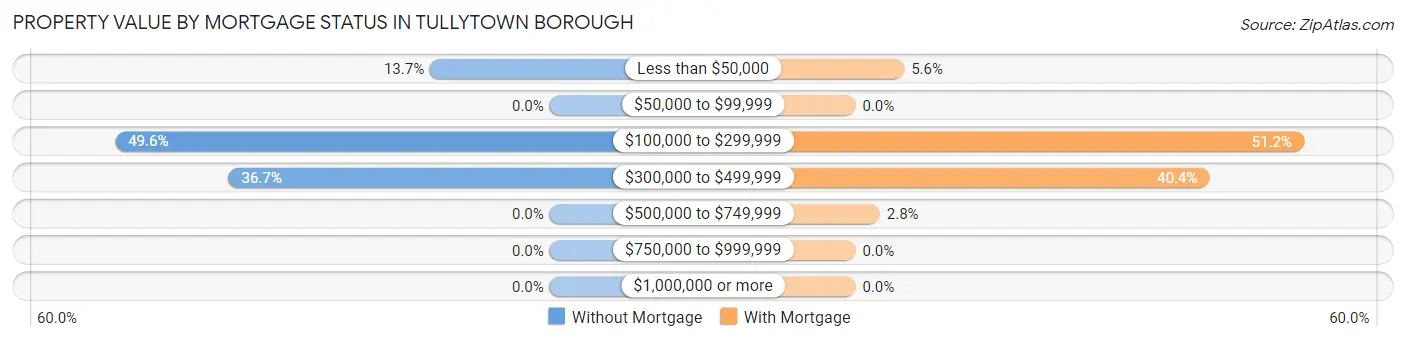
| Property Value | Without Mortgage | With Mortgage |
| Less than $50,000 | 19 (13.7%) | 18 (5.6%) |
| $50,000 to $99,999 | 0 (0.0%) | 0 (0.0%) |
| $100,000 to $299,999 | 69 (49.6%) | 166 (51.2%) |
| $300,000 to $499,999 | 51 (36.7%) | 131 (40.4%) |
| $500,000 to $749,999 | 0 (0.0%) | 9 (2.8%) |
| $750,000 to $999,999 | 0 (0.0%) | 0 (0.0%) |
| $1,000,000 or more | 0 (0.0%) | 0 (0.0%) |
| Total | 139 (100.0%) | 324 (100.0%) |
Household Income by Mortgage Status in Tullytown borough
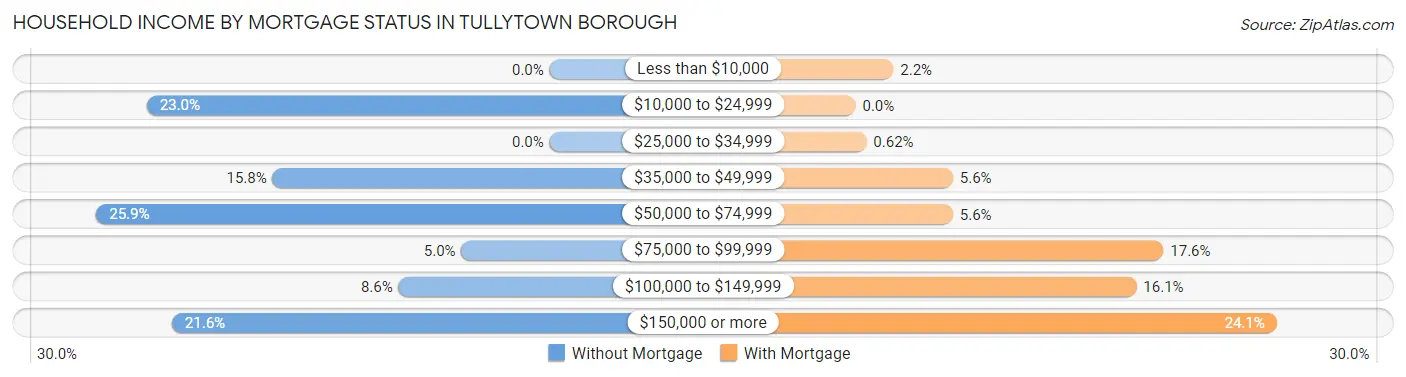
| Household Income | Without Mortgage | With Mortgage |
| Less than $10,000 | 0 (0.0%) | 7 (2.2%) |
| $10,000 to $24,999 | 32 (23.0%) | 0 (0.0%) |
| $25,000 to $34,999 | 0 (0.0%) | 2 (0.6%) |
| $35,000 to $49,999 | 22 (15.8%) | 18 (5.6%) |
| $50,000 to $74,999 | 36 (25.9%) | 18 (5.6%) |
| $75,000 to $99,999 | 7 (5.0%) | 57 (17.6%) |
| $100,000 to $149,999 | 12 (8.6%) | 52 (16.1%) |
| $150,000 or more | 30 (21.6%) | 78 (24.1%) |
| Total | 139 (100.0%) | 324 (100.0%) |
Property Value to Household Income Ratio in Tullytown borough
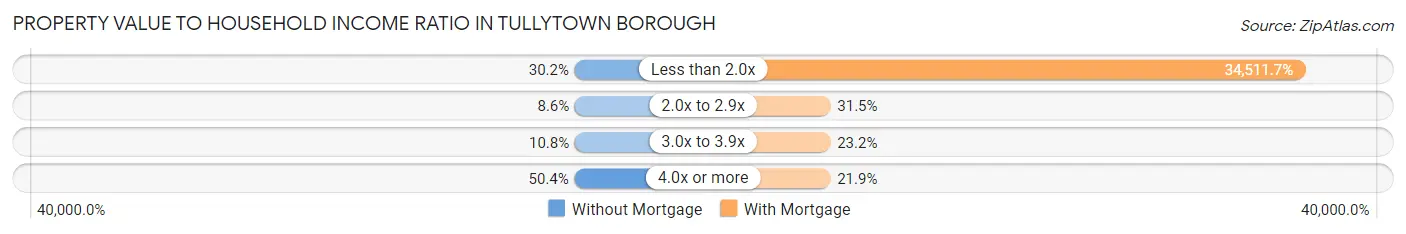
| Value-to-Income Ratio | Without Mortgage | With Mortgage |
| Less than 2.0x | 42 (30.2%) | 111,818 (34,511.7%) |
| 2.0x to 2.9x | 12 (8.6%) | 102 (31.5%) |
| 3.0x to 3.9x | 15 (10.8%) | 75 (23.2%) |
| 4.0x or more | 70 (50.4%) | 71 (21.9%) |
| Total | 139 (100.0%) | 324 (100.0%) |
Real Estate Taxes by Mortgage Status in Tullytown borough
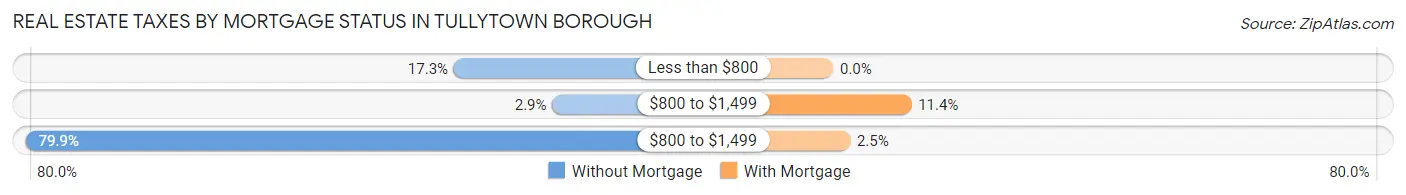
| Property Taxes | Without Mortgage | With Mortgage |
| Less than $800 | 24 (17.3%) | 0 (0.0%) |
| $800 to $1,499 | 4 (2.9%) | 37 (11.4%) |
| $800 to $1,499 | 111 (79.9%) | 8 (2.5%) |
| Total | 139 (100.0%) | 324 (100.0%) |
Health & Disability in Tullytown borough
Health Insurance Coverage by Age in Tullytown borough
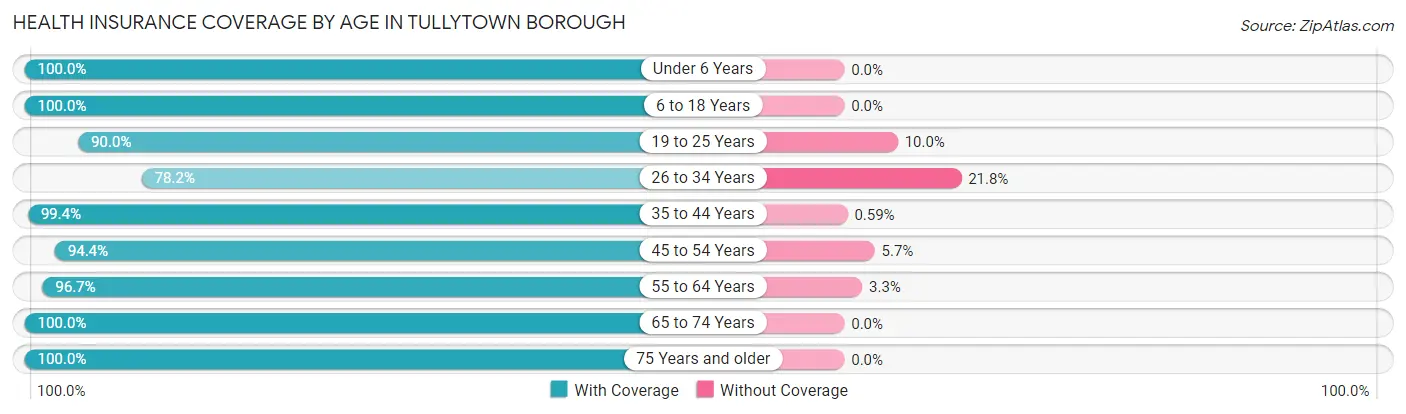
| Age Bracket | With Coverage | Without Coverage |
| Under 6 Years | 224 (100.0%) | 0 (0.0%) |
| 6 to 18 Years | 292 (100.0%) | 0 (0.0%) |
| 19 to 25 Years | 217 (90.0%) | 24 (10.0%) |
| 26 to 34 Years | 226 (78.2%) | 63 (21.8%) |
| 35 to 44 Years | 337 (99.4%) | 2 (0.6%) |
| 45 to 54 Years | 234 (94.4%) | 14 (5.7%) |
| 55 to 64 Years | 320 (96.7%) | 11 (3.3%) |
| 65 to 74 Years | 168 (100.0%) | 0 (0.0%) |
| 75 Years and older | 189 (100.0%) | 0 (0.0%) |
| Total | 2,207 (95.1%) | 114 (4.9%) |
Health Insurance Coverage by Citizenship Status in Tullytown borough
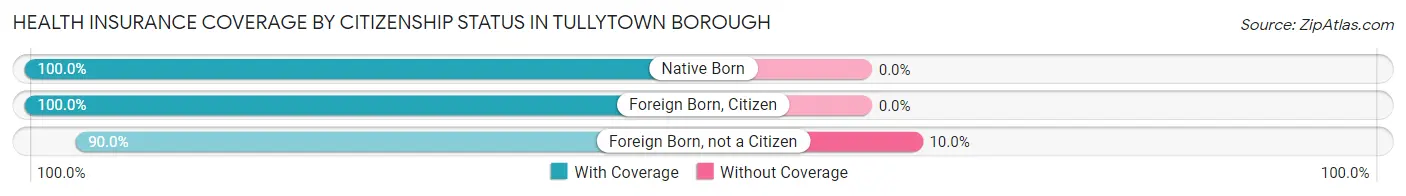
| Citizenship Status | With Coverage | Without Coverage |
| Native Born | 224 (100.0%) | 0 (0.0%) |
| Foreign Born, Citizen | 292 (100.0%) | 0 (0.0%) |
| Foreign Born, not a Citizen | 217 (90.0%) | 24 (10.0%) |
Health Insurance Coverage by Household Income in Tullytown borough
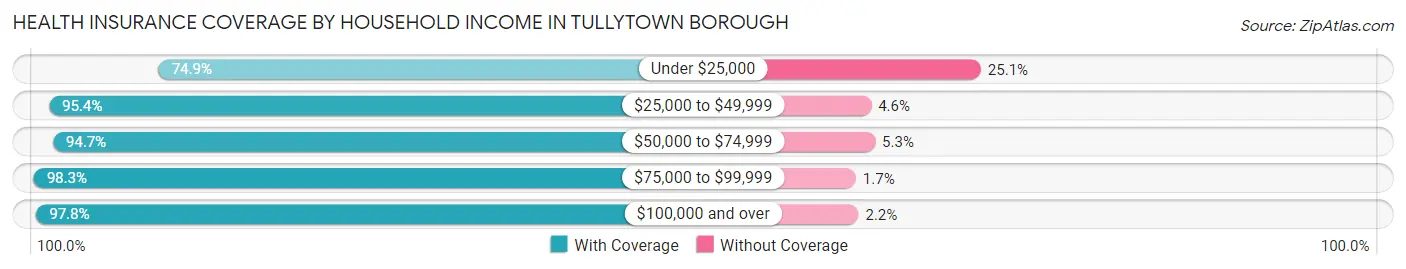
| Household Income | With Coverage | Without Coverage |
| Under $25,000 | 143 (74.9%) | 48 (25.1%) |
| $25,000 to $49,999 | 229 (95.4%) | 11 (4.6%) |
| $50,000 to $74,999 | 464 (94.7%) | 26 (5.3%) |
| $75,000 to $99,999 | 345 (98.3%) | 6 (1.7%) |
| $100,000 and over | 1,021 (97.8%) | 23 (2.2%) |
Public vs Private Health Insurance Coverage by Age in Tullytown borough
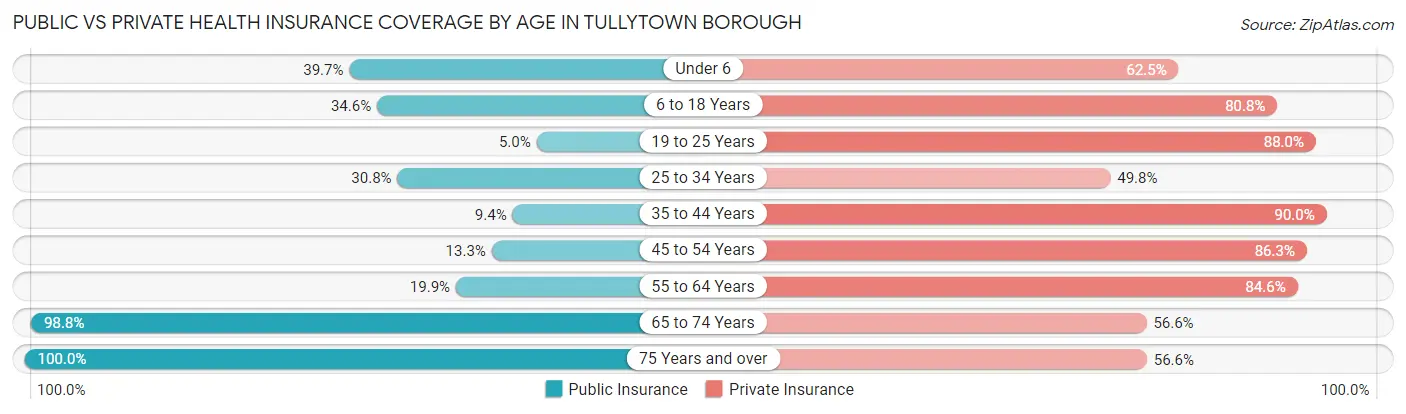
| Age Bracket | Public Insurance | Private Insurance |
| Under 6 | 89 (39.7%) | 140 (62.5%) |
| 6 to 18 Years | 101 (34.6%) | 236 (80.8%) |
| 19 to 25 Years | 12 (5.0%) | 212 (88.0%) |
| 25 to 34 Years | 89 (30.8%) | 144 (49.8%) |
| 35 to 44 Years | 32 (9.4%) | 305 (90.0%) |
| 45 to 54 Years | 33 (13.3%) | 214 (86.3%) |
| 55 to 64 Years | 66 (19.9%) | 280 (84.6%) |
| 65 to 74 Years | 166 (98.8%) | 95 (56.6%) |
| 75 Years and over | 189 (100.0%) | 107 (56.6%) |
| Total | 777 (33.5%) | 1,733 (74.7%) |
Disability Status by Sex by Age in Tullytown borough
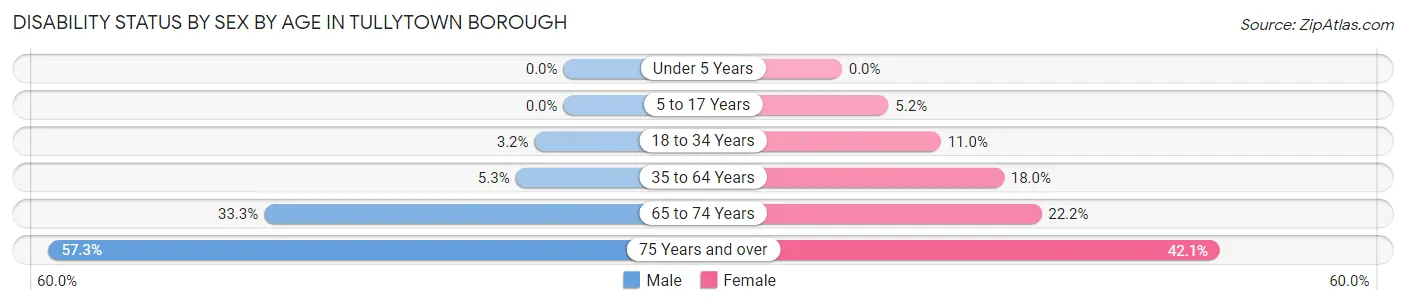
| Age Bracket | Male | Female |
| Under 5 Years | 0 (0.0%) | 0 (0.0%) |
| 5 to 17 Years | 0 (0.0%) | 7 (5.2%) |
| 18 to 34 Years | 10 (3.2%) | 27 (11.0%) |
| 35 to 64 Years | 25 (5.3%) | 81 (18.0%) |
| 65 to 74 Years | 26 (33.3%) | 20 (22.2%) |
| 75 Years and over | 43 (57.3%) | 48 (42.1%) |
Disability Class by Sex by Age in Tullytown borough
Disability Class: Hearing Difficulty
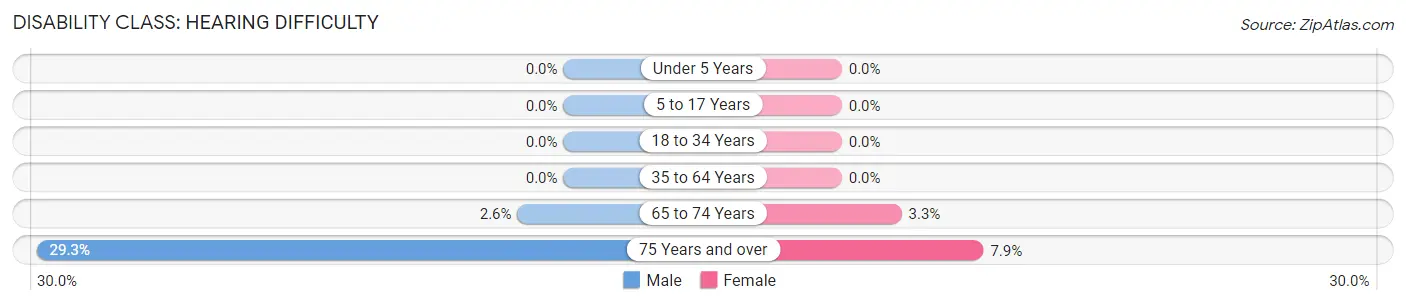
| Age Bracket | Male | Female |
| Under 5 Years | 0 (0.0%) | 0 (0.0%) |
| 5 to 17 Years | 0 (0.0%) | 0 (0.0%) |
| 18 to 34 Years | 0 (0.0%) | 0 (0.0%) |
| 35 to 64 Years | 0 (0.0%) | 0 (0.0%) |
| 65 to 74 Years | 2 (2.6%) | 3 (3.3%) |
| 75 Years and over | 22 (29.3%) | 9 (7.9%) |
Disability Class: Vision Difficulty
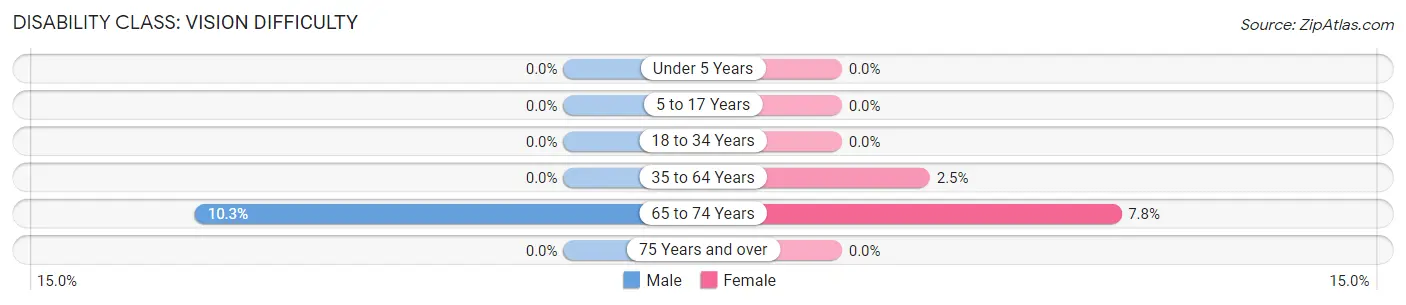
| Age Bracket | Male | Female |
| Under 5 Years | 0 (0.0%) | 0 (0.0%) |
| 5 to 17 Years | 0 (0.0%) | 0 (0.0%) |
| 18 to 34 Years | 0 (0.0%) | 0 (0.0%) |
| 35 to 64 Years | 0 (0.0%) | 11 (2.5%) |
| 65 to 74 Years | 8 (10.3%) | 7 (7.8%) |
| 75 Years and over | 0 (0.0%) | 0 (0.0%) |
Disability Class: Cognitive Difficulty
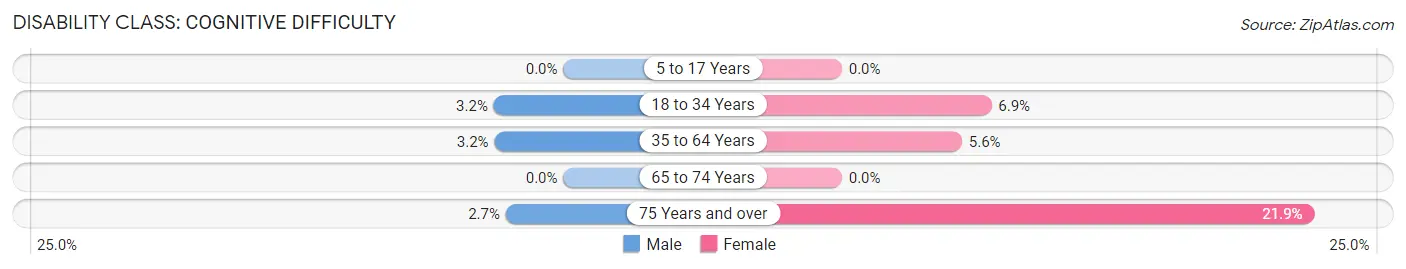
| Age Bracket | Male | Female |
| 5 to 17 Years | 0 (0.0%) | 0 (0.0%) |
| 18 to 34 Years | 10 (3.2%) | 17 (6.9%) |
| 35 to 64 Years | 15 (3.2%) | 25 (5.6%) |
| 65 to 74 Years | 0 (0.0%) | 0 (0.0%) |
| 75 Years and over | 2 (2.7%) | 25 (21.9%) |
Disability Class: Ambulatory Difficulty
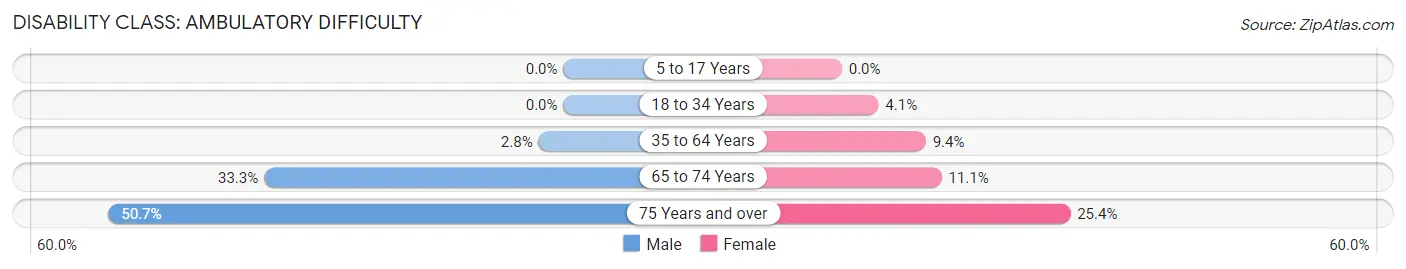
| Age Bracket | Male | Female |
| 5 to 17 Years | 0 (0.0%) | 0 (0.0%) |
| 18 to 34 Years | 0 (0.0%) | 10 (4.1%) |
| 35 to 64 Years | 13 (2.8%) | 42 (9.3%) |
| 65 to 74 Years | 26 (33.3%) | 10 (11.1%) |
| 75 Years and over | 38 (50.7%) | 29 (25.4%) |
Disability Class: Self-Care Difficulty
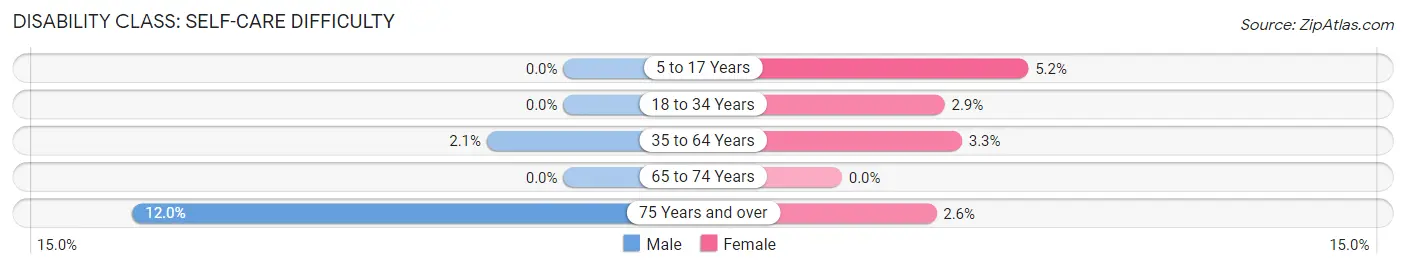
| Age Bracket | Male | Female |
| 5 to 17 Years | 0 (0.0%) | 7 (5.2%) |
| 18 to 34 Years | 0 (0.0%) | 7 (2.9%) |
| 35 to 64 Years | 10 (2.1%) | 15 (3.3%) |
| 65 to 74 Years | 0 (0.0%) | 0 (0.0%) |
| 75 Years and over | 9 (12.0%) | 3 (2.6%) |
Technology Access in Tullytown borough
Computing Device Access in Tullytown borough
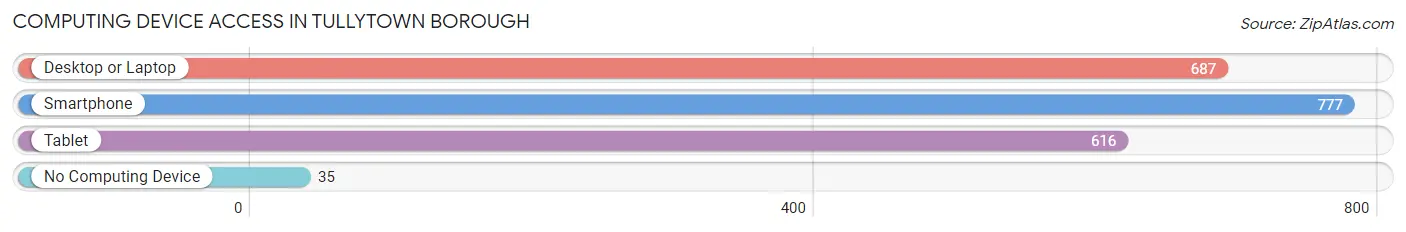
| Device Type | # Households | % Households |
| Desktop or Laptop | 687 | 75.2% |
| Smartphone | 777 | 85.1% |
| Tablet | 616 | 67.5% |
| No Computing Device | 35 | 3.8% |
| Total | 913 | 100.0% |
Internet Access in Tullytown borough
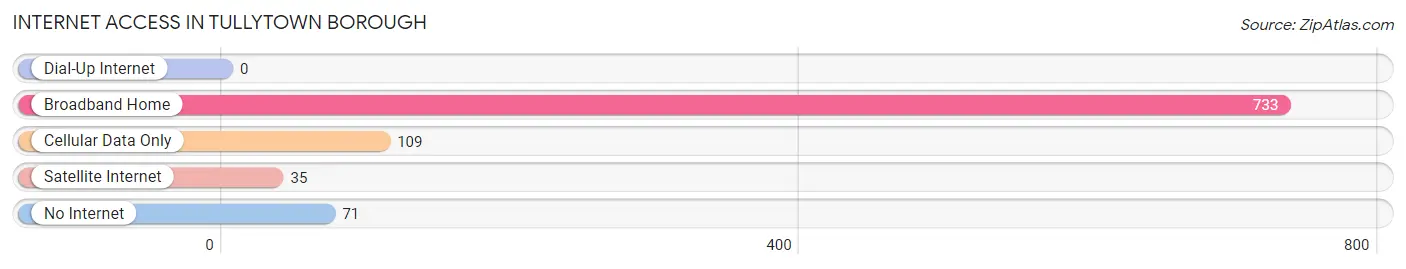
| Internet Type | # Households | % Households |
| Dial-Up Internet | 0 | 0.0% |
| Broadband Home | 733 | 80.3% |
| Cellular Data Only | 109 | 11.9% |
| Satellite Internet | 35 | 3.8% |
| No Internet | 71 | 7.8% |
| Total | 913 | 100.0% |
Tullytown borough Summary
Tullytown Borough is a small borough located in Bucks County, Pennsylvania. It is situated along the Delaware River, just south of the city of Trenton, New Jersey. The borough is part of the greater Philadelphia metropolitan area and is home to approximately 2,500 people.
History
Tullytown Borough was founded in 1719 by William Tully, an Irish immigrant. The borough was originally part of Falls Township, but was incorporated as a separate borough in 1891. The borough was named after William Tully, who was a prominent local landowner and businessman.
The borough was originally a farming community, but in the late 19th century, it began to develop into an industrial center. The Pennsylvania Railroad built a line through the borough in 1876, and the area became a hub for manufacturing and shipping. The borough also became a popular destination for summer vacationers, who would come to enjoy the nearby Delaware River.
In the early 20th century, the borough experienced a period of rapid growth. The population increased from 1,000 in 1900 to over 4,000 by 1930. During this time, the borough was home to several factories, including a paper mill, a steel mill, and a brickyard.
Geography
Tullytown Borough is located in Bucks County, Pennsylvania. It is situated along the Delaware River, just south of the city of Trenton, New Jersey. The borough is part of the greater Philadelphia metropolitan area and is home to approximately 2,500 people.
The borough is located in the Delaware Valley, which is a region of low-lying hills and valleys. The borough is located on the western edge of the valley, and is bordered by the Delaware River to the east. The borough is located in a temperate climate, with hot summers and cold winters.
Economy
Tullytown Borough is a small, rural community with a primarily agricultural economy. The borough is home to several farms, which produce a variety of crops, including corn, soybeans, and hay. The borough is also home to several small businesses, including a few restaurants, a grocery store, and a hardware store.
The borough is also home to several industrial businesses, including a paper mill, a steel mill, and a brickyard. These businesses provide employment for many of the borough's residents.
Demographics
As of the 2010 census, the population of Tullytown Borough was 2,521. The racial makeup of the borough was 94.3% White, 2.2% African American, 0.3% Native American, 0.7% Asian, 0.1% Pacific Islander, and 2.4% from other races. Hispanic or Latino of any race were 3.2% of the population.
The median household income in the borough was $50,938, and the median family income was $60,938. The per capita income in the borough was $25,938. About 8.3% of families and 10.2% of the population were below the poverty line, including 14.2% of those under age 18 and 6.2% of those age 65 or over.
Common Questions
What is Per Capita Income in Tullytown borough?
Per Capita income in Tullytown borough is $44,443.
What is the Median Family Income in Tullytown borough?
Median Family Income in Tullytown borough is $89,318.
What is the Median Household income in Tullytown borough?
Median Household Income in Tullytown borough is $68,898.
What is Income or Wage Gap in Tullytown borough?
Income or Wage Gap in Tullytown borough is 46.0%.
Women in Tullytown borough earn 54.0 cents for every dollar earned by a man.
What is Inequality or Gini Index in Tullytown borough?
Inequality or Gini Index in Tullytown borough is 0.51.
What is the Total Population of Tullytown borough?
Total Population of Tullytown borough is 2,321.
What is the Total Male Population of Tullytown borough?
Total Male Population of Tullytown borough is 1,183.
What is the Total Female Population of Tullytown borough?
Total Female Population of Tullytown borough is 1,138.
What is the Ratio of Males per 100 Females in Tullytown borough?
There are 103.95 Males per 100 Females in Tullytown borough.
What is the Ratio of Females per 100 Males in Tullytown borough?
There are 96.20 Females per 100 Males in Tullytown borough.
What is the Median Population Age in Tullytown borough?
Median Population Age in Tullytown borough is 40.0 Years.
What is the Average Family Size in Tullytown borough
Average Family Size in Tullytown borough is 3.0 People.
What is the Average Household Size in Tullytown borough
Average Household Size in Tullytown borough is 2.5 People.
How Large is the Labor Force in Tullytown borough?
There are 1,244 People in the Labor Forcein in Tullytown borough.
What is the Percentage of People in the Labor Force in Tullytown borough?
66.6% of People are in the Labor Force in Tullytown borough.
What is the Unemployment Rate in Tullytown borough?
Unemployment Rate in Tullytown borough is 3.3%.