Tower City borough, PA Map & Demographics
Tower City borough Overview
$29,473
PER CAPITA INCOME
$77,045
AVG FAMILY INCOME
$67,250
AVG HOUSEHOLD INCOME
35.3%
WAGE / INCOME GAP [ % ]
64.7¢/ $1
WAGE / INCOME GAP [ $ ]
0.37
INEQUALITY / GINI INDEX
1,329
TOTAL POPULATION
612
MALE POPULATION
717
FEMALE POPULATION
85.36
MALES / 100 FEMALES
117.16
FEMALES / 100 MALES
37.2
MEDIAN AGE
3.3
AVG FAMILY SIZE
2.7
AVG HOUSEHOLD SIZE
674
LABOR FORCE [ PEOPLE ]
63.6%
PERCENT IN LABOR FORCE
4.8%
UNEMPLOYMENT RATE
Income in Tower City borough
Income Overview in Tower City borough
Per Capita Income in Tower City borough is $29,473, while median incomes of families and households are $77,045 and $67,250 respectively.
| Characteristic | Number | Measure |
| Per Capita Income | 1,329 | $29,473 |
| Median Family Income | 340 | $77,045 |
| Mean Family Income | 340 | $87,234 |
| Median Household Income | 488 | $67,250 |
| Mean Household Income | 488 | $77,735 |
| Income Deficit | 340 | $0 |
| Wage / Income Gap (%) | 1,329 | 35.30% |
| Wage / Income Gap ($) | 1,329 | 64.70¢ per $1 |
| Gini / Inequality Index | 1,329 | 0.37 |
Earnings by Sex in Tower City borough
Average Earnings in Tower City borough are $40,242, $47,708 for men and $30,865 for women, a difference of 35.3%.
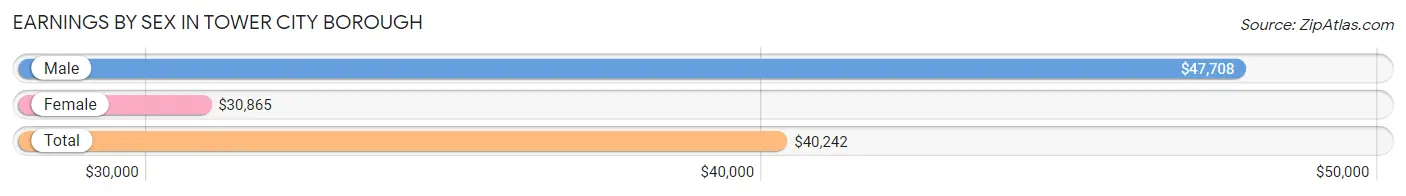
| Sex | Number | Average Earnings |
| Male | 381 (53.7%) | $47,708 |
| Female | 329 (46.3%) | $30,865 |
| Total | 710 (100.0%) | $40,242 |
Earnings by Sex by Income Bracket in Tower City borough
The most common earnings brackets in Tower City borough are $40,000 to $44,999 for men (45 | 11.8%) and $2,499 or less for women (34 | 10.3%).
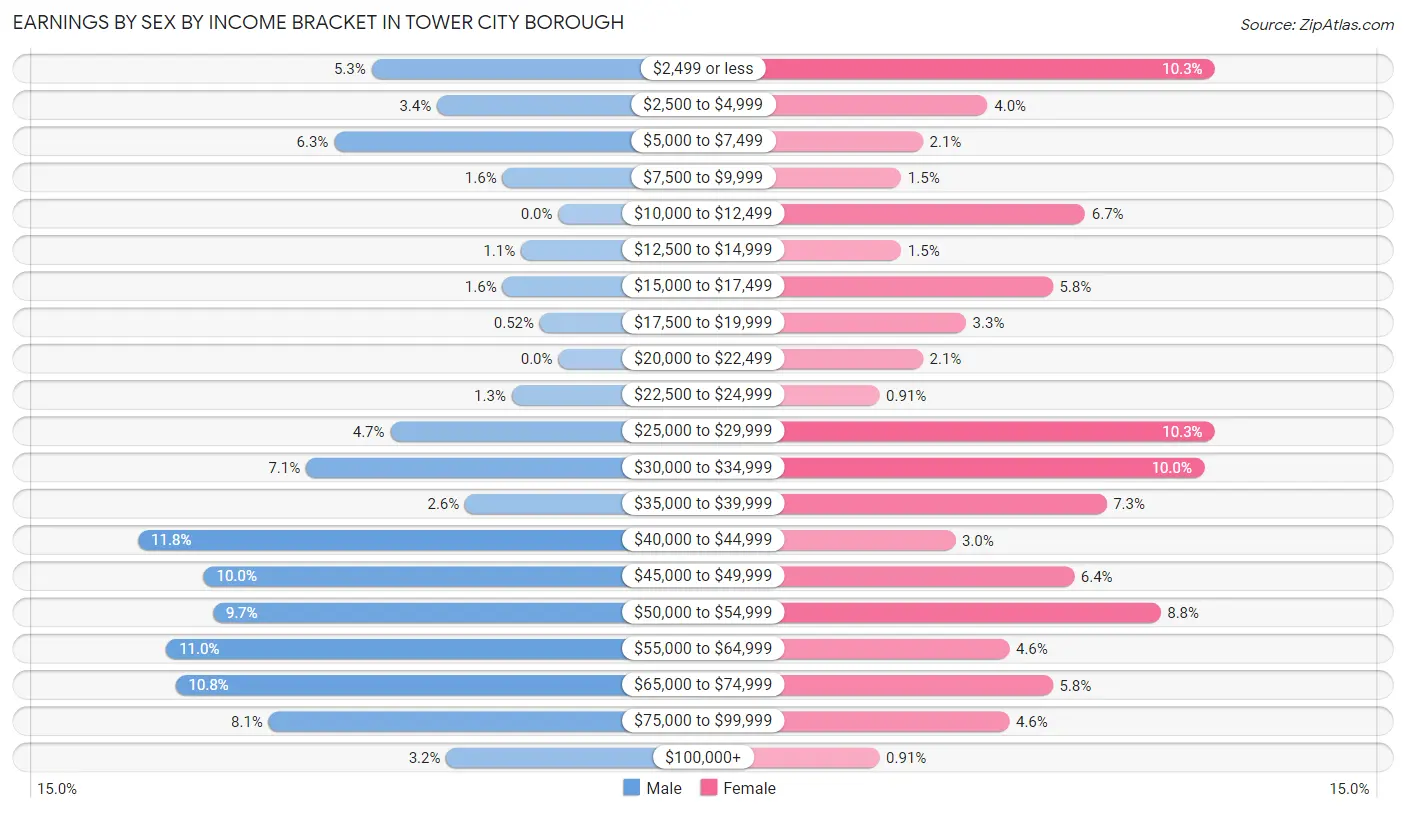
| Income | Male | Female |
| $2,499 or less | 20 (5.2%) | 34 (10.3%) |
| $2,500 to $4,999 | 13 (3.4%) | 13 (4.0%) |
| $5,000 to $7,499 | 24 (6.3%) | 7 (2.1%) |
| $7,500 to $9,999 | 6 (1.6%) | 5 (1.5%) |
| $10,000 to $12,499 | 0 (0.0%) | 22 (6.7%) |
| $12,500 to $14,999 | 4 (1.1%) | 5 (1.5%) |
| $15,000 to $17,499 | 6 (1.6%) | 19 (5.8%) |
| $17,500 to $19,999 | 2 (0.5%) | 11 (3.3%) |
| $20,000 to $22,499 | 0 (0.0%) | 7 (2.1%) |
| $22,500 to $24,999 | 5 (1.3%) | 3 (0.9%) |
| $25,000 to $29,999 | 18 (4.7%) | 34 (10.3%) |
| $30,000 to $34,999 | 27 (7.1%) | 33 (10.0%) |
| $35,000 to $39,999 | 10 (2.6%) | 24 (7.3%) |
| $40,000 to $44,999 | 45 (11.8%) | 10 (3.0%) |
| $45,000 to $49,999 | 38 (10.0%) | 21 (6.4%) |
| $50,000 to $54,999 | 37 (9.7%) | 29 (8.8%) |
| $55,000 to $64,999 | 42 (11.0%) | 15 (4.6%) |
| $65,000 to $74,999 | 41 (10.8%) | 19 (5.8%) |
| $75,000 to $99,999 | 31 (8.1%) | 15 (4.6%) |
| $100,000+ | 12 (3.2%) | 3 (0.9%) |
| Total | 381 (100.0%) | 329 (100.0%) |
Earnings by Sex by Educational Attainment in Tower City borough
Average earnings in Tower City borough are $49,050 for men and $37,727 for women, a difference of 23.1%. Men with an educational attainment of college or associate's degree enjoy the highest average annual earnings of $55,208, while those with less than high school education earn the least with $5,673. Women with an educational attainment of graduate degree earn the most with the average annual earnings of $65,000, while those with college or associate's degree education have the smallest earnings of $33,000.
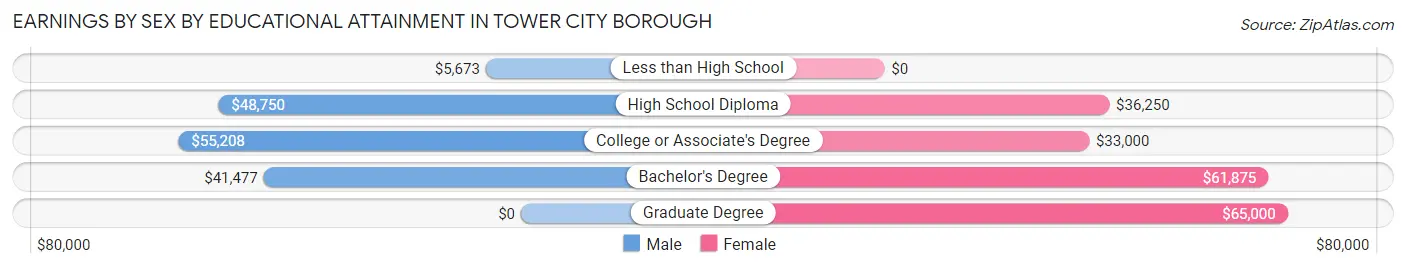
| Educational Attainment | Male Income | Female Income |
| Less than High School | $5,673 | $0 |
| High School Diploma | $48,750 | $36,250 |
| College or Associate's Degree | $55,208 | $33,000 |
| Bachelor's Degree | $41,477 | $61,875 |
| Graduate Degree | - | - |
| Total | $49,050 | $37,727 |
Family Income in Tower City borough
Family Income Brackets in Tower City borough
According to the Tower City borough family income data, there are 79 families falling into the $100,000 to $149,999 income range, which is the most common income bracket and makes up 23.2% of all families. Conversely, the less than $10,000 income bracket is the least frequent group with only 5 families (1.5%) belonging to this category.
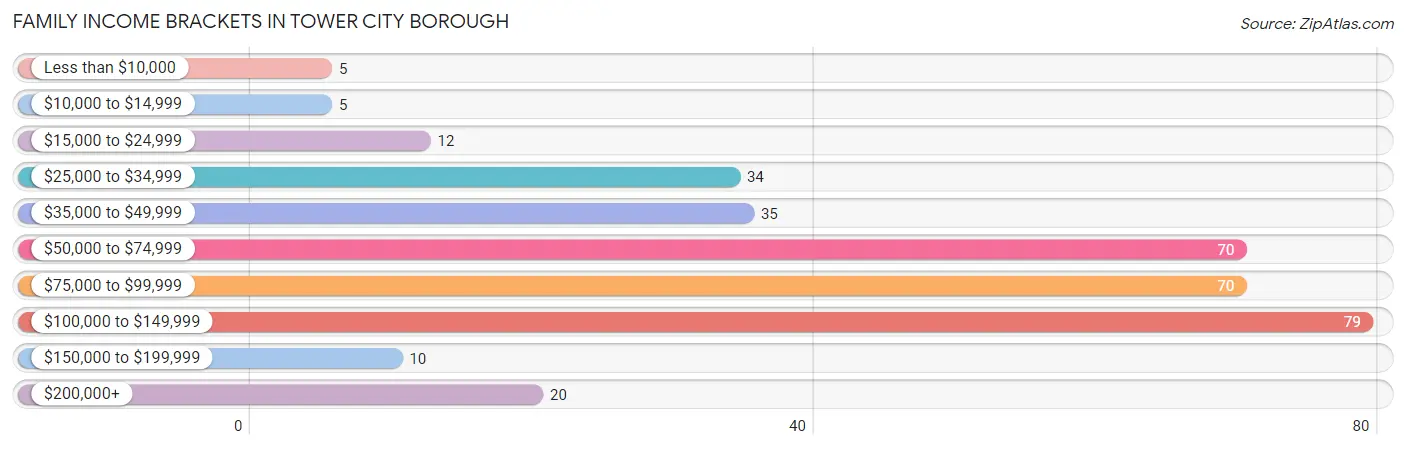
| Income Bracket | # Families | % Families |
| Less than $10,000 | 5 | 1.5% |
| $10,000 to $14,999 | 5 | 1.5% |
| $15,000 to $24,999 | 12 | 3.5% |
| $25,000 to $34,999 | 34 | 10.0% |
| $35,000 to $49,999 | 35 | 10.3% |
| $50,000 to $74,999 | 70 | 20.6% |
| $75,000 to $99,999 | 70 | 20.6% |
| $100,000 to $149,999 | 79 | 23.2% |
| $150,000 to $199,999 | 10 | 2.9% |
| $200,000+ | 20 | 5.9% |
Family Income by Famaliy Size in Tower City borough
5-person families (51 | 15.0%) account for the highest median family income in Tower City borough with $137,841 per family, while 3-person families (66 | 19.4%) have the highest median income of $35,417 per family member.
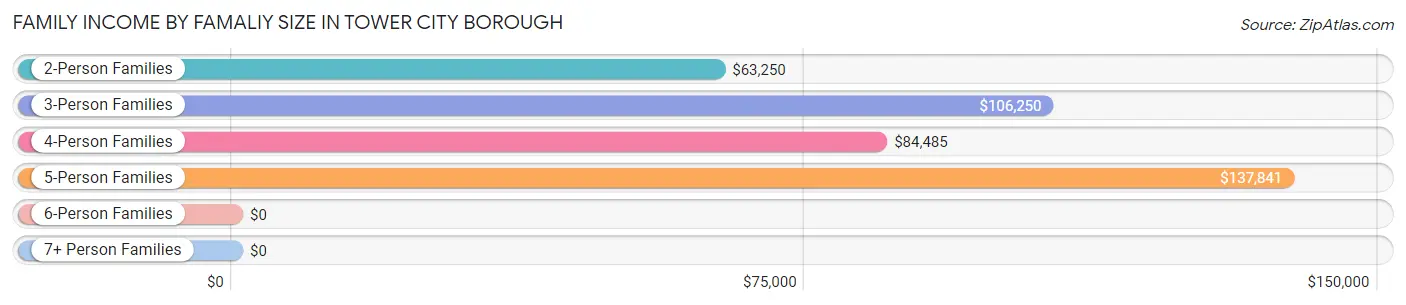
| Income Bracket | # Families | Median Income |
| 2-Person Families | 153 (45.0%) | $63,250 |
| 3-Person Families | 66 (19.4%) | $106,250 |
| 4-Person Families | 65 (19.1%) | $84,485 |
| 5-Person Families | 51 (15.0%) | $137,841 |
| 6-Person Families | 0 (0.0%) | $0 |
| 7+ Person Families | 5 (1.5%) | $0 |
| Total | 340 (100.0%) | $77,045 |
Family Income by Number of Earners in Tower City borough
The median family income in Tower City borough is $77,045, with families comprising 3+ earners (65) having the highest median family income of $130,893, while families with no earners (43) have the lowest median family income of $44,375, accounting for 19.1% and 12.7% of families, respectively.
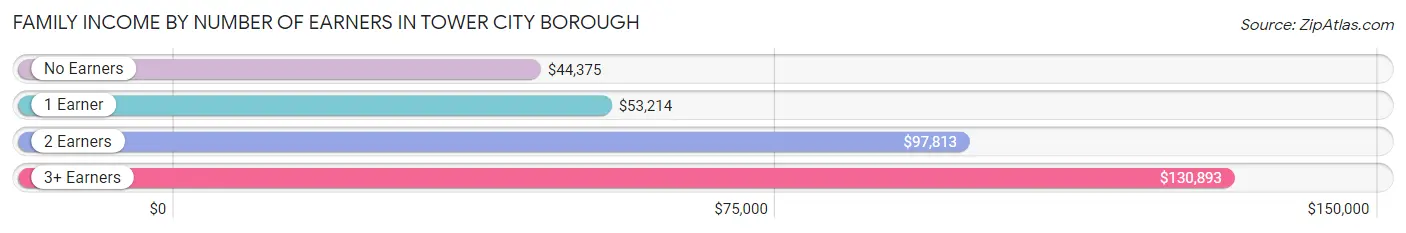
| Number of Earners | # Families | Median Income |
| No Earners | 43 (12.7%) | $44,375 |
| 1 Earner | 96 (28.2%) | $53,214 |
| 2 Earners | 136 (40.0%) | $97,813 |
| 3+ Earners | 65 (19.1%) | $130,893 |
| Total | 340 (100.0%) | $77,045 |
Household Income in Tower City borough
Household Income Brackets in Tower City borough
With 117 households falling in the category, the $50,000 to $74,999 income range is the most frequent in Tower City borough, accounting for 24.0% of all households. In contrast, only 4 households (0.8%) fall into the $150,000 to $199,999 income bracket, making it the least populous group.
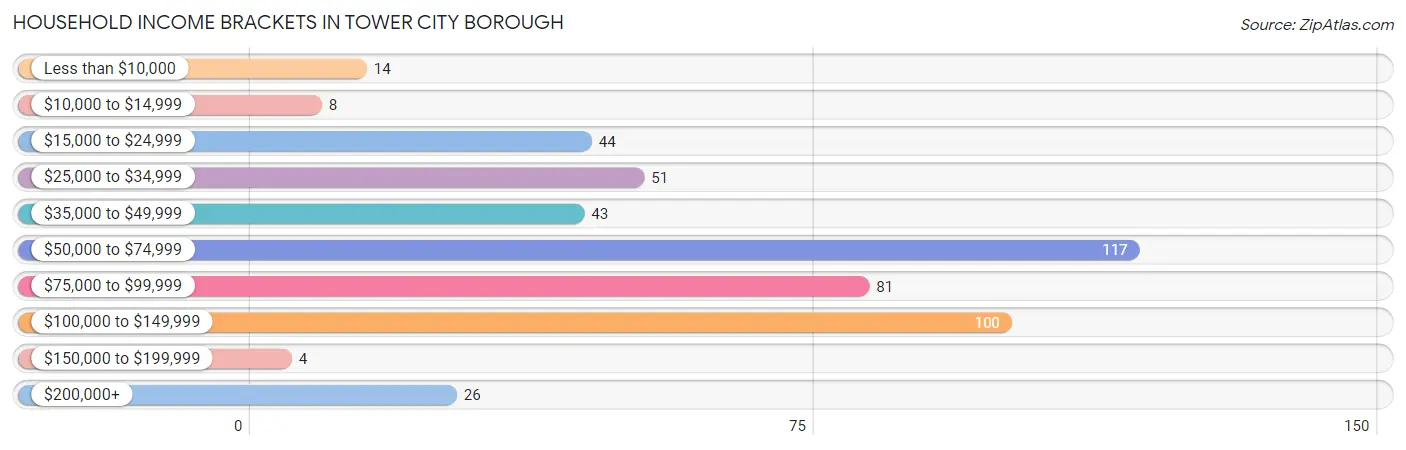
| Income Bracket | # Households | % Households |
| Less than $10,000 | 14 | 2.9% |
| $10,000 to $14,999 | 8 | 1.6% |
| $15,000 to $24,999 | 44 | 9.0% |
| $25,000 to $34,999 | 51 | 10.5% |
| $35,000 to $49,999 | 43 | 8.8% |
| $50,000 to $74,999 | 117 | 24.0% |
| $75,000 to $99,999 | 81 | 16.6% |
| $100,000 to $149,999 | 100 | 20.5% |
| $150,000 to $199,999 | 4 | 0.8% |
| $200,000+ | 26 | 5.3% |
Household Income by Householder Age in Tower City borough
The median household income in Tower City borough is $67,250, with the highest median household income of $84,722 found in the 45 to 64 years age bracket for the primary householder. A total of 182 households (37.3%) fall into this category. Meanwhile, the 65+ years age bracket for the primary householder has the lowest median household income of $52,813, with 142 households (29.1%) in this group.
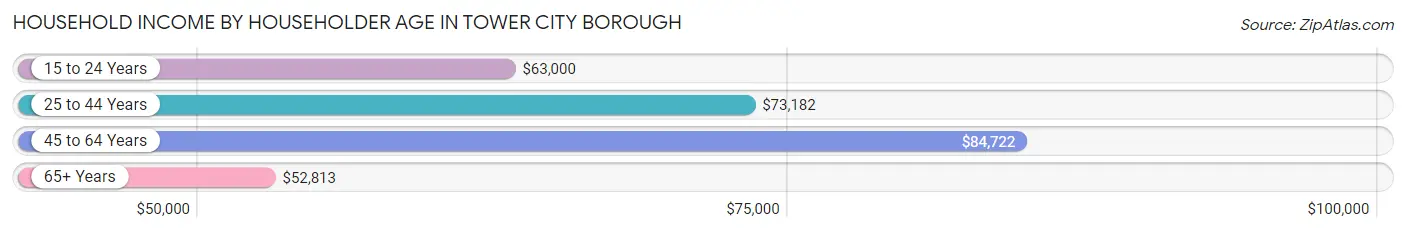
| Income Bracket | # Households | Median Income |
| 15 to 24 Years | 12 (2.5%) | $63,000 |
| 25 to 44 Years | 152 (31.1%) | $73,182 |
| 45 to 64 Years | 182 (37.3%) | $84,722 |
| 65+ Years | 142 (29.1%) | $52,813 |
| Total | 488 (100.0%) | $67,250 |
Poverty in Tower City borough
Income Below Poverty by Sex and Age in Tower City borough
With 6.2% poverty level for males and 8.5% for females among the residents of Tower City borough, 15 year old males and 18 to 24 year old females are the most vulnerable to poverty, with 5 males (55.6%) and 22 females (31.4%) in their respective age groups living below the poverty level.
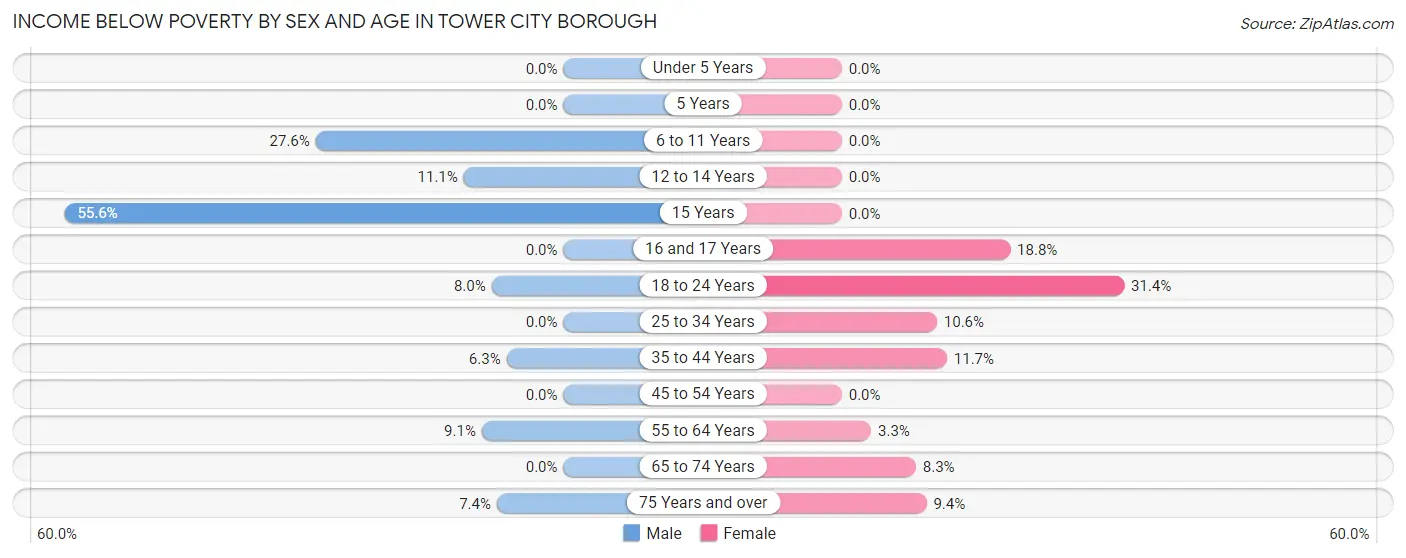
| Age Bracket | Male | Female |
| Under 5 Years | 0 (0.0%) | 0 (0.0%) |
| 5 Years | 0 (0.0%) | 0 (0.0%) |
| 6 to 11 Years | 8 (27.6%) | 0 (0.0%) |
| 12 to 14 Years | 4 (11.1%) | 0 (0.0%) |
| 15 Years | 5 (55.6%) | 0 (0.0%) |
| 16 and 17 Years | 0 (0.0%) | 3 (18.8%) |
| 18 to 24 Years | 6 (8.0%) | 22 (31.4%) |
| 25 to 34 Years | 0 (0.0%) | 9 (10.6%) |
| 35 to 44 Years | 5 (6.3%) | 11 (11.7%) |
| 45 to 54 Years | 0 (0.0%) | 0 (0.0%) |
| 55 to 64 Years | 8 (9.1%) | 3 (3.3%) |
| 65 to 74 Years | 0 (0.0%) | 8 (8.3%) |
| 75 Years and over | 2 (7.4%) | 5 (9.4%) |
| Total | 38 (6.2%) | 61 (8.5%) |
Income Above Poverty by Sex and Age in Tower City borough
According to the poverty statistics in Tower City borough, males aged under 5 years and females aged under 5 years are the age groups that are most secure financially, with 100.0% of males and 100.0% of females in these age groups living above the poverty line.
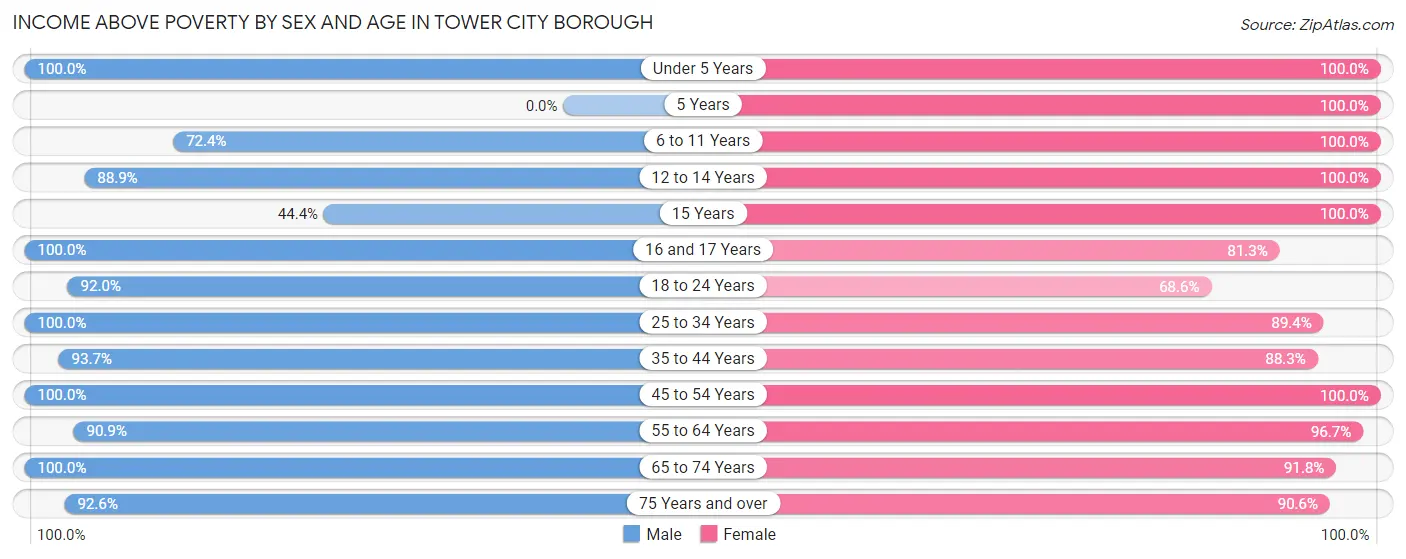
| Age Bracket | Male | Female |
| Under 5 Years | 42 (100.0%) | 41 (100.0%) |
| 5 Years | 0 (0.0%) | 8 (100.0%) |
| 6 to 11 Years | 21 (72.4%) | 77 (100.0%) |
| 12 to 14 Years | 32 (88.9%) | 13 (100.0%) |
| 15 Years | 4 (44.4%) | 14 (100.0%) |
| 16 and 17 Years | 30 (100.0%) | 13 (81.2%) |
| 18 to 24 Years | 69 (92.0%) | 48 (68.6%) |
| 25 to 34 Years | 72 (100.0%) | 76 (89.4%) |
| 35 to 44 Years | 74 (93.7%) | 83 (88.3%) |
| 45 to 54 Years | 84 (100.0%) | 57 (100.0%) |
| 55 to 64 Years | 80 (90.9%) | 89 (96.7%) |
| 65 to 74 Years | 40 (100.0%) | 89 (91.7%) |
| 75 Years and over | 25 (92.6%) | 48 (90.6%) |
| Total | 573 (93.8%) | 656 (91.5%) |
Income Below Poverty Among Married-Couple Families in Tower City borough
The poverty statistics for married-couple families in Tower City borough show that 2.9% or 7 of the total 241 families live below the poverty line. Families with 1 or 2 children have the highest poverty rate of 4.3%, comprising of 5 families. On the other hand, families with 3 or 4 children have the lowest poverty rate of 0.0%, which includes 0 families.
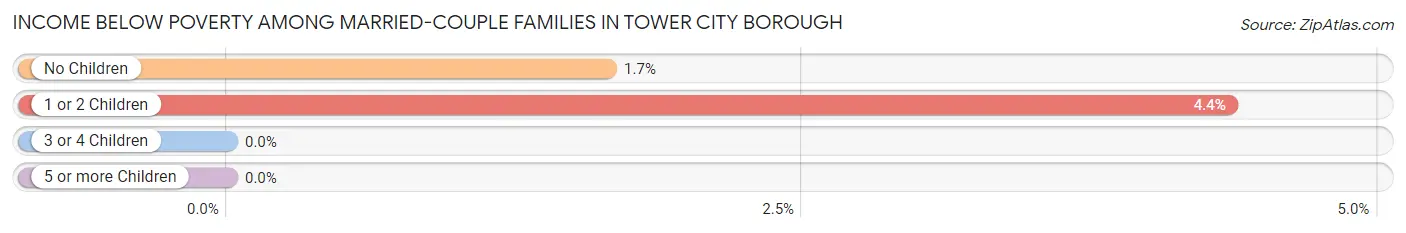
| Children | Above Poverty | Below Poverty |
| No Children | 119 (98.4%) | 2 (1.7%) |
| 1 or 2 Children | 110 (95.7%) | 5 (4.3%) |
| 3 or 4 Children | 5 (100.0%) | 0 (0.0%) |
| 5 or more Children | 0 (0.0%) | 0 (0.0%) |
| Total | 234 (97.1%) | 7 (2.9%) |
Income Below Poverty Among Single-Parent Households in Tower City borough
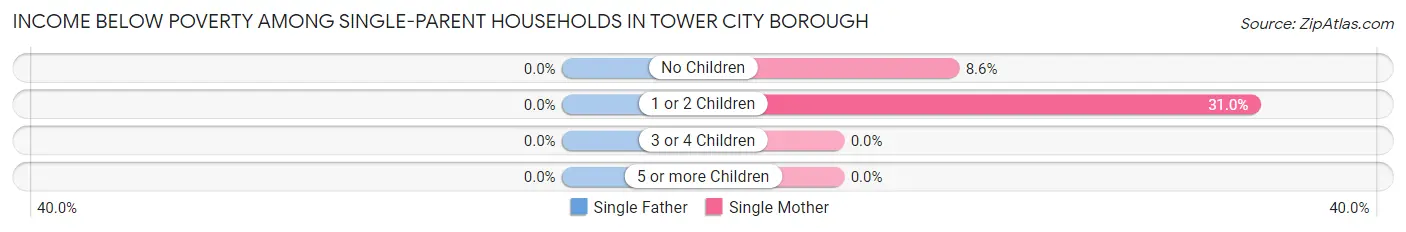
| Children | Single Father | Single Mother |
| No Children | 0 (0.0%) | 3 (8.6%) |
| 1 or 2 Children | 0 (0.0%) | 9 (31.0%) |
| 3 or 4 Children | 0 (0.0%) | 0 (0.0%) |
| 5 or more Children | 0 (0.0%) | 0 (0.0%) |
| Total | 0 (0.0%) | 12 (16.7%) |
Income Below Poverty Among Married-Couple vs Single-Parent Households in Tower City borough
The poverty data for Tower City borough shows that 7 of the married-couple family households (2.9%) and 12 of the single-parent households (12.1%) are living below the poverty level. Within the married-couple family households, those with 1 or 2 children have the highest poverty rate, with 5 households (4.3%) falling below the poverty line. Among the single-parent households, those with 1 or 2 children have the highest poverty rate, with 9 household (20.9%) living below poverty.
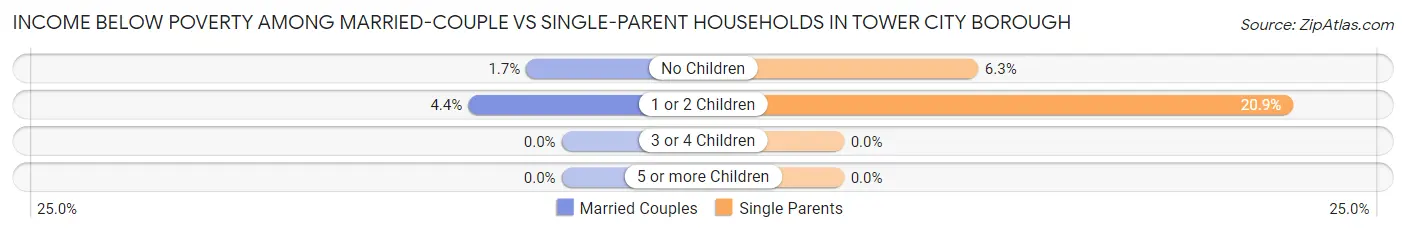
| Children | Married-Couple Families | Single-Parent Households |
| No Children | 2 (1.7%) | 3 (6.2%) |
| 1 or 2 Children | 5 (4.3%) | 9 (20.9%) |
| 3 or 4 Children | 0 (0.0%) | 0 (0.0%) |
| 5 or more Children | 0 (0.0%) | 0 (0.0%) |
| Total | 7 (2.9%) | 12 (12.1%) |
Race in Tower City borough
The most populous races in Tower City borough are White / Caucasian (1,319 | 99.3%), Hispanic or Latino (33 | 2.5%), and Two or more Races (10 | 0.7%).
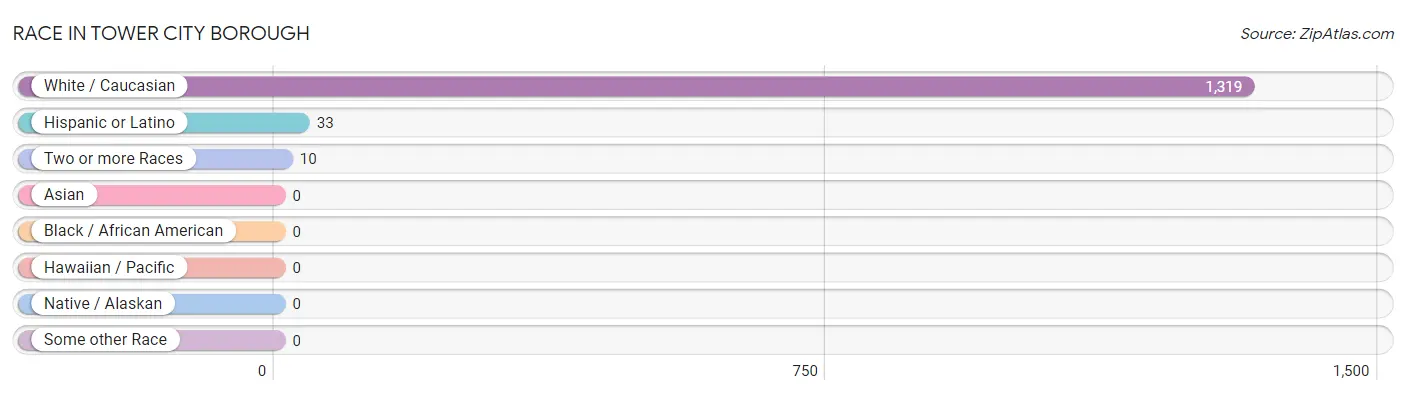
| Race | # Population | % Population |
| Asian | 0 | 0.0% |
| Black / African American | 0 | 0.0% |
| Hawaiian / Pacific | 0 | 0.0% |
| Hispanic or Latino | 33 | 2.5% |
| Native / Alaskan | 0 | 0.0% |
| White / Caucasian | 1,319 | 99.3% |
| Two or more Races | 10 | 0.7% |
| Some other Race | 0 | 0.0% |
| Total | 1,329 | 100.0% |
Ancestry in Tower City borough
The most populous ancestries reported in Tower City borough are German (521 | 39.2%), Irish (131 | 9.9%), Dutch (84 | 6.3%), Polish (81 | 6.1%), and Pennsylvania German (78 | 5.9%), together accounting for 67.3% of all Tower City borough residents.
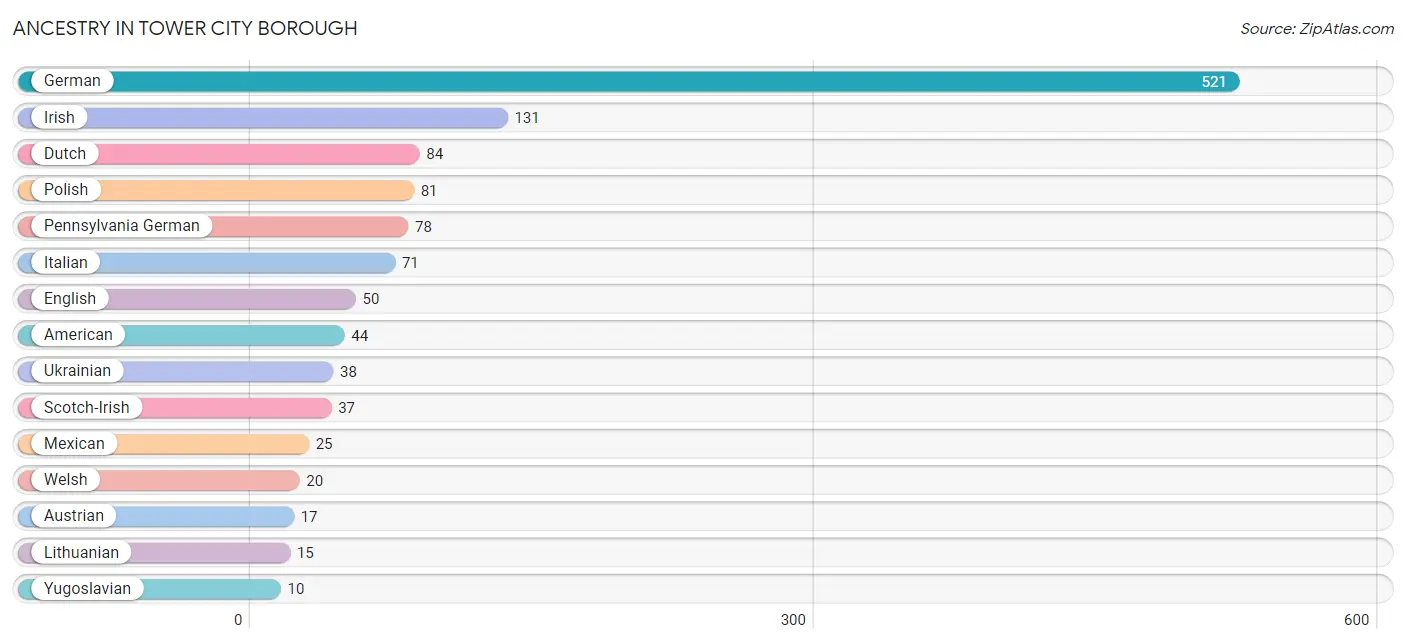
| Ancestry | # Population | % Population |
| American | 44 | 3.3% |
| Austrian | 17 | 1.3% |
| Chinese | 2 | 0.2% |
| Cuban | 2 | 0.2% |
| Dutch | 84 | 6.3% |
| English | 50 | 3.8% |
| European | 5 | 0.4% |
| French | 2 | 0.2% |
| German | 521 | 39.2% |
| Greek | 5 | 0.4% |
| Hungarian | 7 | 0.5% |
| Irish | 131 | 9.9% |
| Italian | 71 | 5.3% |
| Lithuanian | 15 | 1.1% |
| Luxembourger | 2 | 0.2% |
| Mexican | 25 | 1.9% |
| Pennsylvania German | 78 | 5.9% |
| Polish | 81 | 6.1% |
| Puerto Rican | 6 | 0.4% |
| Russian | 1 | 0.1% |
| Scotch-Irish | 37 | 2.8% |
| Scottish | 7 | 0.5% |
| Slavic | 4 | 0.3% |
| Slovak | 3 | 0.2% |
| Swiss | 5 | 0.4% |
| Ukrainian | 38 | 2.9% |
| Welsh | 20 | 1.5% |
| Yugoslavian | 10 | 0.7% | View All 28 Rows |
Immigrants in Tower City borough
The most numerous immigrant groups reported in Tower City borough came from Europe (4 | 0.3%), Northern Europe (4 | 0.3%), Canada (3 | 0.2%), Bolivia (2 | 0.2%), and Latin America (2 | 0.2%), together accounting for 1.1% of all Tower City borough residents.
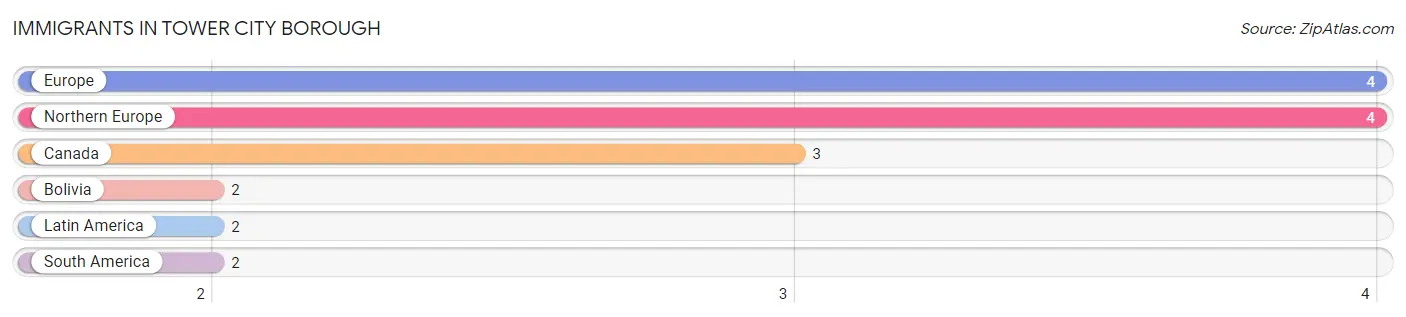
| Immigration Origin | # Population | % Population |
| Bolivia | 2 | 0.2% |
| Canada | 3 | 0.2% |
| Europe | 4 | 0.3% |
| Latin America | 2 | 0.2% |
| Northern Europe | 4 | 0.3% |
| South America | 2 | 0.2% | View All 6 Rows |
Sex and Age in Tower City borough
Sex and Age in Tower City borough
The most populous age groups in Tower City borough are 45 to 49 Years (66 | 10.8%) for men and 65 to 69 Years (73 | 10.2%) for women.
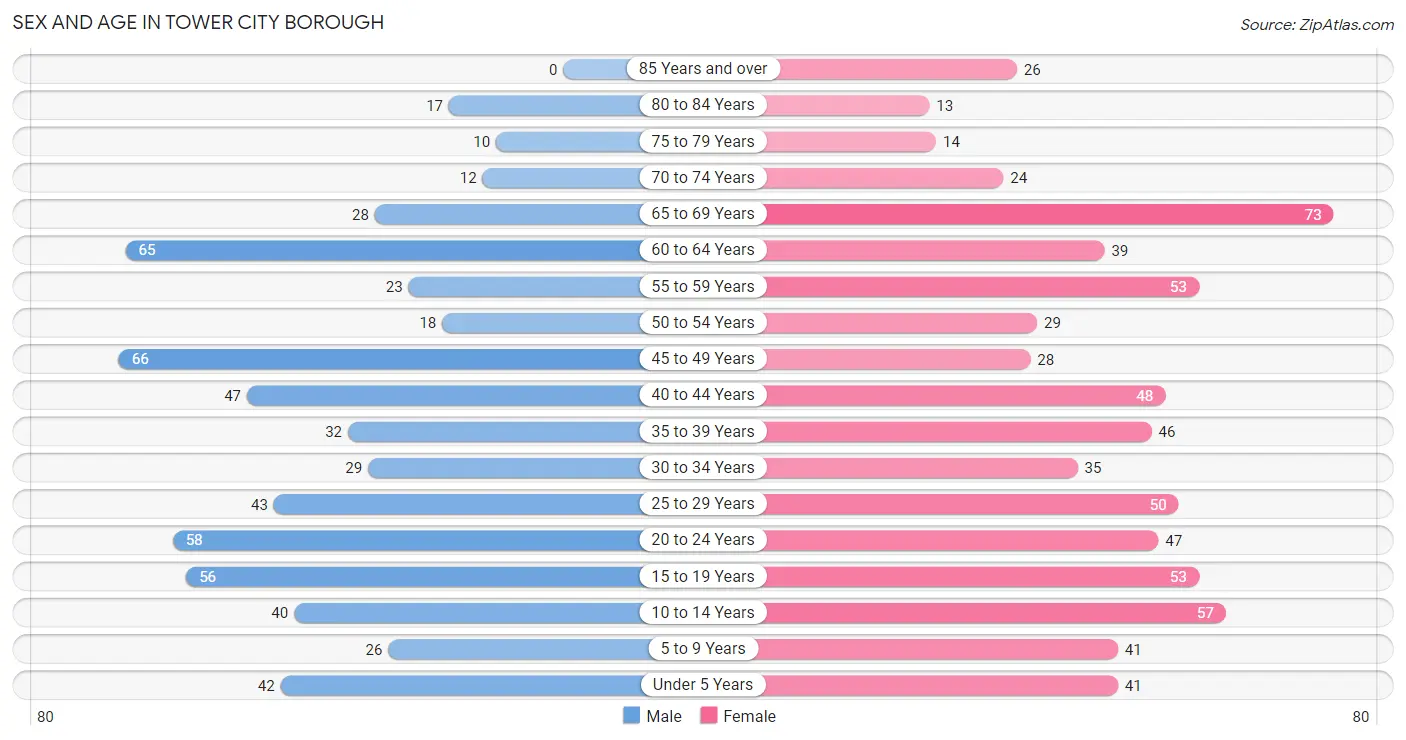
| Age Bracket | Male | Female |
| Under 5 Years | 42 (6.9%) | 41 (5.7%) |
| 5 to 9 Years | 26 (4.3%) | 41 (5.7%) |
| 10 to 14 Years | 40 (6.5%) | 57 (8.0%) |
| 15 to 19 Years | 56 (9.1%) | 53 (7.4%) |
| 20 to 24 Years | 58 (9.5%) | 47 (6.6%) |
| 25 to 29 Years | 43 (7.0%) | 50 (7.0%) |
| 30 to 34 Years | 29 (4.7%) | 35 (4.9%) |
| 35 to 39 Years | 32 (5.2%) | 46 (6.4%) |
| 40 to 44 Years | 47 (7.7%) | 48 (6.7%) |
| 45 to 49 Years | 66 (10.8%) | 28 (3.9%) |
| 50 to 54 Years | 18 (2.9%) | 29 (4.0%) |
| 55 to 59 Years | 23 (3.8%) | 53 (7.4%) |
| 60 to 64 Years | 65 (10.6%) | 39 (5.4%) |
| 65 to 69 Years | 28 (4.6%) | 73 (10.2%) |
| 70 to 74 Years | 12 (2.0%) | 24 (3.4%) |
| 75 to 79 Years | 10 (1.6%) | 14 (1.9%) |
| 80 to 84 Years | 17 (2.8%) | 13 (1.8%) |
| 85 Years and over | 0 (0.0%) | 26 (3.6%) |
| Total | 612 (100.0%) | 717 (100.0%) |
Families and Households in Tower City borough
Median Family Size in Tower City borough
The median family size in Tower City borough is 3.28 persons per family, with married-couple families (241 | 70.9%) accounting for the largest median family size of 3.46 persons per family. On the other hand, single male/father families (27 | 7.9%) represent the smallest median family size with 2.22 persons per family.
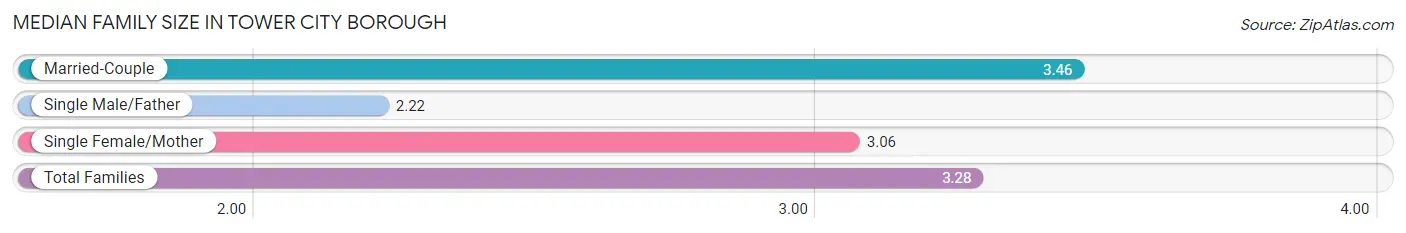
| Family Type | # Families | Family Size |
| Married-Couple | 241 (70.9%) | 3.46 |
| Single Male/Father | 27 (7.9%) | 2.22 |
| Single Female/Mother | 72 (21.2%) | 3.06 |
| Total Families | 340 (100.0%) | 3.28 |
Median Household Size in Tower City borough
The median household size in Tower City borough is 2.72 persons per household, with married-couple households (241 | 49.4%) accounting for the largest median household size of 3.51 persons per household. non-family households (148 | 30.3%) represent the smallest median household size with 1.22 persons per household.
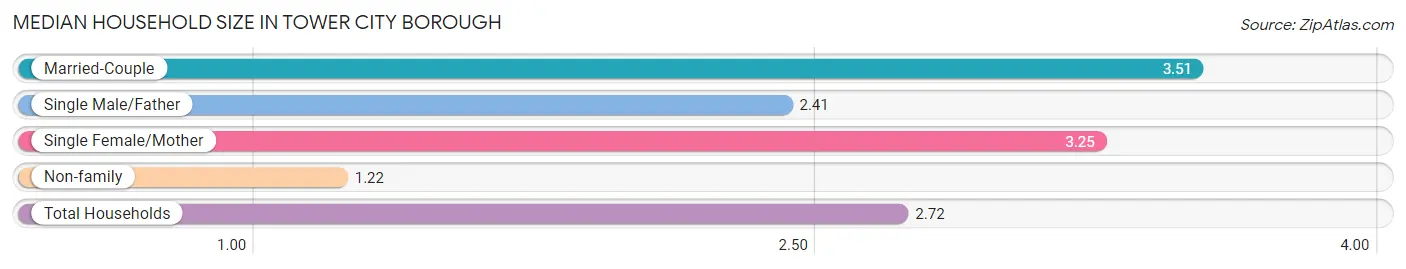
| Household Type | # Households | Household Size |
| Married-Couple | 241 (49.4%) | 3.51 |
| Single Male/Father | 27 (5.5%) | 2.41 |
| Single Female/Mother | 72 (14.7%) | 3.25 |
| Non-family | 148 (30.3%) | 1.22 |
| Total Households | 488 (100.0%) | 2.72 |
Household Size by Marriage Status in Tower City borough
Out of a total of 488 households in Tower City borough, 340 (69.7%) are family households, while 148 (30.3%) are nonfamily households. The most numerous type of family households are 2-person households, comprising 143, and the most common type of nonfamily households are 1-person households, comprising 125.
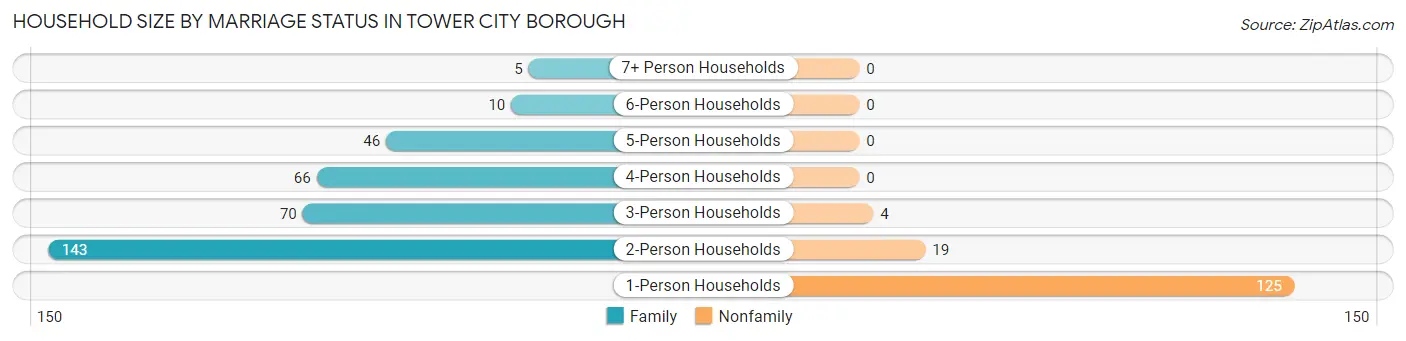
| Household Size | Family Households | Nonfamily Households |
| 1-Person Households | - | 125 (25.6%) |
| 2-Person Households | 143 (29.3%) | 19 (3.9%) |
| 3-Person Households | 70 (14.3%) | 4 (0.8%) |
| 4-Person Households | 66 (13.5%) | 0 (0.0%) |
| 5-Person Households | 46 (9.4%) | 0 (0.0%) |
| 6-Person Households | 10 (2.1%) | 0 (0.0%) |
| 7+ Person Households | 5 (1.0%) | 0 (0.0%) |
| Total | 340 (69.7%) | 148 (30.3%) |
Female Fertility in Tower City borough
Fertility by Age in Tower City borough
Average fertility rate in Tower City borough is 71.0 births per 1,000 women. Women in the age bracket of 35 to 50 years have the highest fertility rate with 88.0 births per 1,000 women. Women in the age bracket of 20 to 34 years acount for 50.0% of all women with births.
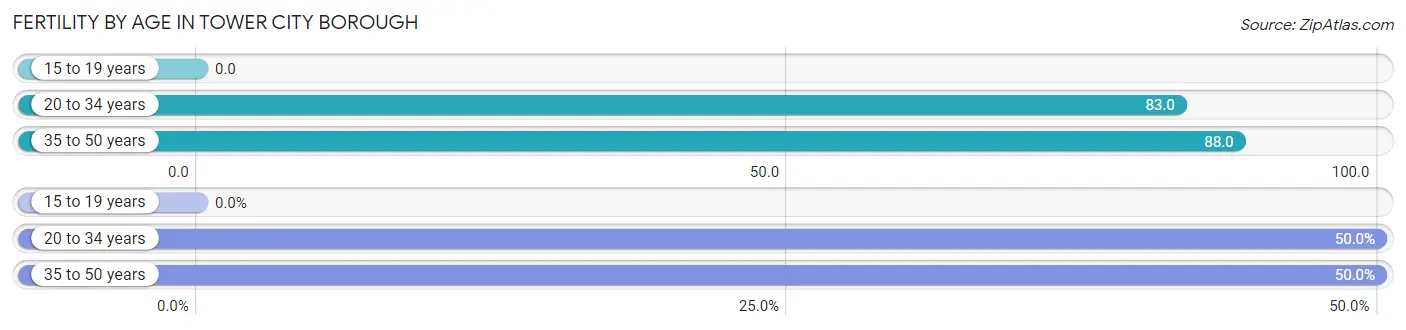
| Age Bracket | Women with Births | Births / 1,000 Women |
| 15 to 19 years | 0 (0.0%) | 0.0 |
| 20 to 34 years | 11 (50.0%) | 83.0 |
| 35 to 50 years | 11 (50.0%) | 88.0 |
| Total | 22 (100.0%) | 71.0 |
Fertility by Age by Marriage Status in Tower City borough
77.3% of women with births (22) in Tower City borough are married. The highest percentage of unmarried women with births falls into 20 to 34 years age bracket with 45.5% of them unmarried at the time of birth, while the lowest percentage of unmarried women with births belong to 35 to 50 years age bracket with 0.0% of them unmarried.
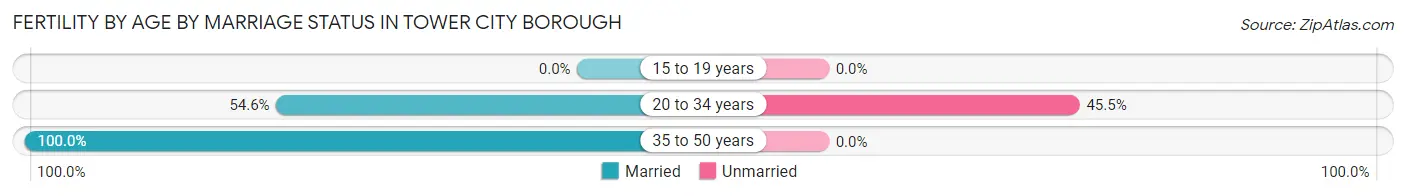
| Age Bracket | Married | Unmarried |
| 15 to 19 years | 0 (0.0%) | 0 (0.0%) |
| 20 to 34 years | 6 (54.5%) | 5 (45.5%) |
| 35 to 50 years | 11 (100.0%) | 0 (0.0%) |
| Total | 17 (77.3%) | 5 (22.7%) |
Fertility by Education in Tower City borough
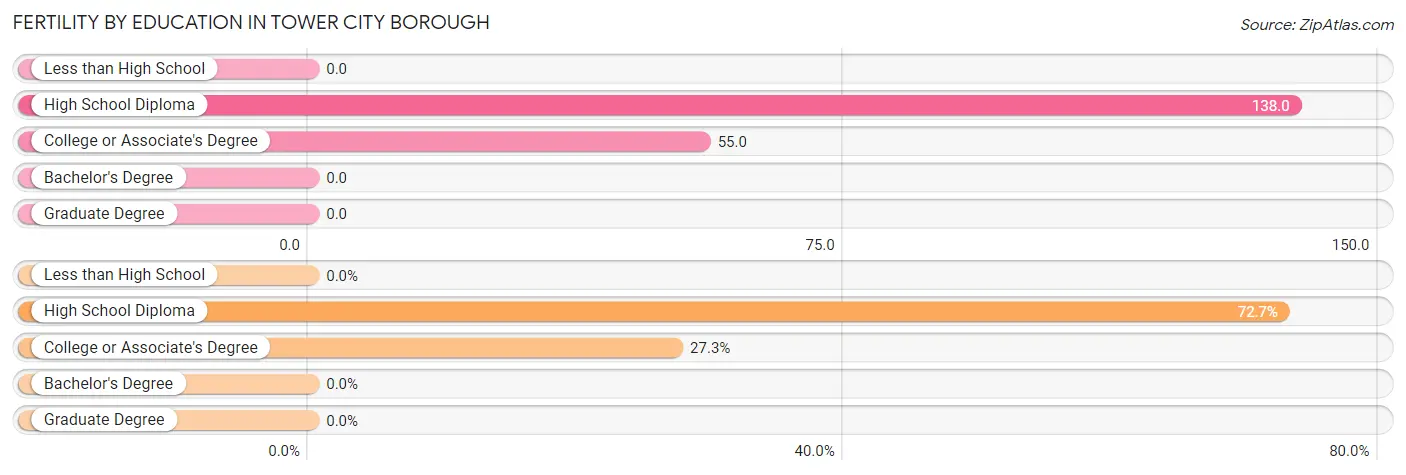
| Educational Attainment | Women with Births | Births / 1,000 Women |
| Less than High School | 0 (0.0%) | 0.0 |
| High School Diploma | 16 (72.7%) | 138.0 |
| College or Associate's Degree | 6 (27.3%) | 55.0 |
| Bachelor's Degree | 0 (0.0%) | 0.0 |
| Graduate Degree | 0 (0.0%) | 0.0 |
| Total | 22 (100.0%) | 71.0 |
Fertility by Education by Marriage Status in Tower City borough
22.7% of women with births in Tower City borough are unmarried. Women with the educational attainment of college or associate's degree are most likely to be married with 100.0% of them married at childbirth, while women with the educational attainment of high school diploma are least likely to be married with 31.2% of them unmarried at childbirth.
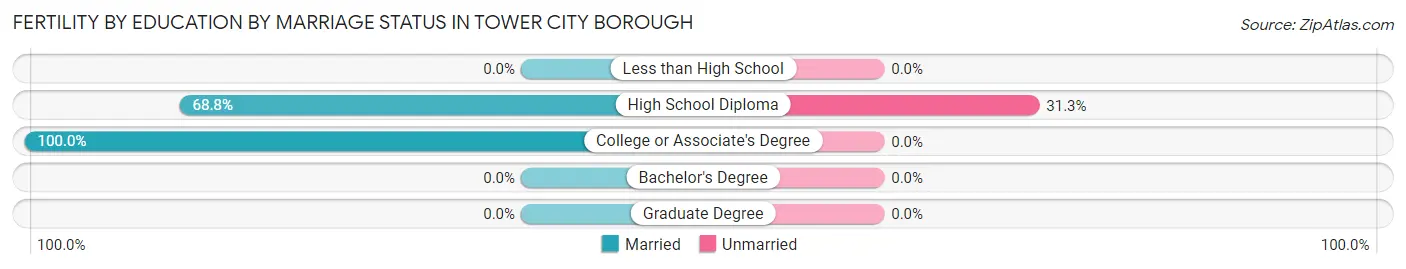
| Educational Attainment | Married | Unmarried |
| Less than High School | 0 (0.0%) | 0 (0.0%) |
| High School Diploma | 11 (68.8%) | 5 (31.2%) |
| College or Associate's Degree | 6 (100.0%) | 0 (0.0%) |
| Bachelor's Degree | 0 (0.0%) | 0 (0.0%) |
| Graduate Degree | 0 (0.0%) | 0 (0.0%) |
| Total | 17 (77.3%) | 5 (22.7%) |
Employment Characteristics in Tower City borough
Employment by Class of Employer in Tower City borough
Among the 638 employed individuals in Tower City borough, private company employees (458 | 71.8%), state government employees (69 | 10.8%), and federal government employees (36 | 5.6%) make up the most common classes of employment.
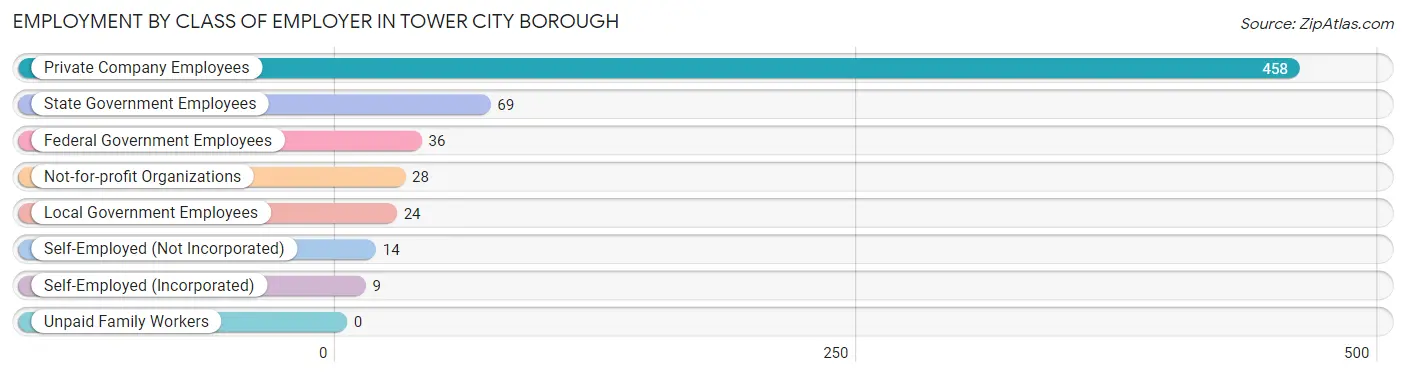
| Employer Class | # Employees | % Employees |
| Private Company Employees | 458 | 71.8% |
| Self-Employed (Incorporated) | 9 | 1.4% |
| Self-Employed (Not Incorporated) | 14 | 2.2% |
| Not-for-profit Organizations | 28 | 4.4% |
| Local Government Employees | 24 | 3.8% |
| State Government Employees | 69 | 10.8% |
| Federal Government Employees | 36 | 5.6% |
| Unpaid Family Workers | 0 | 0.0% |
| Total | 638 | 100.0% |
Employment Status by Age in Tower City borough
According to the labor force statistics for Tower City borough, out of the total population over 16 years of age (1,059), 63.6% or 674 individuals are in the labor force, with 4.8% or 32 of them unemployed. The age group with the highest labor force participation rate is 30 to 34 years, with 100.0% or 64 individuals in the labor force. Within the labor force, the 20 to 24 years age range has the highest percentage of unemployed individuals, with 13.0% or 12 of them being unemployed.
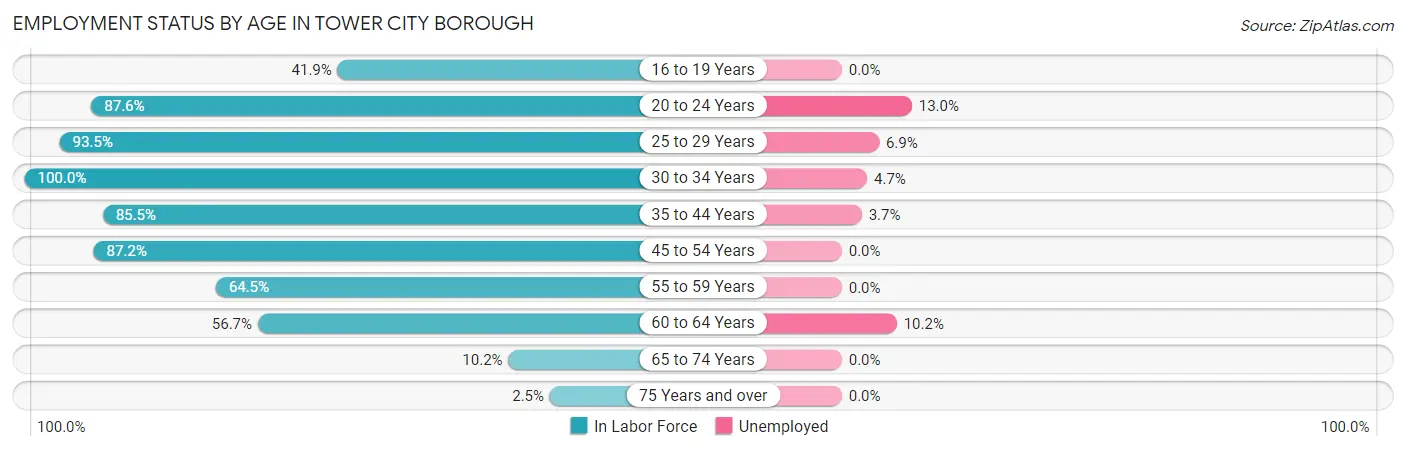
| Age Bracket | In Labor Force | Unemployed |
| 16 to 19 Years | 36 (41.9%) | 0 (0.0%) |
| 20 to 24 Years | 92 (87.6%) | 12 (13.0%) |
| 25 to 29 Years | 87 (93.5%) | 6 (6.9%) |
| 30 to 34 Years | 64 (100.0%) | 3 (4.7%) |
| 35 to 44 Years | 148 (85.5%) | 5 (3.7%) |
| 45 to 54 Years | 123 (87.2%) | 0 (0.0%) |
| 55 to 59 Years | 49 (64.5%) | 0 (0.0%) |
| 60 to 64 Years | 59 (56.7%) | 6 (10.2%) |
| 65 to 74 Years | 14 (10.2%) | 0 (0.0%) |
| 75 Years and over | 2 (2.5%) | 0 (0.0%) |
| Total | 674 (63.6%) | 32 (4.8%) |
Employment Status by Educational Attainment in Tower City borough
According to labor force statistics for Tower City borough, 81.4% of individuals (530) out of the total population between 25 and 64 years of age (651) are in the labor force, with 3.9% or 21 of them being unemployed. The group with the highest labor force participation rate are those with the educational attainment of bachelor's degree or higher, with 89.0% or 81 individuals in the labor force. Within the labor force, individuals with less than high school education have the highest percentage of unemployment, with 34.4% or 11 of them being unemployed.
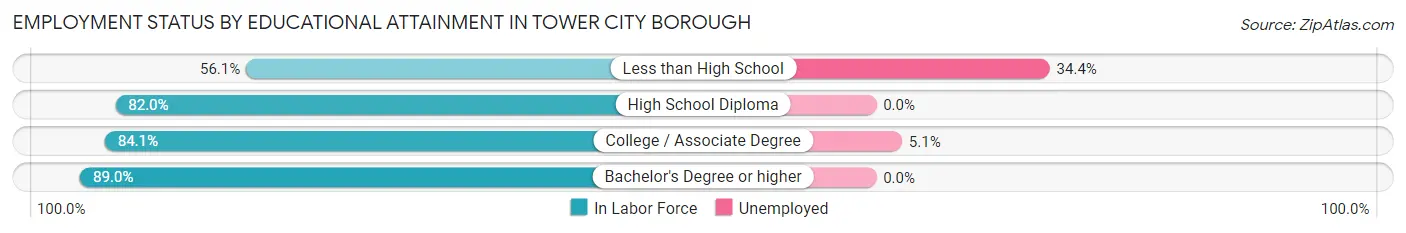
| Educational Attainment | In Labor Force | Unemployed |
| Less than High School | 32 (56.1%) | 20 (34.4%) |
| High School Diploma | 242 (82.0%) | 0 (0.0%) |
| College / Associate Degree | 175 (84.1%) | 11 (5.1%) |
| Bachelor's Degree or higher | 81 (89.0%) | 0 (0.0%) |
| Total | 530 (81.4%) | 25 (3.9%) |
Employment Occupations by Sex in Tower City borough
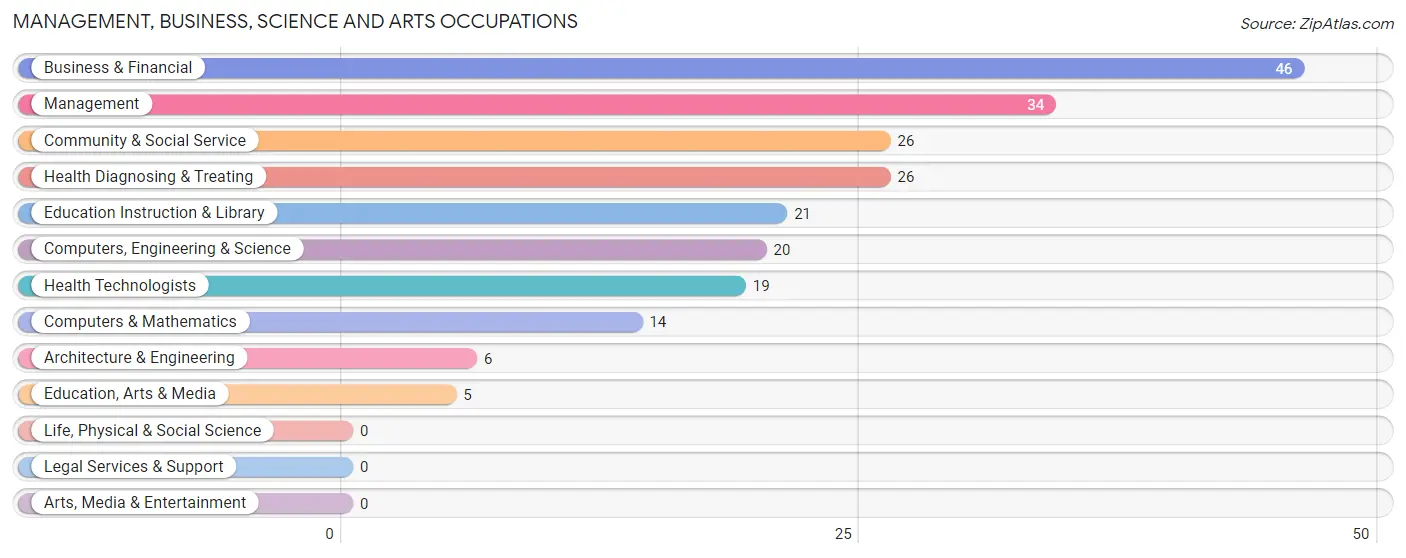
Management, Business, Science and Arts Occupations
The most common Management, Business, Science and Arts occupations in Tower City borough are Business & Financial (46 | 7.3%), Management (34 | 5.4%), Community & Social Service (26 | 4.1%), Health Diagnosing & Treating (26 | 4.1%), and Education Instruction & Library (21 | 3.3%).
Management, Business, Science and Arts Occupations by Sex
Within the Management, Business, Science and Arts occupations in Tower City borough, the most male-oriented occupations are Architecture & Engineering (100.0%), Management (76.5%), and Education Instruction & Library (42.9%), while the most female-oriented occupations are Computers & Mathematics (100.0%), Business & Financial (89.1%), and Health Diagnosing & Treating (88.5%).
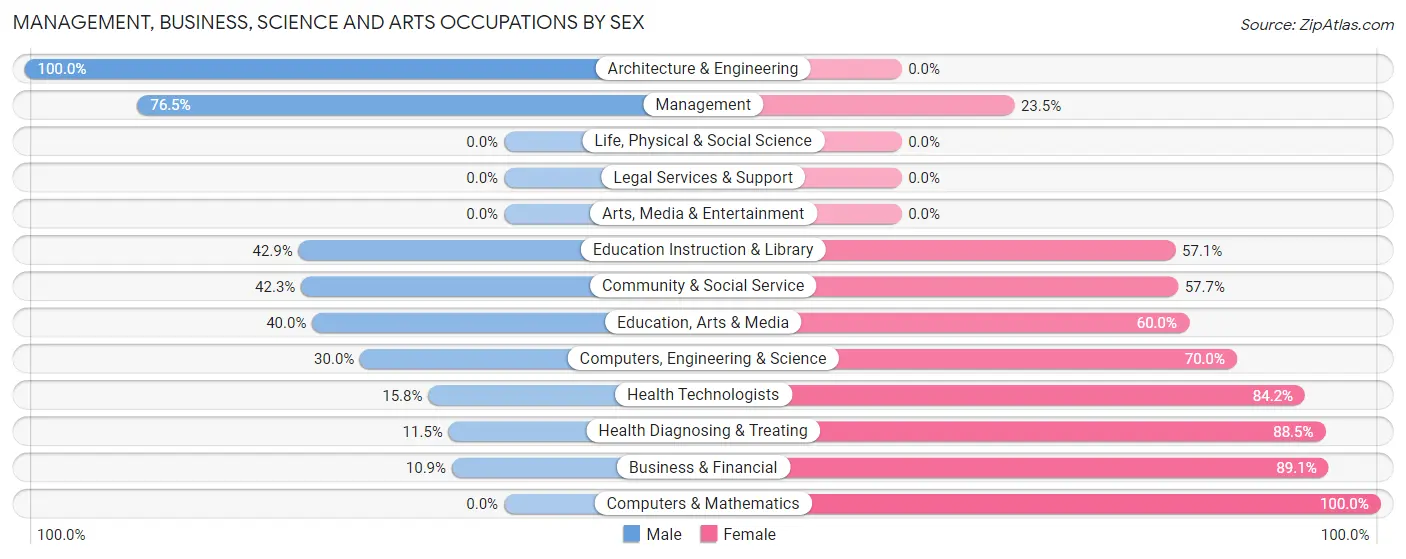
| Occupation | Male | Female |
| Management | 26 (76.5%) | 8 (23.5%) |
| Business & Financial | 5 (10.9%) | 41 (89.1%) |
| Computers, Engineering & Science | 6 (30.0%) | 14 (70.0%) |
| Computers & Mathematics | 0 (0.0%) | 14 (100.0%) |
| Architecture & Engineering | 6 (100.0%) | 0 (0.0%) |
| Life, Physical & Social Science | 0 (0.0%) | 0 (0.0%) |
| Community & Social Service | 11 (42.3%) | 15 (57.7%) |
| Education, Arts & Media | 2 (40.0%) | 3 (60.0%) |
| Legal Services & Support | 0 (0.0%) | 0 (0.0%) |
| Education Instruction & Library | 9 (42.9%) | 12 (57.1%) |
| Arts, Media & Entertainment | 0 (0.0%) | 0 (0.0%) |
| Health Diagnosing & Treating | 3 (11.5%) | 23 (88.5%) |
| Health Technologists | 3 (15.8%) | 16 (84.2%) |
| Total (Category) | 51 (33.6%) | 101 (66.4%) |
| Total (Overall) | 330 (52.5%) | 298 (47.4%) |
Services Occupations
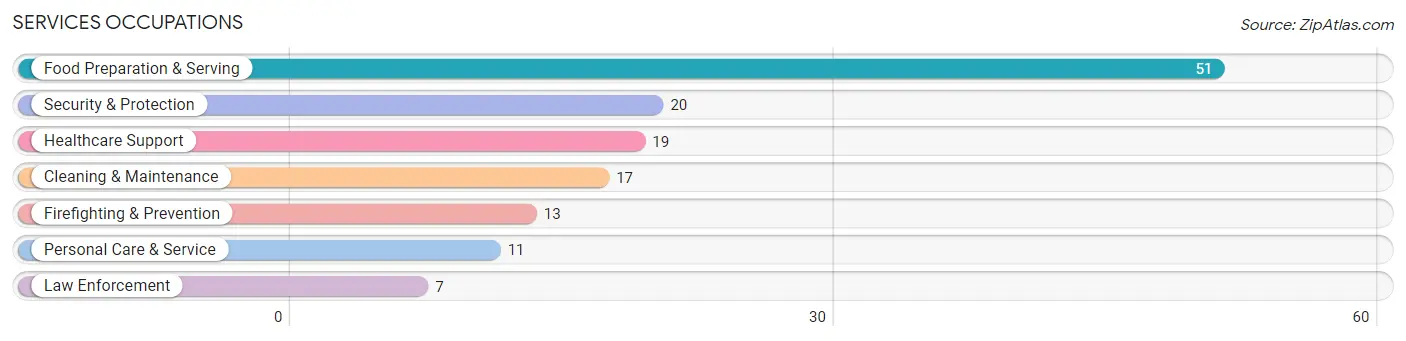
The most common Services occupations in Tower City borough are Food Preparation & Serving (51 | 8.1%), Security & Protection (20 | 3.2%), Healthcare Support (19 | 3.0%), Cleaning & Maintenance (17 | 2.7%), and Firefighting & Prevention (13 | 2.1%).
Services Occupations by Sex
Within the Services occupations in Tower City borough, the most male-oriented occupations are Law Enforcement (100.0%), Cleaning & Maintenance (76.5%), and Security & Protection (75.0%), while the most female-oriented occupations are Healthcare Support (100.0%), Personal Care & Service (100.0%), and Food Preparation & Serving (70.6%).
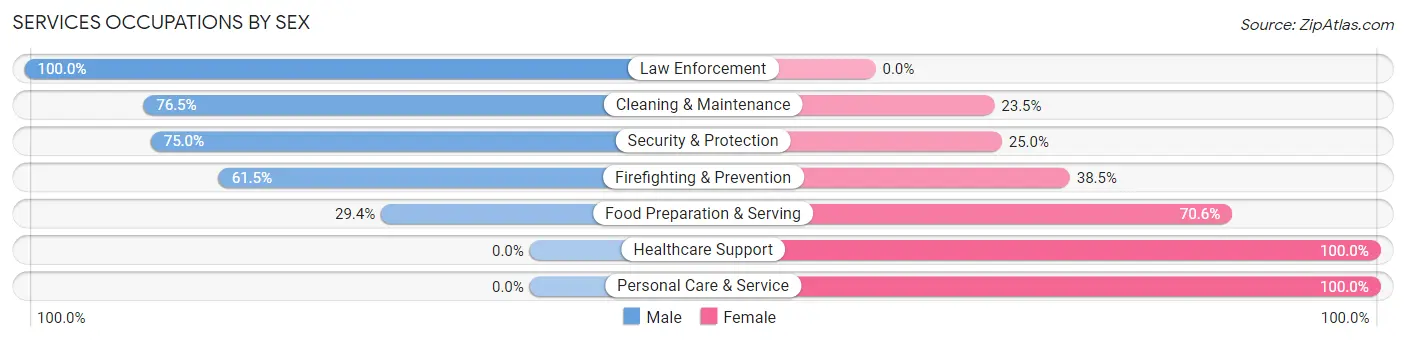
| Occupation | Male | Female |
| Healthcare Support | 0 (0.0%) | 19 (100.0%) |
| Security & Protection | 15 (75.0%) | 5 (25.0%) |
| Firefighting & Prevention | 8 (61.5%) | 5 (38.5%) |
| Law Enforcement | 7 (100.0%) | 0 (0.0%) |
| Food Preparation & Serving | 15 (29.4%) | 36 (70.6%) |
| Cleaning & Maintenance | 13 (76.5%) | 4 (23.5%) |
| Personal Care & Service | 0 (0.0%) | 11 (100.0%) |
| Total (Category) | 43 (36.4%) | 75 (63.6%) |
| Total (Overall) | 330 (52.5%) | 298 (47.4%) |
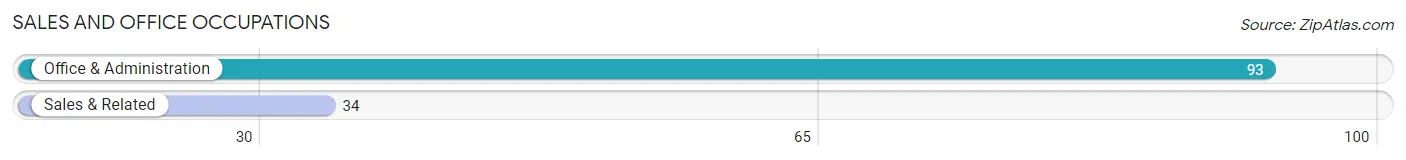
Sales and Office Occupations
The most common Sales and Office occupations in Tower City borough are Office & Administration (93 | 14.8%), and Sales & Related (34 | 5.4%).
Sales and Office Occupations by Sex
| Occupation | Male | Female |
| Sales & Related | 12 (35.3%) | 22 (64.7%) |
| Office & Administration | 14 (15.0%) | 79 (85.0%) |
| Total (Category) | 26 (20.5%) | 101 (79.5%) |
| Total (Overall) | 330 (52.5%) | 298 (47.4%) |
Natural Resources, Construction and Maintenance Occupations
The most common Natural Resources, Construction and Maintenance occupations in Tower City borough are Construction & Extraction (37 | 5.9%), and Installation, Maintenance & Repair (37 | 5.9%).
Natural Resources, Construction and Maintenance Occupations by Sex
| Occupation | Male | Female |
| Farming, Fishing & Forestry | 0 (0.0%) | 0 (0.0%) |
| Construction & Extraction | 37 (100.0%) | 0 (0.0%) |
| Installation, Maintenance & Repair | 34 (91.9%) | 3 (8.1%) |
| Total (Category) | 71 (96.0%) | 3 (4.1%) |
| Total (Overall) | 330 (52.5%) | 298 (47.4%) |
Production, Transportation and Moving Occupations
The most common Production, Transportation and Moving occupations in Tower City borough are Production (89 | 14.2%), Material Moving (38 | 6.0%), and Transportation (30 | 4.8%).
Production, Transportation and Moving Occupations by Sex
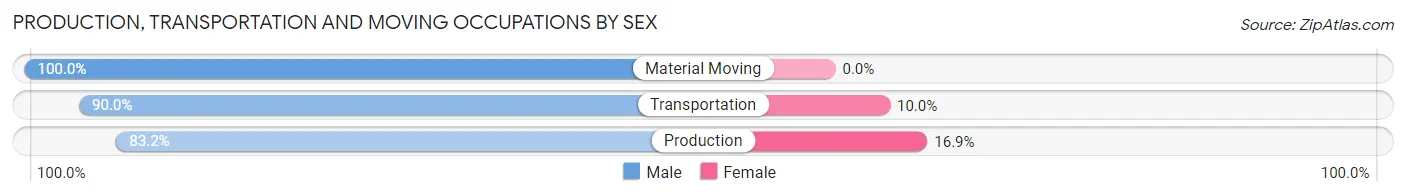
| Occupation | Male | Female |
| Production | 74 (83.2%) | 15 (16.9%) |
| Transportation | 27 (90.0%) | 3 (10.0%) |
| Material Moving | 38 (100.0%) | 0 (0.0%) |
| Total (Category) | 139 (88.5%) | 18 (11.5%) |
| Total (Overall) | 330 (52.5%) | 298 (47.4%) |
Employment Industries by Sex in Tower City borough
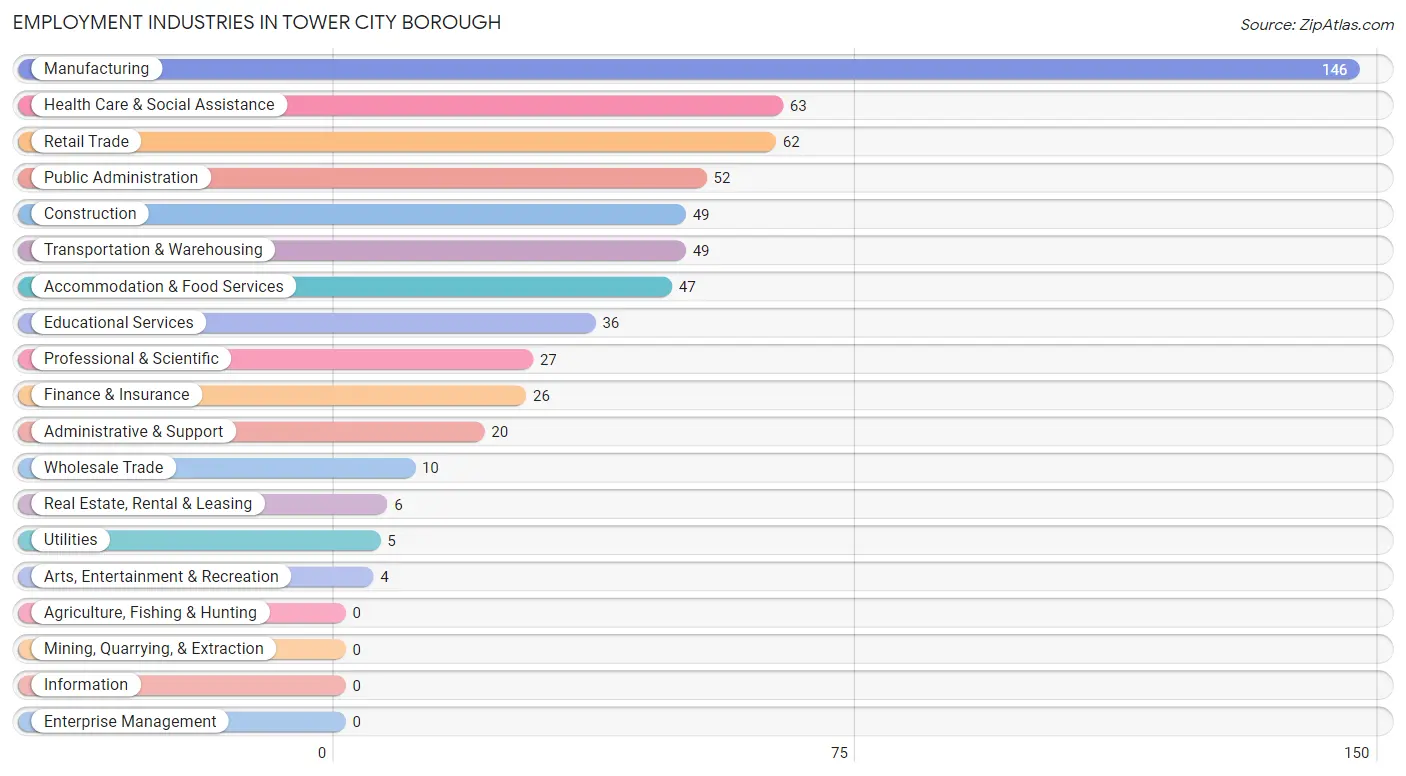
Employment Industries in Tower City borough
The major employment industries in Tower City borough include Manufacturing (146 | 23.3%), Health Care & Social Assistance (63 | 10.0%), Retail Trade (62 | 9.9%), Public Administration (52 | 8.3%), and Construction (49 | 7.8%).
Employment Industries by Sex in Tower City borough
The Tower City borough industries that see more men than women are Construction (100.0%), Wholesale Trade (100.0%), and Utilities (100.0%), whereas the industries that tend to have a higher number of women are Finance & Insurance (100.0%), Professional & Scientific (100.0%), and Health Care & Social Assistance (95.2%).
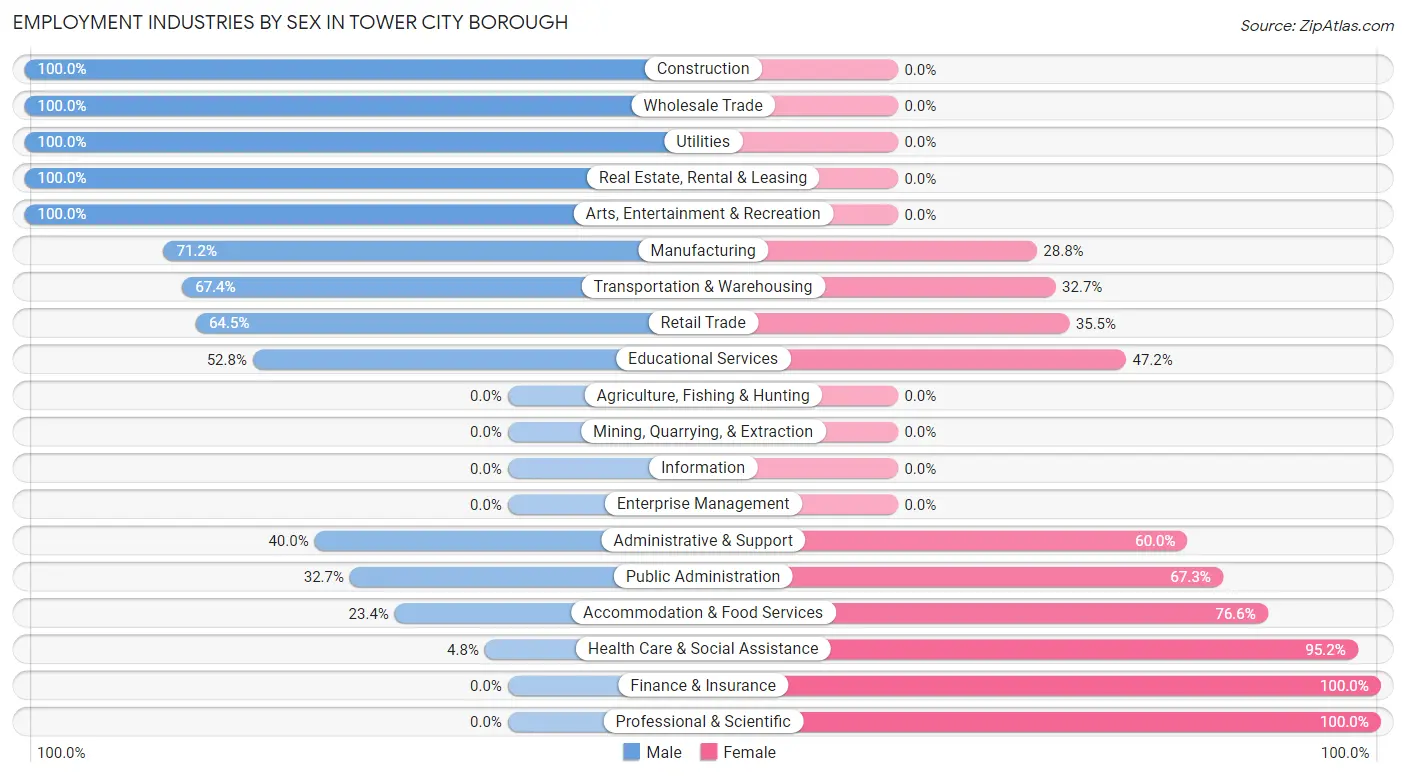
| Industry | Male | Female |
| Agriculture, Fishing & Hunting | 0 (0.0%) | 0 (0.0%) |
| Mining, Quarrying, & Extraction | 0 (0.0%) | 0 (0.0%) |
| Construction | 49 (100.0%) | 0 (0.0%) |
| Manufacturing | 104 (71.2%) | 42 (28.8%) |
| Wholesale Trade | 10 (100.0%) | 0 (0.0%) |
| Retail Trade | 40 (64.5%) | 22 (35.5%) |
| Transportation & Warehousing | 33 (67.3%) | 16 (32.7%) |
| Utilities | 5 (100.0%) | 0 (0.0%) |
| Information | 0 (0.0%) | 0 (0.0%) |
| Finance & Insurance | 0 (0.0%) | 26 (100.0%) |
| Real Estate, Rental & Leasing | 6 (100.0%) | 0 (0.0%) |
| Professional & Scientific | 0 (0.0%) | 27 (100.0%) |
| Enterprise Management | 0 (0.0%) | 0 (0.0%) |
| Administrative & Support | 8 (40.0%) | 12 (60.0%) |
| Educational Services | 19 (52.8%) | 17 (47.2%) |
| Health Care & Social Assistance | 3 (4.8%) | 60 (95.2%) |
| Arts, Entertainment & Recreation | 4 (100.0%) | 0 (0.0%) |
| Accommodation & Food Services | 11 (23.4%) | 36 (76.6%) |
| Public Administration | 17 (32.7%) | 35 (67.3%) |
| Total | 330 (52.5%) | 298 (47.4%) |
Education in Tower City borough
School Enrollment in Tower City borough
The most common levels of schooling among the 291 students in Tower City borough are middle school (90 | 30.9%), high school (89 | 30.6%), and elementary school (55 | 18.9%).
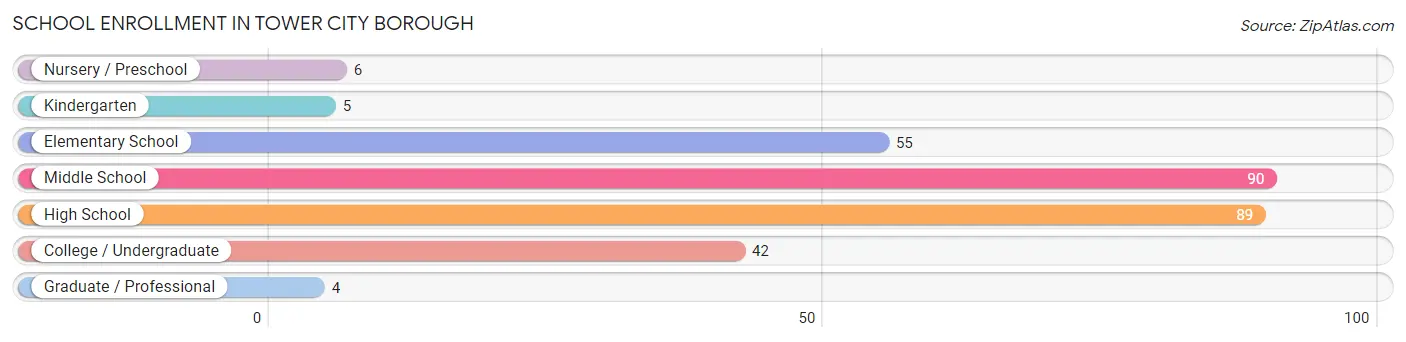
| School Level | # Students | % Students |
| Nursery / Preschool | 6 | 2.1% |
| Kindergarten | 5 | 1.7% |
| Elementary School | 55 | 18.9% |
| Middle School | 90 | 30.9% |
| High School | 89 | 30.6% |
| College / Undergraduate | 42 | 14.4% |
| Graduate / Professional | 4 | 1.4% |
| Total | 291 | 100.0% |
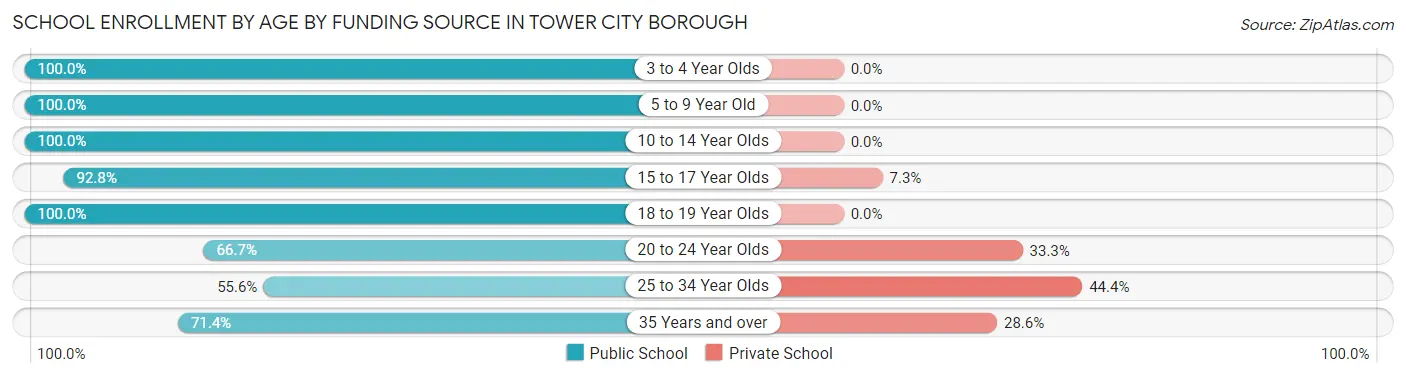
School Enrollment by Age by Funding Source in Tower City borough
Out of a total of 291 students who are enrolled in schools in Tower City borough, 16 (5.5%) attend a private institution, while the remaining 275 (94.5%) are enrolled in public schools. The age group of 25 to 34 year olds has the highest likelihood of being enrolled in private schools, with 4 (44.4% in the age bracket) enrolled. Conversely, the age group of 3 to 4 year olds has the lowest likelihood of being enrolled in a private school, with 6 (100.0% in the age bracket) attending a public institution.
| Age Bracket | Public School | Private School |
| 3 to 4 Year Olds | 6 (100.0%) | 0 (0.0%) |
| 5 to 9 Year Old | 60 (100.0%) | 0 (0.0%) |
| 10 to 14 Year Olds | 97 (100.0%) | 0 (0.0%) |
| 15 to 17 Year Olds | 64 (92.7%) | 5 (7.2%) |
| 18 to 19 Year Olds | 28 (100.0%) | 0 (0.0%) |
| 20 to 24 Year Olds | 10 (66.7%) | 5 (33.3%) |
| 25 to 34 Year Olds | 5 (55.6%) | 4 (44.4%) |
| 35 Years and over | 5 (71.4%) | 2 (28.6%) |
| Total | 275 (94.5%) | 16 (5.5%) |
Educational Attainment by Field of Study in Tower City borough
Education (26 | 18.2%), arts & humanities (19 | 13.3%), bio, nature & agricultural (17 | 11.9%), psychology (17 | 11.9%), and science & technology (17 | 11.9%) are the most common fields of study among 143 individuals in Tower City borough who have obtained a bachelor's degree or higher.
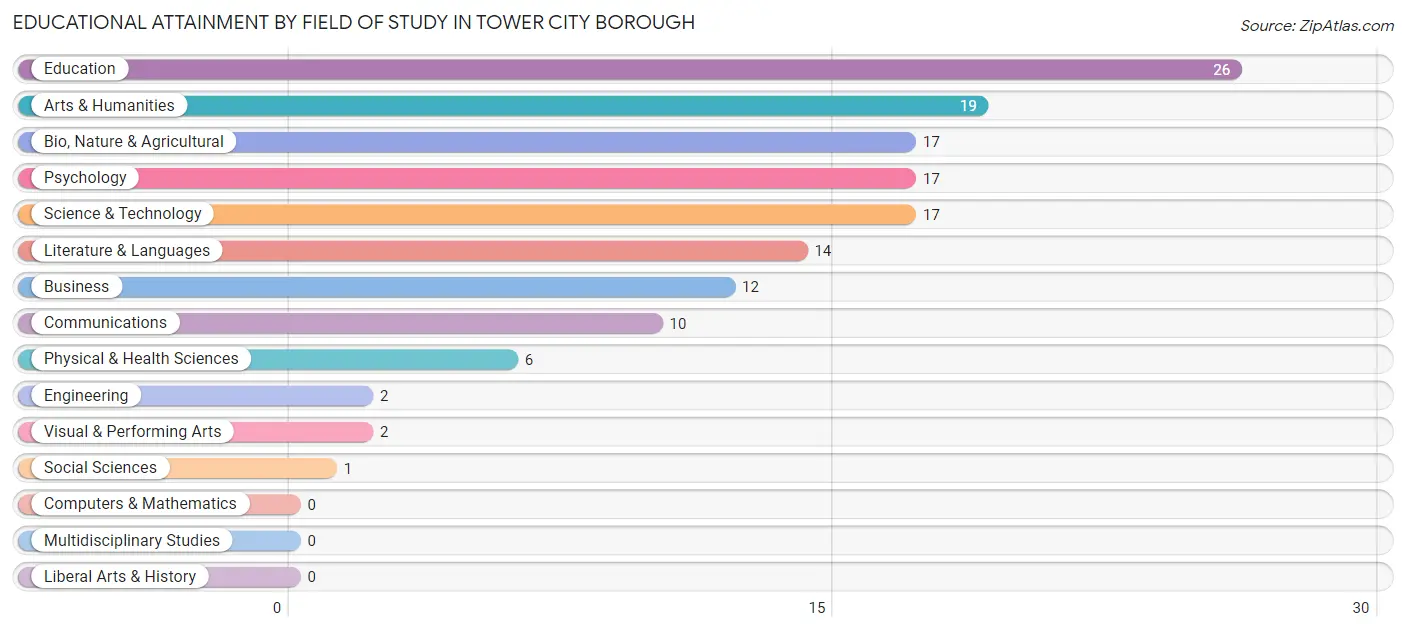
| Field of Study | # Graduates | % Graduates |
| Computers & Mathematics | 0 | 0.0% |
| Bio, Nature & Agricultural | 17 | 11.9% |
| Physical & Health Sciences | 6 | 4.2% |
| Psychology | 17 | 11.9% |
| Social Sciences | 1 | 0.7% |
| Engineering | 2 | 1.4% |
| Multidisciplinary Studies | 0 | 0.0% |
| Science & Technology | 17 | 11.9% |
| Business | 12 | 8.4% |
| Education | 26 | 18.2% |
| Literature & Languages | 14 | 9.8% |
| Liberal Arts & History | 0 | 0.0% |
| Visual & Performing Arts | 2 | 1.4% |
| Communications | 10 | 7.0% |
| Arts & Humanities | 19 | 13.3% |
| Total | 143 | 100.0% |
Transportation & Commute in Tower City borough
Vehicle Availability by Sex in Tower City borough
The most prevalent vehicle ownership categories in Tower City borough are males with 2 vehicles (129, accounting for 38.2%) and females with 2 vehicles (142, making up 43.0%).
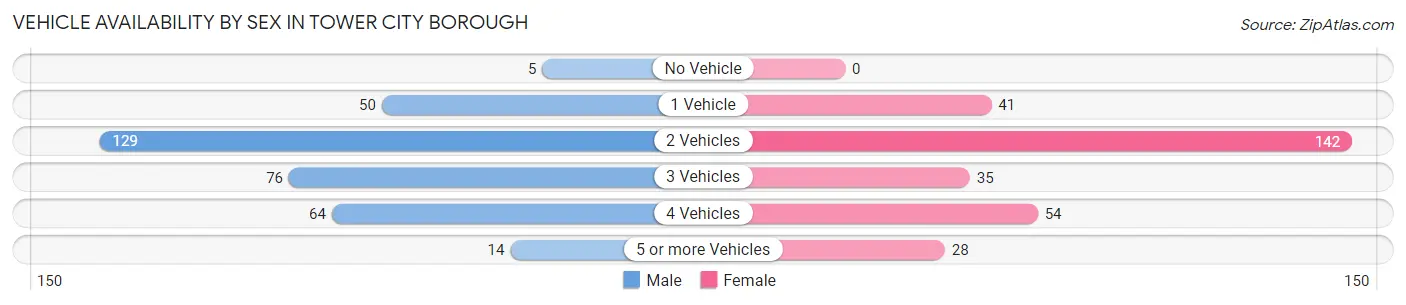
| Vehicles Available | Male | Female |
| No Vehicle | 5 (1.5%) | 0 (0.0%) |
| 1 Vehicle | 50 (14.8%) | 41 (13.7%) |
| 2 Vehicles | 129 (38.2%) | 142 (47.3%) |
| 3 Vehicles | 76 (22.5%) | 35 (11.7%) |
| 4 Vehicles | 64 (18.9%) | 54 (18.0%) |
| 5 or more Vehicles | 14 (4.1%) | 28 (9.3%) |
| Total | 338 (100.0%) | 300 (100.0%) |
Commute Time in Tower City borough
The most frequently occuring commute durations in Tower City borough are 60 to 89 minutes (83 commuters, 14.7%), 20 to 24 minutes (68 commuters, 12.0%), and 30 to 34 minutes (65 commuters, 11.5%).
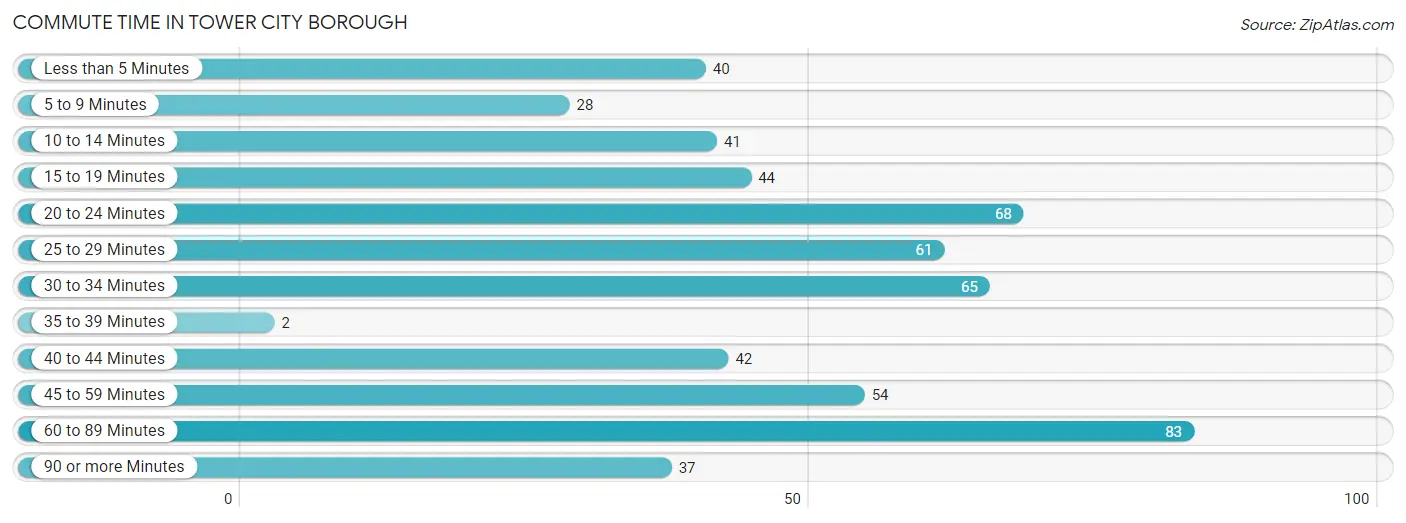
| Commute Time | # Commuters | % Commuters |
| Less than 5 Minutes | 40 | 7.1% |
| 5 to 9 Minutes | 28 | 5.0% |
| 10 to 14 Minutes | 41 | 7.3% |
| 15 to 19 Minutes | 44 | 7.8% |
| 20 to 24 Minutes | 68 | 12.0% |
| 25 to 29 Minutes | 61 | 10.8% |
| 30 to 34 Minutes | 65 | 11.5% |
| 35 to 39 Minutes | 2 | 0.4% |
| 40 to 44 Minutes | 42 | 7.4% |
| 45 to 59 Minutes | 54 | 9.6% |
| 60 to 89 Minutes | 83 | 14.7% |
| 90 or more Minutes | 37 | 6.6% |
Commute Time by Sex in Tower City borough
The most common commute times in Tower City borough are 60 to 89 minutes (69 commuters, 20.5%) for males and 20 to 24 minutes (33 commuters, 14.4%) for females.
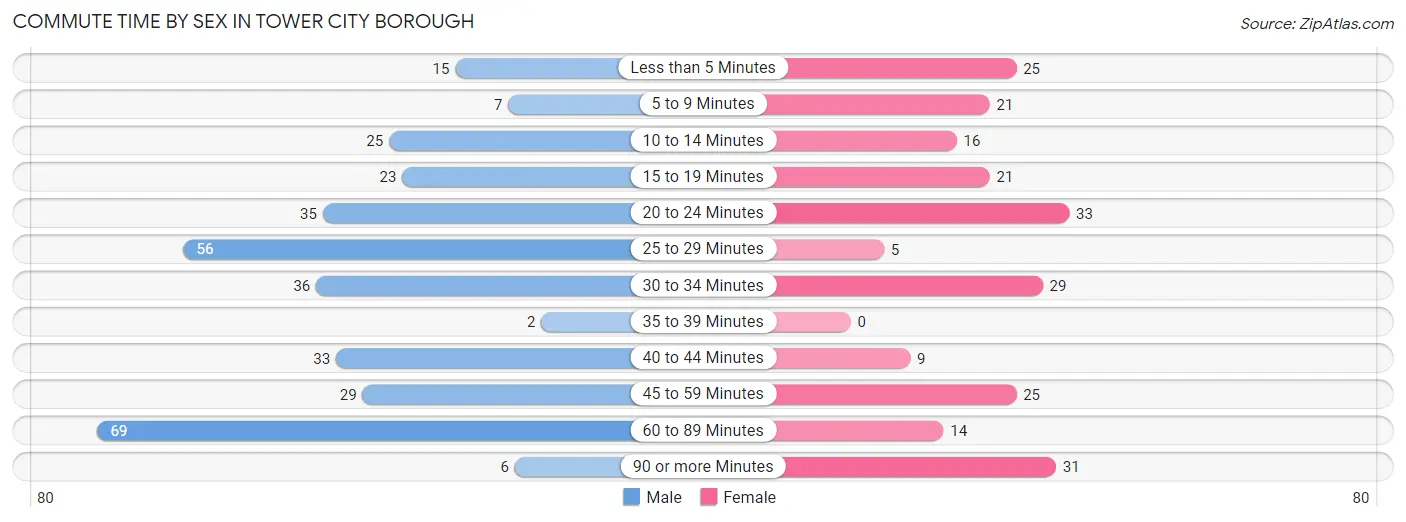
| Commute Time | Male | Female |
| Less than 5 Minutes | 15 (4.5%) | 25 (10.9%) |
| 5 to 9 Minutes | 7 (2.1%) | 21 (9.2%) |
| 10 to 14 Minutes | 25 (7.4%) | 16 (7.0%) |
| 15 to 19 Minutes | 23 (6.9%) | 21 (9.2%) |
| 20 to 24 Minutes | 35 (10.4%) | 33 (14.4%) |
| 25 to 29 Minutes | 56 (16.7%) | 5 (2.2%) |
| 30 to 34 Minutes | 36 (10.7%) | 29 (12.7%) |
| 35 to 39 Minutes | 2 (0.6%) | 0 (0.0%) |
| 40 to 44 Minutes | 33 (9.8%) | 9 (3.9%) |
| 45 to 59 Minutes | 29 (8.6%) | 25 (10.9%) |
| 60 to 89 Minutes | 69 (20.5%) | 14 (6.1%) |
| 90 or more Minutes | 6 (1.8%) | 31 (13.5%) |
Time of Departure to Work by Sex in Tower City borough
The most frequent times of departure to work in Tower City borough are 5:30 AM to 5:59 AM (57, 17.0%) for males and 6:30 AM to 6:59 AM (37, 16.2%) for females.
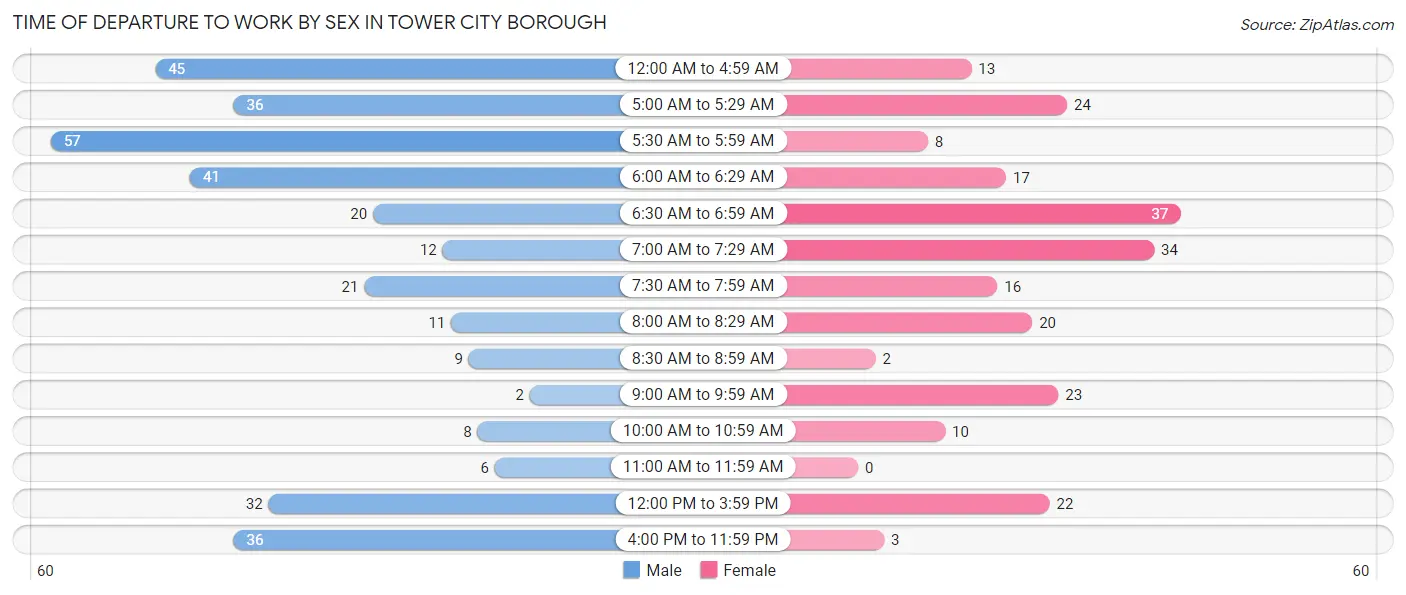
| Time of Departure | Male | Female |
| 12:00 AM to 4:59 AM | 45 (13.4%) | 13 (5.7%) |
| 5:00 AM to 5:29 AM | 36 (10.7%) | 24 (10.5%) |
| 5:30 AM to 5:59 AM | 57 (17.0%) | 8 (3.5%) |
| 6:00 AM to 6:29 AM | 41 (12.2%) | 17 (7.4%) |
| 6:30 AM to 6:59 AM | 20 (5.9%) | 37 (16.2%) |
| 7:00 AM to 7:29 AM | 12 (3.6%) | 34 (14.8%) |
| 7:30 AM to 7:59 AM | 21 (6.2%) | 16 (7.0%) |
| 8:00 AM to 8:29 AM | 11 (3.3%) | 20 (8.7%) |
| 8:30 AM to 8:59 AM | 9 (2.7%) | 2 (0.9%) |
| 9:00 AM to 9:59 AM | 2 (0.6%) | 23 (10.0%) |
| 10:00 AM to 10:59 AM | 8 (2.4%) | 10 (4.4%) |
| 11:00 AM to 11:59 AM | 6 (1.8%) | 0 (0.0%) |
| 12:00 PM to 3:59 PM | 32 (9.5%) | 22 (9.6%) |
| 4:00 PM to 11:59 PM | 36 (10.7%) | 3 (1.3%) |
| Total | 336 (100.0%) | 229 (100.0%) |
Housing Occupancy in Tower City borough
Occupancy by Ownership in Tower City borough
Of the total 488 dwellings in Tower City borough, owner-occupied units account for 362 (74.2%), while renter-occupied units make up 126 (25.8%).
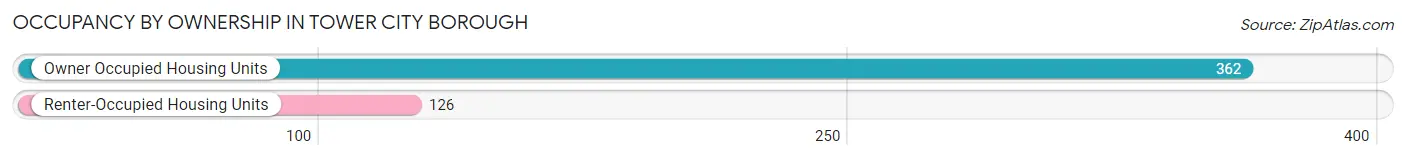
| Occupancy | # Housing Units | % Housing Units |
| Owner Occupied Housing Units | 362 | 74.2% |
| Renter-Occupied Housing Units | 126 | 25.8% |
| Total Occupied Housing Units | 488 | 100.0% |
Occupancy by Household Size in Tower City borough
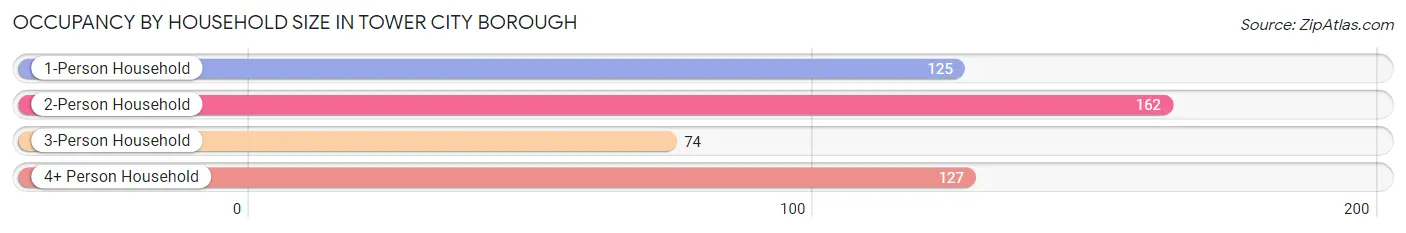
| Household Size | # Housing Units | % Housing Units |
| 1-Person Household | 125 | 25.6% |
| 2-Person Household | 162 | 33.2% |
| 3-Person Household | 74 | 15.2% |
| 4+ Person Household | 127 | 26.0% |
| Total Housing Units | 488 | 100.0% |
Occupancy by Ownership by Household Size in Tower City borough
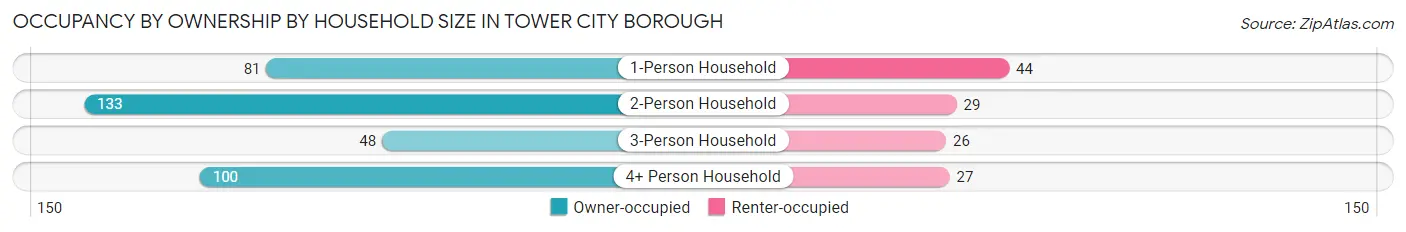
| Household Size | Owner-occupied | Renter-occupied |
| 1-Person Household | 81 (64.8%) | 44 (35.2%) |
| 2-Person Household | 133 (82.1%) | 29 (17.9%) |
| 3-Person Household | 48 (64.9%) | 26 (35.1%) |
| 4+ Person Household | 100 (78.7%) | 27 (21.3%) |
| Total Housing Units | 362 (74.2%) | 126 (25.8%) |
Occupancy by Educational Attainment in Tower City borough
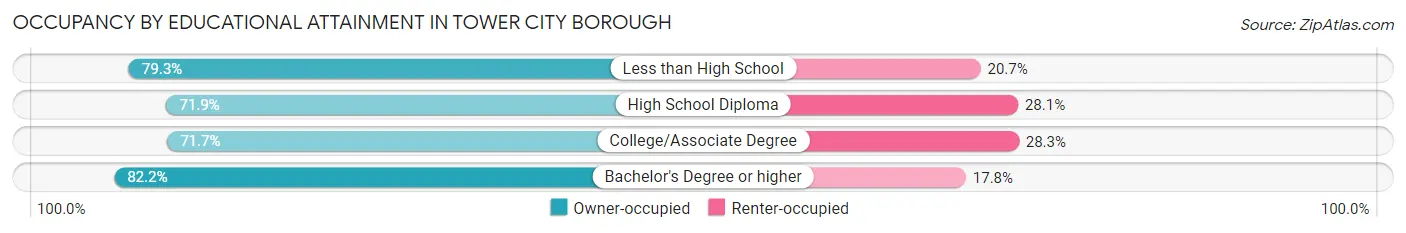
| Household Size | Owner-occupied | Renter-occupied |
| Less than High School | 23 (79.3%) | 6 (20.7%) |
| High School Diploma | 161 (71.9%) | 63 (28.1%) |
| College/Associate Degree | 104 (71.7%) | 41 (28.3%) |
| Bachelor's Degree or higher | 74 (82.2%) | 16 (17.8%) |
Occupancy by Age of Householder in Tower City borough
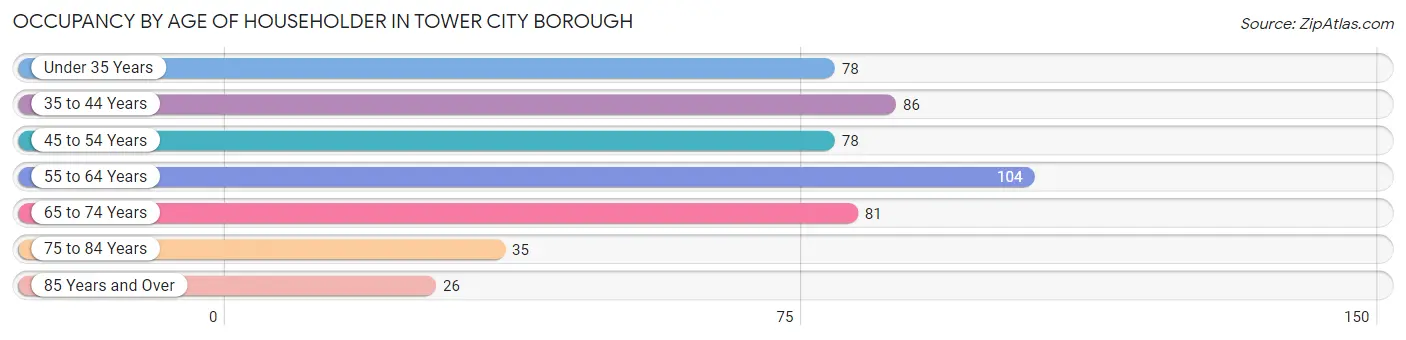
| Age Bracket | # Households | % Households |
| Under 35 Years | 78 | 16.0% |
| 35 to 44 Years | 86 | 17.6% |
| 45 to 54 Years | 78 | 16.0% |
| 55 to 64 Years | 104 | 21.3% |
| 65 to 74 Years | 81 | 16.6% |
| 75 to 84 Years | 35 | 7.2% |
| 85 Years and Over | 26 | 5.3% |
| Total | 488 | 100.0% |
Housing Finances in Tower City borough
Median Income by Occupancy in Tower City borough
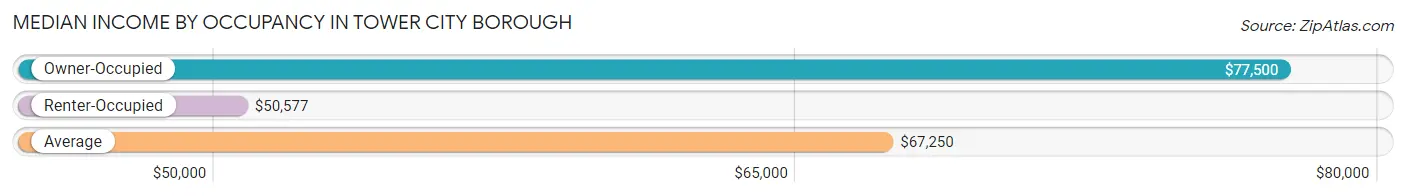
| Occupancy Type | # Households | Median Income |
| Owner-Occupied | 362 (74.2%) | $77,500 |
| Renter-Occupied | 126 (25.8%) | $50,577 |
| Average | 488 (100.0%) | $67,250 |
Occupancy by Householder Income Bracket in Tower City borough
| Income Bracket | Owner-occupied | Renter-occupied |
| Less than $5,000 | 8 (2.2%) | 3 (2.4%) |
| $5,000 to $9,999 | 3 (0.8%) | 0 (0.0%) |
| $10,000 to $14,999 | 3 (0.8%) | 5 (4.0%) |
| $15,000 to $19,999 | 27 (7.5%) | 0 (0.0%) |
| $20,000 to $24,999 | 4 (1.1%) | 13 (10.3%) |
| $25,000 to $34,999 | 31 (8.6%) | 20 (15.9%) |
| $35,000 to $49,999 | 24 (6.6%) | 19 (15.1%) |
| $50,000 to $74,999 | 72 (19.9%) | 45 (35.7%) |
| $75,000 to $99,999 | 76 (21.0%) | 5 (4.0%) |
| $100,000 to $149,999 | 84 (23.2%) | 16 (12.7%) |
| $150,000 or more | 30 (8.3%) | 0 (0.0%) |
| Total | 362 (100.0%) | 126 (100.0%) |
Monthly Housing Cost Tiers in Tower City borough
| Monthly Cost | Owner-occupied | Renter-occupied |
| Less than $300 | 11 (3.0%) | 0 (0.0%) |
| $300 to $499 | 60 (16.6%) | 0 (0.0%) |
| $500 to $799 | 111 (30.7%) | 35 (27.8%) |
| $800 to $999 | 48 (13.3%) | 44 (34.9%) |
| $1,000 to $1,499 | 78 (21.5%) | 40 (31.8%) |
| $1,500 to $1,999 | 35 (9.7%) | 0 (0.0%) |
| $2,000 to $2,499 | 15 (4.1%) | 0 (0.0%) |
| $2,500 to $2,999 | 0 (0.0%) | 0 (0.0%) |
| $3,000 or more | 4 (1.1%) | 0 (0.0%) |
| Total | 362 (100.0%) | 126 (100.0%) |
Physical Housing Characteristics in Tower City borough
Housing Structures in Tower City borough
| Structure Type | # Housing Units | % Housing Units |
| Single Unit, Detached | 314 | 64.3% |
| Single Unit, Attached | 98 | 20.1% |
| 2 Unit Apartments | 18 | 3.7% |
| 3 or 4 Unit Apartments | 10 | 2.1% |
| 5 to 9 Unit Apartments | 20 | 4.1% |
| 10 or more Apartments | 6 | 1.2% |
| Mobile Home / Other | 22 | 4.5% |
| Total | 488 | 100.0% |
Housing Structures by Occupancy in Tower City borough
| Structure Type | Owner-occupied | Renter-occupied |
| Single Unit, Detached | 288 (91.7%) | 26 (8.3%) |
| Single Unit, Attached | 61 (62.2%) | 37 (37.8%) |
| 2 Unit Apartments | 2 (11.1%) | 16 (88.9%) |
| 3 or 4 Unit Apartments | 0 (0.0%) | 10 (100.0%) |
| 5 to 9 Unit Apartments | 0 (0.0%) | 20 (100.0%) |
| 10 or more Apartments | 0 (0.0%) | 6 (100.0%) |
| Mobile Home / Other | 11 (50.0%) | 11 (50.0%) |
| Total | 362 (74.2%) | 126 (25.8%) |
Housing Structures by Number of Rooms in Tower City borough
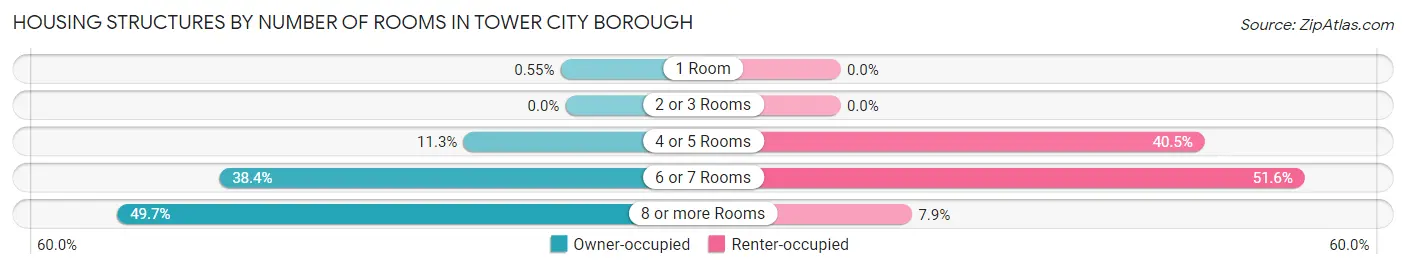
| Number of Rooms | Owner-occupied | Renter-occupied |
| 1 Room | 2 (0.5%) | 0 (0.0%) |
| 2 or 3 Rooms | 0 (0.0%) | 0 (0.0%) |
| 4 or 5 Rooms | 41 (11.3%) | 51 (40.5%) |
| 6 or 7 Rooms | 139 (38.4%) | 65 (51.6%) |
| 8 or more Rooms | 180 (49.7%) | 10 (7.9%) |
| Total | 362 (100.0%) | 126 (100.0%) |
Housing Structure by Heating Type in Tower City borough
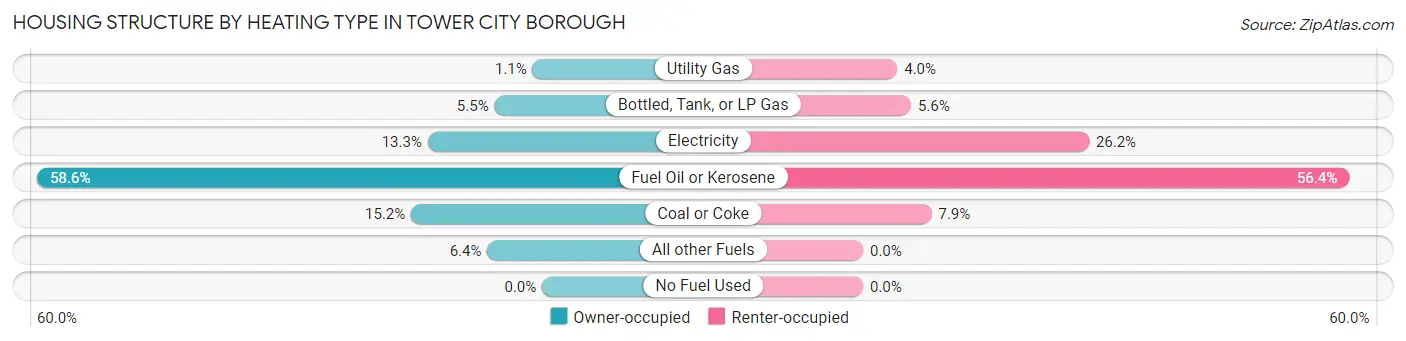
| Heating Type | Owner-occupied | Renter-occupied |
| Utility Gas | 4 (1.1%) | 5 (4.0%) |
| Bottled, Tank, or LP Gas | 20 (5.5%) | 7 (5.6%) |
| Electricity | 48 (13.3%) | 33 (26.2%) |
| Fuel Oil or Kerosene | 212 (58.6%) | 71 (56.4%) |
| Coal or Coke | 55 (15.2%) | 10 (7.9%) |
| All other Fuels | 23 (6.4%) | 0 (0.0%) |
| No Fuel Used | 0 (0.0%) | 0 (0.0%) |
| Total | 362 (100.0%) | 126 (100.0%) |
Household Vehicle Usage in Tower City borough
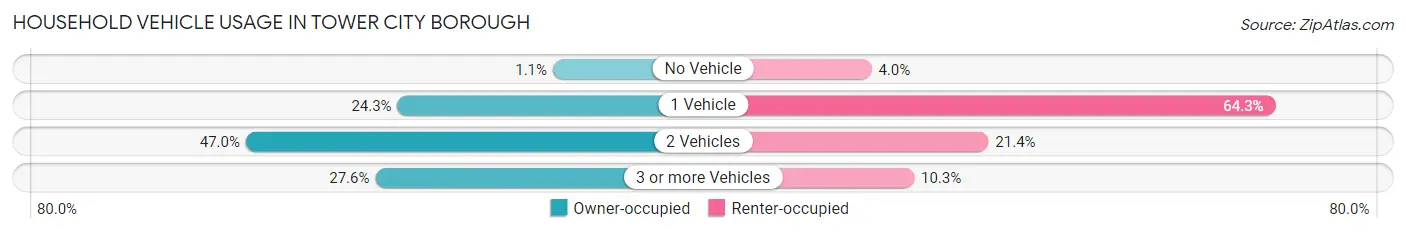
| Vehicles per Household | Owner-occupied | Renter-occupied |
| No Vehicle | 4 (1.1%) | 5 (4.0%) |
| 1 Vehicle | 88 (24.3%) | 81 (64.3%) |
| 2 Vehicles | 170 (47.0%) | 27 (21.4%) |
| 3 or more Vehicles | 100 (27.6%) | 13 (10.3%) |
| Total | 362 (100.0%) | 126 (100.0%) |
Real Estate & Mortgages in Tower City borough
Real Estate and Mortgage Overview in Tower City borough
| Characteristic | Without Mortgage | With Mortgage |
| Housing Units | 160 | 202 |
| Median Property Value | $92,500 | $114,700 |
| Median Household Income | $66,500 | $25 |
| Monthly Housing Costs | $526 | $4 |
| Real Estate Taxes | $1,208 | $0 |
Property Value by Mortgage Status in Tower City borough
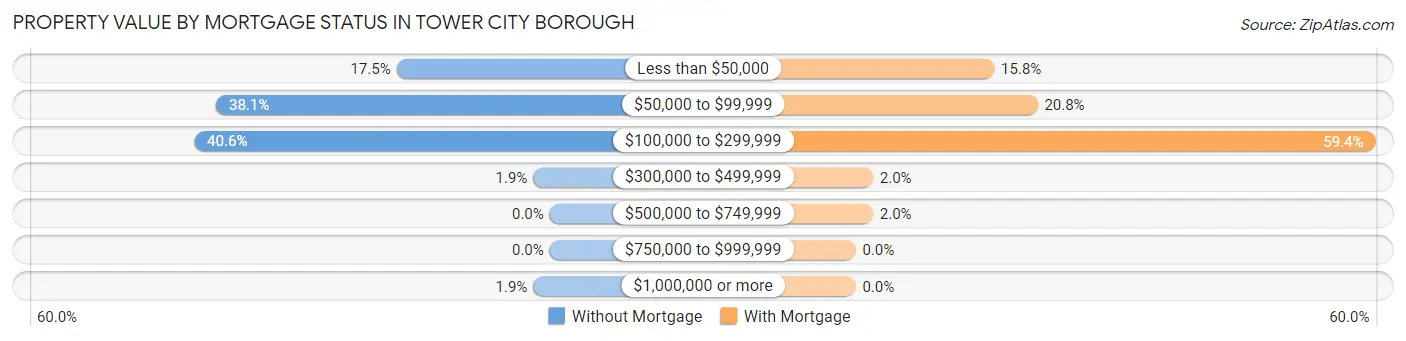
| Property Value | Without Mortgage | With Mortgage |
| Less than $50,000 | 28 (17.5%) | 32 (15.8%) |
| $50,000 to $99,999 | 61 (38.1%) | 42 (20.8%) |
| $100,000 to $299,999 | 65 (40.6%) | 120 (59.4%) |
| $300,000 to $499,999 | 3 (1.9%) | 4 (2.0%) |
| $500,000 to $749,999 | 0 (0.0%) | 4 (2.0%) |
| $750,000 to $999,999 | 0 (0.0%) | 0 (0.0%) |
| $1,000,000 or more | 3 (1.9%) | 0 (0.0%) |
| Total | 160 (100.0%) | 202 (100.0%) |
Household Income by Mortgage Status in Tower City borough
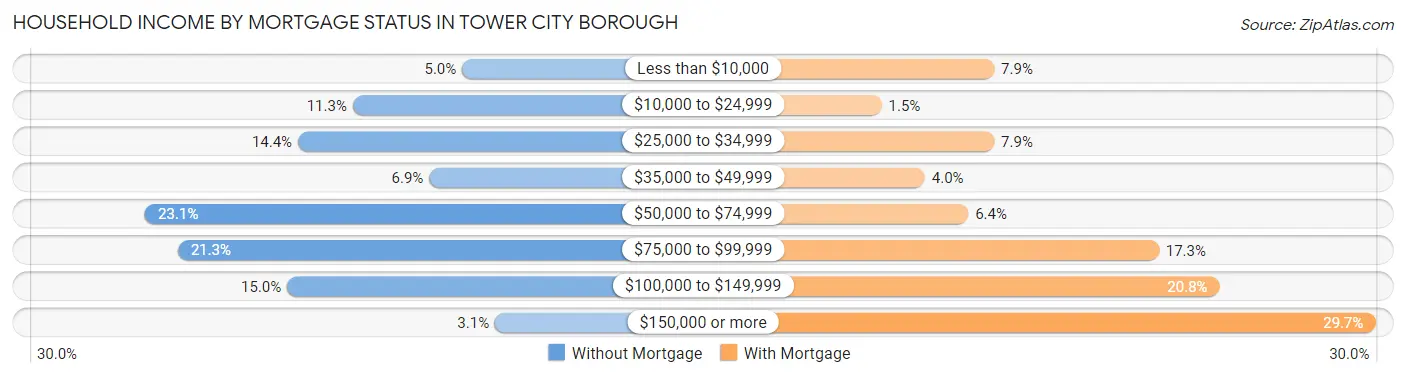
| Household Income | Without Mortgage | With Mortgage |
| Less than $10,000 | 8 (5.0%) | 16 (7.9%) |
| $10,000 to $24,999 | 18 (11.3%) | 3 (1.5%) |
| $25,000 to $34,999 | 23 (14.4%) | 16 (7.9%) |
| $35,000 to $49,999 | 11 (6.9%) | 8 (4.0%) |
| $50,000 to $74,999 | 37 (23.1%) | 13 (6.4%) |
| $75,000 to $99,999 | 34 (21.2%) | 35 (17.3%) |
| $100,000 to $149,999 | 24 (15.0%) | 42 (20.8%) |
| $150,000 or more | 5 (3.1%) | 60 (29.7%) |
| Total | 160 (100.0%) | 202 (100.0%) |
Property Value to Household Income Ratio in Tower City borough
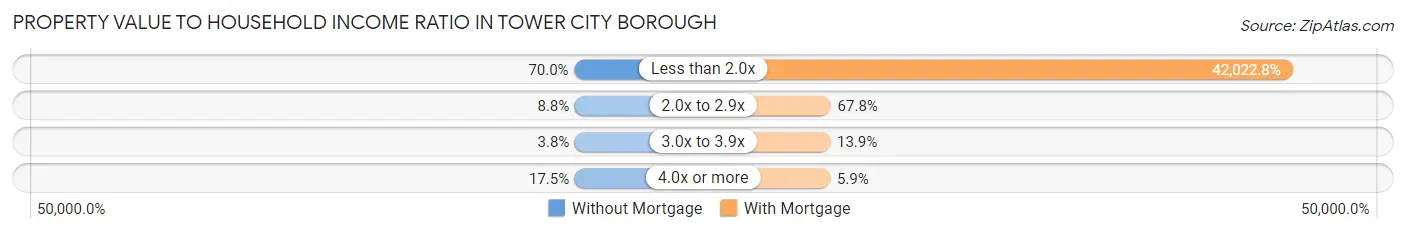
| Value-to-Income Ratio | Without Mortgage | With Mortgage |
| Less than 2.0x | 112 (70.0%) | 84,886 (42,022.8%) |
| 2.0x to 2.9x | 14 (8.7%) | 137 (67.8%) |
| 3.0x to 3.9x | 6 (3.7%) | 28 (13.9%) |
| 4.0x or more | 28 (17.5%) | 12 (5.9%) |
| Total | 160 (100.0%) | 202 (100.0%) |
Real Estate Taxes by Mortgage Status in Tower City borough
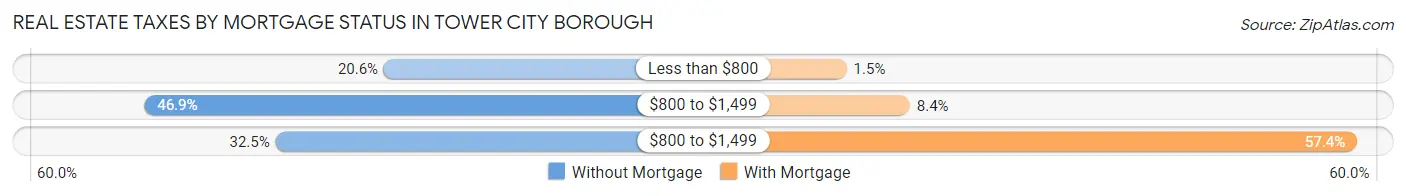
| Property Taxes | Without Mortgage | With Mortgage |
| Less than $800 | 33 (20.6%) | 3 (1.5%) |
| $800 to $1,499 | 75 (46.9%) | 17 (8.4%) |
| $800 to $1,499 | 52 (32.5%) | 116 (57.4%) |
| Total | 160 (100.0%) | 202 (100.0%) |
Health & Disability in Tower City borough
Health Insurance Coverage by Age in Tower City borough
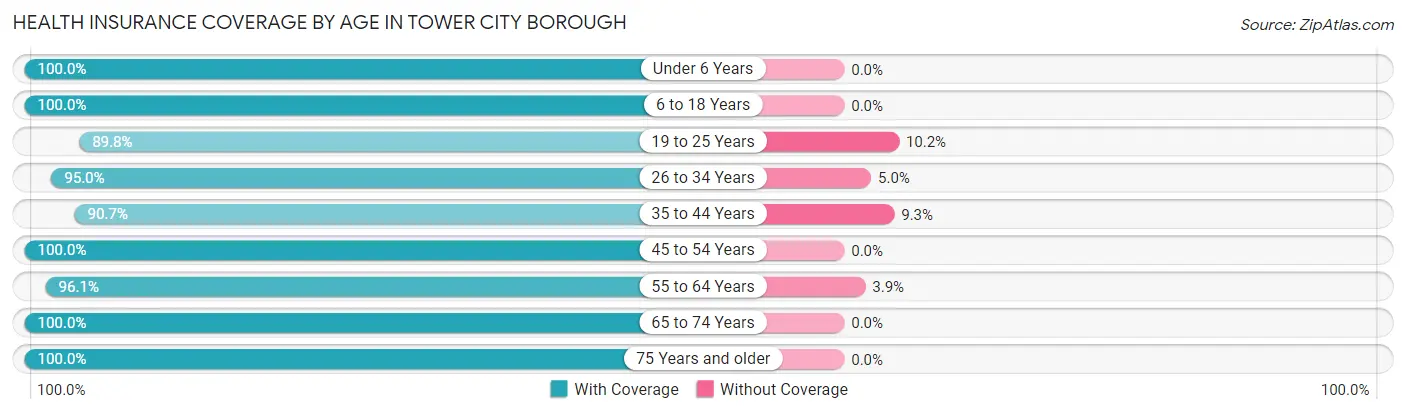
| Age Bracket | With Coverage | Without Coverage |
| Under 6 Years | 91 (100.0%) | 0 (0.0%) |
| 6 to 18 Years | 230 (100.0%) | 0 (0.0%) |
| 19 to 25 Years | 141 (89.8%) | 16 (10.2%) |
| 26 to 34 Years | 133 (95.0%) | 7 (5.0%) |
| 35 to 44 Years | 146 (90.7%) | 15 (9.3%) |
| 45 to 54 Years | 141 (100.0%) | 0 (0.0%) |
| 55 to 64 Years | 171 (96.1%) | 7 (3.9%) |
| 65 to 74 Years | 137 (100.0%) | 0 (0.0%) |
| 75 Years and older | 80 (100.0%) | 0 (0.0%) |
| Total | 1,270 (96.6%) | 45 (3.4%) |
Health Insurance Coverage by Citizenship Status in Tower City borough
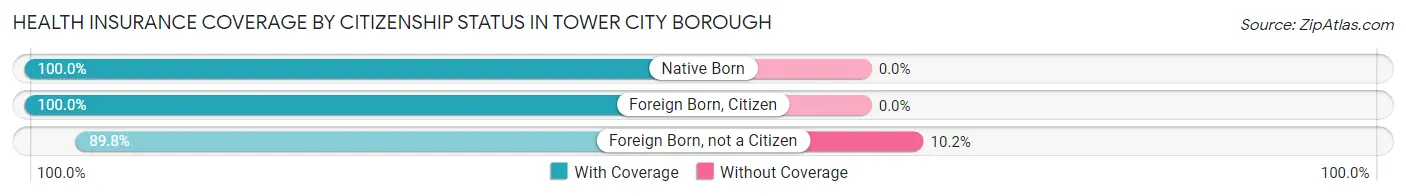
| Citizenship Status | With Coverage | Without Coverage |
| Native Born | 91 (100.0%) | 0 (0.0%) |
| Foreign Born, Citizen | 230 (100.0%) | 0 (0.0%) |
| Foreign Born, not a Citizen | 141 (89.8%) | 16 (10.2%) |
Health Insurance Coverage by Household Income in Tower City borough
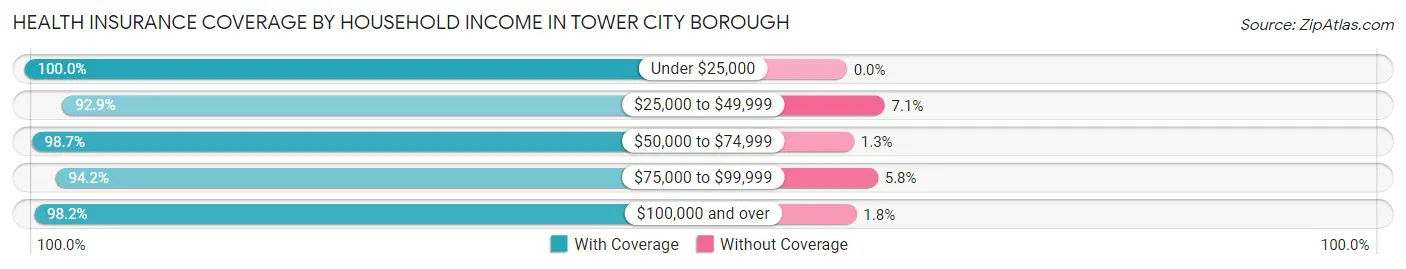
| Household Income | With Coverage | Without Coverage |
| Under $25,000 | 103 (100.0%) | 0 (0.0%) |
| $25,000 to $49,999 | 210 (92.9%) | 16 (7.1%) |
| $50,000 to $74,999 | 224 (98.7%) | 3 (1.3%) |
| $75,000 to $99,999 | 292 (94.2%) | 18 (5.8%) |
| $100,000 and over | 437 (98.2%) | 8 (1.8%) |
Public vs Private Health Insurance Coverage by Age in Tower City borough
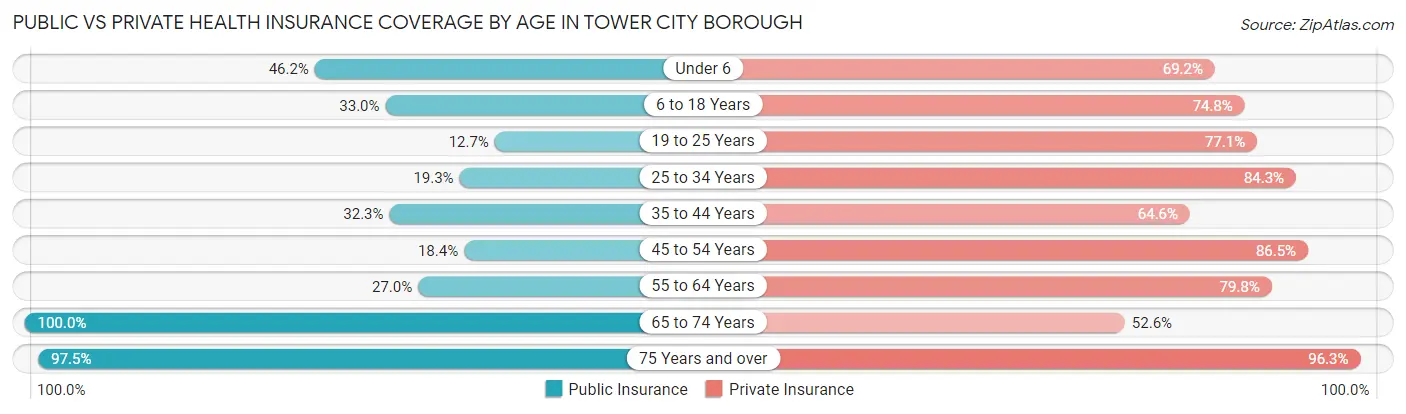
| Age Bracket | Public Insurance | Private Insurance |
| Under 6 | 42 (46.2%) | 63 (69.2%) |
| 6 to 18 Years | 76 (33.0%) | 172 (74.8%) |
| 19 to 25 Years | 20 (12.7%) | 121 (77.1%) |
| 25 to 34 Years | 27 (19.3%) | 118 (84.3%) |
| 35 to 44 Years | 52 (32.3%) | 104 (64.6%) |
| 45 to 54 Years | 26 (18.4%) | 122 (86.5%) |
| 55 to 64 Years | 48 (27.0%) | 142 (79.8%) |
| 65 to 74 Years | 137 (100.0%) | 72 (52.5%) |
| 75 Years and over | 78 (97.5%) | 77 (96.3%) |
| Total | 506 (38.5%) | 991 (75.4%) |
Disability Status by Sex by Age in Tower City borough
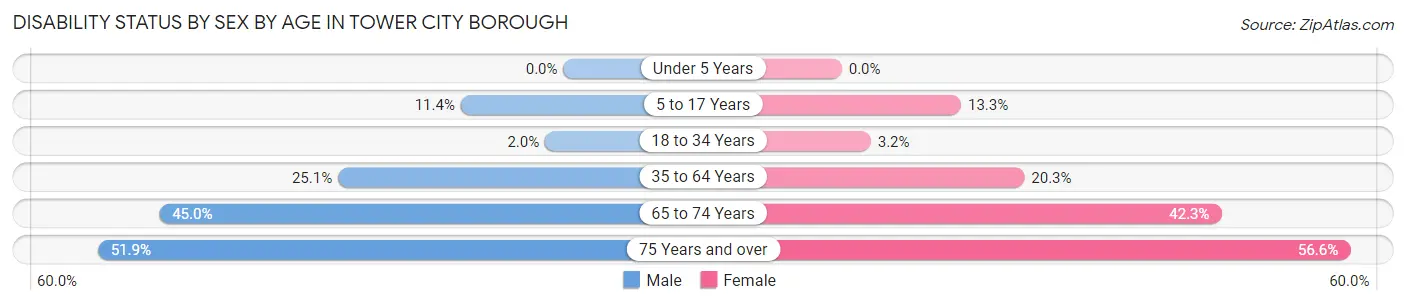
| Age Bracket | Male | Female |
| Under 5 Years | 0 (0.0%) | 0 (0.0%) |
| 5 to 17 Years | 12 (11.4%) | 17 (13.3%) |
| 18 to 34 Years | 3 (2.0%) | 5 (3.2%) |
| 35 to 64 Years | 60 (25.1%) | 49 (20.3%) |
| 65 to 74 Years | 18 (45.0%) | 41 (42.3%) |
| 75 Years and over | 14 (51.8%) | 30 (56.6%) |
Disability Class by Sex by Age in Tower City borough
Disability Class: Hearing Difficulty
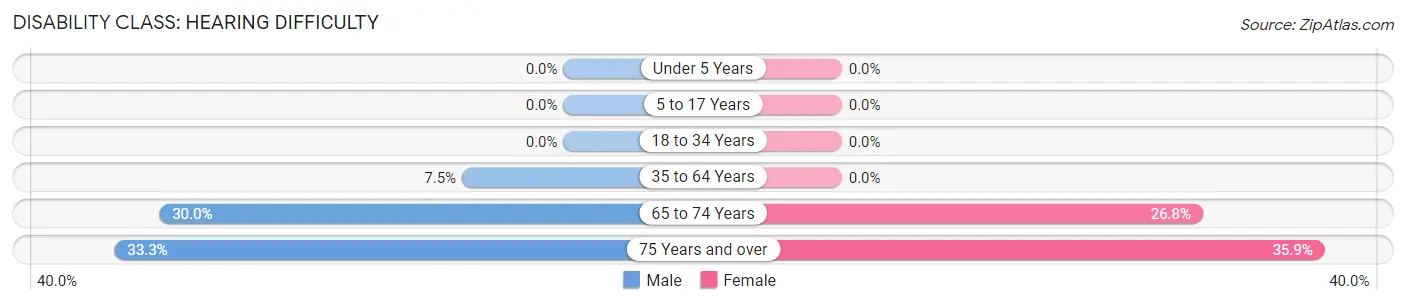
| Age Bracket | Male | Female |
| Under 5 Years | 0 (0.0%) | 0 (0.0%) |
| 5 to 17 Years | 0 (0.0%) | 0 (0.0%) |
| 18 to 34 Years | 0 (0.0%) | 0 (0.0%) |
| 35 to 64 Years | 18 (7.5%) | 0 (0.0%) |
| 65 to 74 Years | 12 (30.0%) | 26 (26.8%) |
| 75 Years and over | 9 (33.3%) | 19 (35.8%) |
Disability Class: Vision Difficulty
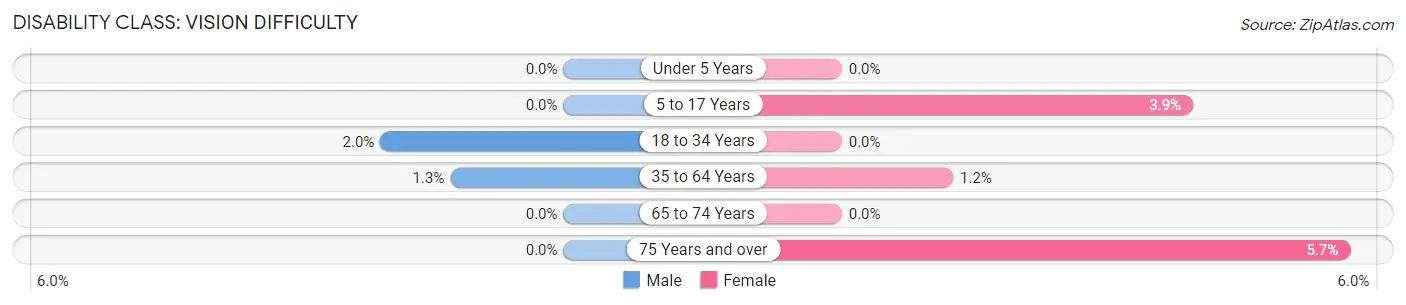
| Age Bracket | Male | Female |
| Under 5 Years | 0 (0.0%) | 0 (0.0%) |
| 5 to 17 Years | 0 (0.0%) | 5 (3.9%) |
| 18 to 34 Years | 3 (2.0%) | 0 (0.0%) |
| 35 to 64 Years | 3 (1.3%) | 3 (1.2%) |
| 65 to 74 Years | 0 (0.0%) | 0 (0.0%) |
| 75 Years and over | 0 (0.0%) | 3 (5.7%) |
Disability Class: Cognitive Difficulty
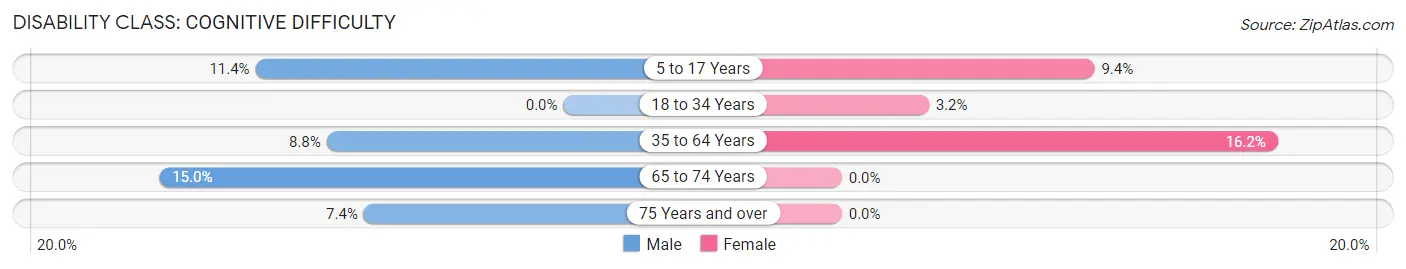
| Age Bracket | Male | Female |
| 5 to 17 Years | 12 (11.4%) | 12 (9.4%) |
| 18 to 34 Years | 0 (0.0%) | 5 (3.2%) |
| 35 to 64 Years | 21 (8.8%) | 39 (16.2%) |
| 65 to 74 Years | 6 (15.0%) | 0 (0.0%) |
| 75 Years and over | 2 (7.4%) | 0 (0.0%) |
Disability Class: Ambulatory Difficulty
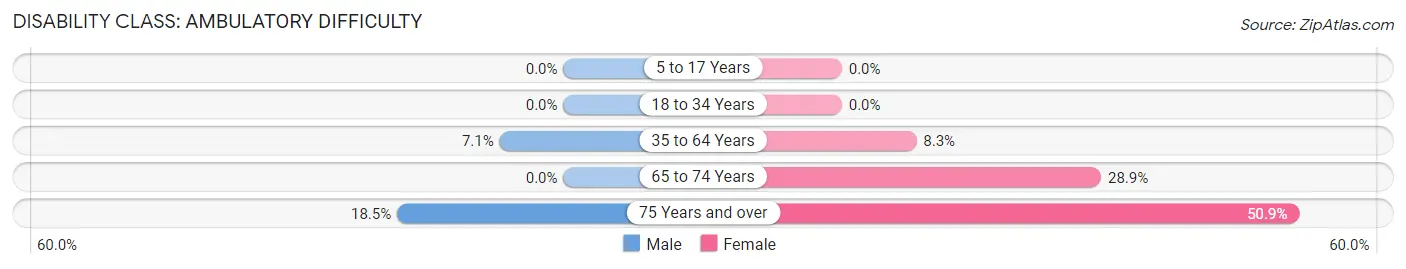
| Age Bracket | Male | Female |
| 5 to 17 Years | 0 (0.0%) | 0 (0.0%) |
| 18 to 34 Years | 0 (0.0%) | 0 (0.0%) |
| 35 to 64 Years | 17 (7.1%) | 20 (8.3%) |
| 65 to 74 Years | 0 (0.0%) | 28 (28.9%) |
| 75 Years and over | 5 (18.5%) | 27 (50.9%) |
Disability Class: Self-Care Difficulty
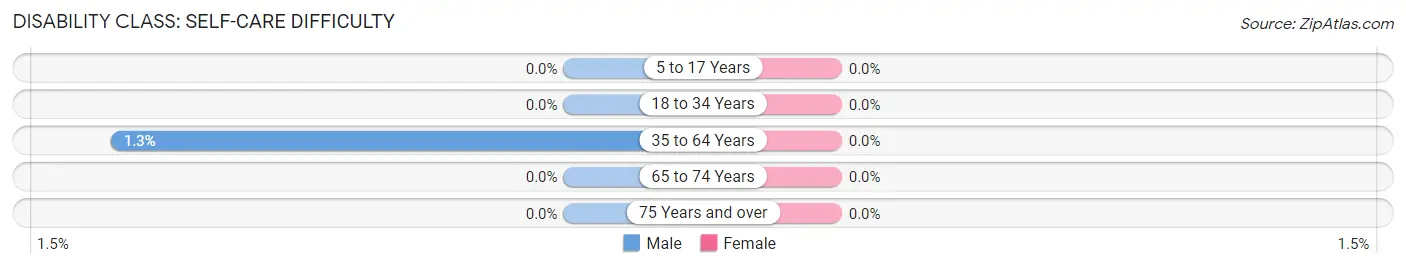
| Age Bracket | Male | Female |
| 5 to 17 Years | 0 (0.0%) | 0 (0.0%) |
| 18 to 34 Years | 0 (0.0%) | 0 (0.0%) |
| 35 to 64 Years | 3 (1.3%) | 0 (0.0%) |
| 65 to 74 Years | 0 (0.0%) | 0 (0.0%) |
| 75 Years and over | 0 (0.0%) | 0 (0.0%) |
Technology Access in Tower City borough
Computing Device Access in Tower City borough
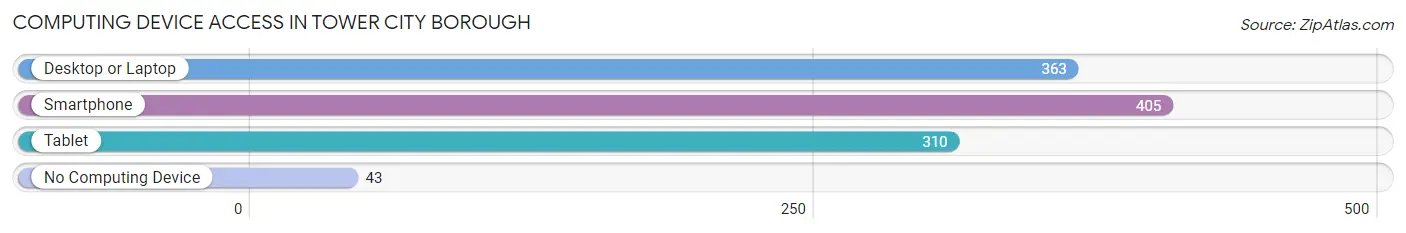
| Device Type | # Households | % Households |
| Desktop or Laptop | 363 | 74.4% |
| Smartphone | 405 | 83.0% |
| Tablet | 310 | 63.5% |
| No Computing Device | 43 | 8.8% |
| Total | 488 | 100.0% |
Internet Access in Tower City borough
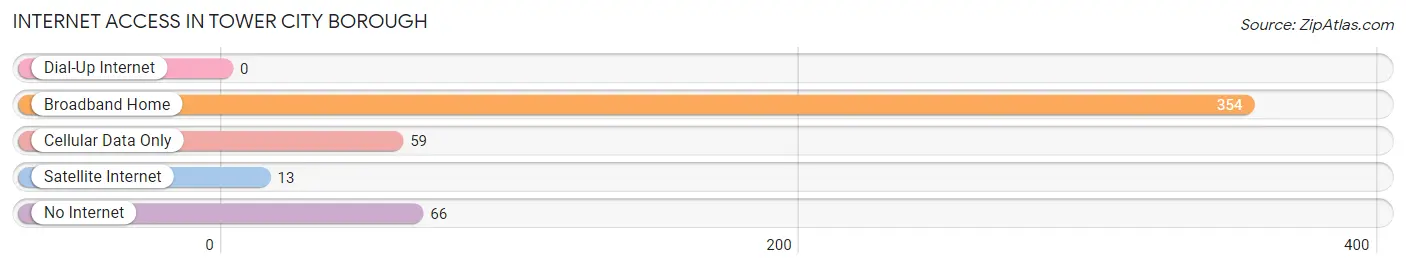
| Internet Type | # Households | % Households |
| Dial-Up Internet | 0 | 0.0% |
| Broadband Home | 354 | 72.5% |
| Cellular Data Only | 59 | 12.1% |
| Satellite Internet | 13 | 2.7% |
| No Internet | 66 | 13.5% |
| Total | 488 | 100.0% |
Tower City borough Summary
Tower City Borough is a small borough located in Schuylkill County, Pennsylvania. It is situated in the southern part of the county, along the Schuylkill River. The borough has a population of 1,093 as of the 2010 census.
History
Tower City Borough was founded in 1851 by a group of settlers from the nearby town of Pottsville. The settlers were looking for a place to build a new town and chose the area along the Schuylkill River. The town was named after the nearby Tower Hill, which was a lookout point for the settlers. The town was officially incorporated in 1854.
In the late 19th century, Tower City Borough was a thriving industrial center. The town was home to several coal mines, iron works, and other industries. The town also had a large population of immigrants from Europe, including Germans, Poles, and Italians.
In the early 20th century, the town began to decline as the coal industry declined and the population began to move away. The town was hit hard by the Great Depression and many of the businesses closed. The town was also affected by the flooding of the Schuylkill River in 1936.
Geography
Tower City Borough is located in the southern part of Schuylkill County, along the Schuylkill River. The borough is bordered by the townships of Porter, Frailey, and Wayne. The borough has a total area of 0.7 square miles, all of which is land.
The borough is located in the Appalachian Mountains and is surrounded by rolling hills and forests. The climate is humid continental, with cold winters and hot, humid summers.
Economy
Tower City Borough has a small, but diverse economy. The town is home to several small businesses, including a grocery store, a hardware store, and a few restaurants. The town also has a few manufacturing companies, including a furniture factory and a metal fabrication plant.
The town is also home to a few tourist attractions, including the Tower Hill Lookout and the Tower City Museum. The town also has a few parks and recreational areas, including the Tower City Park and the Tower City Nature Trail.
Demographics
As of the 2010 census, the population of Tower City Borough was 1,093. The racial makeup of the borough was 97.3% White, 0.7% African American, 0.2% Native American, 0.2% Asian, 0.2% from other races, and 1.6% from two or more races. Hispanic or Latino of any race were 0.7% of the population.
The median income for a household in the borough was $37,500, and the median income for a family was $41,250. The per capita income for the borough was $17,845. About 11.2% of families and 13.2% of the population were below the poverty line, including 17.2% of those under age 18 and 8.3% of those age 65 or over.
Common Questions
What is Per Capita Income in Tower City borough?
Per Capita income in Tower City borough is $29,473.
What is the Median Family Income in Tower City borough?
Median Family Income in Tower City borough is $77,045.
What is the Median Household income in Tower City borough?
Median Household Income in Tower City borough is $67,250.
What is Income or Wage Gap in Tower City borough?
Income or Wage Gap in Tower City borough is 35.3%.
Women in Tower City borough earn 64.7 cents for every dollar earned by a man.
What is Inequality or Gini Index in Tower City borough?
Inequality or Gini Index in Tower City borough is 0.37.
What is the Total Population of Tower City borough?
Total Population of Tower City borough is 1,329.
What is the Total Male Population of Tower City borough?
Total Male Population of Tower City borough is 612.
What is the Total Female Population of Tower City borough?
Total Female Population of Tower City borough is 717.
What is the Ratio of Males per 100 Females in Tower City borough?
There are 85.36 Males per 100 Females in Tower City borough.
What is the Ratio of Females per 100 Males in Tower City borough?
There are 117.16 Females per 100 Males in Tower City borough.
What is the Median Population Age in Tower City borough?
Median Population Age in Tower City borough is 37.2 Years.
What is the Average Family Size in Tower City borough
Average Family Size in Tower City borough is 3.3 People.
What is the Average Household Size in Tower City borough
Average Household Size in Tower City borough is 2.7 People.
How Large is the Labor Force in Tower City borough?
There are 674 People in the Labor Forcein in Tower City borough.
What is the Percentage of People in the Labor Force in Tower City borough?
63.6% of People are in the Labor Force in Tower City borough.
What is the Unemployment Rate in Tower City borough?
Unemployment Rate in Tower City borough is 4.8%.