White Haven borough, PA Map & Demographics
White Haven borough Overview
$25,591
PER CAPITA INCOME
$63,971
AVG FAMILY INCOME
$56,979
AVG HOUSEHOLD INCOME
33.5%
WAGE / INCOME GAP [ % ]
66.5¢/ $1
WAGE / INCOME GAP [ $ ]
0.36
INEQUALITY / GINI INDEX
1,068
TOTAL POPULATION
549
MALE POPULATION
519
FEMALE POPULATION
105.78
MALES / 100 FEMALES
94.54
FEMALES / 100 MALES
40.1
MEDIAN AGE
3.0
AVG FAMILY SIZE
2.5
AVG HOUSEHOLD SIZE
466
LABOR FORCE [ PEOPLE ]
57.7%
PERCENT IN LABOR FORCE
2.8%
UNEMPLOYMENT RATE
Income in White Haven borough
Income Overview in White Haven borough
Per Capita Income in White Haven borough is $25,591, while median incomes of families and households are $63,971 and $56,979 respectively.
| Characteristic | Number | Measure |
| Per Capita Income | 1,068 | $25,591 |
| Median Family Income | 282 | $63,971 |
| Mean Family Income | 282 | $71,394 |
| Median Household Income | 425 | $56,979 |
| Mean Household Income | 425 | $63,738 |
| Income Deficit | 282 | $0 |
| Wage / Income Gap (%) | 1,068 | 33.55% |
| Wage / Income Gap ($) | 1,068 | 66.45¢ per $1 |
| Gini / Inequality Index | 1,068 | 0.36 |
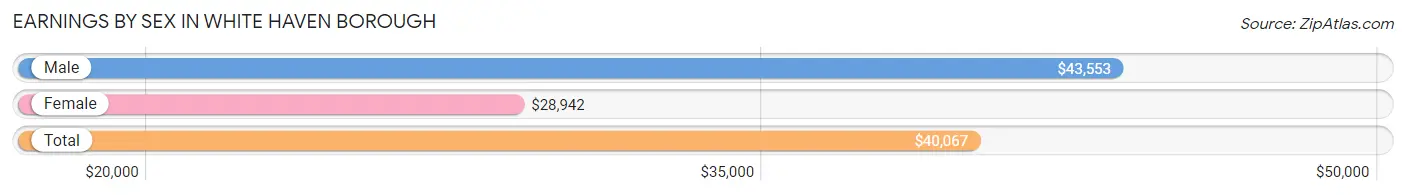
Earnings by Sex in White Haven borough
Average Earnings in White Haven borough are $40,067, $43,553 for men and $28,942 for women, a difference of 33.6%.
| Sex | Number | Average Earnings |
| Male | 254 (52.2%) | $43,553 |
| Female | 233 (47.8%) | $28,942 |
| Total | 487 (100.0%) | $40,067 |
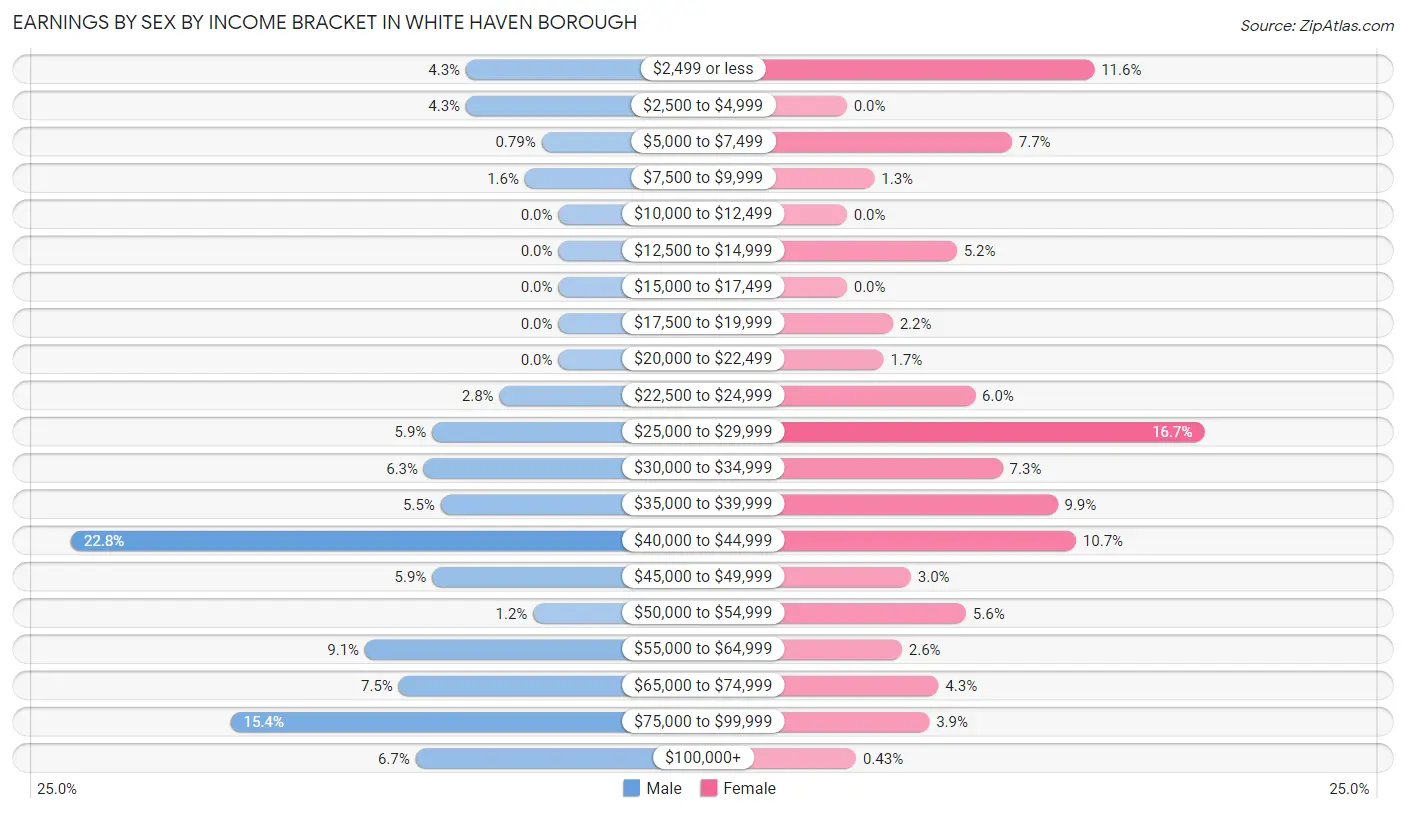
Earnings by Sex by Income Bracket in White Haven borough
The most common earnings brackets in White Haven borough are $40,000 to $44,999 for men (58 | 22.8%) and $25,000 to $29,999 for women (39 | 16.7%).
| Income | Male | Female |
| $2,499 or less | 11 (4.3%) | 27 (11.6%) |
| $2,500 to $4,999 | 11 (4.3%) | 0 (0.0%) |
| $5,000 to $7,499 | 2 (0.8%) | 18 (7.7%) |
| $7,500 to $9,999 | 4 (1.6%) | 3 (1.3%) |
| $10,000 to $12,499 | 0 (0.0%) | 0 (0.0%) |
| $12,500 to $14,999 | 0 (0.0%) | 12 (5.1%) |
| $15,000 to $17,499 | 0 (0.0%) | 0 (0.0%) |
| $17,500 to $19,999 | 0 (0.0%) | 5 (2.1%) |
| $20,000 to $22,499 | 0 (0.0%) | 4 (1.7%) |
| $22,500 to $24,999 | 7 (2.8%) | 14 (6.0%) |
| $25,000 to $29,999 | 15 (5.9%) | 39 (16.7%) |
| $30,000 to $34,999 | 16 (6.3%) | 17 (7.3%) |
| $35,000 to $39,999 | 14 (5.5%) | 23 (9.9%) |
| $40,000 to $44,999 | 58 (22.8%) | 25 (10.7%) |
| $45,000 to $49,999 | 15 (5.9%) | 7 (3.0%) |
| $50,000 to $54,999 | 3 (1.2%) | 13 (5.6%) |
| $55,000 to $64,999 | 23 (9.1%) | 6 (2.6%) |
| $65,000 to $74,999 | 19 (7.5%) | 10 (4.3%) |
| $75,000 to $99,999 | 39 (15.3%) | 9 (3.9%) |
| $100,000+ | 17 (6.7%) | 1 (0.4%) |
| Total | 254 (100.0%) | 233 (100.0%) |
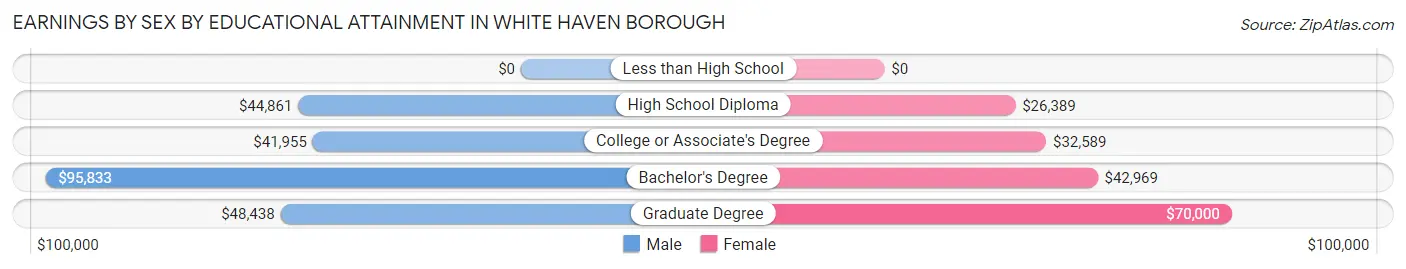
Earnings by Sex by Educational Attainment in White Haven borough
Average earnings in White Haven borough are $44,342 for men and $32,679 for women, a difference of 26.3%. Men with an educational attainment of bachelor's degree enjoy the highest average annual earnings of $95,833, while those with college or associate's degree education earn the least with $41,955. Women with an educational attainment of graduate degree earn the most with the average annual earnings of $70,000, while those with high school diploma education have the smallest earnings of $26,389.
| Educational Attainment | Male Income | Female Income |
| Less than High School | - | - |
| High School Diploma | $44,861 | $26,389 |
| College or Associate's Degree | $41,955 | $32,589 |
| Bachelor's Degree | $95,833 | $42,969 |
| Graduate Degree | $48,438 | $70,000 |
| Total | $44,342 | $32,679 |
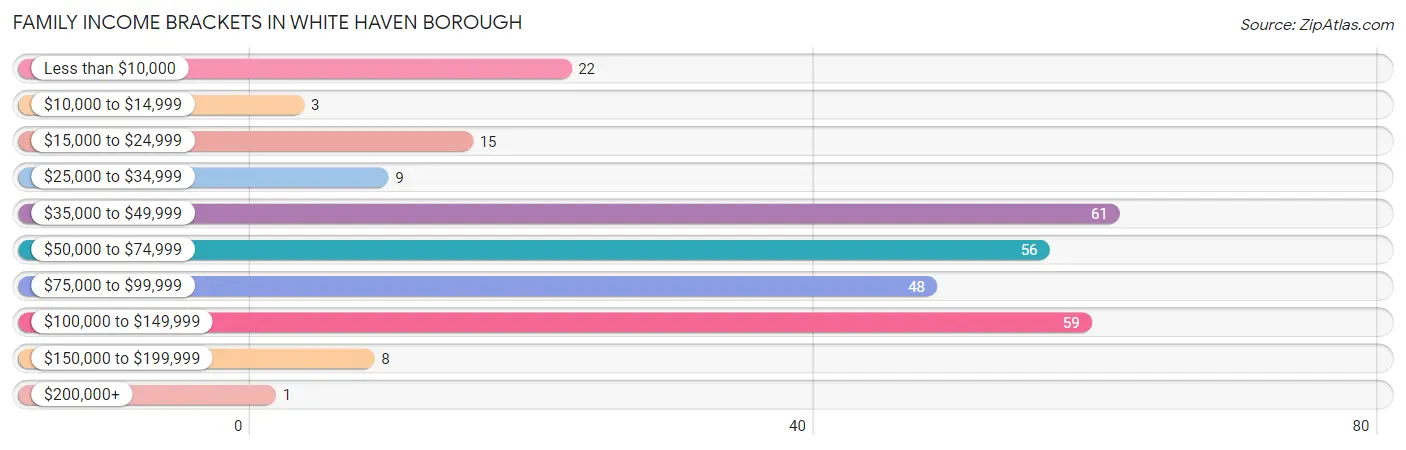
Family Income in White Haven borough
Family Income Brackets in White Haven borough
According to the White Haven borough family income data, there are 61 families falling into the $35,000 to $49,999 income range, which is the most common income bracket and makes up 21.6% of all families. Conversely, the $200,000+ income bracket is the least frequent group with only 1 families (0.4%) belonging to this category.
| Income Bracket | # Families | % Families |
| Less than $10,000 | 22 | 7.8% |
| $10,000 to $14,999 | 3 | 1.1% |
| $15,000 to $24,999 | 15 | 5.3% |
| $25,000 to $34,999 | 9 | 3.2% |
| $35,000 to $49,999 | 61 | 21.6% |
| $50,000 to $74,999 | 56 | 19.9% |
| $75,000 to $99,999 | 48 | 17.0% |
| $100,000 to $149,999 | 59 | 20.9% |
| $150,000 to $199,999 | 8 | 2.8% |
| $200,000+ | 1 | 0.4% |
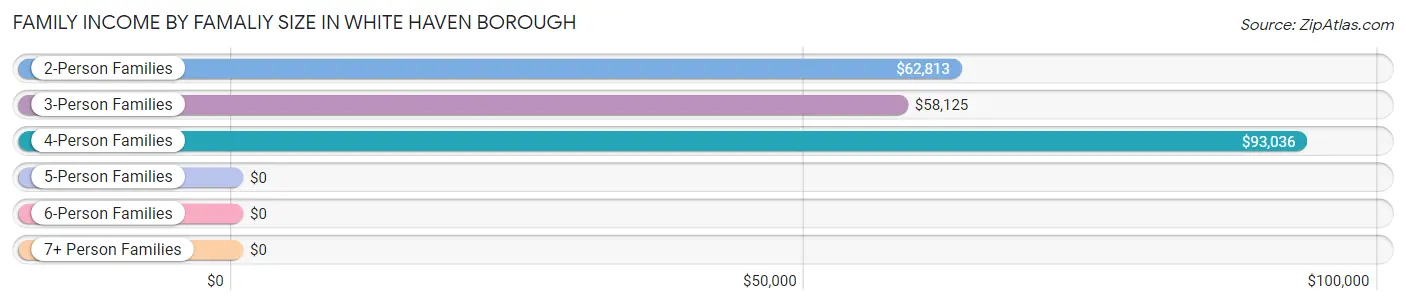
Family Income by Famaliy Size in White Haven borough
4-person families (66 | 23.4%) account for the highest median family income in White Haven borough with $93,036 per family, while 2-person families (117 | 41.5%) have the highest median income of $31,406 per family member.
| Income Bracket | # Families | Median Income |
| 2-Person Families | 117 (41.5%) | $62,813 |
| 3-Person Families | 78 (27.7%) | $58,125 |
| 4-Person Families | 66 (23.4%) | $93,036 |
| 5-Person Families | 9 (3.2%) | $0 |
| 6-Person Families | 5 (1.8%) | $0 |
| 7+ Person Families | 7 (2.5%) | $0 |
| Total | 282 (100.0%) | $63,971 |
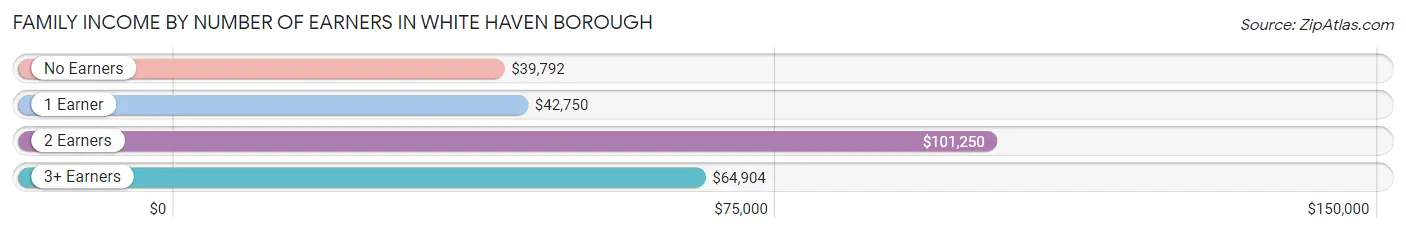
Family Income by Number of Earners in White Haven borough
The median family income in White Haven borough is $63,971, with families comprising 2 earners (98) having the highest median family income of $101,250, while families with no earners (71) have the lowest median family income of $39,792, accounting for 34.7% and 25.2% of families, respectively.
| Number of Earners | # Families | Median Income |
| No Earners | 71 (25.2%) | $39,792 |
| 1 Earner | 88 (31.2%) | $42,750 |
| 2 Earners | 98 (34.7%) | $101,250 |
| 3+ Earners | 25 (8.9%) | $64,904 |
| Total | 282 (100.0%) | $63,971 |
Household Income in White Haven borough
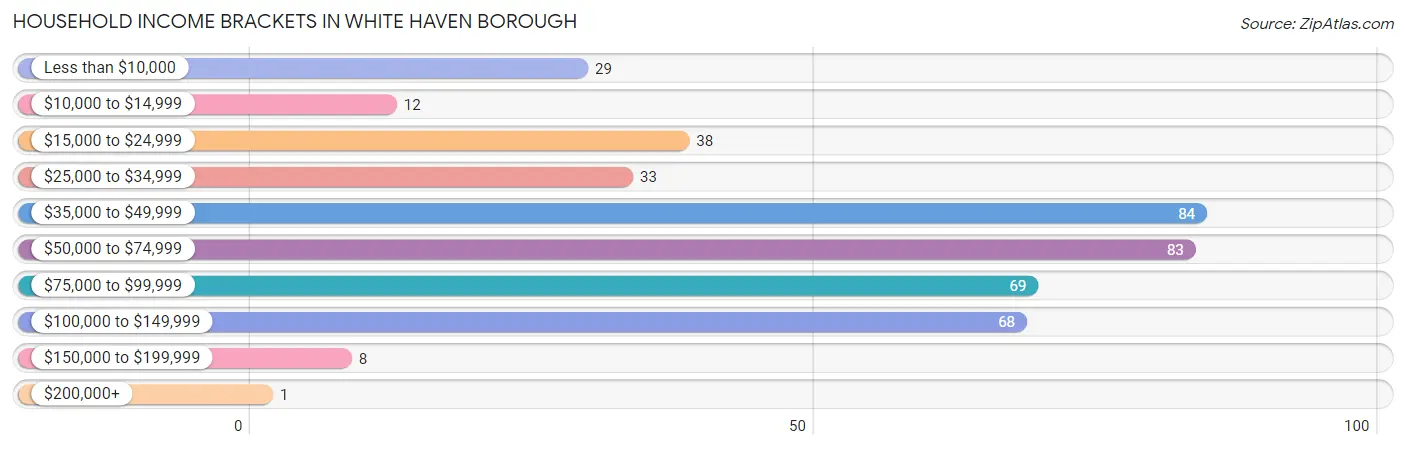
Household Income Brackets in White Haven borough
With 84 households falling in the category, the $35,000 to $49,999 income range is the most frequent in White Haven borough, accounting for 19.8% of all households. In contrast, only 1 households (0.2%) fall into the $200,000+ income bracket, making it the least populous group.
| Income Bracket | # Households | % Households |
| Less than $10,000 | 29 | 6.8% |
| $10,000 to $14,999 | 12 | 2.8% |
| $15,000 to $24,999 | 38 | 8.9% |
| $25,000 to $34,999 | 33 | 7.8% |
| $35,000 to $49,999 | 84 | 19.8% |
| $50,000 to $74,999 | 83 | 19.5% |
| $75,000 to $99,999 | 69 | 16.2% |
| $100,000 to $149,999 | 68 | 16.0% |
| $150,000 to $199,999 | 8 | 1.9% |
| $200,000+ | 1 | 0.2% |
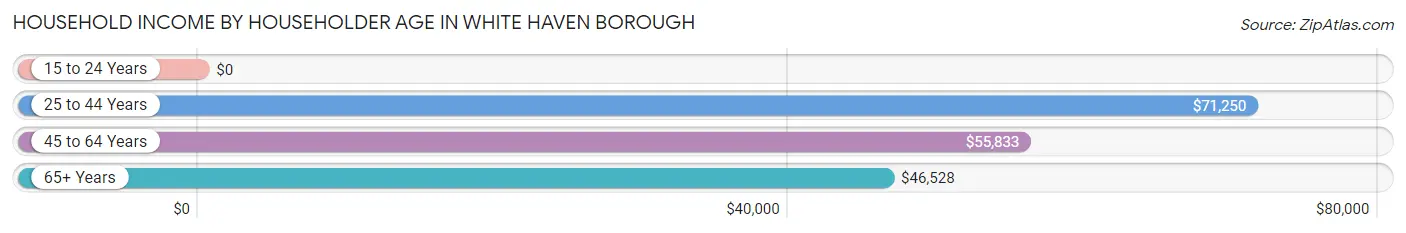
Household Income by Householder Age in White Haven borough
The median household income in White Haven borough is $56,979, with the highest median household income of $71,250 found in the 25 to 44 years age bracket for the primary householder. A total of 128 households (30.1%) fall into this category.
| Income Bracket | # Households | Median Income |
| 15 to 24 Years | 0 (0.0%) | $0 |
| 25 to 44 Years | 128 (30.1%) | $71,250 |
| 45 to 64 Years | 162 (38.1%) | $55,833 |
| 65+ Years | 135 (31.8%) | $46,528 |
| Total | 425 (100.0%) | $56,979 |
Poverty in White Haven borough
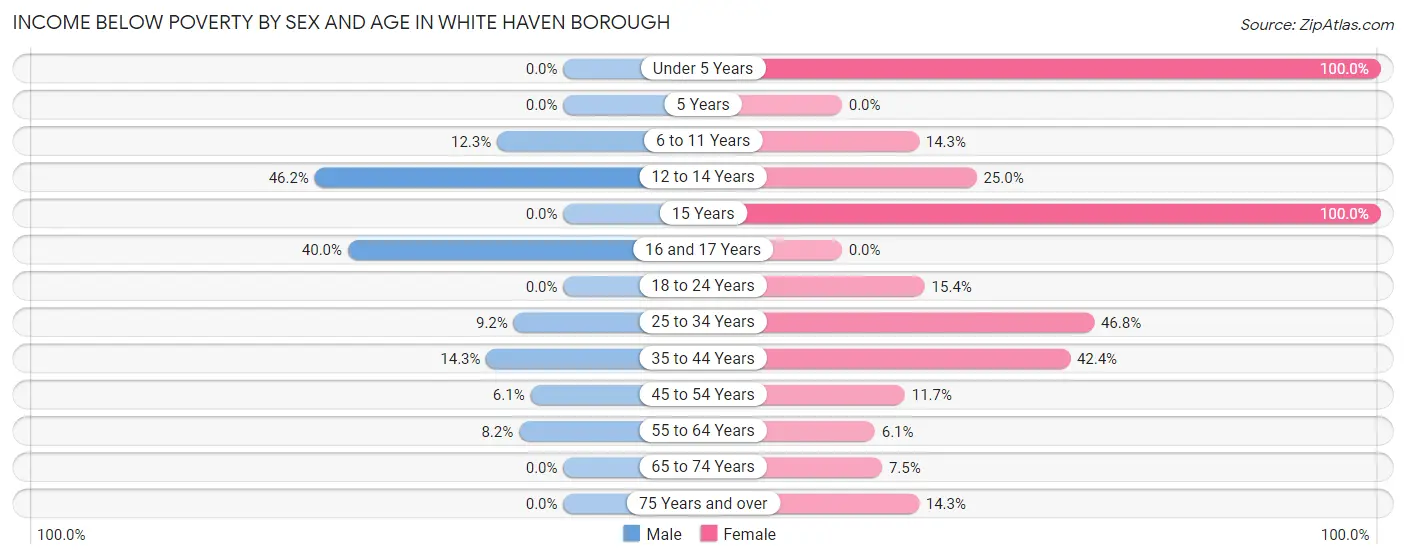
Income Below Poverty by Sex and Age in White Haven borough
With 9.5% poverty level for males and 24.1% for females among the residents of White Haven borough, 12 to 14 year old males and under 5 year old females are the most vulnerable to poverty, with 12 males (46.2%) and 18 females (100.0%) in their respective age groups living below the poverty level.
| Age Bracket | Male | Female |
| Under 5 Years | 0 (0.0%) | 18 (100.0%) |
| 5 Years | 0 (0.0%) | 0 (0.0%) |
| 6 to 11 Years | 8 (12.3%) | 9 (14.3%) |
| 12 to 14 Years | 12 (46.2%) | 9 (25.0%) |
| 15 Years | 0 (0.0%) | 6 (100.0%) |
| 16 and 17 Years | 6 (40.0%) | 0 (0.0%) |
| 18 to 24 Years | 0 (0.0%) | 4 (15.4%) |
| 25 to 34 Years | 6 (9.2%) | 22 (46.8%) |
| 35 to 44 Years | 9 (14.3%) | 36 (42.3%) |
| 45 to 54 Years | 5 (6.1%) | 9 (11.7%) |
| 55 to 64 Years | 6 (8.2%) | 3 (6.1%) |
| 65 to 74 Years | 0 (0.0%) | 5 (7.5%) |
| 75 Years and over | 0 (0.0%) | 4 (14.3%) |
| Total | 52 (9.5%) | 125 (24.1%) |
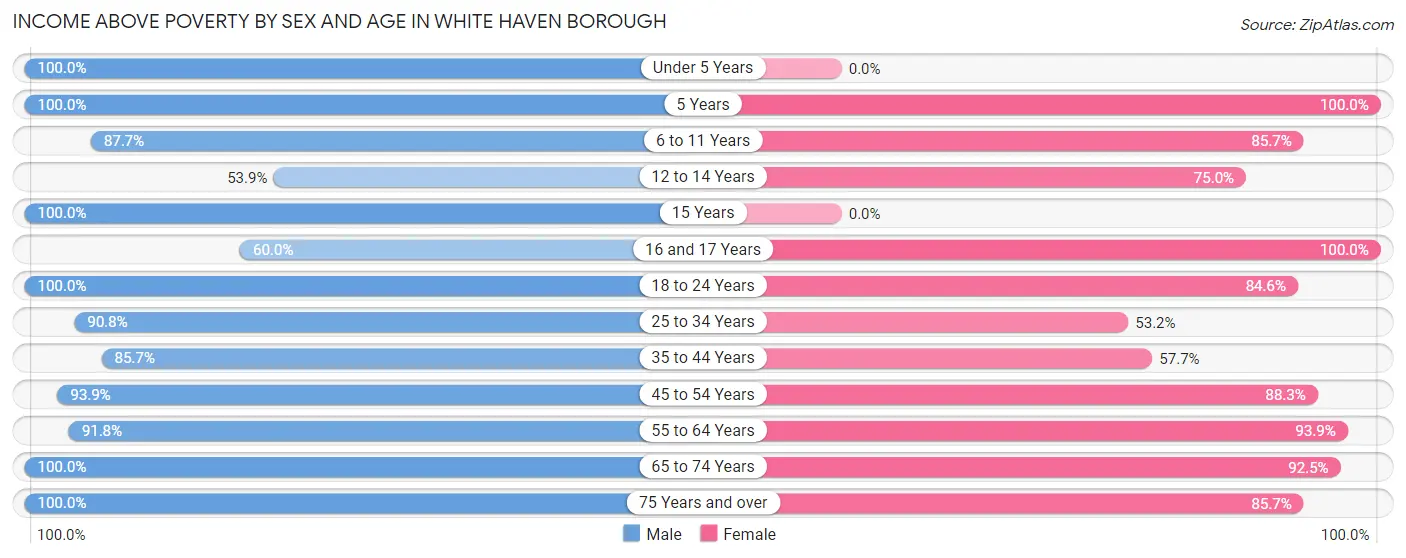
Income Above Poverty by Sex and Age in White Haven borough
According to the poverty statistics in White Haven borough, males aged under 5 years and females aged 5 years are the age groups that are most secure financially, with 100.0% of males and 100.0% of females in these age groups living above the poverty line.
| Age Bracket | Male | Female |
| Under 5 Years | 20 (100.0%) | 0 (0.0%) |
| 5 Years | 14 (100.0%) | 12 (100.0%) |
| 6 to 11 Years | 57 (87.7%) | 54 (85.7%) |
| 12 to 14 Years | 14 (53.8%) | 27 (75.0%) |
| 15 Years | 1 (100.0%) | 0 (0.0%) |
| 16 and 17 Years | 9 (60.0%) | 5 (100.0%) |
| 18 to 24 Years | 16 (100.0%) | 22 (84.6%) |
| 25 to 34 Years | 59 (90.8%) | 25 (53.2%) |
| 35 to 44 Years | 54 (85.7%) | 49 (57.7%) |
| 45 to 54 Years | 77 (93.9%) | 68 (88.3%) |
| 55 to 64 Years | 67 (91.8%) | 46 (93.9%) |
| 65 to 74 Years | 72 (100.0%) | 62 (92.5%) |
| 75 Years and over | 37 (100.0%) | 24 (85.7%) |
| Total | 497 (90.5%) | 394 (75.9%) |
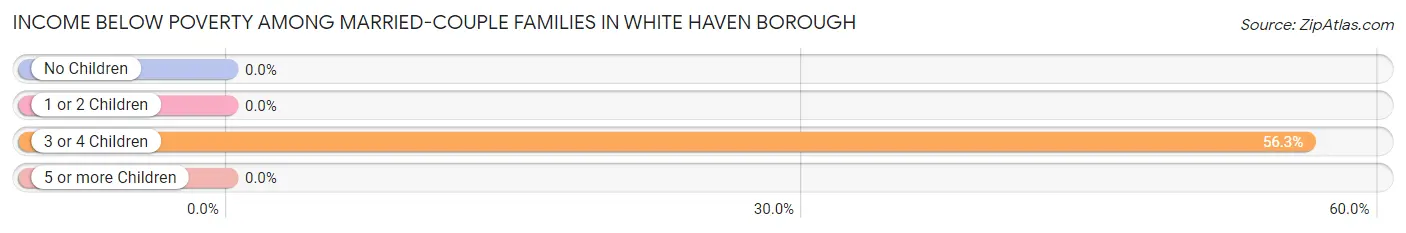
Income Below Poverty Among Married-Couple Families in White Haven borough
The poverty statistics for married-couple families in White Haven borough show that 4.6% or 9 of the total 197 families live below the poverty line. Families with 3 or 4 children have the highest poverty rate of 56.2%, comprising of 9 families. On the other hand, families with no children have the lowest poverty rate of 0.0%, which includes 0 families.
| Children | Above Poverty | Below Poverty |
| No Children | 119 (100.0%) | 0 (0.0%) |
| 1 or 2 Children | 62 (100.0%) | 0 (0.0%) |
| 3 or 4 Children | 7 (43.8%) | 9 (56.2%) |
| 5 or more Children | 0 (0.0%) | 0 (0.0%) |
| Total | 188 (95.4%) | 9 (4.6%) |
Income Below Poverty Among Single-Parent Households in White Haven borough
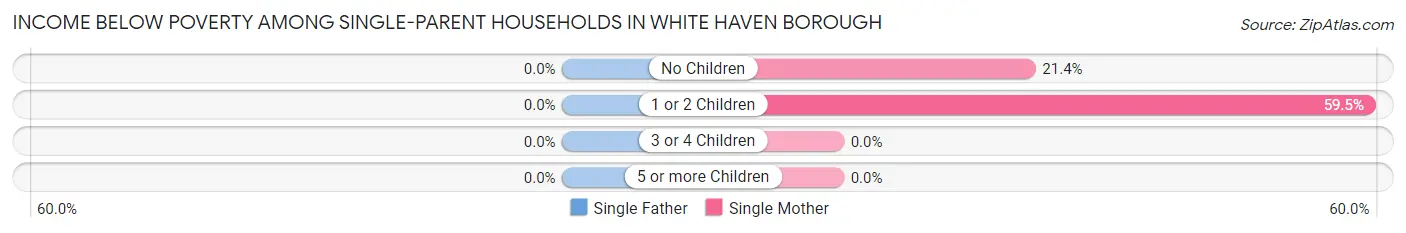
| Children | Single Father | Single Mother |
| No Children | 0 (0.0%) | 3 (21.4%) |
| 1 or 2 Children | 0 (0.0%) | 22 (59.5%) |
| 3 or 4 Children | 0 (0.0%) | 0 (0.0%) |
| 5 or more Children | 0 (0.0%) | 0 (0.0%) |
| Total | 0 (0.0%) | 25 (49.0%) |
Income Below Poverty Among Married-Couple vs Single-Parent Households in White Haven borough
The poverty data for White Haven borough shows that 9 of the married-couple family households (4.6%) and 25 of the single-parent households (29.4%) are living below the poverty level. Within the married-couple family households, those with 3 or 4 children have the highest poverty rate, with 9 households (56.2%) falling below the poverty line. Among the single-parent households, those with 1 or 2 children have the highest poverty rate, with 22 household (43.1%) living below poverty.
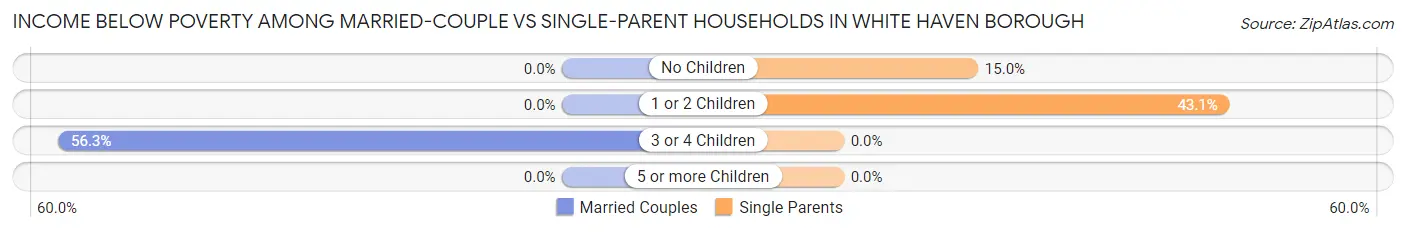
| Children | Married-Couple Families | Single-Parent Households |
| No Children | 0 (0.0%) | 3 (15.0%) |
| 1 or 2 Children | 0 (0.0%) | 22 (43.1%) |
| 3 or 4 Children | 9 (56.2%) | 0 (0.0%) |
| 5 or more Children | 0 (0.0%) | 0 (0.0%) |
| Total | 9 (4.6%) | 25 (29.4%) |
Race in White Haven borough
The most populous races in White Haven borough are White / Caucasian (1,030 | 96.4%), Hispanic or Latino (69 | 6.5%), and Two or more Races (23 | 2.1%).
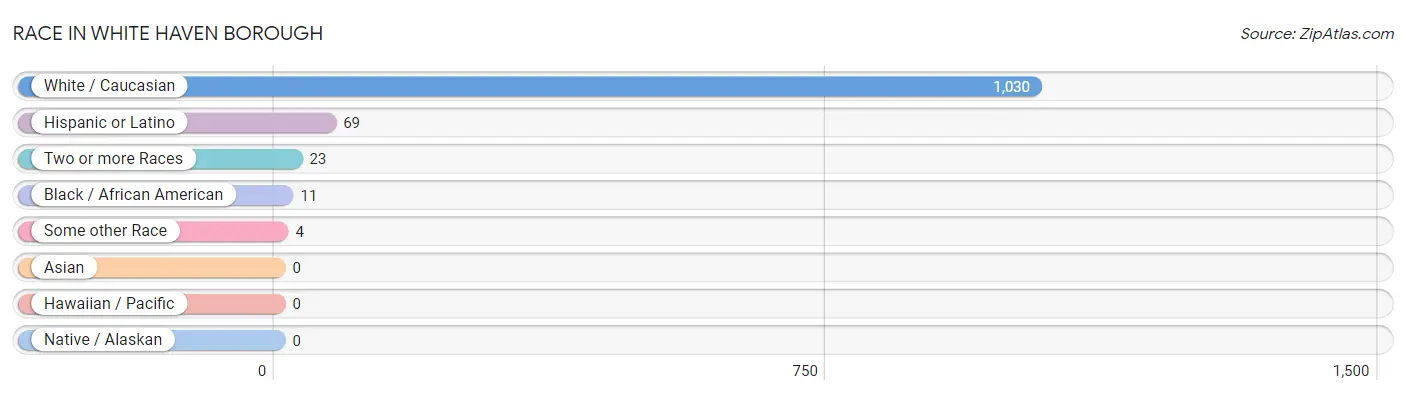
| Race | # Population | % Population |
| Asian | 0 | 0.0% |
| Black / African American | 11 | 1.0% |
| Hawaiian / Pacific | 0 | 0.0% |
| Hispanic or Latino | 69 | 6.5% |
| Native / Alaskan | 0 | 0.0% |
| White / Caucasian | 1,030 | 96.4% |
| Two or more Races | 23 | 2.1% |
| Some other Race | 4 | 0.4% |
| Total | 1,068 | 100.0% |
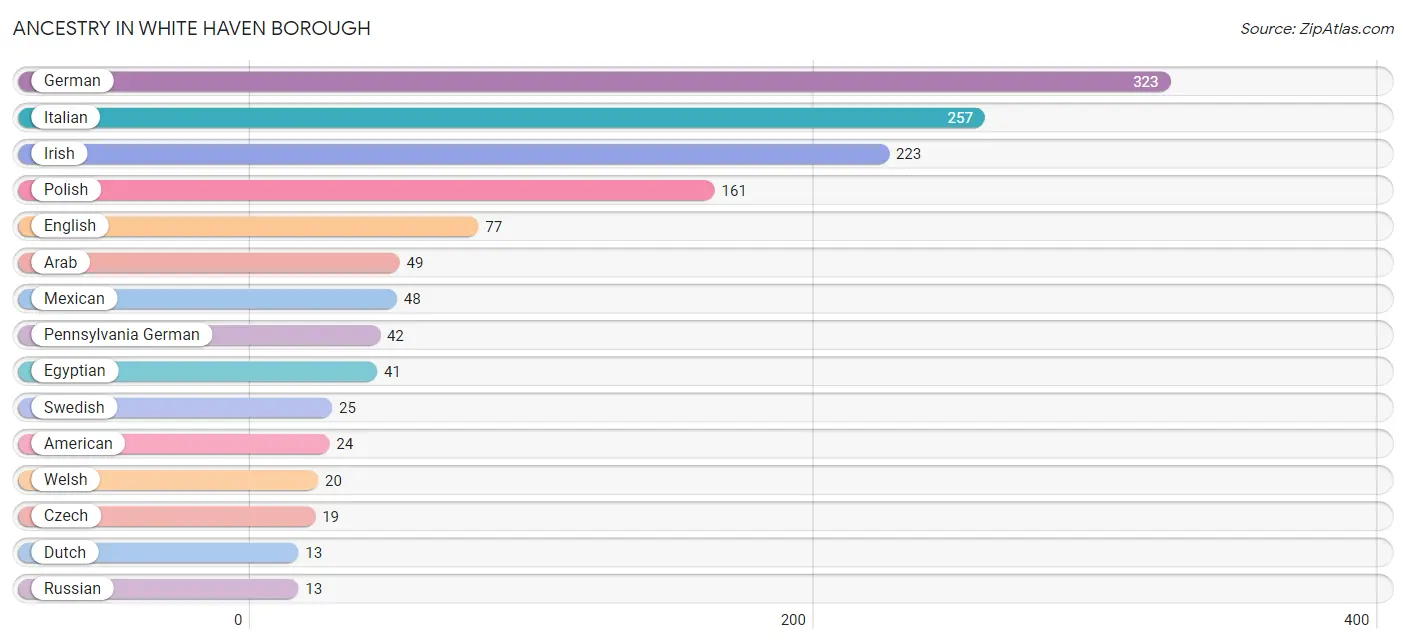
Ancestry in White Haven borough
The most populous ancestries reported in White Haven borough are German (323 | 30.2%), Italian (257 | 24.1%), Irish (223 | 20.9%), Polish (161 | 15.1%), and English (77 | 7.2%), together accounting for 97.5% of all White Haven borough residents.
| Ancestry | # Population | % Population |
| American | 24 | 2.2% |
| Arab | 49 | 4.6% |
| British | 7 | 0.7% |
| Cherokee | 2 | 0.2% |
| Croatian | 4 | 0.4% |
| Cypriot | 3 | 0.3% |
| Czech | 19 | 1.8% |
| Dominican | 4 | 0.4% |
| Dutch | 13 | 1.2% |
| Eastern European | 5 | 0.5% |
| Egyptian | 41 | 3.8% |
| English | 77 | 7.2% |
| European | 2 | 0.2% |
| French | 4 | 0.4% |
| French Canadian | 2 | 0.2% |
| German | 323 | 30.2% |
| Hungarian | 3 | 0.3% |
| Irish | 223 | 20.9% |
| Iroquois | 3 | 0.3% |
| Italian | 257 | 24.1% |
| Korean | 3 | 0.3% |
| Lithuanian | 8 | 0.7% |
| Mexican | 48 | 4.5% |
| Pennsylvania German | 42 | 3.9% |
| Peruvian | 9 | 0.8% |
| Polish | 161 | 15.1% |
| Puerto Rican | 7 | 0.7% |
| Russian | 13 | 1.2% |
| Scottish | 12 | 1.1% |
| Slavic | 3 | 0.3% |
| Slovak | 9 | 0.8% |
| South American | 9 | 0.8% |
| Swedish | 25 | 2.3% |
| Ukrainian | 5 | 0.5% |
| Welsh | 20 | 1.9% |
| Yugoslavian | 3 | 0.3% | View All 36 Rows |
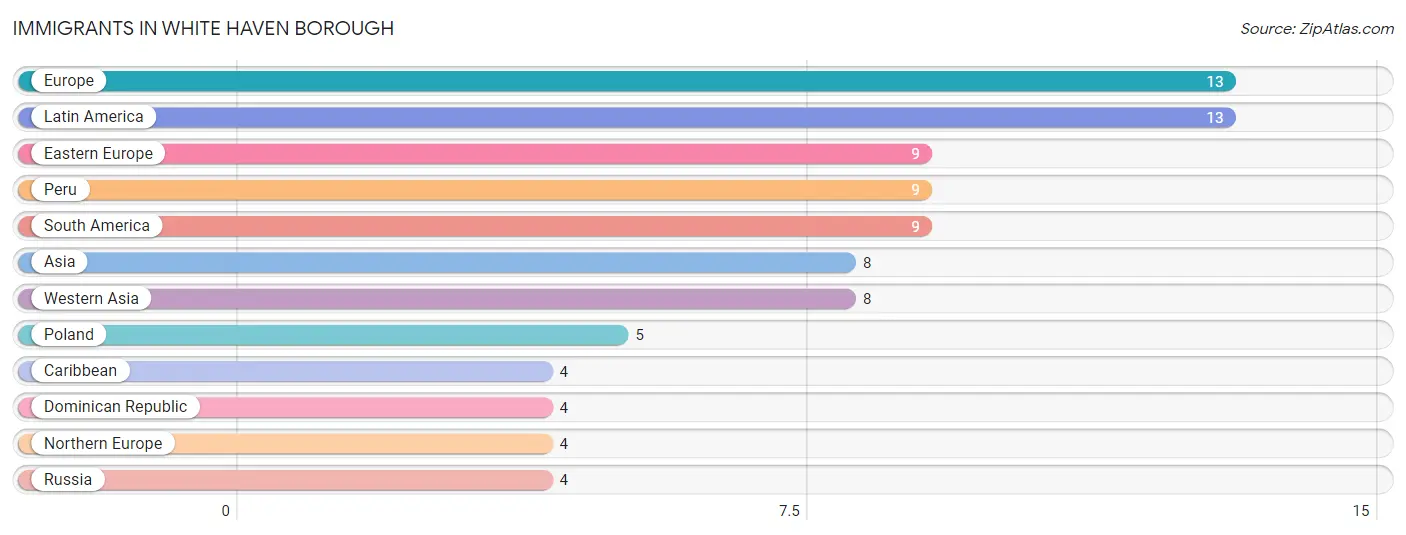
Immigrants in White Haven borough
The most numerous immigrant groups reported in White Haven borough came from Europe (13 | 1.2%), Latin America (13 | 1.2%), Eastern Europe (9 | 0.8%), Peru (9 | 0.8%), and South America (9 | 0.8%), together accounting for 5.0% of all White Haven borough residents.
| Immigration Origin | # Population | % Population |
| Asia | 8 | 0.7% |
| Caribbean | 4 | 0.4% |
| Dominican Republic | 4 | 0.4% |
| Eastern Europe | 9 | 0.8% |
| Europe | 13 | 1.2% |
| Latin America | 13 | 1.2% |
| Northern Europe | 4 | 0.4% |
| Peru | 9 | 0.8% |
| Poland | 5 | 0.5% |
| Russia | 4 | 0.4% |
| South America | 9 | 0.8% |
| Western Asia | 8 | 0.7% | View All 12 Rows |
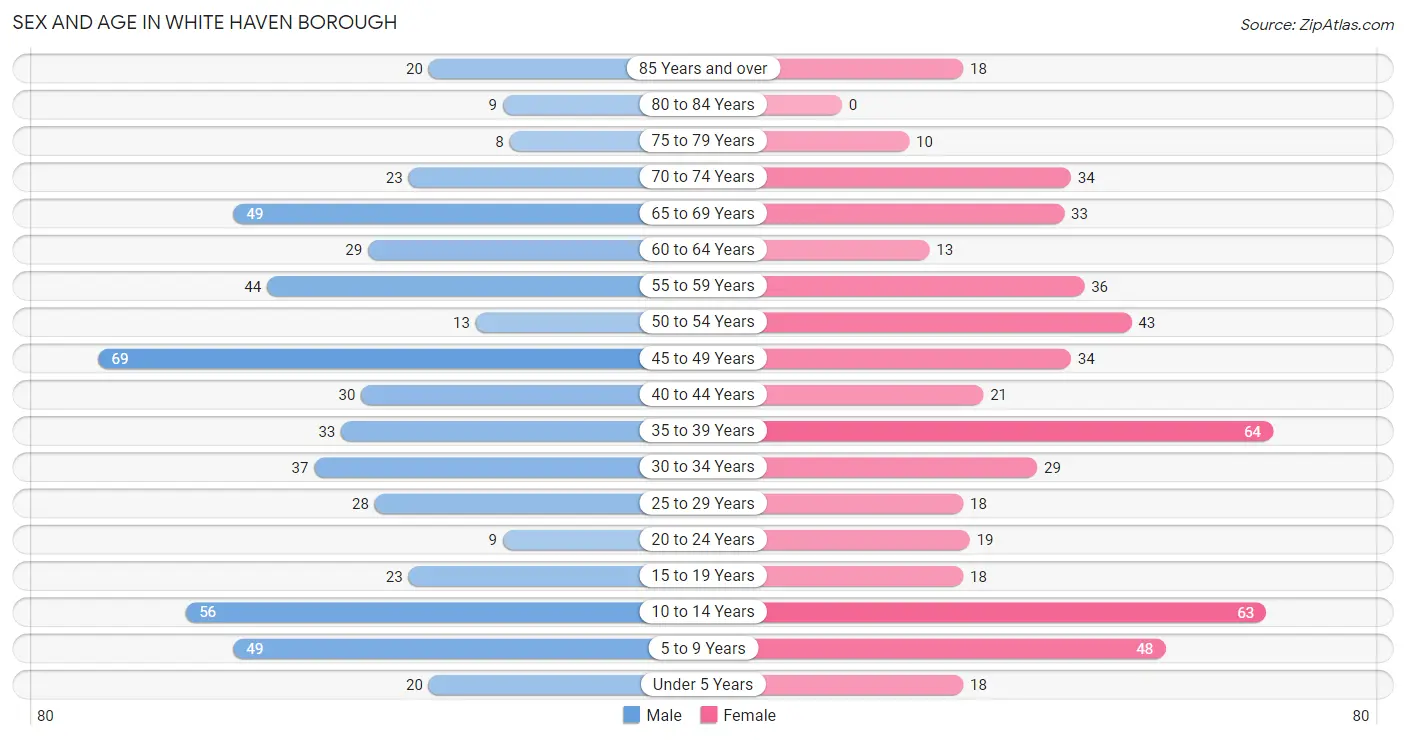
Sex and Age in White Haven borough
Sex and Age in White Haven borough
The most populous age groups in White Haven borough are 45 to 49 Years (69 | 12.6%) for men and 35 to 39 Years (64 | 12.3%) for women.
| Age Bracket | Male | Female |
| Under 5 Years | 20 (3.6%) | 18 (3.5%) |
| 5 to 9 Years | 49 (8.9%) | 48 (9.2%) |
| 10 to 14 Years | 56 (10.2%) | 63 (12.1%) |
| 15 to 19 Years | 23 (4.2%) | 18 (3.5%) |
| 20 to 24 Years | 9 (1.6%) | 19 (3.7%) |
| 25 to 29 Years | 28 (5.1%) | 18 (3.5%) |
| 30 to 34 Years | 37 (6.7%) | 29 (5.6%) |
| 35 to 39 Years | 33 (6.0%) | 64 (12.3%) |
| 40 to 44 Years | 30 (5.5%) | 21 (4.1%) |
| 45 to 49 Years | 69 (12.6%) | 34 (6.6%) |
| 50 to 54 Years | 13 (2.4%) | 43 (8.3%) |
| 55 to 59 Years | 44 (8.0%) | 36 (6.9%) |
| 60 to 64 Years | 29 (5.3%) | 13 (2.5%) |
| 65 to 69 Years | 49 (8.9%) | 33 (6.4%) |
| 70 to 74 Years | 23 (4.2%) | 34 (6.6%) |
| 75 to 79 Years | 8 (1.5%) | 10 (1.9%) |
| 80 to 84 Years | 9 (1.6%) | 0 (0.0%) |
| 85 Years and over | 20 (3.6%) | 18 (3.5%) |
| Total | 549 (100.0%) | 519 (100.0%) |
Families and Households in White Haven borough
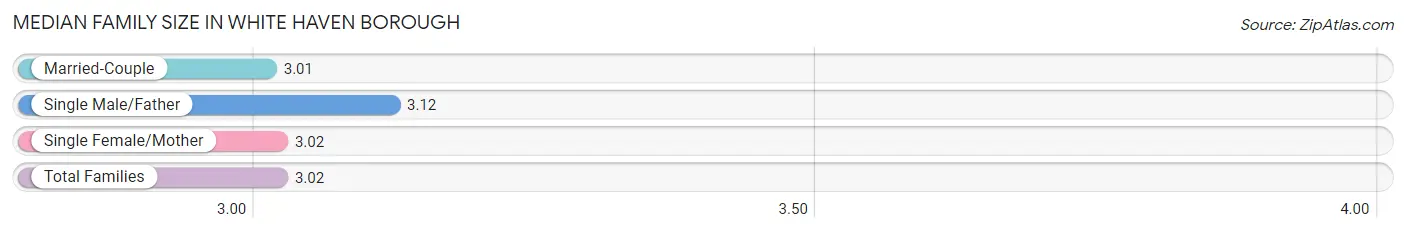
Median Family Size in White Haven borough
The median family size in White Haven borough is 3.02 persons per family, with single male/father families (34 | 12.1%) accounting for the largest median family size of 3.12 persons per family. On the other hand, married-couple families (197 | 69.9%) represent the smallest median family size with 3.01 persons per family.
| Family Type | # Families | Family Size |
| Married-Couple | 197 (69.9%) | 3.01 |
| Single Male/Father | 34 (12.1%) | 3.12 |
| Single Female/Mother | 51 (18.1%) | 3.02 |
| Total Families | 282 (100.0%) | 3.02 |
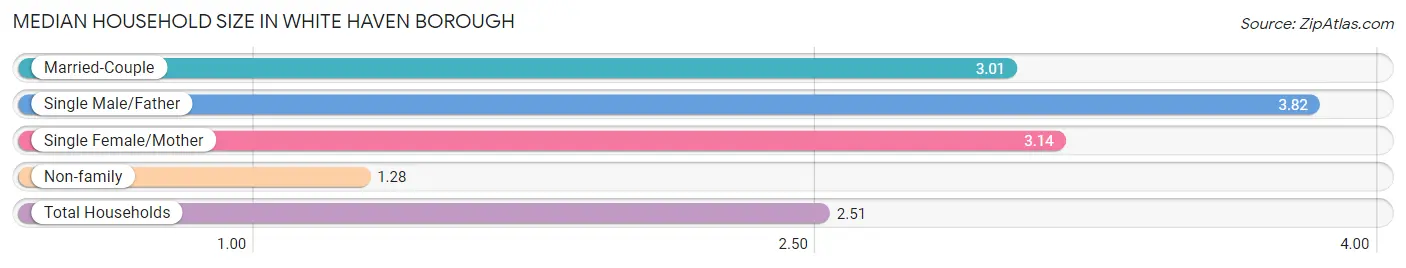
Median Household Size in White Haven borough
The median household size in White Haven borough is 2.51 persons per household, with single male/father households (34 | 8.0%) accounting for the largest median household size of 3.82 persons per household. non-family households (143 | 33.7%) represent the smallest median household size with 1.28 persons per household.
| Household Type | # Households | Household Size |
| Married-Couple | 197 (46.4%) | 3.01 |
| Single Male/Father | 34 (8.0%) | 3.82 |
| Single Female/Mother | 51 (12.0%) | 3.14 |
| Non-family | 143 (33.7%) | 1.28 |
| Total Households | 425 (100.0%) | 2.51 |
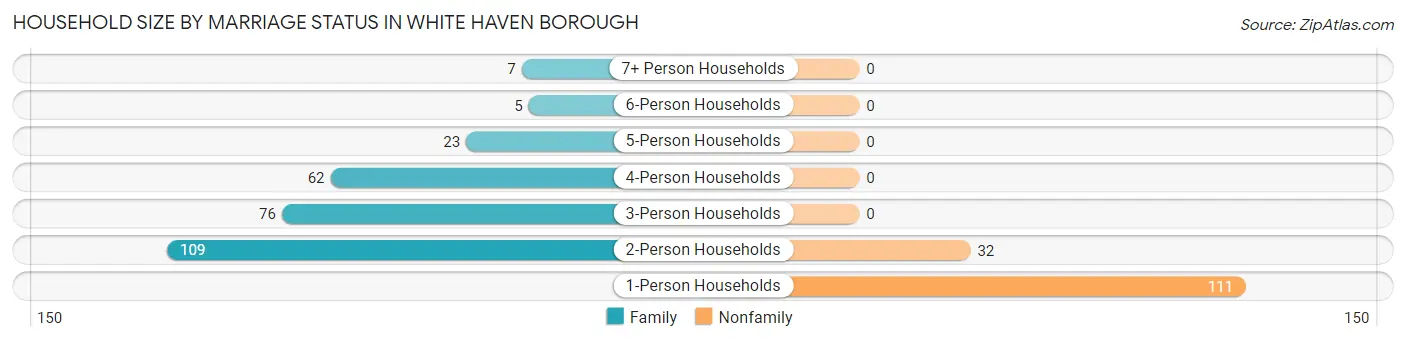
Household Size by Marriage Status in White Haven borough
Out of a total of 425 households in White Haven borough, 282 (66.3%) are family households, while 143 (33.7%) are nonfamily households. The most numerous type of family households are 2-person households, comprising 109, and the most common type of nonfamily households are 1-person households, comprising 111.
| Household Size | Family Households | Nonfamily Households |
| 1-Person Households | - | 111 (26.1%) |
| 2-Person Households | 109 (25.7%) | 32 (7.5%) |
| 3-Person Households | 76 (17.9%) | 0 (0.0%) |
| 4-Person Households | 62 (14.6%) | 0 (0.0%) |
| 5-Person Households | 23 (5.4%) | 0 (0.0%) |
| 6-Person Households | 5 (1.2%) | 0 (0.0%) |
| 7+ Person Households | 7 (1.7%) | 0 (0.0%) |
| Total | 282 (66.3%) | 143 (33.7%) |
Female Fertility in White Haven borough
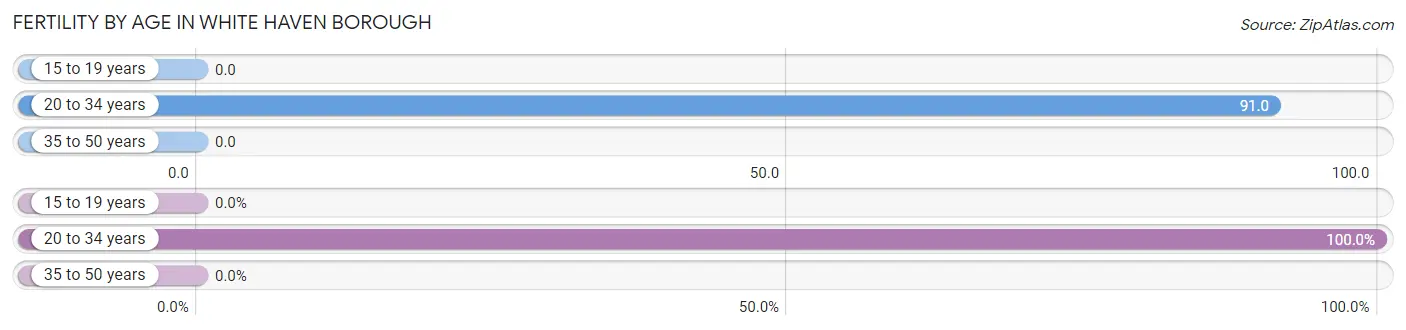
Fertility by Age in White Haven borough
Average fertility rate in White Haven borough is 30.0 births per 1,000 women. Women in the age bracket of 20 to 34 years have the highest fertility rate with 91.0 births per 1,000 women. Women in the age bracket of 20 to 34 years acount for 100.0% of all women with births.
| Age Bracket | Women with Births | Births / 1,000 Women |
| 15 to 19 years | 0 (0.0%) | 0.0 |
| 20 to 34 years | 6 (100.0%) | 91.0 |
| 35 to 50 years | 0 (0.0%) | 0.0 |
| Total | 6 (100.0%) | 30.0 |
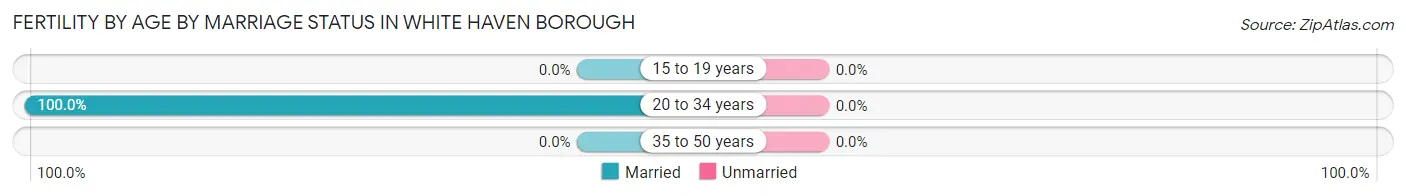
Fertility by Age by Marriage Status in White Haven borough
| Age Bracket | Married | Unmarried |
| 15 to 19 years | 0 (0.0%) | 0 (0.0%) |
| 20 to 34 years | 6 (100.0%) | 0 (0.0%) |
| 35 to 50 years | 0 (0.0%) | 0 (0.0%) |
| Total | 6 (100.0%) | 0 (0.0%) |
Fertility by Education in White Haven borough
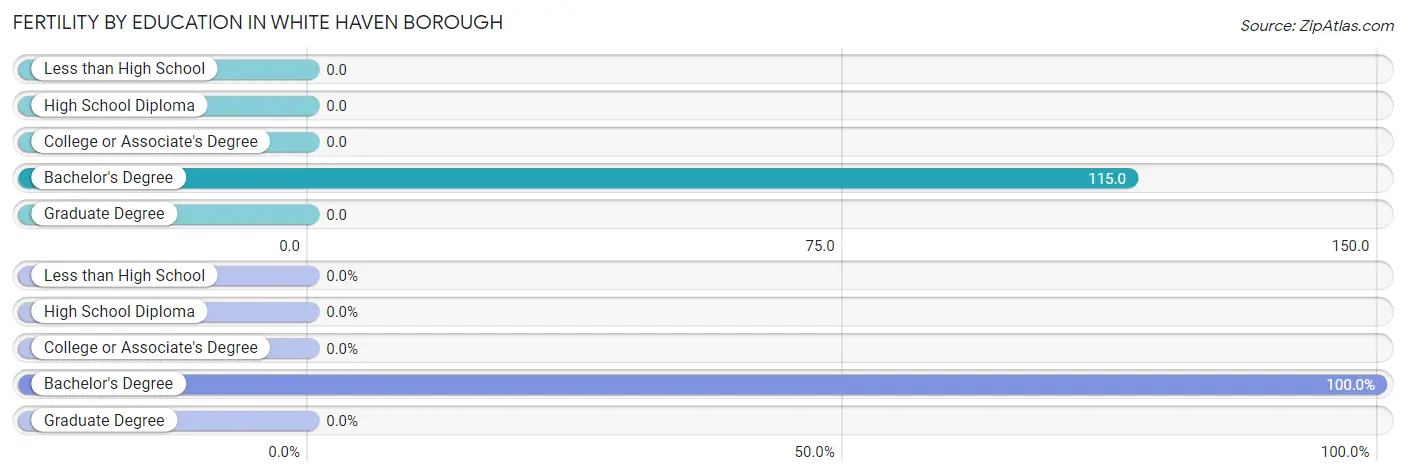
| Educational Attainment | Women with Births | Births / 1,000 Women |
| Less than High School | 0 (0.0%) | 0.0 |
| High School Diploma | 0 (0.0%) | 0.0 |
| College or Associate's Degree | 0 (0.0%) | 0.0 |
| Bachelor's Degree | 6 (100.0%) | 115.0 |
| Graduate Degree | 0 (0.0%) | 0.0 |
| Total | 6 (100.0%) | 30.0 |
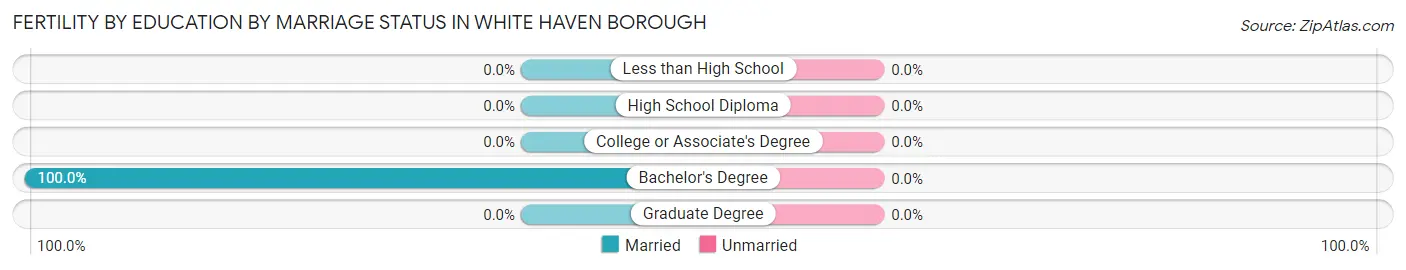
Fertility by Education by Marriage Status in White Haven borough
| Educational Attainment | Married | Unmarried |
| Less than High School | 0 (0.0%) | 0 (0.0%) |
| High School Diploma | 0 (0.0%) | 0 (0.0%) |
| College or Associate's Degree | 0 (0.0%) | 0 (0.0%) |
| Bachelor's Degree | 6 (100.0%) | 0 (0.0%) |
| Graduate Degree | 0 (0.0%) | 0 (0.0%) |
| Total | 6 (100.0%) | 0 (0.0%) |
Employment Characteristics in White Haven borough
Employment by Class of Employer in White Haven borough
Among the 426 employed individuals in White Haven borough, private company employees (290 | 68.1%), not-for-profit organizations (54 | 12.7%), and state government employees (32 | 7.5%) make up the most common classes of employment.
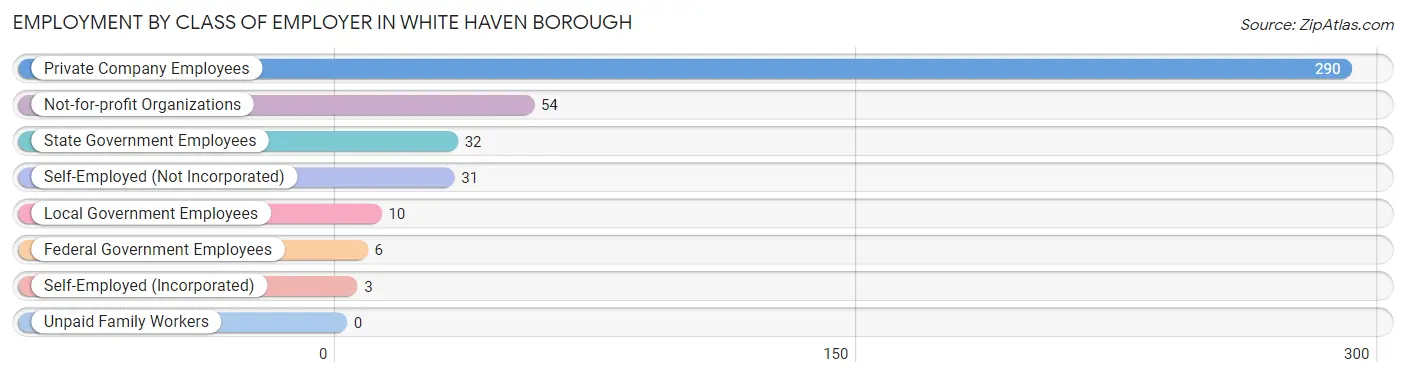
| Employer Class | # Employees | % Employees |
| Private Company Employees | 290 | 68.1% |
| Self-Employed (Incorporated) | 3 | 0.7% |
| Self-Employed (Not Incorporated) | 31 | 7.3% |
| Not-for-profit Organizations | 54 | 12.7% |
| Local Government Employees | 10 | 2.4% |
| State Government Employees | 32 | 7.5% |
| Federal Government Employees | 6 | 1.4% |
| Unpaid Family Workers | 0 | 0.0% |
| Total | 426 | 100.0% |
Employment Status by Age in White Haven borough
According to the labor force statistics for White Haven borough, out of the total population over 16 years of age (807), 57.7% or 466 individuals are in the labor force, with 2.8% or 13 of them unemployed. The age group with the highest labor force participation rate is 45 to 54 years, with 85.5% or 136 individuals in the labor force. Within the labor force, the 16 to 19 years age range has the highest percentage of unemployed individuals, with 43.8% or 7 of them being unemployed.
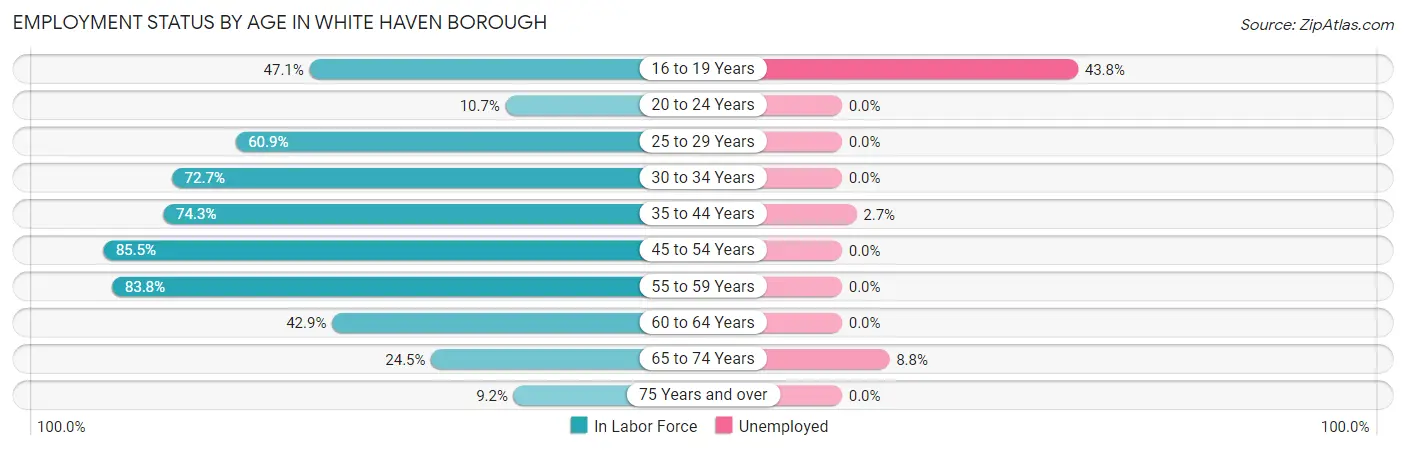
| Age Bracket | In Labor Force | Unemployed |
| 16 to 19 Years | 16 (47.1%) | 7 (43.8%) |
| 20 to 24 Years | 3 (10.7%) | 0 (0.0%) |
| 25 to 29 Years | 28 (60.9%) | 0 (0.0%) |
| 30 to 34 Years | 48 (72.7%) | 0 (0.0%) |
| 35 to 44 Years | 110 (74.3%) | 3 (2.7%) |
| 45 to 54 Years | 136 (85.5%) | 0 (0.0%) |
| 55 to 59 Years | 67 (83.8%) | 0 (0.0%) |
| 60 to 64 Years | 18 (42.9%) | 0 (0.0%) |
| 65 to 74 Years | 34 (24.5%) | 3 (8.8%) |
| 75 Years and over | 6 (9.2%) | 0 (0.0%) |
| Total | 466 (57.7%) | 13 (2.8%) |
Employment Status by Educational Attainment in White Haven borough
According to labor force statistics for White Haven borough, 75.2% of individuals (407) out of the total population between 25 and 64 years of age (541) are in the labor force, with 0.7% or 3 of them being unemployed. The group with the highest labor force participation rate are those with the educational attainment of college / associate degree, with 88.4% or 167 individuals in the labor force. Within the labor force, individuals with high school diploma education have the highest percentage of unemployment, with 1.9% or 3 of them being unemployed.
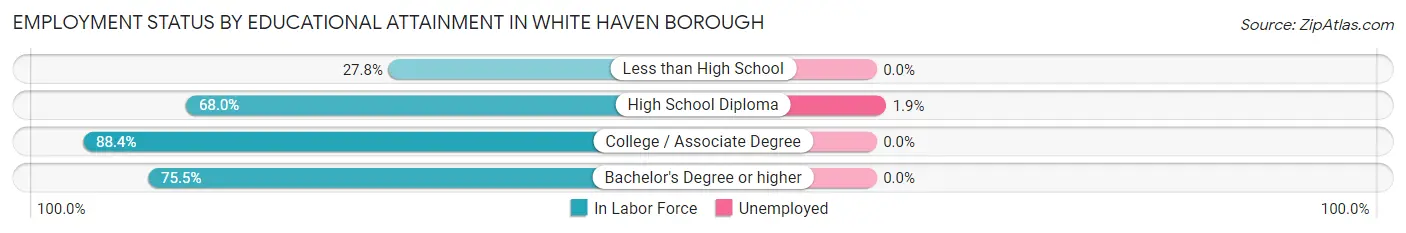
| Educational Attainment | In Labor Force | Unemployed |
| Less than High School | 5 (27.8%) | 0 (0.0%) |
| High School Diploma | 155 (68.0%) | 4 (1.9%) |
| College / Associate Degree | 167 (88.4%) | 0 (0.0%) |
| Bachelor's Degree or higher | 80 (75.5%) | 0 (0.0%) |
| Total | 407 (75.2%) | 4 (0.7%) |
Employment Occupations by Sex in White Haven borough
Management, Business, Science and Arts Occupations
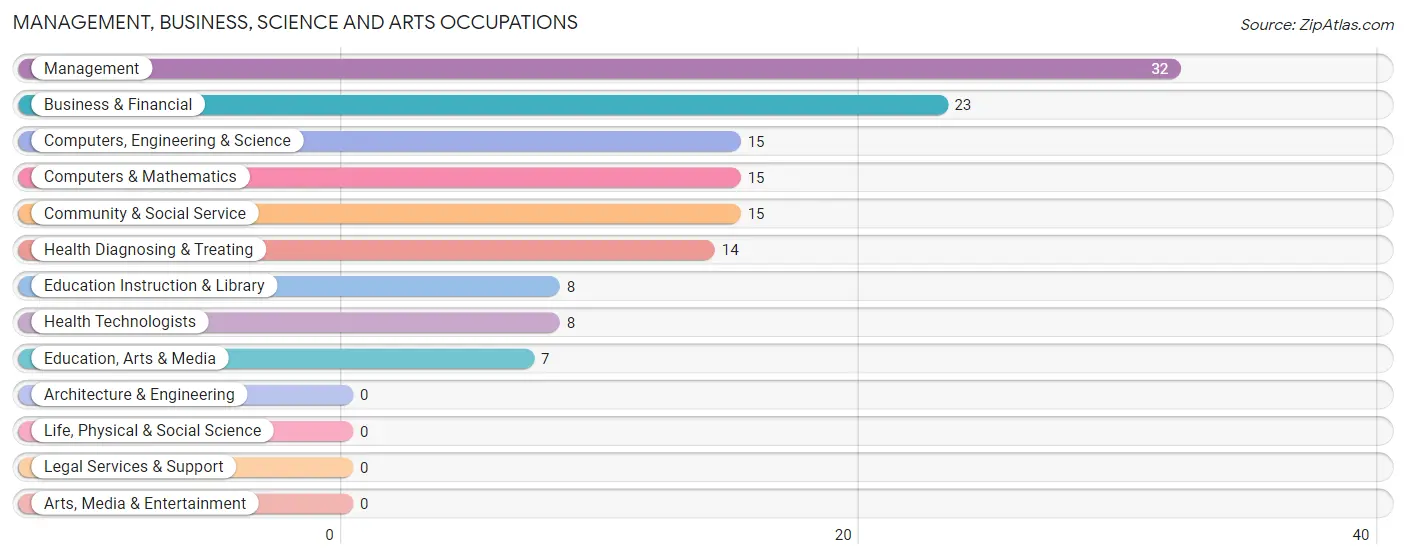
The most common Management, Business, Science and Arts occupations in White Haven borough are Management (32 | 7.1%), Business & Financial (23 | 5.1%), Computers, Engineering & Science (15 | 3.3%), Computers & Mathematics (15 | 3.3%), and Community & Social Service (15 | 3.3%).
Management, Business, Science and Arts Occupations by Sex
Within the Management, Business, Science and Arts occupations in White Haven borough, the most male-oriented occupations are Computers, Engineering & Science (100.0%), Computers & Mathematics (100.0%), and Education Instruction & Library (50.0%), while the most female-oriented occupations are Health Diagnosing & Treating (100.0%), Health Technologists (100.0%), and Education, Arts & Media (57.1%).
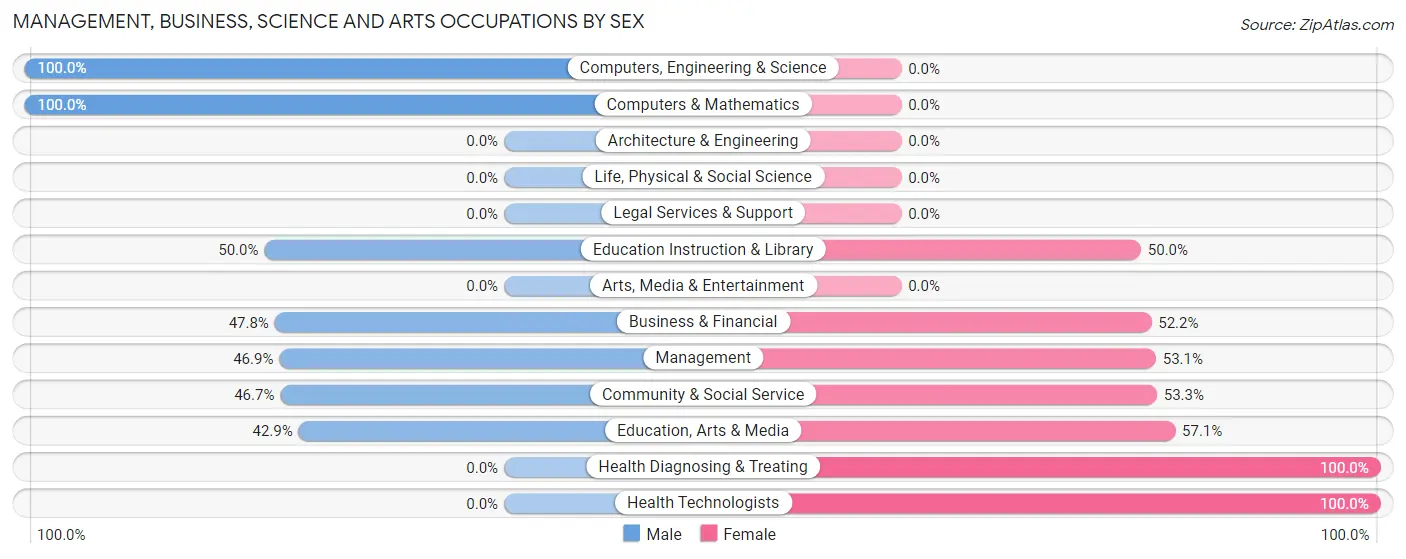
| Occupation | Male | Female |
| Management | 15 (46.9%) | 17 (53.1%) |
| Business & Financial | 11 (47.8%) | 12 (52.2%) |
| Computers, Engineering & Science | 15 (100.0%) | 0 (0.0%) |
| Computers & Mathematics | 15 (100.0%) | 0 (0.0%) |
| Architecture & Engineering | 0 (0.0%) | 0 (0.0%) |
| Life, Physical & Social Science | 0 (0.0%) | 0 (0.0%) |
| Community & Social Service | 7 (46.7%) | 8 (53.3%) |
| Education, Arts & Media | 3 (42.9%) | 4 (57.1%) |
| Legal Services & Support | 0 (0.0%) | 0 (0.0%) |
| Education Instruction & Library | 4 (50.0%) | 4 (50.0%) |
| Arts, Media & Entertainment | 0 (0.0%) | 0 (0.0%) |
| Health Diagnosing & Treating | 0 (0.0%) | 14 (100.0%) |
| Health Technologists | 0 (0.0%) | 8 (100.0%) |
| Total (Category) | 48 (48.5%) | 51 (51.5%) |
| Total (Overall) | 249 (55.0%) | 204 (45.0%) |
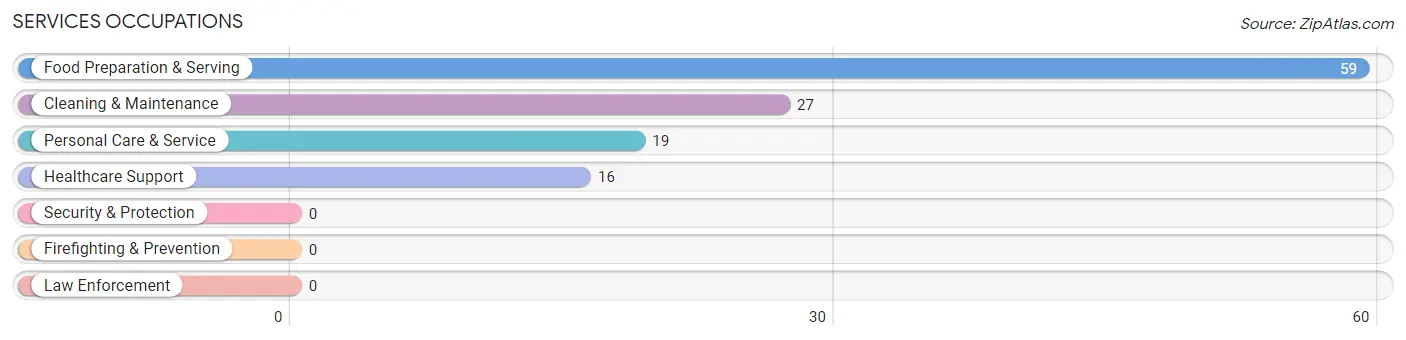
Services Occupations
The most common Services occupations in White Haven borough are Food Preparation & Serving (59 | 13.0%), Cleaning & Maintenance (27 | 6.0%), Personal Care & Service (19 | 4.2%), and Healthcare Support (16 | 3.5%).
Services Occupations by Sex
Within the Services occupations in White Haven borough, the most male-oriented occupations are Cleaning & Maintenance (59.3%), and Food Preparation & Serving (50.8%), while the most female-oriented occupations are Healthcare Support (100.0%), Personal Care & Service (100.0%), and Food Preparation & Serving (49.1%).
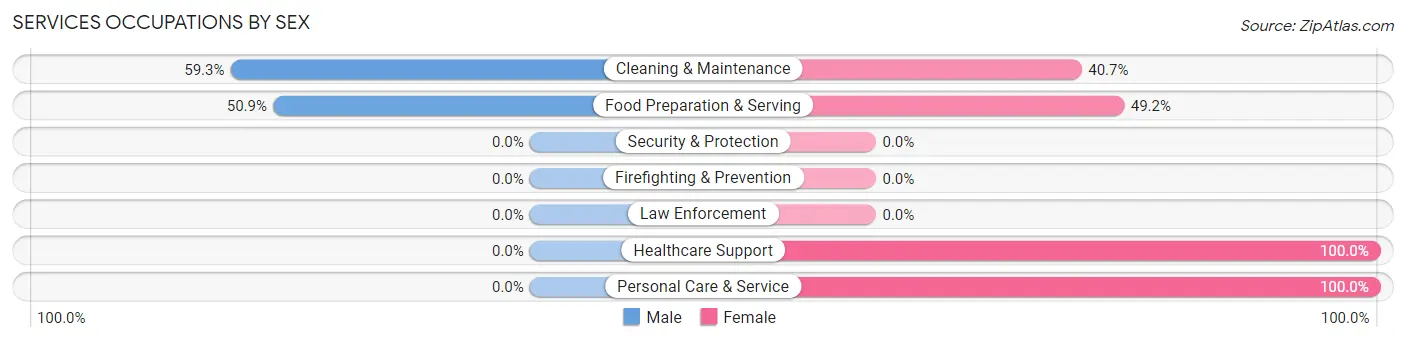
| Occupation | Male | Female |
| Healthcare Support | 0 (0.0%) | 16 (100.0%) |
| Security & Protection | 0 (0.0%) | 0 (0.0%) |
| Firefighting & Prevention | 0 (0.0%) | 0 (0.0%) |
| Law Enforcement | 0 (0.0%) | 0 (0.0%) |
| Food Preparation & Serving | 30 (50.8%) | 29 (49.1%) |
| Cleaning & Maintenance | 16 (59.3%) | 11 (40.7%) |
| Personal Care & Service | 0 (0.0%) | 19 (100.0%) |
| Total (Category) | 46 (38.0%) | 75 (62.0%) |
| Total (Overall) | 249 (55.0%) | 204 (45.0%) |
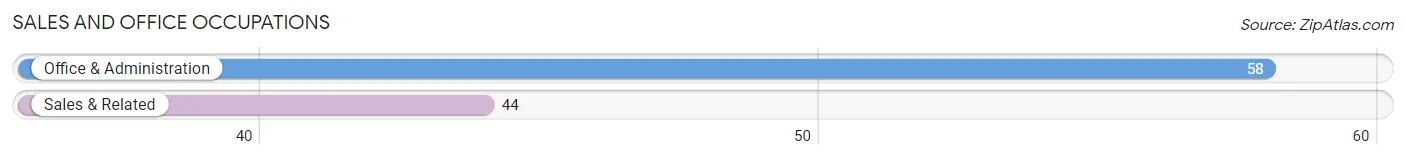
Sales and Office Occupations
The most common Sales and Office occupations in White Haven borough are Office & Administration (58 | 12.8%), and Sales & Related (44 | 9.7%).
Sales and Office Occupations by Sex
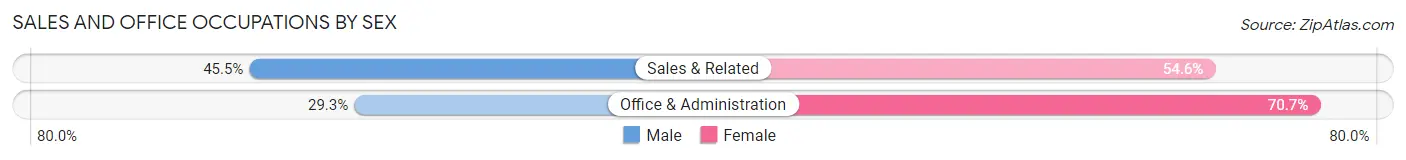
| Occupation | Male | Female |
| Sales & Related | 20 (45.5%) | 24 (54.5%) |
| Office & Administration | 17 (29.3%) | 41 (70.7%) |
| Total (Category) | 37 (36.3%) | 65 (63.7%) |
| Total (Overall) | 249 (55.0%) | 204 (45.0%) |
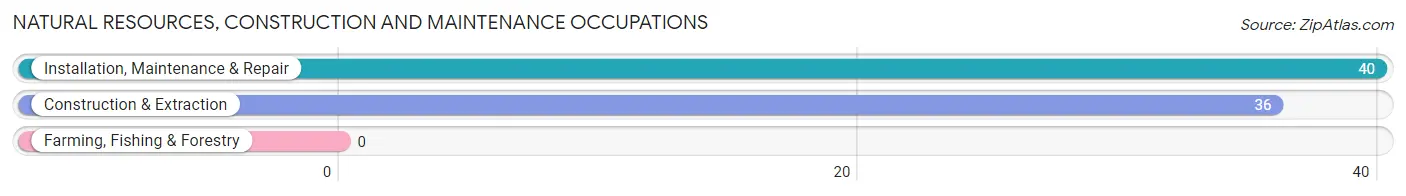
Natural Resources, Construction and Maintenance Occupations
The most common Natural Resources, Construction and Maintenance occupations in White Haven borough are Installation, Maintenance & Repair (40 | 8.8%), and Construction & Extraction (36 | 8.0%).
Natural Resources, Construction and Maintenance Occupations by Sex
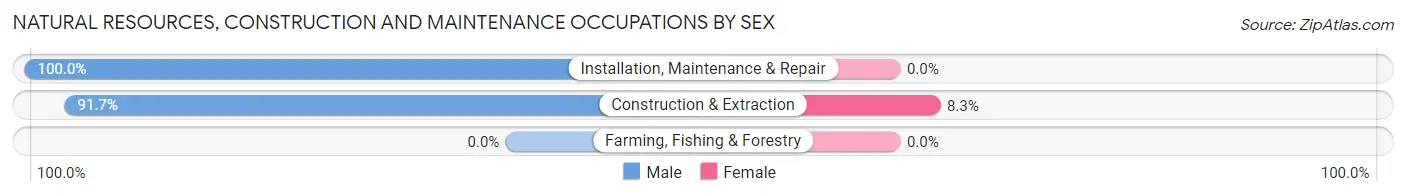
| Occupation | Male | Female |
| Farming, Fishing & Forestry | 0 (0.0%) | 0 (0.0%) |
| Construction & Extraction | 33 (91.7%) | 3 (8.3%) |
| Installation, Maintenance & Repair | 40 (100.0%) | 0 (0.0%) |
| Total (Category) | 73 (96.1%) | 3 (4.0%) |
| Total (Overall) | 249 (55.0%) | 204 (45.0%) |
Production, Transportation and Moving Occupations
The most common Production, Transportation and Moving occupations in White Haven borough are Production (28 | 6.2%), Material Moving (17 | 3.7%), and Transportation (10 | 2.2%).
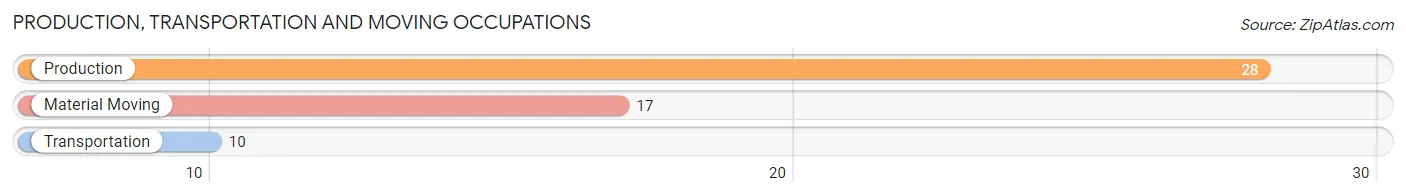
Production, Transportation and Moving Occupations by Sex
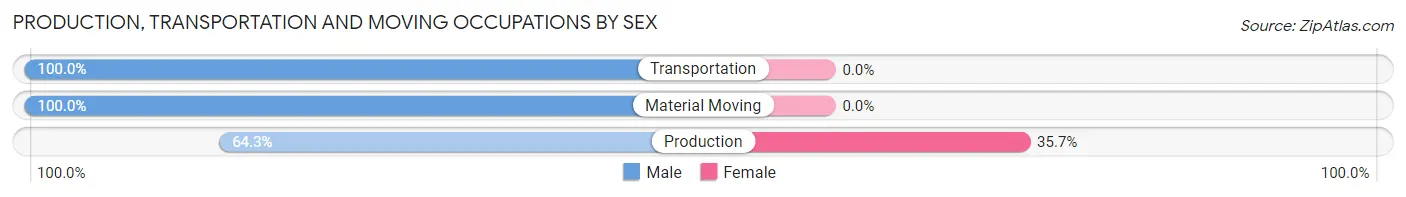
| Occupation | Male | Female |
| Production | 18 (64.3%) | 10 (35.7%) |
| Transportation | 10 (100.0%) | 0 (0.0%) |
| Material Moving | 17 (100.0%) | 0 (0.0%) |
| Total (Category) | 45 (81.8%) | 10 (18.2%) |
| Total (Overall) | 249 (55.0%) | 204 (45.0%) |
Employment Industries by Sex in White Haven borough
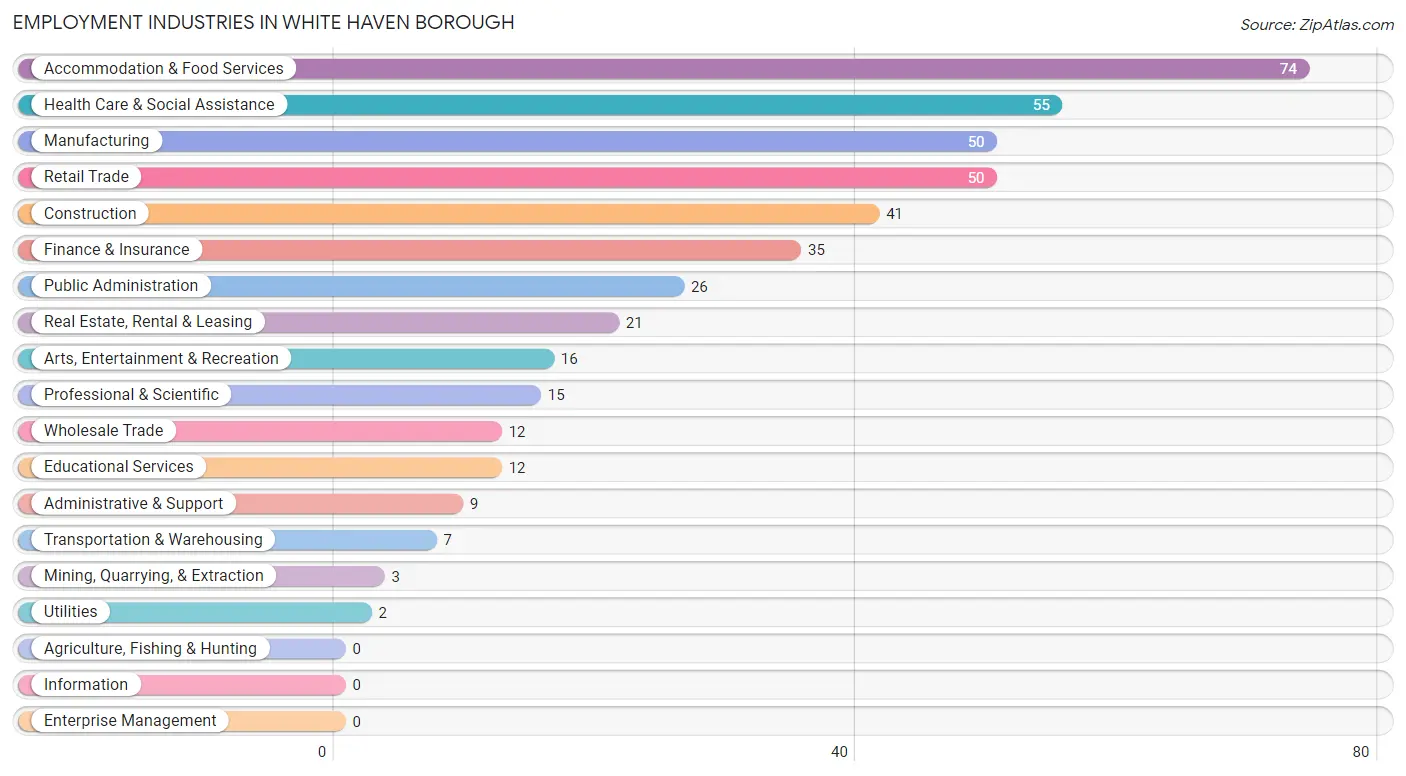
Employment Industries in White Haven borough
The major employment industries in White Haven borough include Accommodation & Food Services (74 | 16.3%), Health Care & Social Assistance (55 | 12.1%), Manufacturing (50 | 11.0%), Retail Trade (50 | 11.0%), and Construction (41 | 9.0%).
Employment Industries by Sex in White Haven borough
The White Haven borough industries that see more men than women are Mining, Quarrying, & Extraction (100.0%), Construction (100.0%), and Transportation & Warehousing (100.0%), whereas the industries that tend to have a higher number of women are Administrative & Support (100.0%), Arts, Entertainment & Recreation (100.0%), and Health Care & Social Assistance (94.6%).
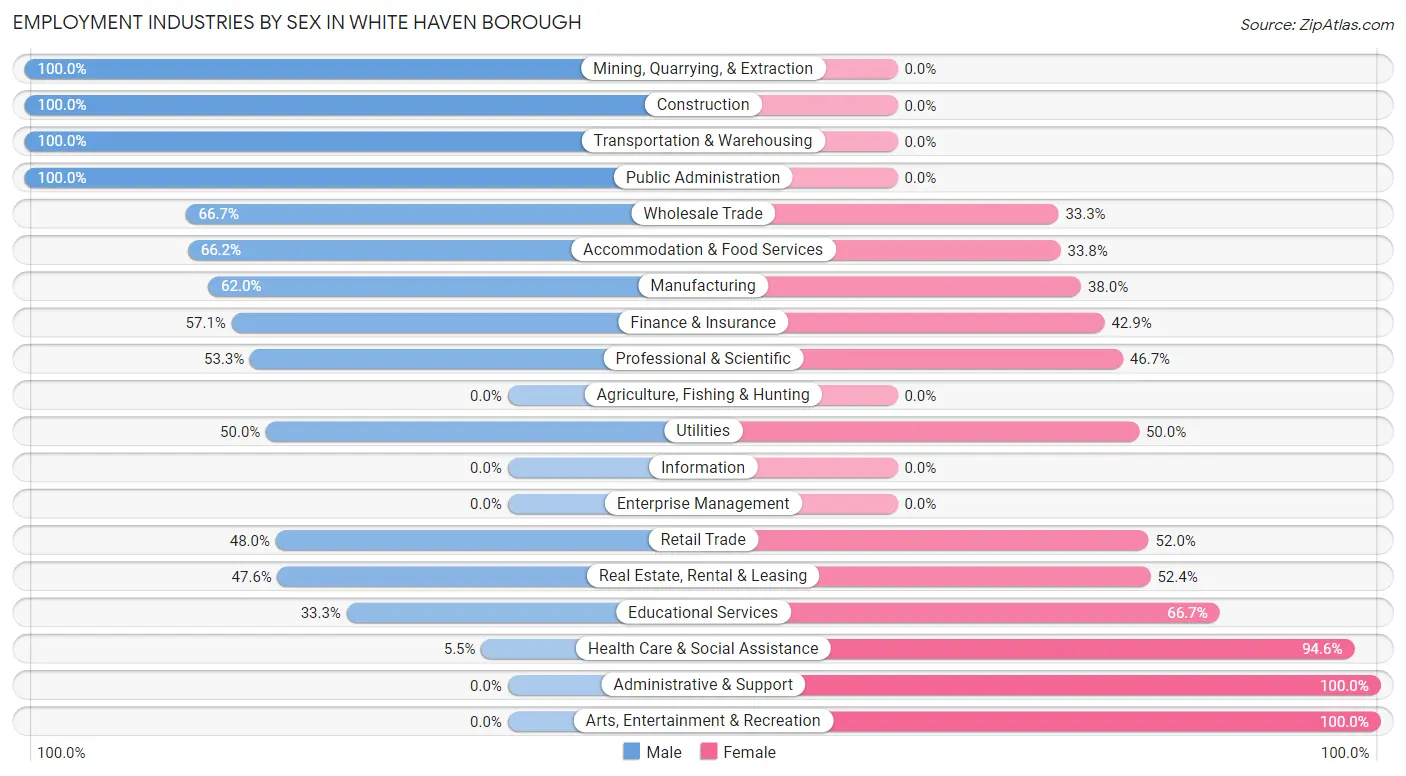
| Industry | Male | Female |
| Agriculture, Fishing & Hunting | 0 (0.0%) | 0 (0.0%) |
| Mining, Quarrying, & Extraction | 3 (100.0%) | 0 (0.0%) |
| Construction | 41 (100.0%) | 0 (0.0%) |
| Manufacturing | 31 (62.0%) | 19 (38.0%) |
| Wholesale Trade | 8 (66.7%) | 4 (33.3%) |
| Retail Trade | 24 (48.0%) | 26 (52.0%) |
| Transportation & Warehousing | 7 (100.0%) | 0 (0.0%) |
| Utilities | 1 (50.0%) | 1 (50.0%) |
| Information | 0 (0.0%) | 0 (0.0%) |
| Finance & Insurance | 20 (57.1%) | 15 (42.9%) |
| Real Estate, Rental & Leasing | 10 (47.6%) | 11 (52.4%) |
| Professional & Scientific | 8 (53.3%) | 7 (46.7%) |
| Enterprise Management | 0 (0.0%) | 0 (0.0%) |
| Administrative & Support | 0 (0.0%) | 9 (100.0%) |
| Educational Services | 4 (33.3%) | 8 (66.7%) |
| Health Care & Social Assistance | 3 (5.4%) | 52 (94.6%) |
| Arts, Entertainment & Recreation | 0 (0.0%) | 16 (100.0%) |
| Accommodation & Food Services | 49 (66.2%) | 25 (33.8%) |
| Public Administration | 26 (100.0%) | 0 (0.0%) |
| Total | 249 (55.0%) | 204 (45.0%) |
Education in White Haven borough
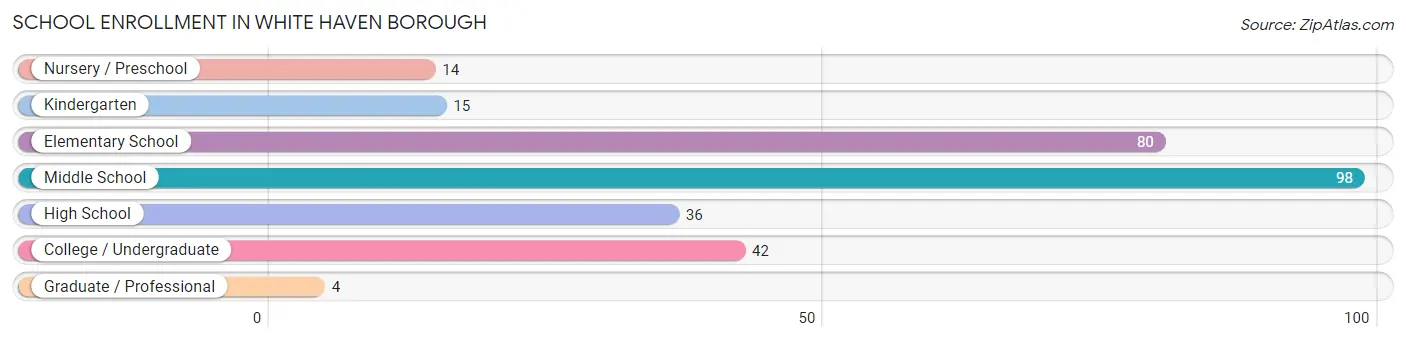
School Enrollment in White Haven borough
The most common levels of schooling among the 289 students in White Haven borough are middle school (98 | 33.9%), elementary school (80 | 27.7%), and college / undergraduate (42 | 14.5%).
| School Level | # Students | % Students |
| Nursery / Preschool | 14 | 4.8% |
| Kindergarten | 15 | 5.2% |
| Elementary School | 80 | 27.7% |
| Middle School | 98 | 33.9% |
| High School | 36 | 12.5% |
| College / Undergraduate | 42 | 14.5% |
| Graduate / Professional | 4 | 1.4% |
| Total | 289 | 100.0% |
School Enrollment by Age by Funding Source in White Haven borough
Out of a total of 289 students who are enrolled in schools in White Haven borough, 29 (10.0%) attend a private institution, while the remaining 260 (90.0%) are enrolled in public schools. The age group of 25 to 34 year olds has the highest likelihood of being enrolled in private schools, with 1 (100.0% in the age bracket) enrolled. Conversely, the age group of 18 to 19 year olds has the lowest likelihood of being enrolled in a private school, with 3 (100.0% in the age bracket) attending a public institution.
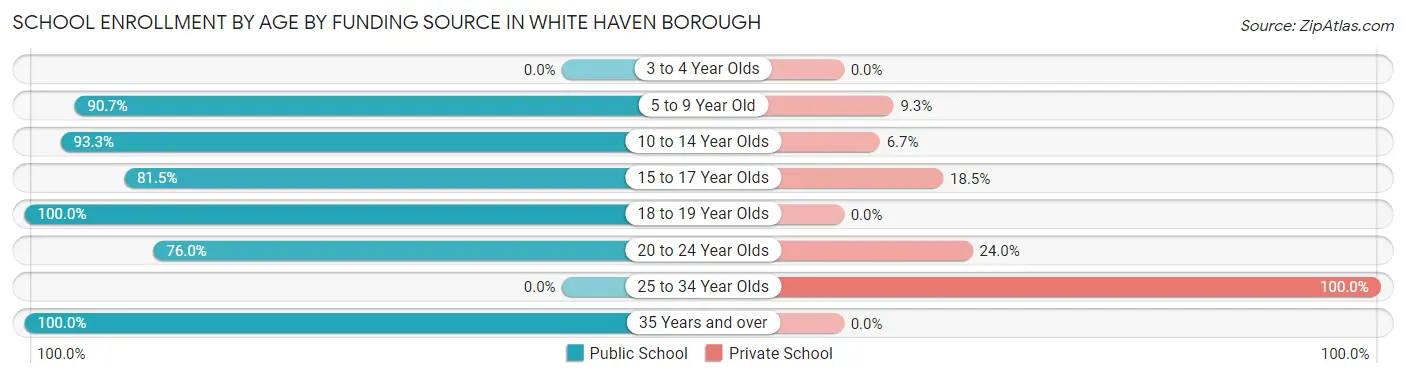
| Age Bracket | Public School | Private School |
| 3 to 4 Year Olds | 0 (0.0%) | 0 (0.0%) |
| 5 to 9 Year Old | 88 (90.7%) | 9 (9.3%) |
| 10 to 14 Year Olds | 111 (93.3%) | 8 (6.7%) |
| 15 to 17 Year Olds | 22 (81.5%) | 5 (18.5%) |
| 18 to 19 Year Olds | 3 (100.0%) | 0 (0.0%) |
| 20 to 24 Year Olds | 19 (76.0%) | 6 (24.0%) |
| 25 to 34 Year Olds | 0 (0.0%) | 1 (100.0%) |
| 35 Years and over | 17 (100.0%) | 0 (0.0%) |
| Total | 260 (90.0%) | 29 (10.0%) |
Educational Attainment by Field of Study in White Haven borough
Business (46 | 31.3%), visual & performing arts (15 | 10.2%), social sciences (14 | 9.5%), liberal arts & history (14 | 9.5%), and computers & mathematics (10 | 6.8%) are the most common fields of study among 147 individuals in White Haven borough who have obtained a bachelor's degree or higher.
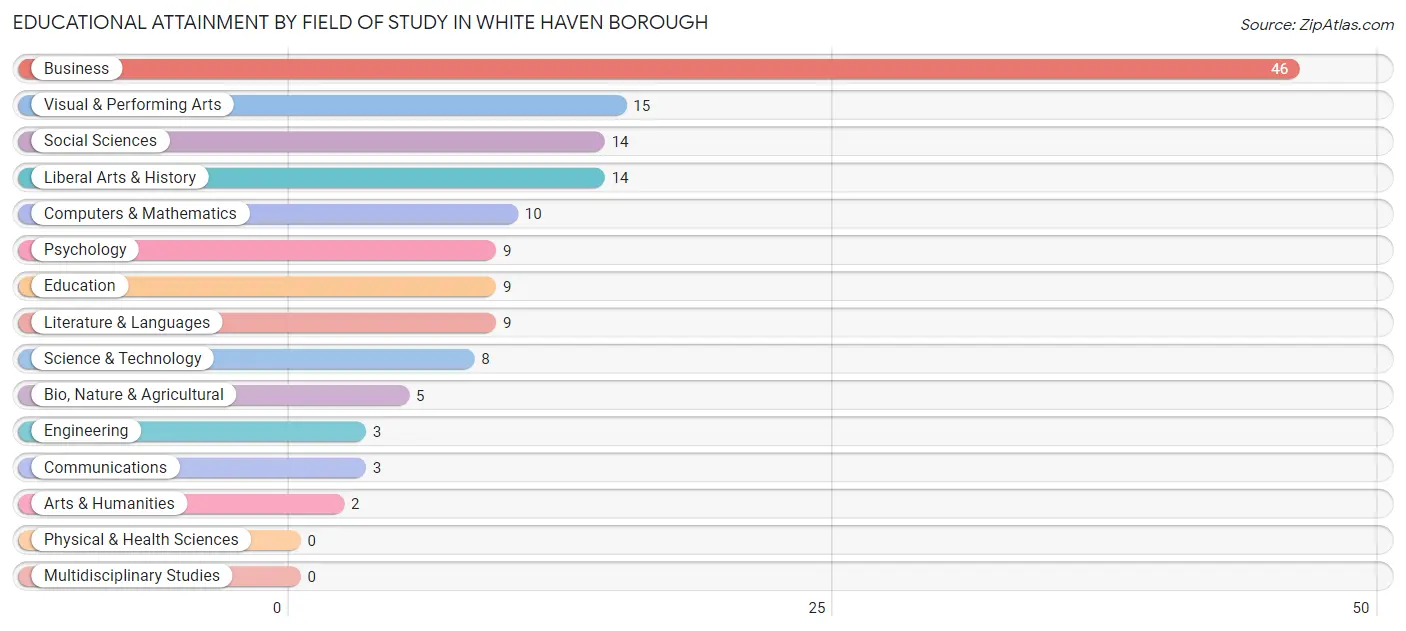
| Field of Study | # Graduates | % Graduates |
| Computers & Mathematics | 10 | 6.8% |
| Bio, Nature & Agricultural | 5 | 3.4% |
| Physical & Health Sciences | 0 | 0.0% |
| Psychology | 9 | 6.1% |
| Social Sciences | 14 | 9.5% |
| Engineering | 3 | 2.0% |
| Multidisciplinary Studies | 0 | 0.0% |
| Science & Technology | 8 | 5.4% |
| Business | 46 | 31.3% |
| Education | 9 | 6.1% |
| Literature & Languages | 9 | 6.1% |
| Liberal Arts & History | 14 | 9.5% |
| Visual & Performing Arts | 15 | 10.2% |
| Communications | 3 | 2.0% |
| Arts & Humanities | 2 | 1.4% |
| Total | 147 | 100.0% |
Transportation & Commute in White Haven borough
Vehicle Availability by Sex in White Haven borough
The most prevalent vehicle ownership categories in White Haven borough are males with 2 vehicles (109, accounting for 47.8%) and females with 2 vehicles (88, making up 55.0%).
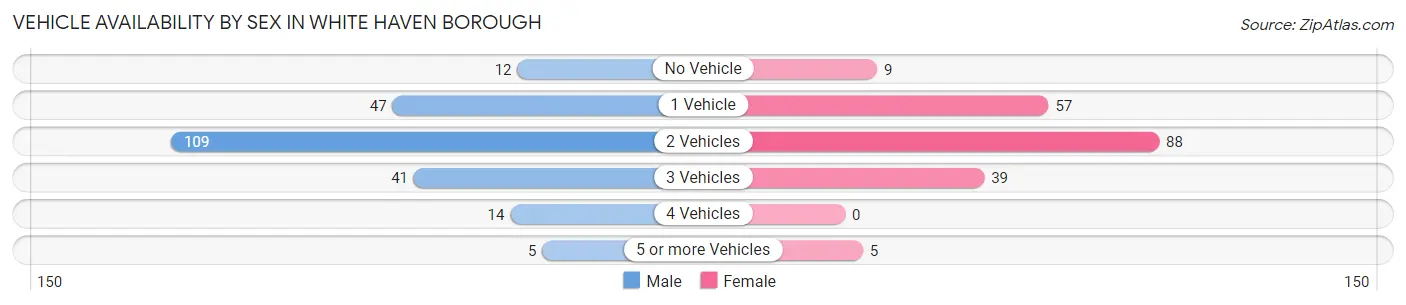
| Vehicles Available | Male | Female |
| No Vehicle | 12 (5.3%) | 9 (4.5%) |
| 1 Vehicle | 47 (20.6%) | 57 (28.8%) |
| 2 Vehicles | 109 (47.8%) | 88 (44.4%) |
| 3 Vehicles | 41 (18.0%) | 39 (19.7%) |
| 4 Vehicles | 14 (6.1%) | 0 (0.0%) |
| 5 or more Vehicles | 5 (2.2%) | 5 (2.5%) |
| Total | 228 (100.0%) | 198 (100.0%) |
Commute Time in White Haven borough
The most frequently occuring commute durations in White Haven borough are 30 to 34 minutes (95 commuters, 25.5%), 5 to 9 minutes (62 commuters, 16.6%), and 20 to 24 minutes (52 commuters, 13.9%).
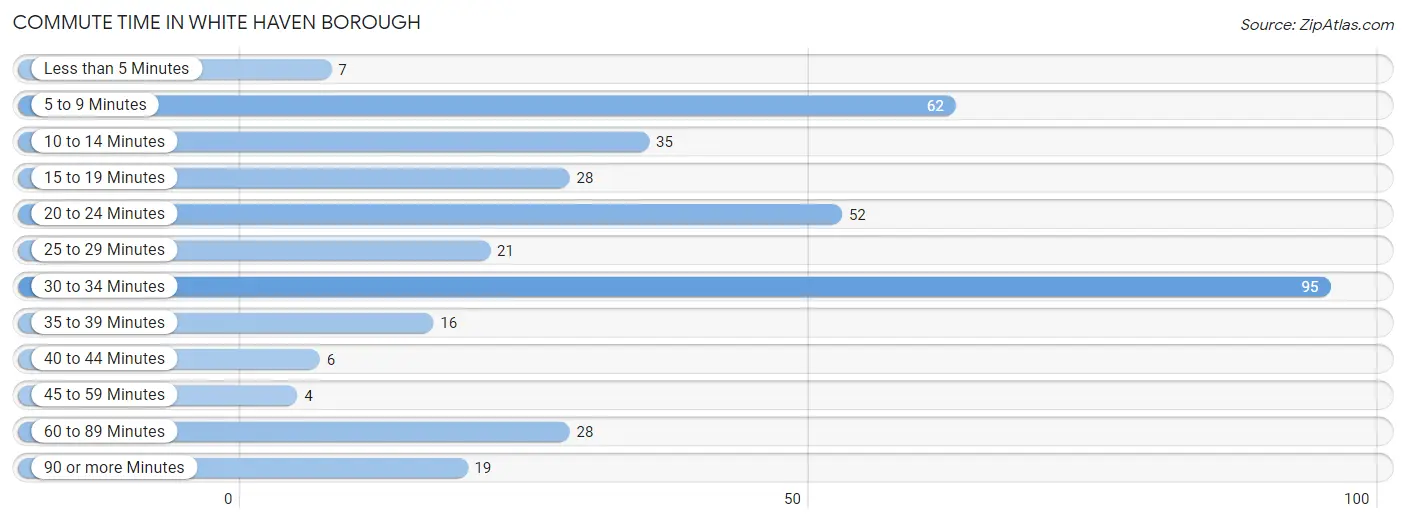
| Commute Time | # Commuters | % Commuters |
| Less than 5 Minutes | 7 | 1.9% |
| 5 to 9 Minutes | 62 | 16.6% |
| 10 to 14 Minutes | 35 | 9.4% |
| 15 to 19 Minutes | 28 | 7.5% |
| 20 to 24 Minutes | 52 | 13.9% |
| 25 to 29 Minutes | 21 | 5.6% |
| 30 to 34 Minutes | 95 | 25.5% |
| 35 to 39 Minutes | 16 | 4.3% |
| 40 to 44 Minutes | 6 | 1.6% |
| 45 to 59 Minutes | 4 | 1.1% |
| 60 to 89 Minutes | 28 | 7.5% |
| 90 or more Minutes | 19 | 5.1% |
Commute Time by Sex in White Haven borough
The most common commute times in White Haven borough are 30 to 34 minutes (59 commuters, 29.9%) for males and 30 to 34 minutes (36 commuters, 20.4%) for females.
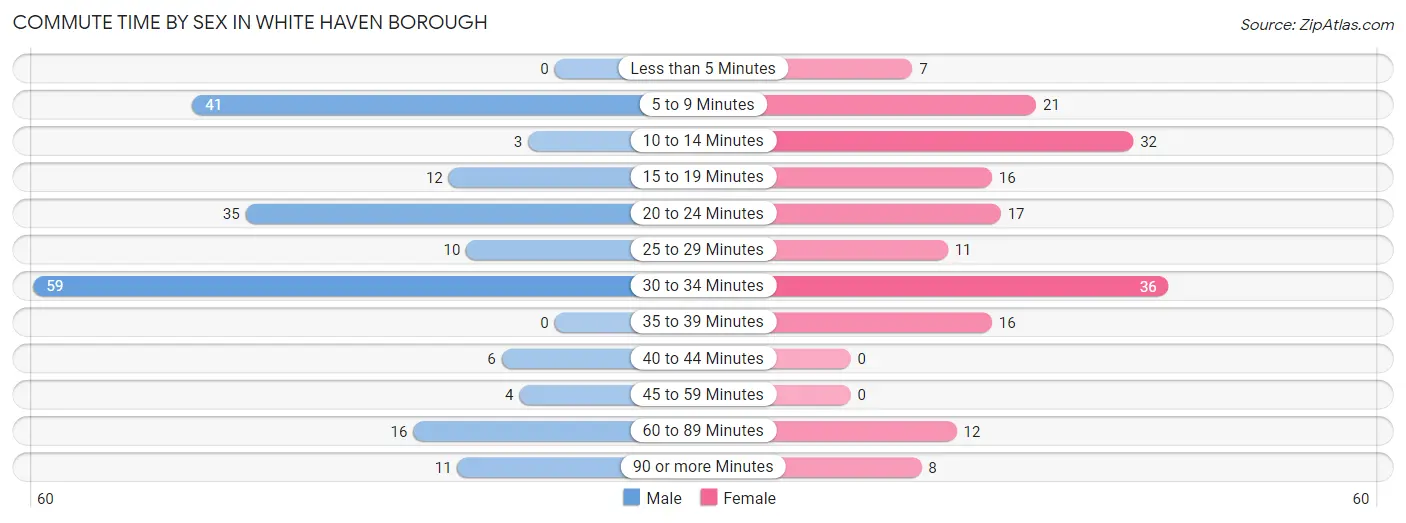
| Commute Time | Male | Female |
| Less than 5 Minutes | 0 (0.0%) | 7 (4.0%) |
| 5 to 9 Minutes | 41 (20.8%) | 21 (11.9%) |
| 10 to 14 Minutes | 3 (1.5%) | 32 (18.2%) |
| 15 to 19 Minutes | 12 (6.1%) | 16 (9.1%) |
| 20 to 24 Minutes | 35 (17.8%) | 17 (9.7%) |
| 25 to 29 Minutes | 10 (5.1%) | 11 (6.2%) |
| 30 to 34 Minutes | 59 (29.9%) | 36 (20.4%) |
| 35 to 39 Minutes | 0 (0.0%) | 16 (9.1%) |
| 40 to 44 Minutes | 6 (3.0%) | 0 (0.0%) |
| 45 to 59 Minutes | 4 (2.0%) | 0 (0.0%) |
| 60 to 89 Minutes | 16 (8.1%) | 12 (6.8%) |
| 90 or more Minutes | 11 (5.6%) | 8 (4.5%) |
Time of Departure to Work by Sex in White Haven borough
The most frequent times of departure to work in White Haven borough are 7:30 AM to 7:59 AM (31, 15.7%) for males and 7:00 AM to 7:29 AM (35, 19.9%) for females.
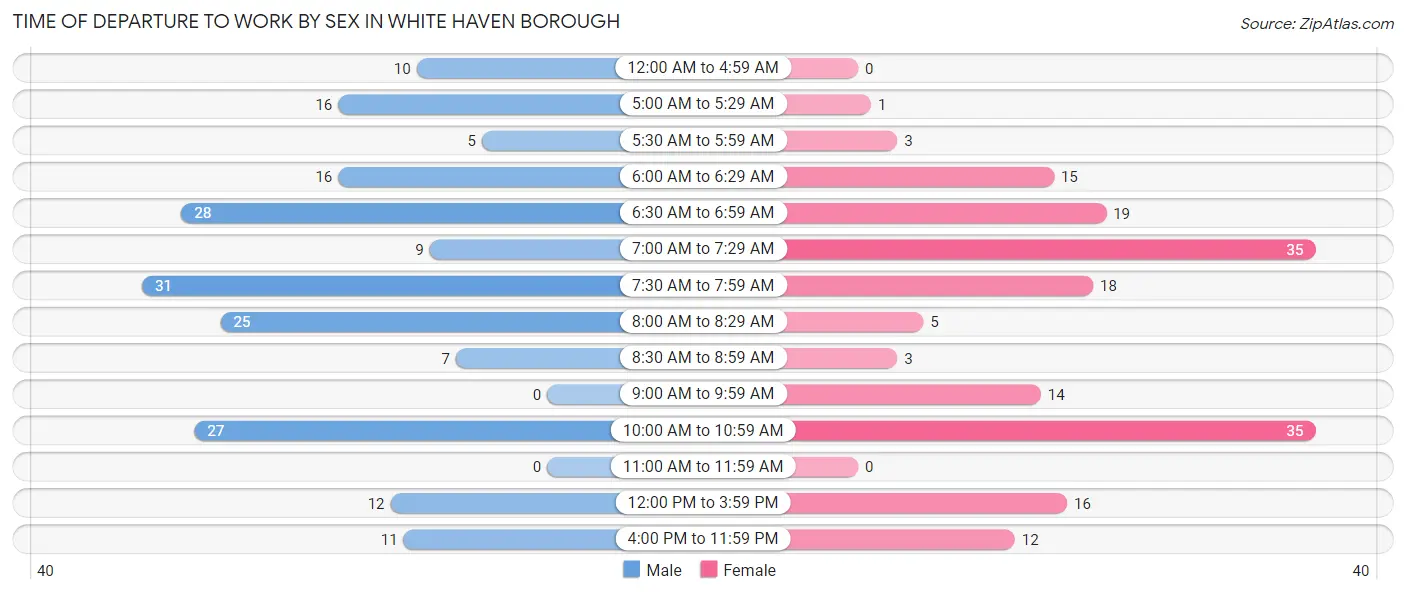
| Time of Departure | Male | Female |
| 12:00 AM to 4:59 AM | 10 (5.1%) | 0 (0.0%) |
| 5:00 AM to 5:29 AM | 16 (8.1%) | 1 (0.6%) |
| 5:30 AM to 5:59 AM | 5 (2.5%) | 3 (1.7%) |
| 6:00 AM to 6:29 AM | 16 (8.1%) | 15 (8.5%) |
| 6:30 AM to 6:59 AM | 28 (14.2%) | 19 (10.8%) |
| 7:00 AM to 7:29 AM | 9 (4.6%) | 35 (19.9%) |
| 7:30 AM to 7:59 AM | 31 (15.7%) | 18 (10.2%) |
| 8:00 AM to 8:29 AM | 25 (12.7%) | 5 (2.8%) |
| 8:30 AM to 8:59 AM | 7 (3.5%) | 3 (1.7%) |
| 9:00 AM to 9:59 AM | 0 (0.0%) | 14 (8.0%) |
| 10:00 AM to 10:59 AM | 27 (13.7%) | 35 (19.9%) |
| 11:00 AM to 11:59 AM | 0 (0.0%) | 0 (0.0%) |
| 12:00 PM to 3:59 PM | 12 (6.1%) | 16 (9.1%) |
| 4:00 PM to 11:59 PM | 11 (5.6%) | 12 (6.8%) |
| Total | 197 (100.0%) | 176 (100.0%) |
Housing Occupancy in White Haven borough
Occupancy by Ownership in White Haven borough
Of the total 425 dwellings in White Haven borough, owner-occupied units account for 327 (76.9%), while renter-occupied units make up 98 (23.1%).
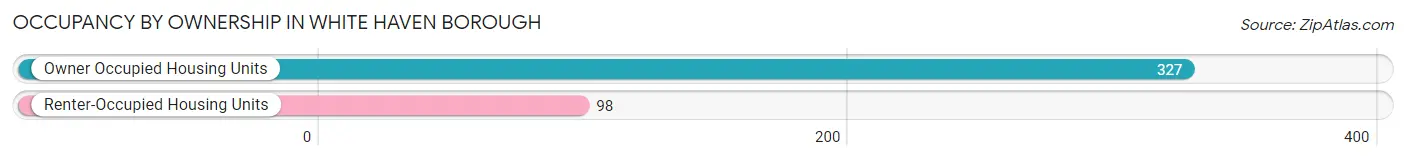
| Occupancy | # Housing Units | % Housing Units |
| Owner Occupied Housing Units | 327 | 76.9% |
| Renter-Occupied Housing Units | 98 | 23.1% |
| Total Occupied Housing Units | 425 | 100.0% |
Occupancy by Household Size in White Haven borough
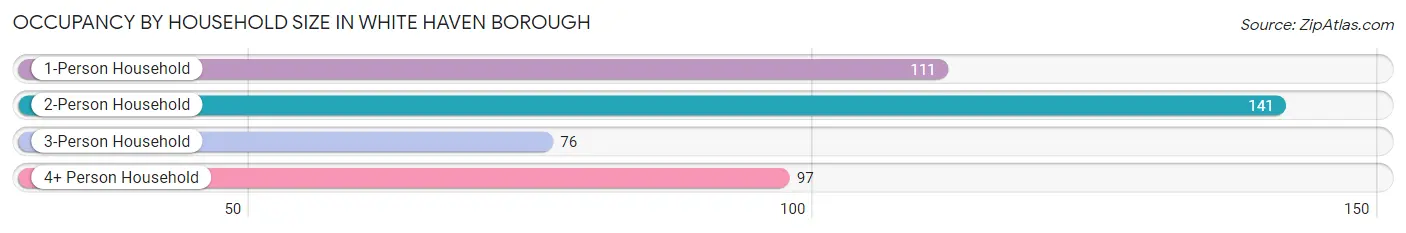
| Household Size | # Housing Units | % Housing Units |
| 1-Person Household | 111 | 26.1% |
| 2-Person Household | 141 | 33.2% |
| 3-Person Household | 76 | 17.9% |
| 4+ Person Household | 97 | 22.8% |
| Total Housing Units | 425 | 100.0% |
Occupancy by Ownership by Household Size in White Haven borough
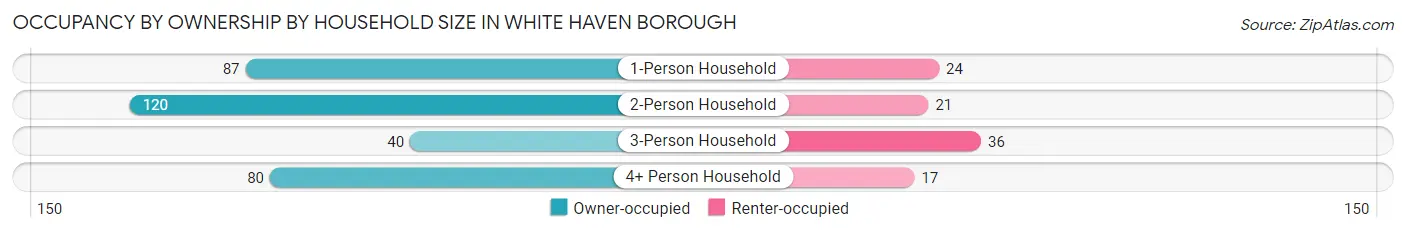
| Household Size | Owner-occupied | Renter-occupied |
| 1-Person Household | 87 (78.4%) | 24 (21.6%) |
| 2-Person Household | 120 (85.1%) | 21 (14.9%) |
| 3-Person Household | 40 (52.6%) | 36 (47.4%) |
| 4+ Person Household | 80 (82.5%) | 17 (17.5%) |
| Total Housing Units | 327 (76.9%) | 98 (23.1%) |
Occupancy by Educational Attainment in White Haven borough
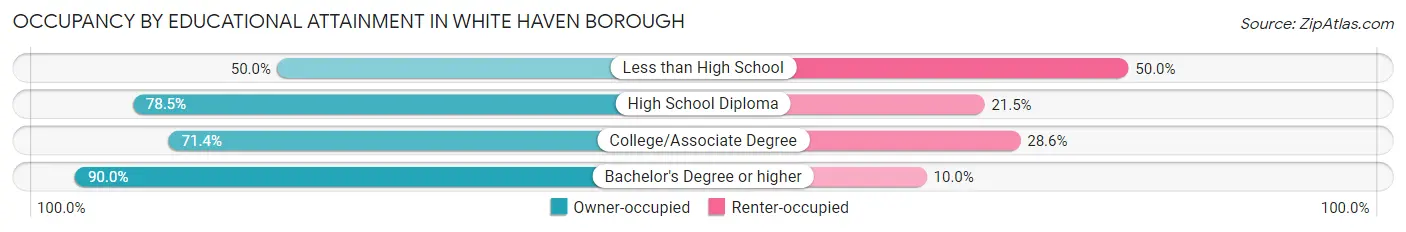
| Household Size | Owner-occupied | Renter-occupied |
| Less than High School | 3 (50.0%) | 3 (50.0%) |
| High School Diploma | 150 (78.5%) | 41 (21.5%) |
| College/Associate Degree | 120 (71.4%) | 48 (28.6%) |
| Bachelor's Degree or higher | 54 (90.0%) | 6 (10.0%) |
Occupancy by Age of Householder in White Haven borough
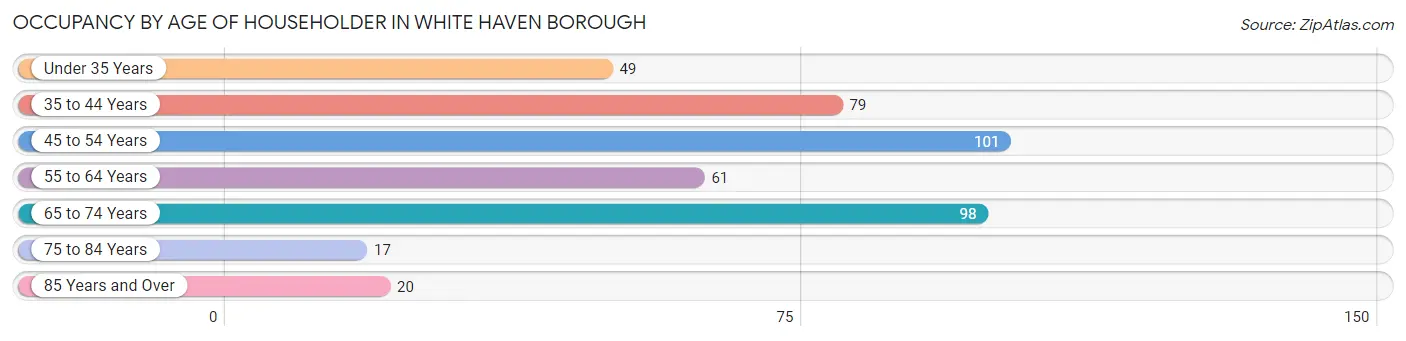
| Age Bracket | # Households | % Households |
| Under 35 Years | 49 | 11.5% |
| 35 to 44 Years | 79 | 18.6% |
| 45 to 54 Years | 101 | 23.8% |
| 55 to 64 Years | 61 | 14.3% |
| 65 to 74 Years | 98 | 23.1% |
| 75 to 84 Years | 17 | 4.0% |
| 85 Years and Over | 20 | 4.7% |
| Total | 425 | 100.0% |
Housing Finances in White Haven borough
Median Income by Occupancy in White Haven borough
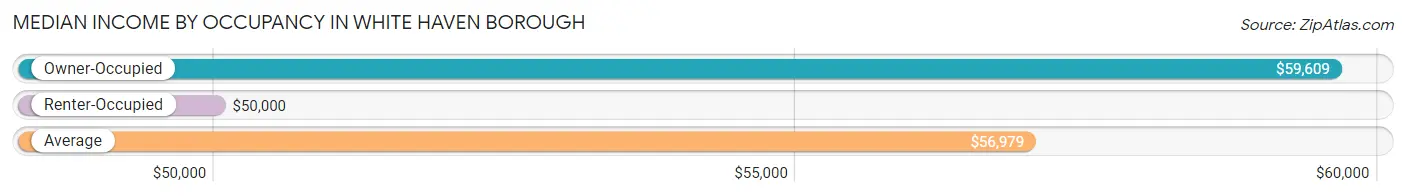
| Occupancy Type | # Households | Median Income |
| Owner-Occupied | 327 (76.9%) | $59,609 |
| Renter-Occupied | 98 (23.1%) | $50,000 |
| Average | 425 (100.0%) | $56,979 |
Occupancy by Householder Income Bracket in White Haven borough
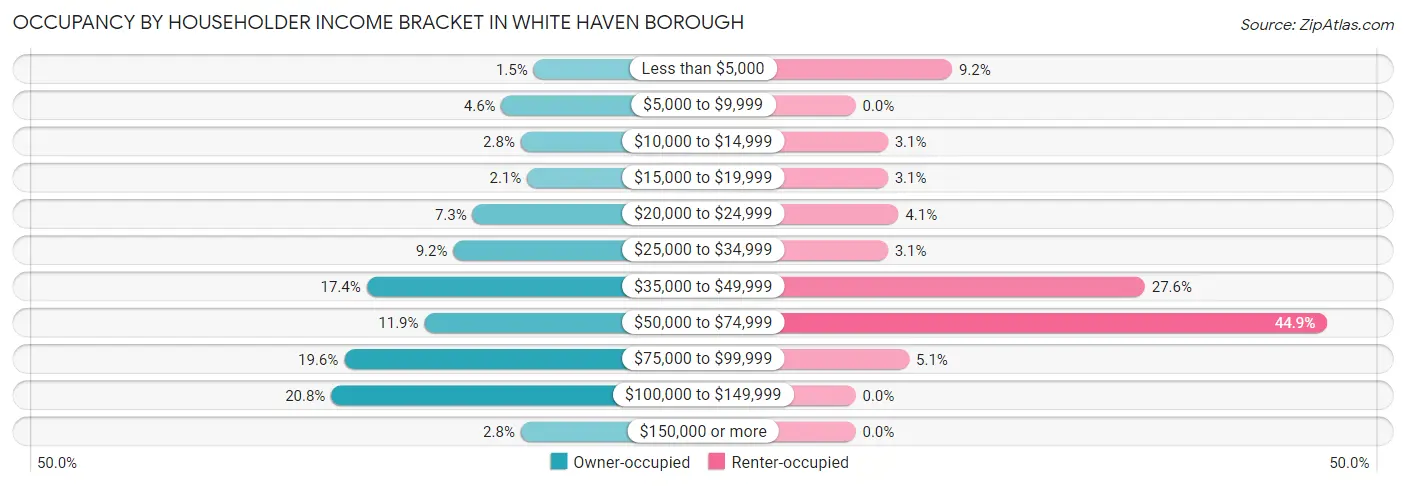
| Income Bracket | Owner-occupied | Renter-occupied |
| Less than $5,000 | 5 (1.5%) | 9 (9.2%) |
| $5,000 to $9,999 | 15 (4.6%) | 0 (0.0%) |
| $10,000 to $14,999 | 9 (2.8%) | 3 (3.1%) |
| $15,000 to $19,999 | 7 (2.1%) | 3 (3.1%) |
| $20,000 to $24,999 | 24 (7.3%) | 4 (4.1%) |
| $25,000 to $34,999 | 30 (9.2%) | 3 (3.1%) |
| $35,000 to $49,999 | 57 (17.4%) | 27 (27.6%) |
| $50,000 to $74,999 | 39 (11.9%) | 44 (44.9%) |
| $75,000 to $99,999 | 64 (19.6%) | 5 (5.1%) |
| $100,000 to $149,999 | 68 (20.8%) | 0 (0.0%) |
| $150,000 or more | 9 (2.8%) | 0 (0.0%) |
| Total | 327 (100.0%) | 98 (100.0%) |
Monthly Housing Cost Tiers in White Haven borough
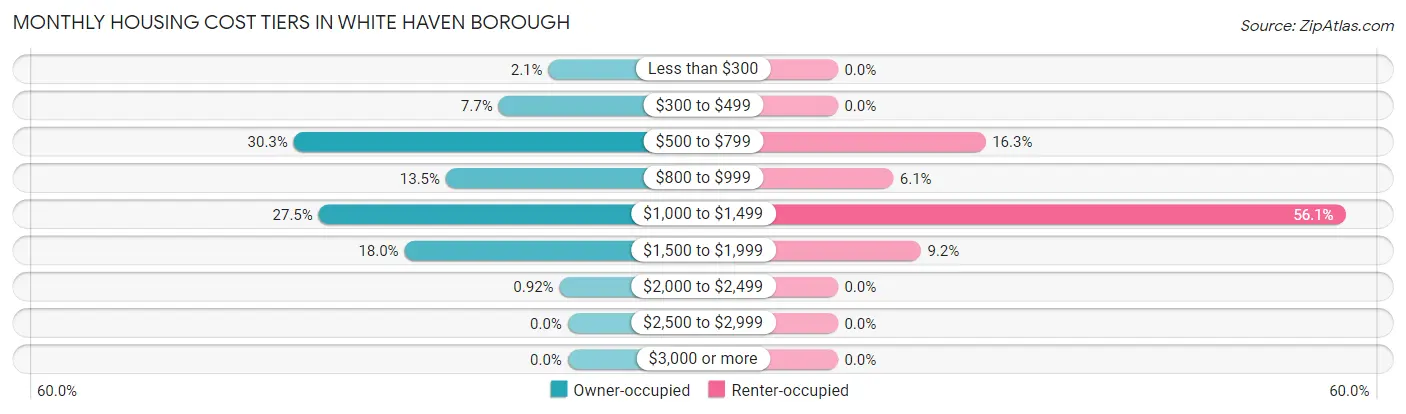
| Monthly Cost | Owner-occupied | Renter-occupied |
| Less than $300 | 7 (2.1%) | 0 (0.0%) |
| $300 to $499 | 25 (7.6%) | 0 (0.0%) |
| $500 to $799 | 99 (30.3%) | 16 (16.3%) |
| $800 to $999 | 44 (13.5%) | 6 (6.1%) |
| $1,000 to $1,499 | 90 (27.5%) | 55 (56.1%) |
| $1,500 to $1,999 | 59 (18.0%) | 9 (9.2%) |
| $2,000 to $2,499 | 3 (0.9%) | 0 (0.0%) |
| $2,500 to $2,999 | 0 (0.0%) | 0 (0.0%) |
| $3,000 or more | 0 (0.0%) | 0 (0.0%) |
| Total | 327 (100.0%) | 98 (100.0%) |
Physical Housing Characteristics in White Haven borough
Housing Structures in White Haven borough
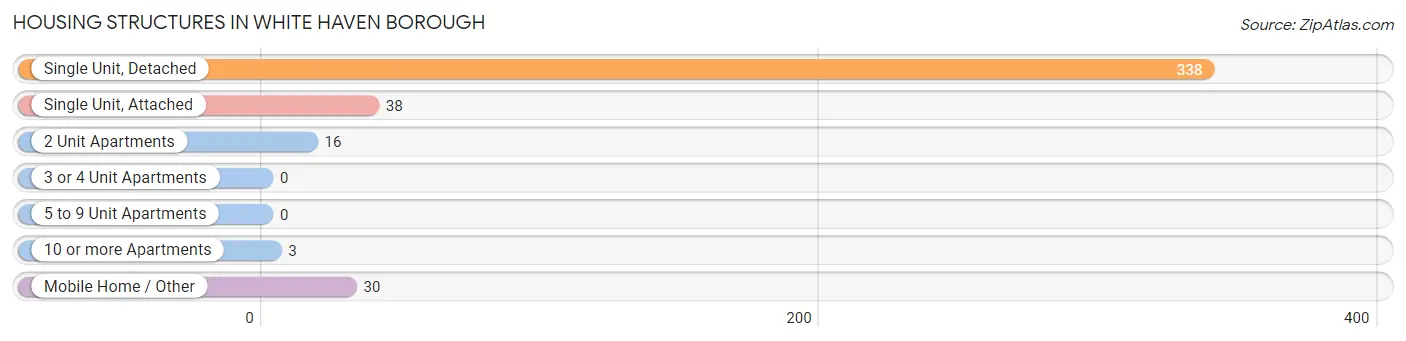
| Structure Type | # Housing Units | % Housing Units |
| Single Unit, Detached | 338 | 79.5% |
| Single Unit, Attached | 38 | 8.9% |
| 2 Unit Apartments | 16 | 3.8% |
| 3 or 4 Unit Apartments | 0 | 0.0% |
| 5 to 9 Unit Apartments | 0 | 0.0% |
| 10 or more Apartments | 3 | 0.7% |
| Mobile Home / Other | 30 | 7.1% |
| Total | 425 | 100.0% |
Housing Structures by Occupancy in White Haven borough
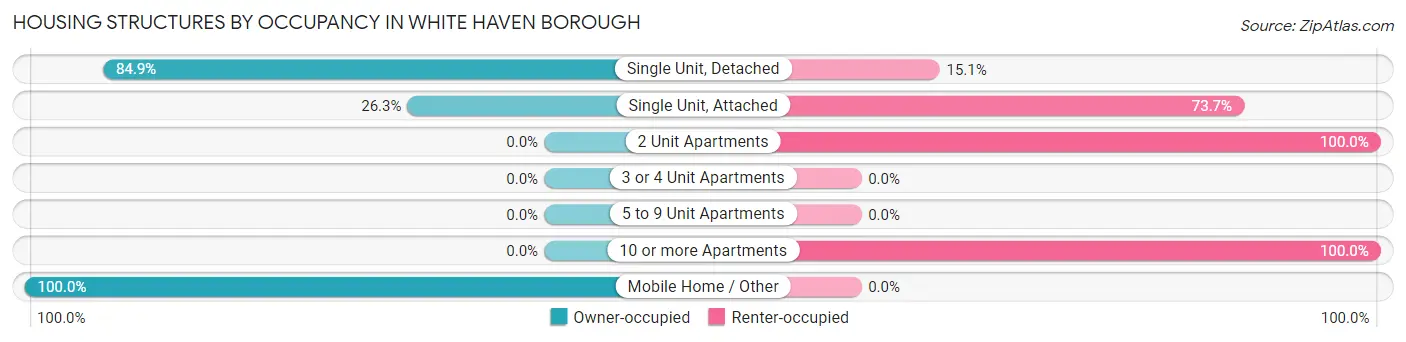
| Structure Type | Owner-occupied | Renter-occupied |
| Single Unit, Detached | 287 (84.9%) | 51 (15.1%) |
| Single Unit, Attached | 10 (26.3%) | 28 (73.7%) |
| 2 Unit Apartments | 0 (0.0%) | 16 (100.0%) |
| 3 or 4 Unit Apartments | 0 (0.0%) | 0 (0.0%) |
| 5 to 9 Unit Apartments | 0 (0.0%) | 0 (0.0%) |
| 10 or more Apartments | 0 (0.0%) | 3 (100.0%) |
| Mobile Home / Other | 30 (100.0%) | 0 (0.0%) |
| Total | 327 (76.9%) | 98 (23.1%) |
Housing Structures by Number of Rooms in White Haven borough
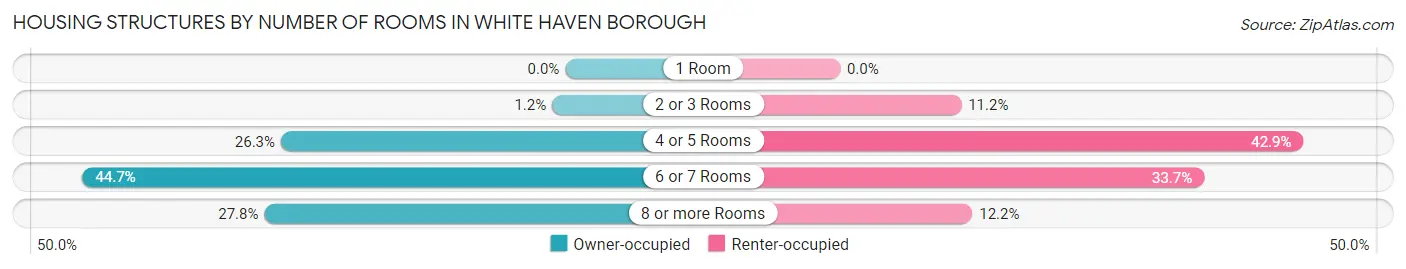
| Number of Rooms | Owner-occupied | Renter-occupied |
| 1 Room | 0 (0.0%) | 0 (0.0%) |
| 2 or 3 Rooms | 4 (1.2%) | 11 (11.2%) |
| 4 or 5 Rooms | 86 (26.3%) | 42 (42.9%) |
| 6 or 7 Rooms | 146 (44.7%) | 33 (33.7%) |
| 8 or more Rooms | 91 (27.8%) | 12 (12.2%) |
| Total | 327 (100.0%) | 98 (100.0%) |
Housing Structure by Heating Type in White Haven borough
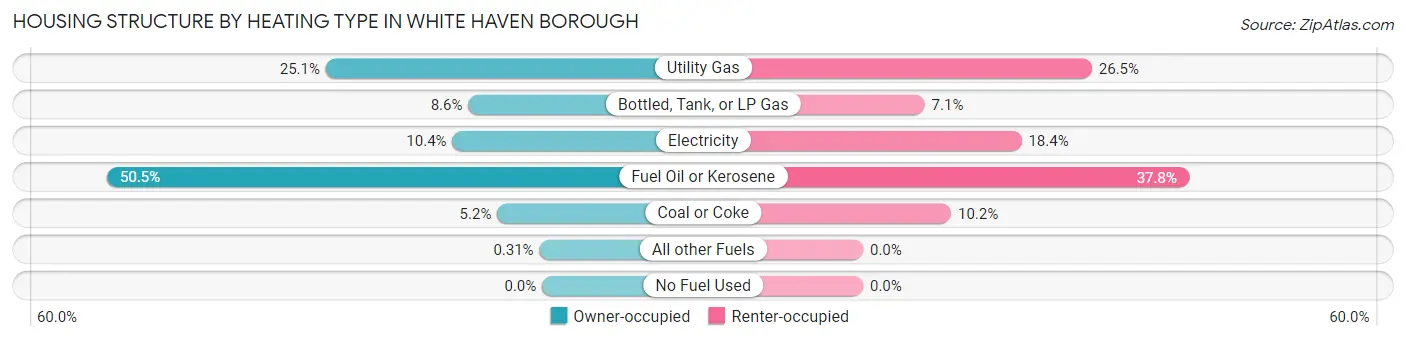
| Heating Type | Owner-occupied | Renter-occupied |
| Utility Gas | 82 (25.1%) | 26 (26.5%) |
| Bottled, Tank, or LP Gas | 28 (8.6%) | 7 (7.1%) |
| Electricity | 34 (10.4%) | 18 (18.4%) |
| Fuel Oil or Kerosene | 165 (50.5%) | 37 (37.8%) |
| Coal or Coke | 17 (5.2%) | 10 (10.2%) |
| All other Fuels | 1 (0.3%) | 0 (0.0%) |
| No Fuel Used | 0 (0.0%) | 0 (0.0%) |
| Total | 327 (100.0%) | 98 (100.0%) |
Household Vehicle Usage in White Haven borough
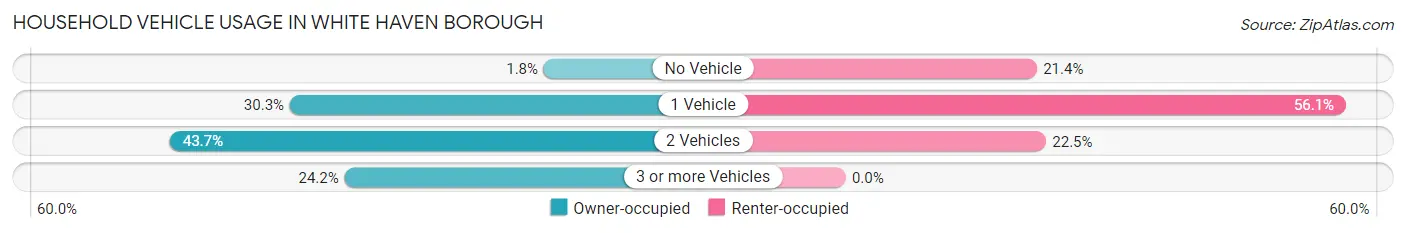
| Vehicles per Household | Owner-occupied | Renter-occupied |
| No Vehicle | 6 (1.8%) | 21 (21.4%) |
| 1 Vehicle | 99 (30.3%) | 55 (56.1%) |
| 2 Vehicles | 143 (43.7%) | 22 (22.5%) |
| 3 or more Vehicles | 79 (24.2%) | 0 (0.0%) |
| Total | 327 (100.0%) | 98 (100.0%) |
Real Estate & Mortgages in White Haven borough
Real Estate and Mortgage Overview in White Haven borough
| Characteristic | Without Mortgage | With Mortgage |
| Housing Units | 160 | 167 |
| Median Property Value | $107,100 | $135,900 |
| Median Household Income | $41,429 | $9 |
| Monthly Housing Costs | $648 | $0 |
| Real Estate Taxes | $1,519 | $0 |
Property Value by Mortgage Status in White Haven borough
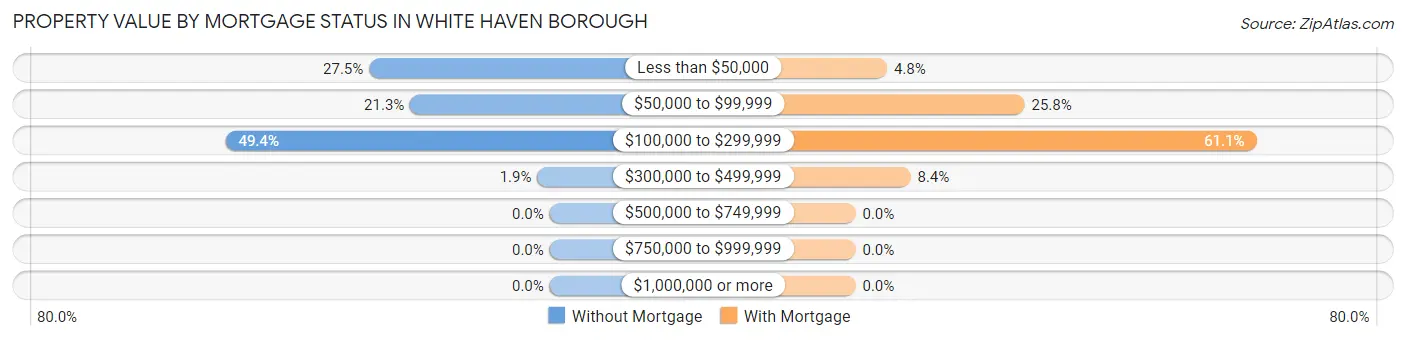
| Property Value | Without Mortgage | With Mortgage |
| Less than $50,000 | 44 (27.5%) | 8 (4.8%) |
| $50,000 to $99,999 | 34 (21.2%) | 43 (25.8%) |
| $100,000 to $299,999 | 79 (49.4%) | 102 (61.1%) |
| $300,000 to $499,999 | 3 (1.9%) | 14 (8.4%) |
| $500,000 to $749,999 | 0 (0.0%) | 0 (0.0%) |
| $750,000 to $999,999 | 0 (0.0%) | 0 (0.0%) |
| $1,000,000 or more | 0 (0.0%) | 0 (0.0%) |
| Total | 160 (100.0%) | 167 (100.0%) |
Household Income by Mortgage Status in White Haven borough
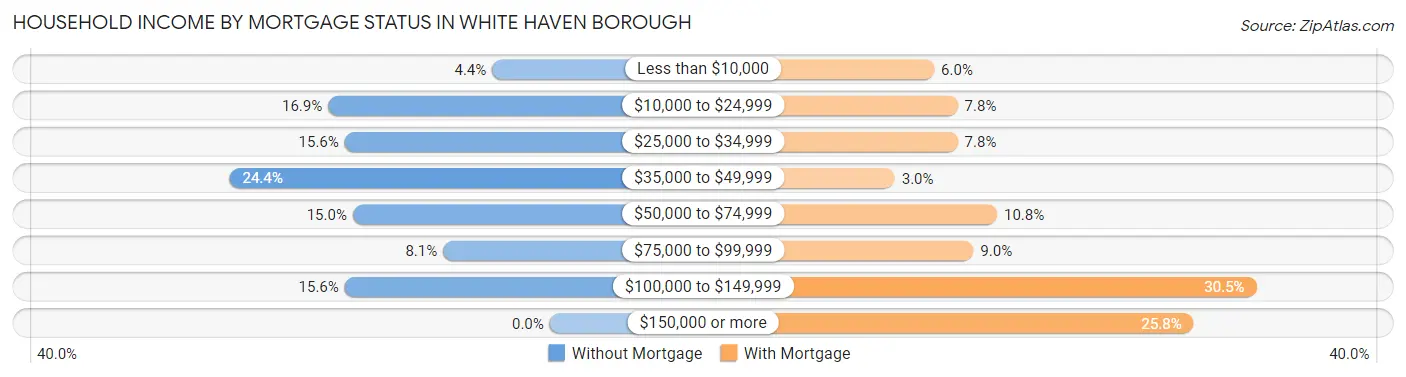
| Household Income | Without Mortgage | With Mortgage |
| Less than $10,000 | 7 (4.4%) | 10 (6.0%) |
| $10,000 to $24,999 | 27 (16.9%) | 13 (7.8%) |
| $25,000 to $34,999 | 25 (15.6%) | 13 (7.8%) |
| $35,000 to $49,999 | 39 (24.4%) | 5 (3.0%) |
| $50,000 to $74,999 | 24 (15.0%) | 18 (10.8%) |
| $75,000 to $99,999 | 13 (8.1%) | 15 (9.0%) |
| $100,000 to $149,999 | 25 (15.6%) | 51 (30.5%) |
| $150,000 or more | 0 (0.0%) | 43 (25.8%) |
| Total | 160 (100.0%) | 167 (100.0%) |
Property Value to Household Income Ratio in White Haven borough
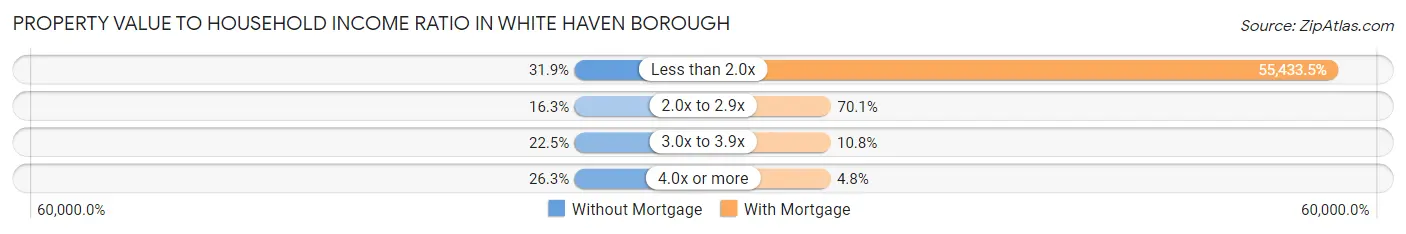
| Value-to-Income Ratio | Without Mortgage | With Mortgage |
| Less than 2.0x | 51 (31.9%) | 92,574 (55,433.5%) |
| 2.0x to 2.9x | 26 (16.3%) | 117 (70.1%) |
| 3.0x to 3.9x | 36 (22.5%) | 18 (10.8%) |
| 4.0x or more | 42 (26.3%) | 8 (4.8%) |
| Total | 160 (100.0%) | 167 (100.0%) |
Real Estate Taxes by Mortgage Status in White Haven borough
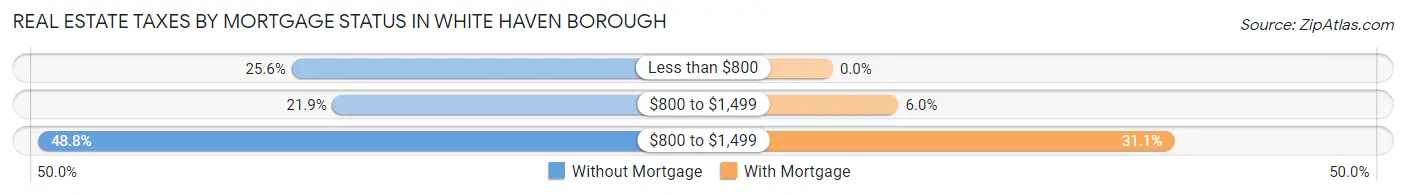
| Property Taxes | Without Mortgage | With Mortgage |
| Less than $800 | 41 (25.6%) | 0 (0.0%) |
| $800 to $1,499 | 35 (21.9%) | 10 (6.0%) |
| $800 to $1,499 | 78 (48.7%) | 52 (31.1%) |
| Total | 160 (100.0%) | 167 (100.0%) |
Health & Disability in White Haven borough
Health Insurance Coverage by Age in White Haven borough
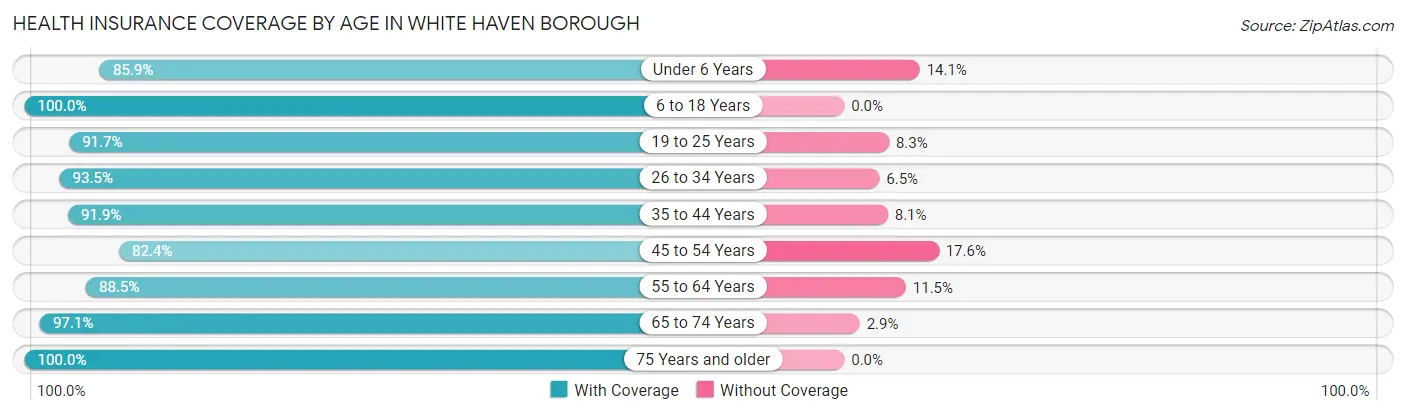
| Age Bracket | With Coverage | Without Coverage |
| Under 6 Years | 55 (85.9%) | 9 (14.1%) |
| 6 to 18 Years | 228 (100.0%) | 0 (0.0%) |
| 19 to 25 Years | 33 (91.7%) | 3 (8.3%) |
| 26 to 34 Years | 100 (93.5%) | 7 (6.5%) |
| 35 to 44 Years | 136 (91.9%) | 12 (8.1%) |
| 45 to 54 Years | 131 (82.4%) | 28 (17.6%) |
| 55 to 64 Years | 108 (88.5%) | 14 (11.5%) |
| 65 to 74 Years | 135 (97.1%) | 4 (2.9%) |
| 75 Years and older | 65 (100.0%) | 0 (0.0%) |
| Total | 991 (92.8%) | 77 (7.2%) |
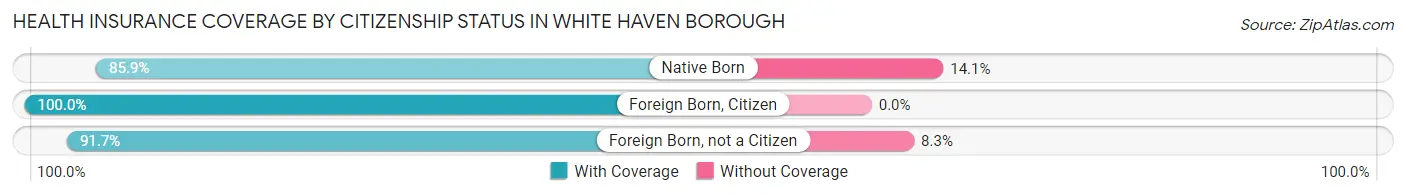
Health Insurance Coverage by Citizenship Status in White Haven borough
| Citizenship Status | With Coverage | Without Coverage |
| Native Born | 55 (85.9%) | 9 (14.1%) |
| Foreign Born, Citizen | 228 (100.0%) | 0 (0.0%) |
| Foreign Born, not a Citizen | 33 (91.7%) | 3 (8.3%) |
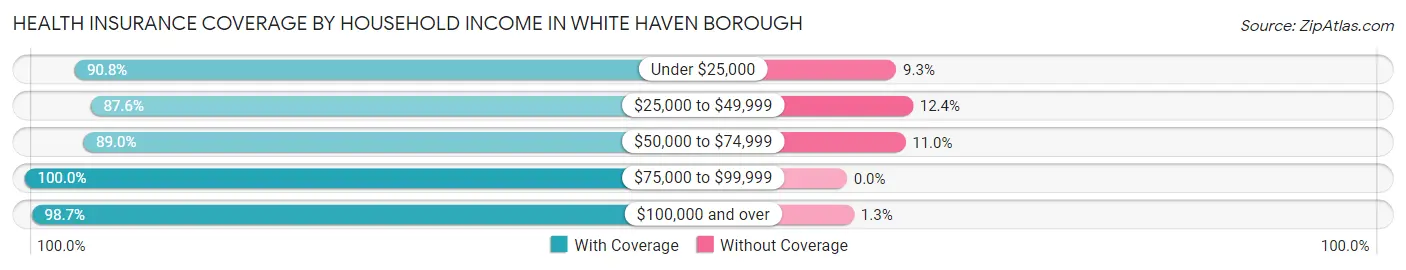
Health Insurance Coverage by Household Income in White Haven borough
| Household Income | With Coverage | Without Coverage |
| Under $25,000 | 157 (90.7%) | 16 (9.2%) |
| $25,000 to $49,999 | 234 (87.6%) | 33 (12.4%) |
| $50,000 to $74,999 | 203 (89.0%) | 25 (11.0%) |
| $75,000 to $99,999 | 172 (100.0%) | 0 (0.0%) |
| $100,000 and over | 222 (98.7%) | 3 (1.3%) |
Public vs Private Health Insurance Coverage by Age in White Haven borough
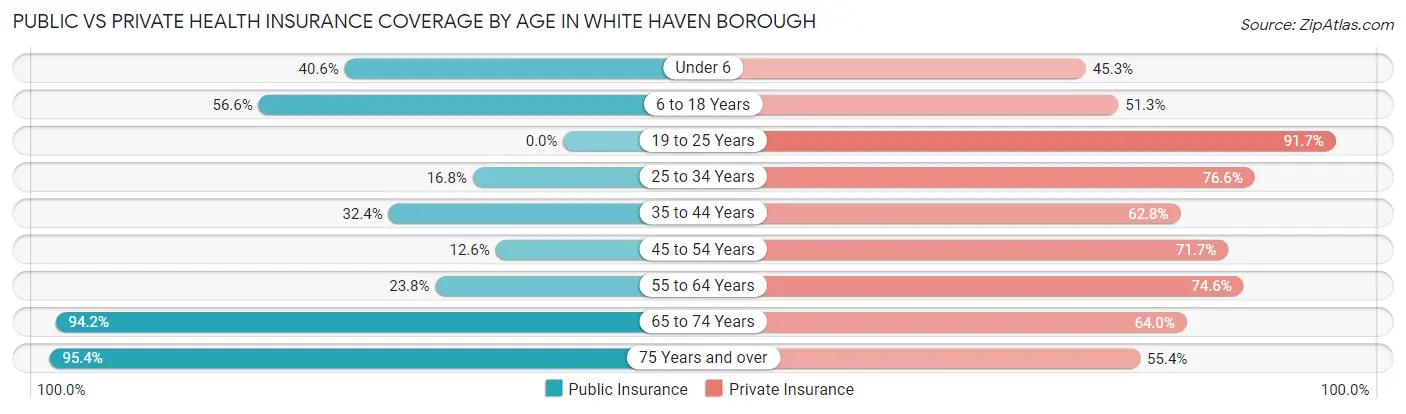
| Age Bracket | Public Insurance | Private Insurance |
| Under 6 | 26 (40.6%) | 29 (45.3%) |
| 6 to 18 Years | 129 (56.6%) | 117 (51.3%) |
| 19 to 25 Years | 0 (0.0%) | 33 (91.7%) |
| 25 to 34 Years | 18 (16.8%) | 82 (76.6%) |
| 35 to 44 Years | 48 (32.4%) | 93 (62.8%) |
| 45 to 54 Years | 20 (12.6%) | 114 (71.7%) |
| 55 to 64 Years | 29 (23.8%) | 91 (74.6%) |
| 65 to 74 Years | 131 (94.2%) | 89 (64.0%) |
| 75 Years and over | 62 (95.4%) | 36 (55.4%) |
| Total | 463 (43.3%) | 684 (64.0%) |
Disability Status by Sex by Age in White Haven borough
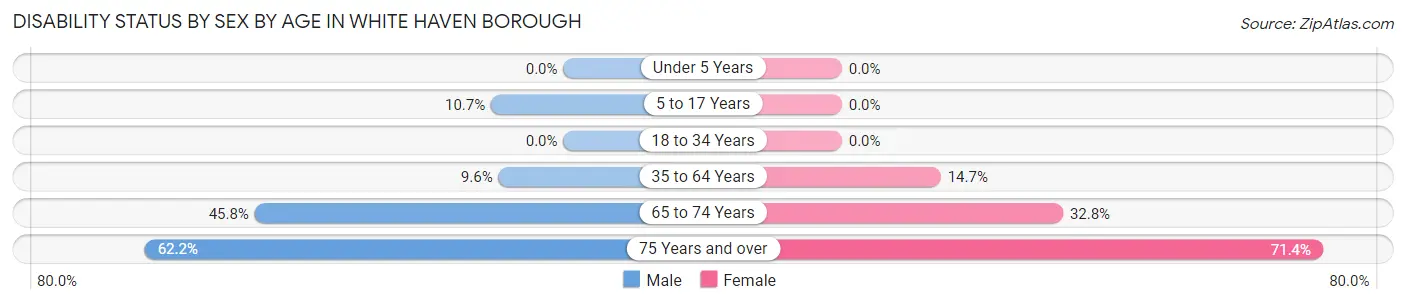
| Age Bracket | Male | Female |
| Under 5 Years | 0 (0.0%) | 0 (0.0%) |
| 5 to 17 Years | 13 (10.7%) | 0 (0.0%) |
| 18 to 34 Years | 0 (0.0%) | 0 (0.0%) |
| 35 to 64 Years | 21 (9.6%) | 31 (14.7%) |
| 65 to 74 Years | 33 (45.8%) | 22 (32.8%) |
| 75 Years and over | 23 (62.2%) | 20 (71.4%) |
Disability Class by Sex by Age in White Haven borough
Disability Class: Hearing Difficulty
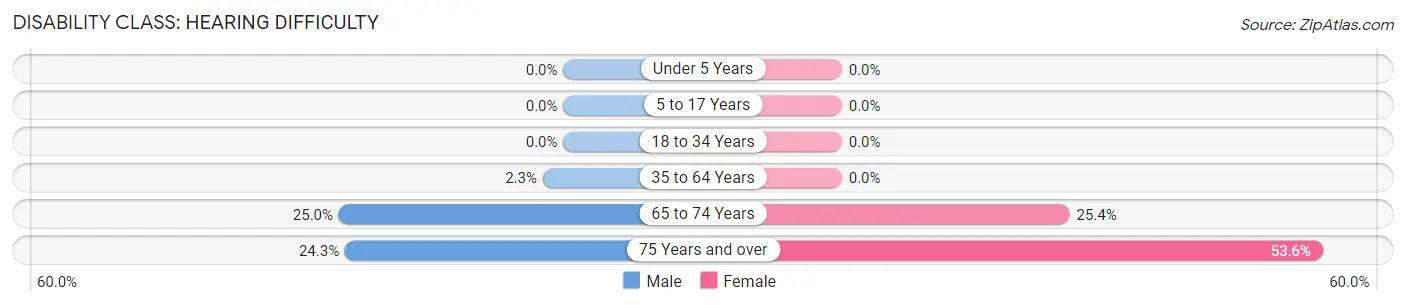
| Age Bracket | Male | Female |
| Under 5 Years | 0 (0.0%) | 0 (0.0%) |
| 5 to 17 Years | 0 (0.0%) | 0 (0.0%) |
| 18 to 34 Years | 0 (0.0%) | 0 (0.0%) |
| 35 to 64 Years | 5 (2.3%) | 0 (0.0%) |
| 65 to 74 Years | 18 (25.0%) | 17 (25.4%) |
| 75 Years and over | 9 (24.3%) | 15 (53.6%) |
Disability Class: Vision Difficulty
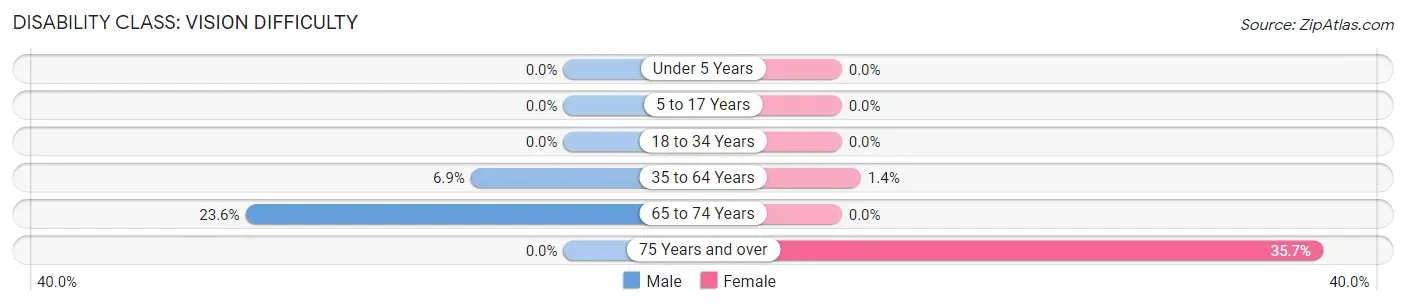
| Age Bracket | Male | Female |
| Under 5 Years | 0 (0.0%) | 0 (0.0%) |
| 5 to 17 Years | 0 (0.0%) | 0 (0.0%) |
| 18 to 34 Years | 0 (0.0%) | 0 (0.0%) |
| 35 to 64 Years | 15 (6.9%) | 3 (1.4%) |
| 65 to 74 Years | 17 (23.6%) | 0 (0.0%) |
| 75 Years and over | 0 (0.0%) | 10 (35.7%) |
Disability Class: Cognitive Difficulty
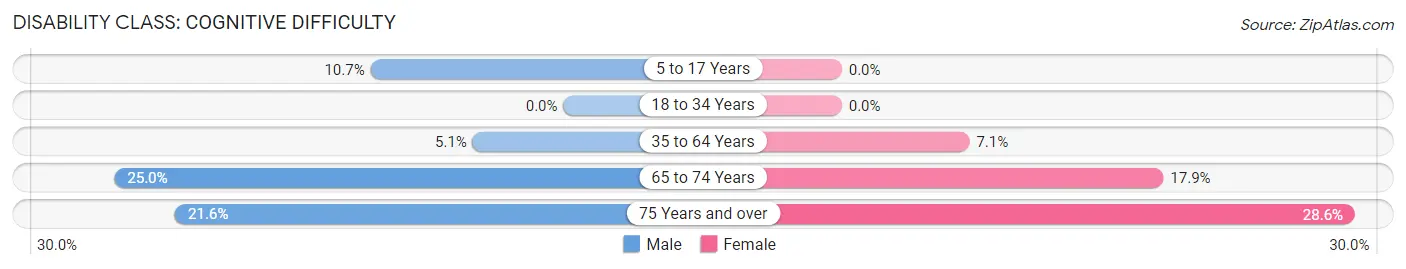
| Age Bracket | Male | Female |
| 5 to 17 Years | 13 (10.7%) | 0 (0.0%) |
| 18 to 34 Years | 0 (0.0%) | 0 (0.0%) |
| 35 to 64 Years | 11 (5.1%) | 15 (7.1%) |
| 65 to 74 Years | 18 (25.0%) | 12 (17.9%) |
| 75 Years and over | 8 (21.6%) | 8 (28.6%) |
Disability Class: Ambulatory Difficulty
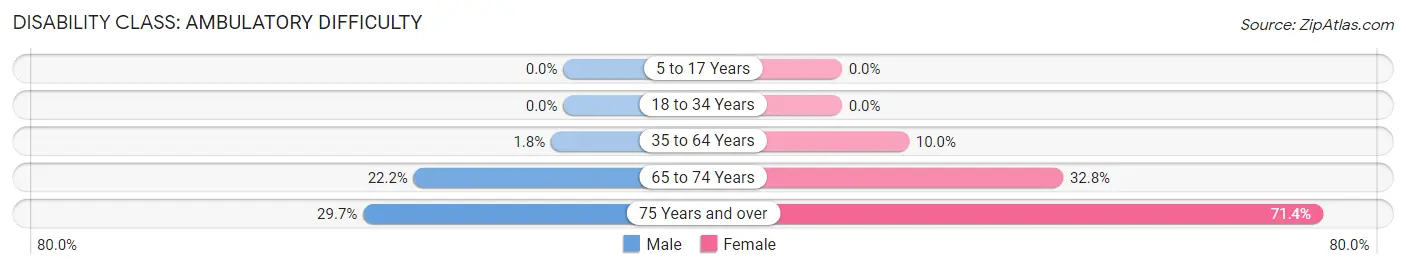
| Age Bracket | Male | Female |
| 5 to 17 Years | 0 (0.0%) | 0 (0.0%) |
| 18 to 34 Years | 0 (0.0%) | 0 (0.0%) |
| 35 to 64 Years | 4 (1.8%) | 21 (10.0%) |
| 65 to 74 Years | 16 (22.2%) | 22 (32.8%) |
| 75 Years and over | 11 (29.7%) | 20 (71.4%) |
Disability Class: Self-Care Difficulty
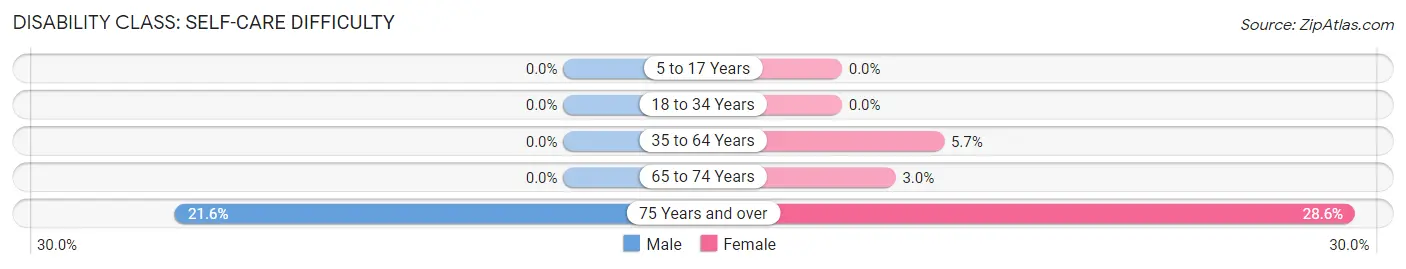
| Age Bracket | Male | Female |
| 5 to 17 Years | 0 (0.0%) | 0 (0.0%) |
| 18 to 34 Years | 0 (0.0%) | 0 (0.0%) |
| 35 to 64 Years | 0 (0.0%) | 12 (5.7%) |
| 65 to 74 Years | 0 (0.0%) | 2 (3.0%) |
| 75 Years and over | 8 (21.6%) | 8 (28.6%) |
Technology Access in White Haven borough
Computing Device Access in White Haven borough
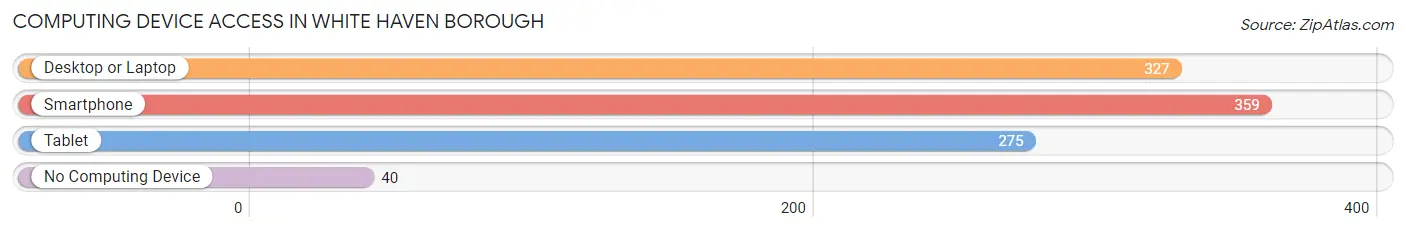
| Device Type | # Households | % Households |
| Desktop or Laptop | 327 | 76.9% |
| Smartphone | 359 | 84.5% |
| Tablet | 275 | 64.7% |
| No Computing Device | 40 | 9.4% |
| Total | 425 | 100.0% |
Internet Access in White Haven borough
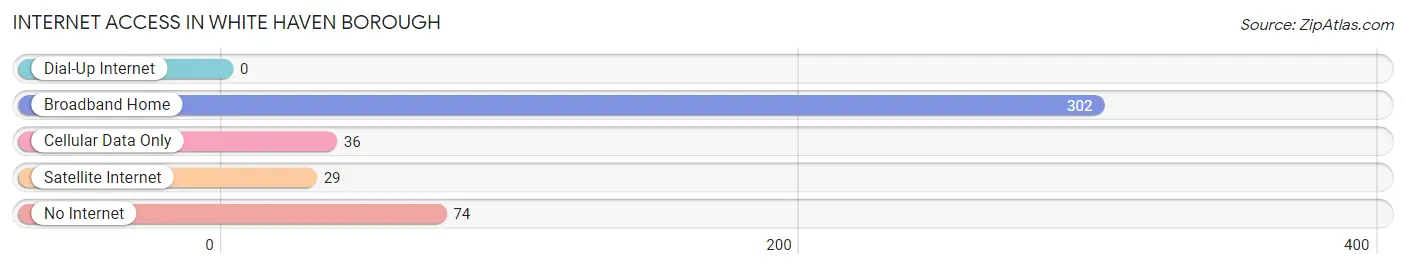
| Internet Type | # Households | % Households |
| Dial-Up Internet | 0 | 0.0% |
| Broadband Home | 302 | 71.1% |
| Cellular Data Only | 36 | 8.5% |
| Satellite Internet | 29 | 6.8% |
| No Internet | 74 | 17.4% |
| Total | 425 | 100.0% |
White Haven borough Summary
History
White Haven Borough is a small borough located in Luzerne County, Pennsylvania. It is situated in the Pocono Mountains region of the state and is part of the Hazleton Metropolitan Statistical Area. The borough was founded in 1845 and was named after the White Haven Hotel, which was built in the area in 1837. The hotel was a popular destination for wealthy travelers from Philadelphia and New York City.
The borough was originally part of the larger White Haven Township, which was established in 1842. The township was divided into two parts in 1845, with the northern part becoming White Haven Borough and the southern part becoming White Haven Township. The borough was incorporated in 1851 and has remained relatively unchanged since then.
Geography
White Haven Borough is located in the Pocono Mountains region of Pennsylvania. It is situated in the western part of Luzerne County, approximately 10 miles east of Hazleton. The borough is bordered by White Haven Township to the south, Kidder Township to the east, and Bear Creek Township to the west. The borough covers an area of 1.2 square miles and is home to a population of approximately 1,400 people.
The borough is situated in a valley surrounded by mountains. The highest point in the borough is the summit of White Haven Mountain, which rises to an elevation of 1,890 feet. The borough is located in the Lehigh Valley watershed and is drained by the Lehigh River.
Economy
White Haven Borough is a small, rural community with a limited economy. The borough is home to several small businesses, including a grocery store, a hardware store, and a few restaurants. The borough also has a few small manufacturing companies, including a furniture factory and a printing company.
The borough is also home to a few tourist attractions, including the White Haven Hotel, which was built in 1837 and is now a museum. The borough is also home to the White Haven Historical Society, which is dedicated to preserving the history of the area.
Demographics
As of the 2010 census, White Haven Borough had a population of 1,400 people. The racial makeup of the borough was 97.6% White, 0.6% African American, 0.3% Native American, 0.3% Asian, and 1.2% from other races. Hispanic or Latino of any race were 1.2% of the population.
The median household income in White Haven Borough was $41,250, and the median family income was $50,000. The per capita income for the borough was $20,945. About 11.2% of families and 14.2% of the population were below the poverty line, including 18.2% of those under age 18 and 8.3% of those age 65 or over.
Common Questions
What is Per Capita Income in White Haven borough?
Per Capita income in White Haven borough is $25,591.
What is the Median Family Income in White Haven borough?
Median Family Income in White Haven borough is $63,971.
What is the Median Household income in White Haven borough?
Median Household Income in White Haven borough is $56,979.
What is Income or Wage Gap in White Haven borough?
Income or Wage Gap in White Haven borough is 33.5%.
Women in White Haven borough earn 66.5 cents for every dollar earned by a man.
What is Inequality or Gini Index in White Haven borough?
Inequality or Gini Index in White Haven borough is 0.36.
What is the Total Population of White Haven borough?
Total Population of White Haven borough is 1,068.
What is the Total Male Population of White Haven borough?
Total Male Population of White Haven borough is 549.
What is the Total Female Population of White Haven borough?
Total Female Population of White Haven borough is 519.
What is the Ratio of Males per 100 Females in White Haven borough?
There are 105.78 Males per 100 Females in White Haven borough.
What is the Ratio of Females per 100 Males in White Haven borough?
There are 94.54 Females per 100 Males in White Haven borough.
What is the Median Population Age in White Haven borough?
Median Population Age in White Haven borough is 40.1 Years.
What is the Average Family Size in White Haven borough
Average Family Size in White Haven borough is 3.0 People.
What is the Average Household Size in White Haven borough
Average Household Size in White Haven borough is 2.5 People.
How Large is the Labor Force in White Haven borough?
There are 466 People in the Labor Forcein in White Haven borough.
What is the Percentage of People in the Labor Force in White Haven borough?
57.7% of People are in the Labor Force in White Haven borough.
What is the Unemployment Rate in White Haven borough?
Unemployment Rate in White Haven borough is 2.8%.