Oakland CDP Cambria County, PA Map & Demographics
Oakland CDP Cambria County Overview
$34,629
PER CAPITA INCOME
$61,674
AVG FAMILY INCOME
$61,973
AVG HOUSEHOLD INCOME
24.2%
WAGE / INCOME GAP [ % ]
75.8¢/ $1
WAGE / INCOME GAP [ $ ]
0.37
INEQUALITY / GINI INDEX
1,666
TOTAL POPULATION
898
MALE POPULATION
768
FEMALE POPULATION
116.93
MALES / 100 FEMALES
85.52
FEMALES / 100 MALES
56.5
MEDIAN AGE
2.5
AVG FAMILY SIZE
2.2
AVG HOUSEHOLD SIZE
824
LABOR FORCE [ PEOPLE ]
54.8%
PERCENT IN LABOR FORCE
4.2%
UNEMPLOYMENT RATE
Income in Oakland CDP Cambria County
Income Overview in Oakland CDP Cambria County
Per Capita Income in Oakland CDP Cambria County is $34,629, while median incomes of families and households are $61,674 and $61,973 respectively.
| Characteristic | Number | Measure |
| Per Capita Income | 1,666 | $34,629 |
| Median Family Income | 485 | $61,674 |
| Mean Family Income | 485 | $73,713 |
| Median Household Income | 765 | $61,973 |
| Mean Household Income | 765 | $74,091 |
| Income Deficit | 485 | $0 |
| Wage / Income Gap (%) | 1,666 | 24.19% |
| Wage / Income Gap ($) | 1,666 | 75.81¢ per $1 |
| Gini / Inequality Index | 1,666 | 0.37 |
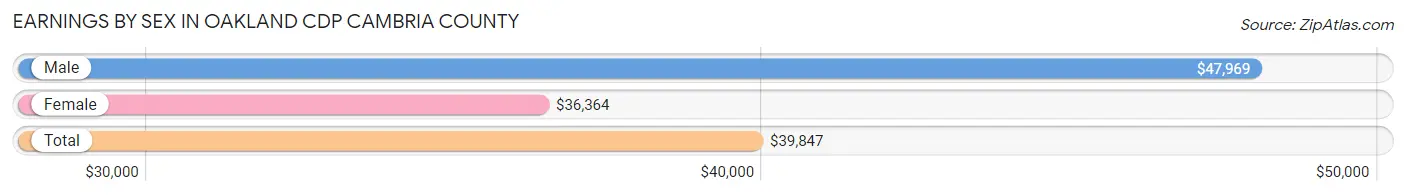
Earnings by Sex in Oakland CDP Cambria County
Average Earnings in Oakland CDP Cambria County are $39,847, $47,969 for men and $36,364 for women, a difference of 24.2%.
| Sex | Number | Average Earnings |
| Male | 464 (55.2%) | $47,969 |
| Female | 376 (44.8%) | $36,364 |
| Total | 840 (100.0%) | $39,847 |
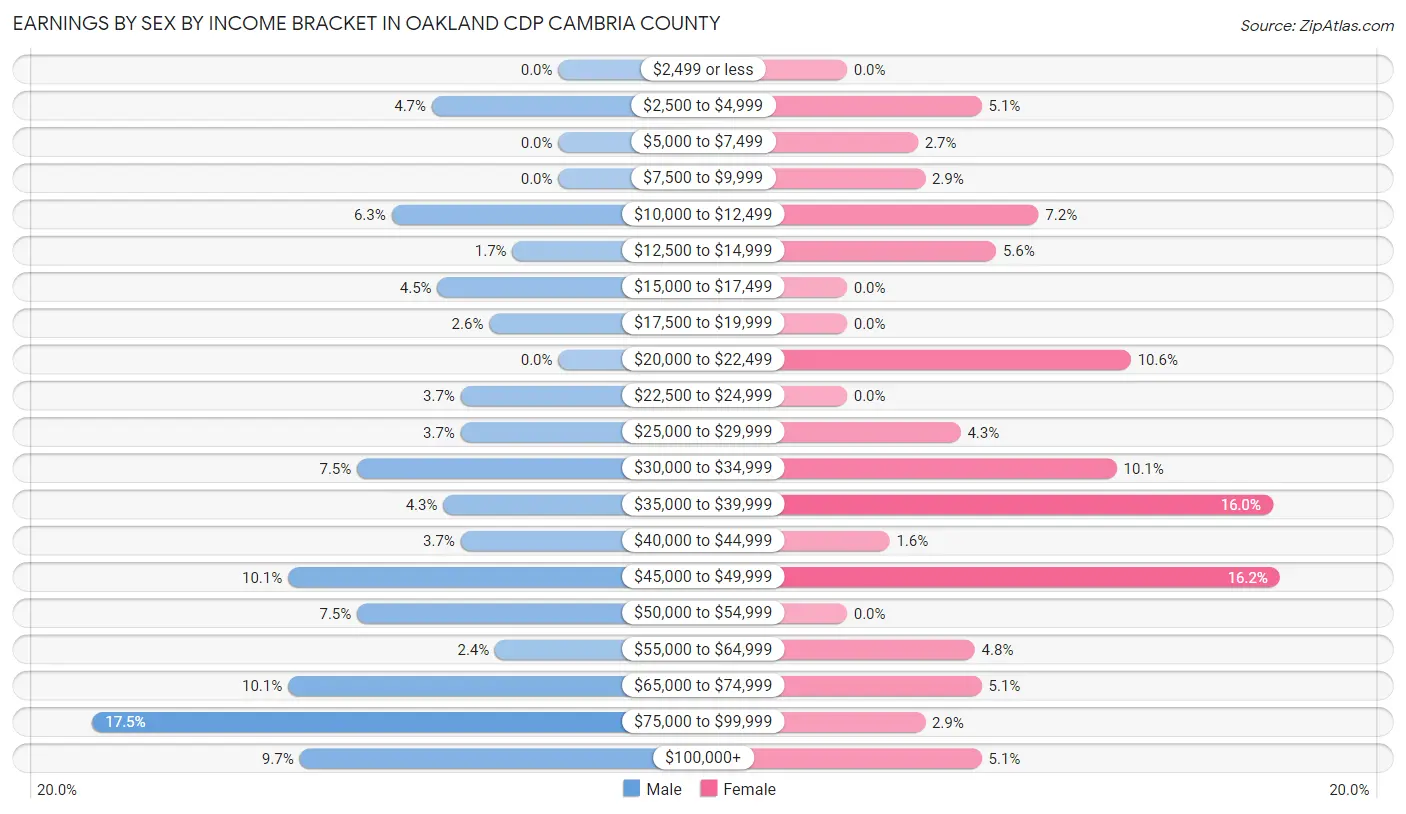
Earnings by Sex by Income Bracket in Oakland CDP Cambria County
The most common earnings brackets in Oakland CDP Cambria County are $75,000 to $99,999 for men (81 | 17.5%) and $45,000 to $49,999 for women (61 | 16.2%).
| Income | Male | Female |
| $2,499 or less | 0 (0.0%) | 0 (0.0%) |
| $2,500 to $4,999 | 22 (4.7%) | 19 (5.1%) |
| $5,000 to $7,499 | 0 (0.0%) | 10 (2.7%) |
| $7,500 to $9,999 | 0 (0.0%) | 11 (2.9%) |
| $10,000 to $12,499 | 29 (6.2%) | 27 (7.2%) |
| $12,500 to $14,999 | 8 (1.7%) | 21 (5.6%) |
| $15,000 to $17,499 | 21 (4.5%) | 0 (0.0%) |
| $17,500 to $19,999 | 12 (2.6%) | 0 (0.0%) |
| $20,000 to $22,499 | 0 (0.0%) | 40 (10.6%) |
| $22,500 to $24,999 | 17 (3.7%) | 0 (0.0%) |
| $25,000 to $29,999 | 17 (3.7%) | 16 (4.3%) |
| $30,000 to $34,999 | 35 (7.5%) | 38 (10.1%) |
| $35,000 to $39,999 | 20 (4.3%) | 60 (16.0%) |
| $40,000 to $44,999 | 17 (3.7%) | 6 (1.6%) |
| $45,000 to $49,999 | 47 (10.1%) | 61 (16.2%) |
| $50,000 to $54,999 | 35 (7.5%) | 0 (0.0%) |
| $55,000 to $64,999 | 11 (2.4%) | 18 (4.8%) |
| $65,000 to $74,999 | 47 (10.1%) | 19 (5.1%) |
| $75,000 to $99,999 | 81 (17.5%) | 11 (2.9%) |
| $100,000+ | 45 (9.7%) | 19 (5.1%) |
| Total | 464 (100.0%) | 376 (100.0%) |
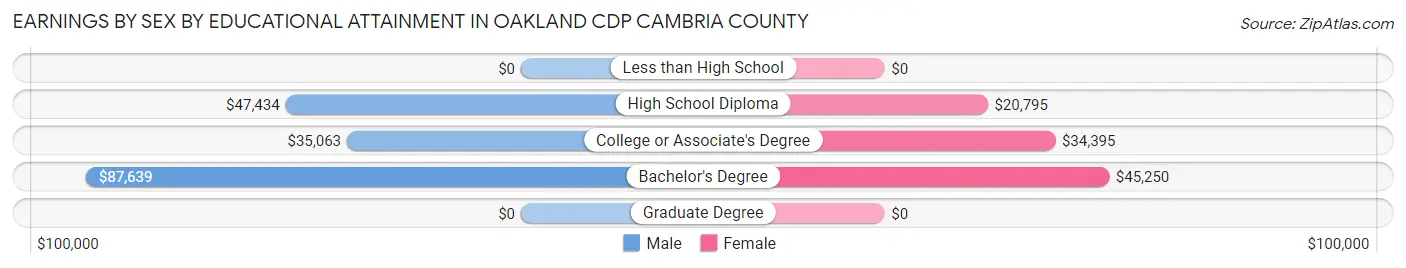
Earnings by Sex by Educational Attainment in Oakland CDP Cambria County
Average earnings in Oakland CDP Cambria County are $47,016 for men and $37,985 for women, a difference of 19.2%. Men with an educational attainment of bachelor's degree enjoy the highest average annual earnings of $87,639, while those with college or associate's degree education earn the least with $35,063. Women with an educational attainment of bachelor's degree earn the most with the average annual earnings of $45,250, while those with high school diploma education have the smallest earnings of $20,795.
| Educational Attainment | Male Income | Female Income |
| Less than High School | - | - |
| High School Diploma | $47,434 | $20,795 |
| College or Associate's Degree | $35,063 | $34,395 |
| Bachelor's Degree | $87,639 | $45,250 |
| Graduate Degree | - | - |
| Total | $47,016 | $37,985 |
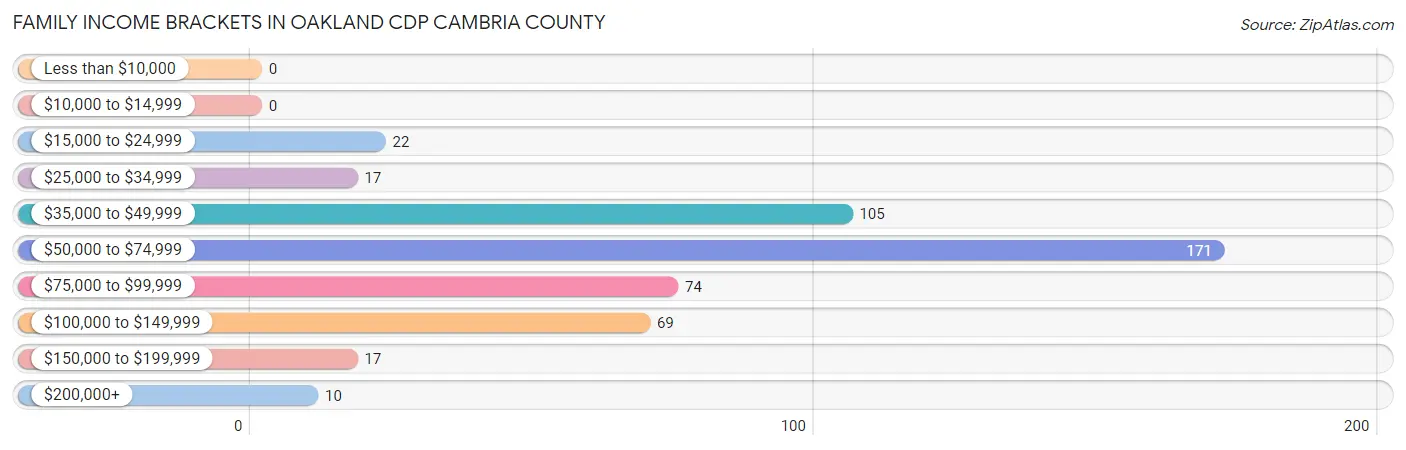
Family Income in Oakland CDP Cambria County
Family Income Brackets in Oakland CDP Cambria County
According to the Oakland CDP Cambria County family income data, there are 171 families falling into the $50,000 to $74,999 income range, which is the most common income bracket and makes up 35.3% of all families.
| Income Bracket | # Families | % Families |
| Less than $10,000 | 0 | 0.0% |
| $10,000 to $14,999 | 0 | 0.0% |
| $15,000 to $24,999 | 22 | 4.5% |
| $25,000 to $34,999 | 17 | 3.5% |
| $35,000 to $49,999 | 105 | 21.6% |
| $50,000 to $74,999 | 171 | 35.3% |
| $75,000 to $99,999 | 74 | 15.3% |
| $100,000 to $149,999 | 69 | 14.2% |
| $150,000 to $199,999 | 17 | 3.5% |
| $200,000+ | 10 | 2.1% |
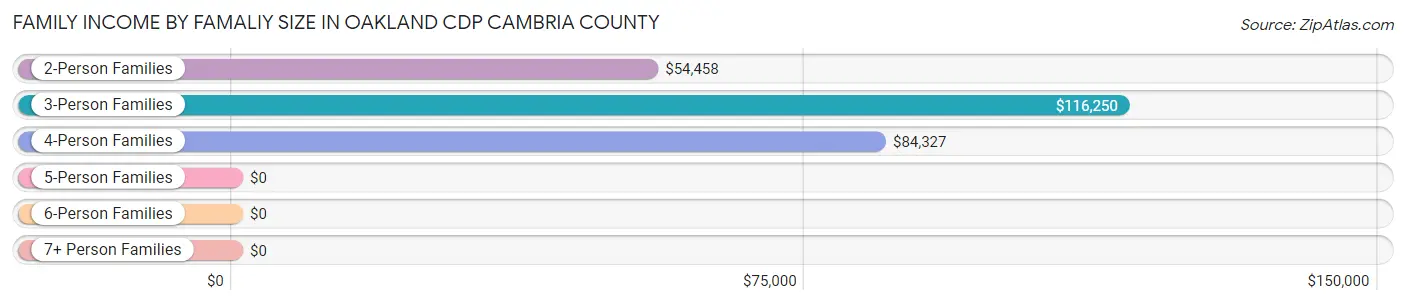
Family Income by Famaliy Size in Oakland CDP Cambria County
3-person families (76 | 15.7%) account for the highest median family income in Oakland CDP Cambria County with $116,250 per family, while 3-person families (76 | 15.7%) have the highest median income of $38,750 per family member.
| Income Bracket | # Families | Median Income |
| 2-Person Families | 365 (75.3%) | $54,458 |
| 3-Person Families | 76 (15.7%) | $116,250 |
| 4-Person Families | 38 (7.8%) | $84,327 |
| 5-Person Families | 6 (1.2%) | $0 |
| 6-Person Families | 0 (0.0%) | $0 |
| 7+ Person Families | 0 (0.0%) | $0 |
| Total | 485 (100.0%) | $61,674 |
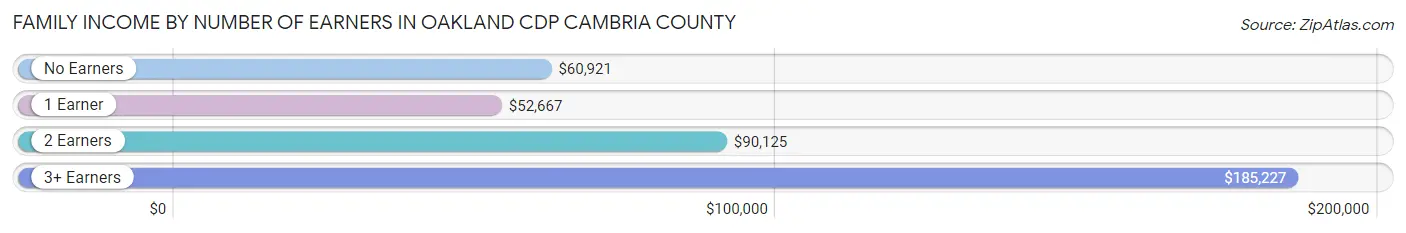
Family Income by Number of Earners in Oakland CDP Cambria County
The median family income in Oakland CDP Cambria County is $61,674, with families comprising 3+ earners (40) having the highest median family income of $185,227, while families with 1 earner (212) have the lowest median family income of $52,667, accounting for 8.3% and 43.7% of families, respectively.
| Number of Earners | # Families | Median Income |
| No Earners | 128 (26.4%) | $60,921 |
| 1 Earner | 212 (43.7%) | $52,667 |
| 2 Earners | 105 (21.6%) | $90,125 |
| 3+ Earners | 40 (8.3%) | $185,227 |
| Total | 485 (100.0%) | $61,674 |
Household Income in Oakland CDP Cambria County
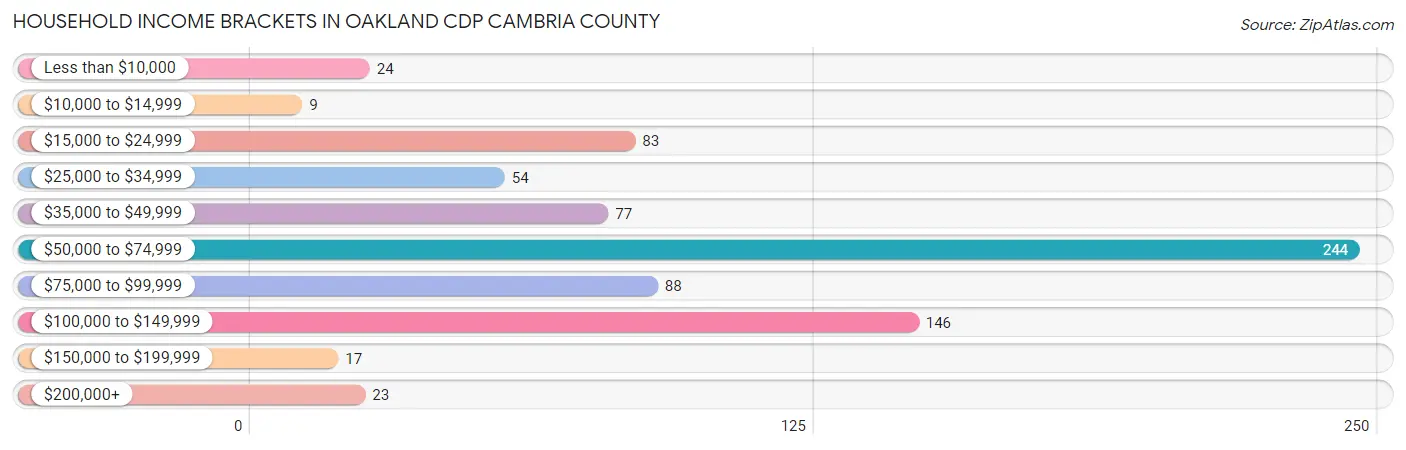
Household Income Brackets in Oakland CDP Cambria County
With 244 households falling in the category, the $50,000 to $74,999 income range is the most frequent in Oakland CDP Cambria County, accounting for 31.9% of all households. In contrast, only 9 households (1.2%) fall into the $10,000 to $14,999 income bracket, making it the least populous group.
| Income Bracket | # Households | % Households |
| Less than $10,000 | 24 | 3.1% |
| $10,000 to $14,999 | 9 | 1.2% |
| $15,000 to $24,999 | 83 | 10.8% |
| $25,000 to $34,999 | 54 | 7.1% |
| $35,000 to $49,999 | 77 | 10.1% |
| $50,000 to $74,999 | 244 | 31.9% |
| $75,000 to $99,999 | 88 | 11.5% |
| $100,000 to $149,999 | 146 | 19.1% |
| $150,000 to $199,999 | 17 | 2.2% |
| $200,000+ | 23 | 3.0% |
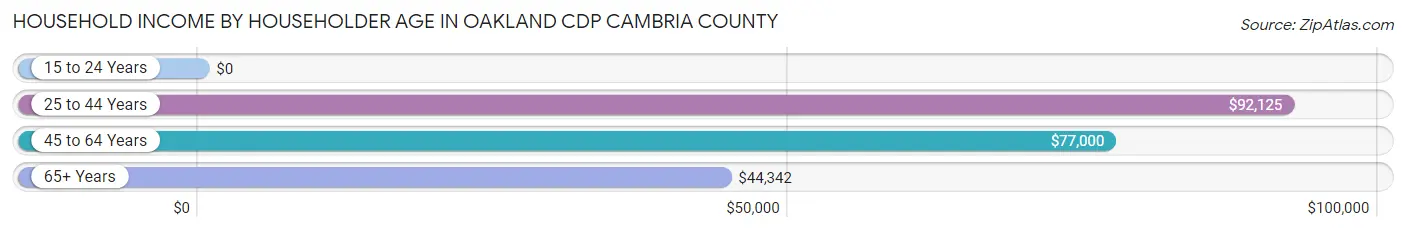
Household Income by Householder Age in Oakland CDP Cambria County
The median household income in Oakland CDP Cambria County is $61,973, with the highest median household income of $92,125 found in the 25 to 44 years age bracket for the primary householder. A total of 155 households (20.3%) fall into this category. Meanwhile, the 15 to 24 years age bracket for the primary householder has the lowest median household income of $0, with 40 households (5.2%) in this group.
| Income Bracket | # Households | Median Income |
| 15 to 24 Years | 40 (5.2%) | $0 |
| 25 to 44 Years | 155 (20.3%) | $92,125 |
| 45 to 64 Years | 290 (37.9%) | $77,000 |
| 65+ Years | 280 (36.6%) | $44,342 |
| Total | 765 (100.0%) | $61,973 |
Poverty in Oakland CDP Cambria County
Income Below Poverty by Sex and Age in Oakland CDP Cambria County
With 12.9% poverty level for males and 8.6% for females among the residents of Oakland CDP Cambria County, 5 year old males and under 5 year old females are the most vulnerable to poverty, with 6 males (100.0%) and 6 females (100.0%) in their respective age groups living below the poverty level.
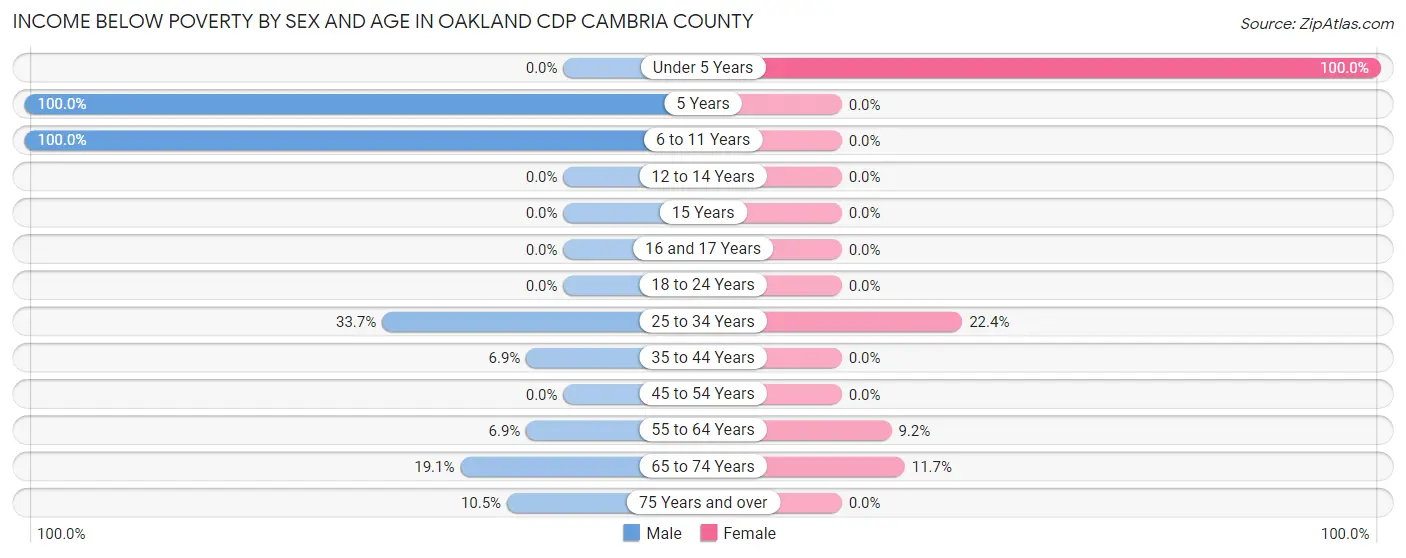
| Age Bracket | Male | Female |
| Under 5 Years | 0 (0.0%) | 6 (100.0%) |
| 5 Years | 6 (100.0%) | 0 (0.0%) |
| 6 to 11 Years | 7 (100.0%) | 0 (0.0%) |
| 12 to 14 Years | 0 (0.0%) | 0 (0.0%) |
| 15 Years | 0 (0.0%) | 0 (0.0%) |
| 16 and 17 Years | 0 (0.0%) | 0 (0.0%) |
| 18 to 24 Years | 0 (0.0%) | 0 (0.0%) |
| 25 to 34 Years | 35 (33.7%) | 19 (22.4%) |
| 35 to 44 Years | 6 (6.9%) | 0 (0.0%) |
| 45 to 54 Years | 0 (0.0%) | 0 (0.0%) |
| 55 to 64 Years | 14 (6.9%) | 19 (9.2%) |
| 65 to 74 Years | 39 (19.1%) | 22 (11.7%) |
| 75 Years and over | 9 (10.5%) | 0 (0.0%) |
| Total | 116 (12.9%) | 66 (8.6%) |
Income Above Poverty by Sex and Age in Oakland CDP Cambria County
According to the poverty statistics in Oakland CDP Cambria County, males aged under 5 years and females aged 5 years are the age groups that are most secure financially, with 100.0% of males and 100.0% of females in these age groups living above the poverty line.
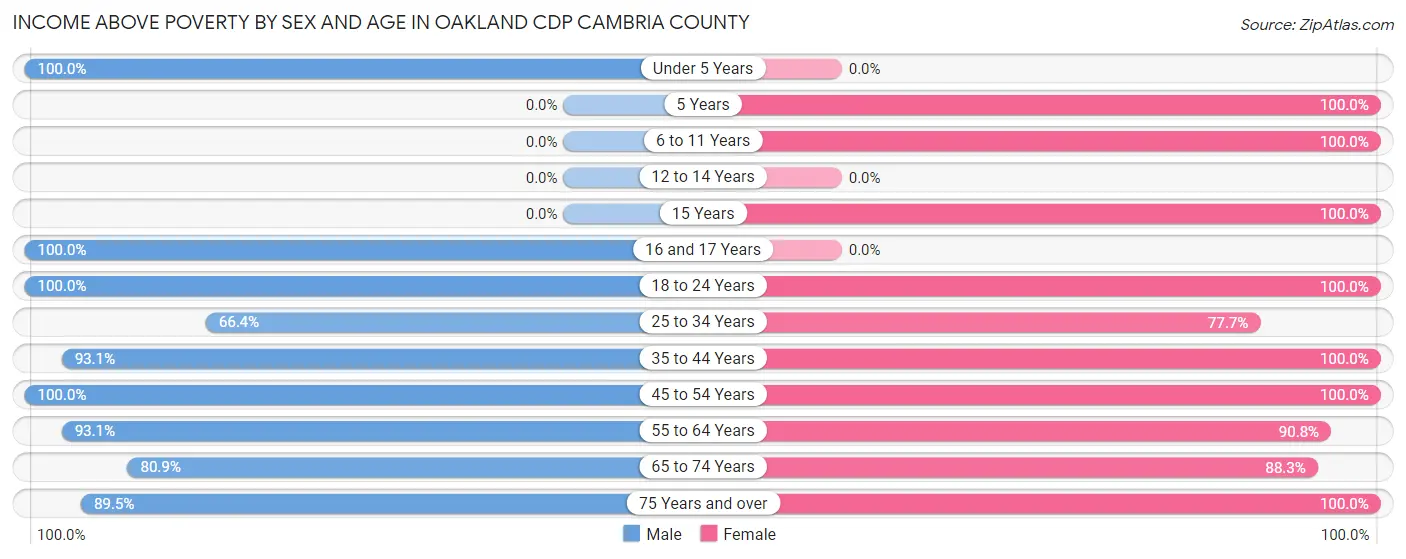
| Age Bracket | Male | Female |
| Under 5 Years | 70 (100.0%) | 0 (0.0%) |
| 5 Years | 0 (0.0%) | 30 (100.0%) |
| 6 to 11 Years | 0 (0.0%) | 17 (100.0%) |
| 12 to 14 Years | 0 (0.0%) | 0 (0.0%) |
| 15 Years | 0 (0.0%) | 26 (100.0%) |
| 16 and 17 Years | 11 (100.0%) | 0 (0.0%) |
| 18 to 24 Years | 98 (100.0%) | 29 (100.0%) |
| 25 to 34 Years | 69 (66.3%) | 66 (77.6%) |
| 35 to 44 Years | 81 (93.1%) | 71 (100.0%) |
| 45 to 54 Years | 22 (100.0%) | 32 (100.0%) |
| 55 to 64 Years | 189 (93.1%) | 187 (90.8%) |
| 65 to 74 Years | 165 (80.9%) | 166 (88.3%) |
| 75 Years and over | 77 (89.5%) | 78 (100.0%) |
| Total | 782 (87.1%) | 702 (91.4%) |
Income Below Poverty Among Married-Couple Families in Oakland CDP Cambria County
The poverty statistics for married-couple families in Oakland CDP Cambria County show that 7.1% or 28 of the total 392 families live below the poverty line. Families with 3 or 4 children have the highest poverty rate of 100.0%, comprising of 6 families. On the other hand, families with 1 or 2 children have the lowest poverty rate of 0.0%, which includes 0 families.
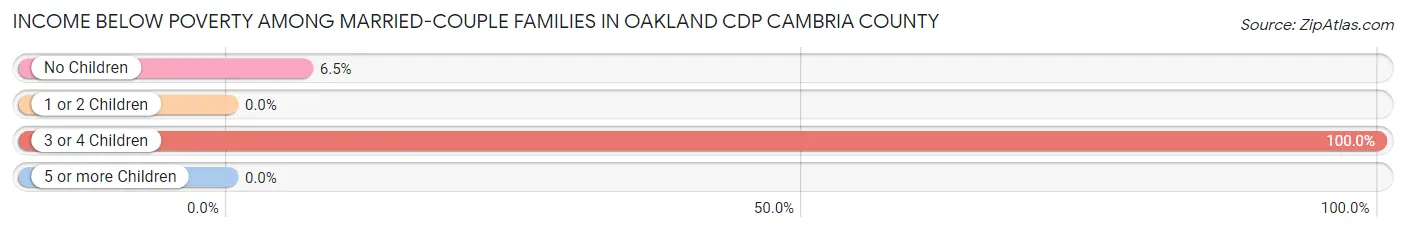
| Children | Above Poverty | Below Poverty |
| No Children | 316 (93.5%) | 22 (6.5%) |
| 1 or 2 Children | 48 (100.0%) | 0 (0.0%) |
| 3 or 4 Children | 0 (0.0%) | 6 (100.0%) |
| 5 or more Children | 0 (0.0%) | 0 (0.0%) |
| Total | 364 (92.9%) | 28 (7.1%) |
Income Below Poverty Among Single-Parent Households in Oakland CDP Cambria County
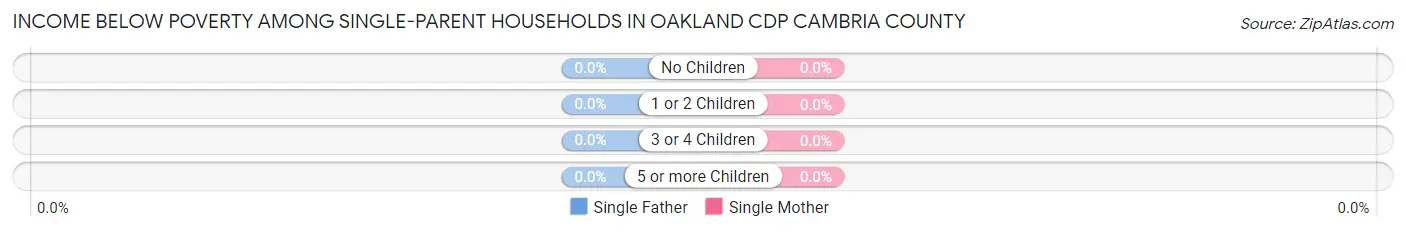
| Children | Single Father | Single Mother |
| No Children | 0 (0.0%) | 0 (0.0%) |
| 1 or 2 Children | 0 (0.0%) | 0 (0.0%) |
| 3 or 4 Children | 0 (0.0%) | 0 (0.0%) |
| 5 or more Children | 0 (0.0%) | 0 (0.0%) |
| Total | 0 (0.0%) | 0 (0.0%) |
Income Below Poverty Among Married-Couple vs Single-Parent Households in Oakland CDP Cambria County
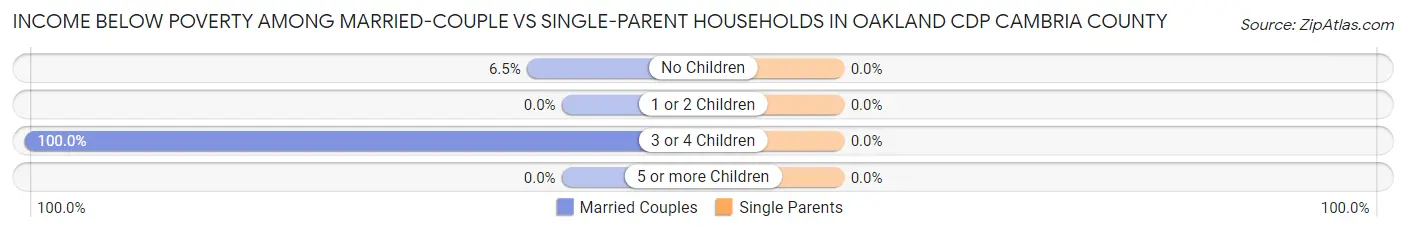
| Children | Married-Couple Families | Single-Parent Households |
| No Children | 22 (6.5%) | 0 (0.0%) |
| 1 or 2 Children | 0 (0.0%) | 0 (0.0%) |
| 3 or 4 Children | 6 (100.0%) | 0 (0.0%) |
| 5 or more Children | 0 (0.0%) | 0 (0.0%) |
| Total | 28 (7.1%) | 0 (0.0%) |
Race in Oakland CDP Cambria County
The most populous races in Oakland CDP Cambria County are White / Caucasian (1,569 | 94.2%), Black / African American (45 | 2.7%), and Some other Race (30 | 1.8%).
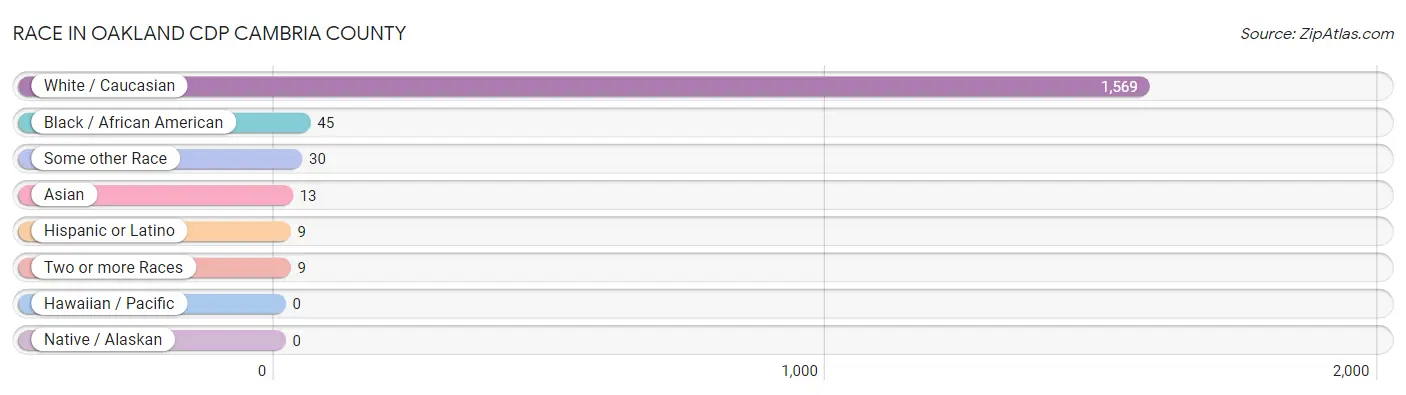
| Race | # Population | % Population |
| Asian | 13 | 0.8% |
| Black / African American | 45 | 2.7% |
| Hawaiian / Pacific | 0 | 0.0% |
| Hispanic or Latino | 9 | 0.5% |
| Native / Alaskan | 0 | 0.0% |
| White / Caucasian | 1,569 | 94.2% |
| Two or more Races | 9 | 0.5% |
| Some other Race | 30 | 1.8% |
| Total | 1,666 | 100.0% |
Ancestry in Oakland CDP Cambria County
The most populous ancestries reported in Oakland CDP Cambria County are German (361 | 21.7%), Irish (166 | 10.0%), Italian (156 | 9.4%), Slovak (135 | 8.1%), and American (114 | 6.8%), together accounting for 55.9% of all Oakland CDP Cambria County residents.
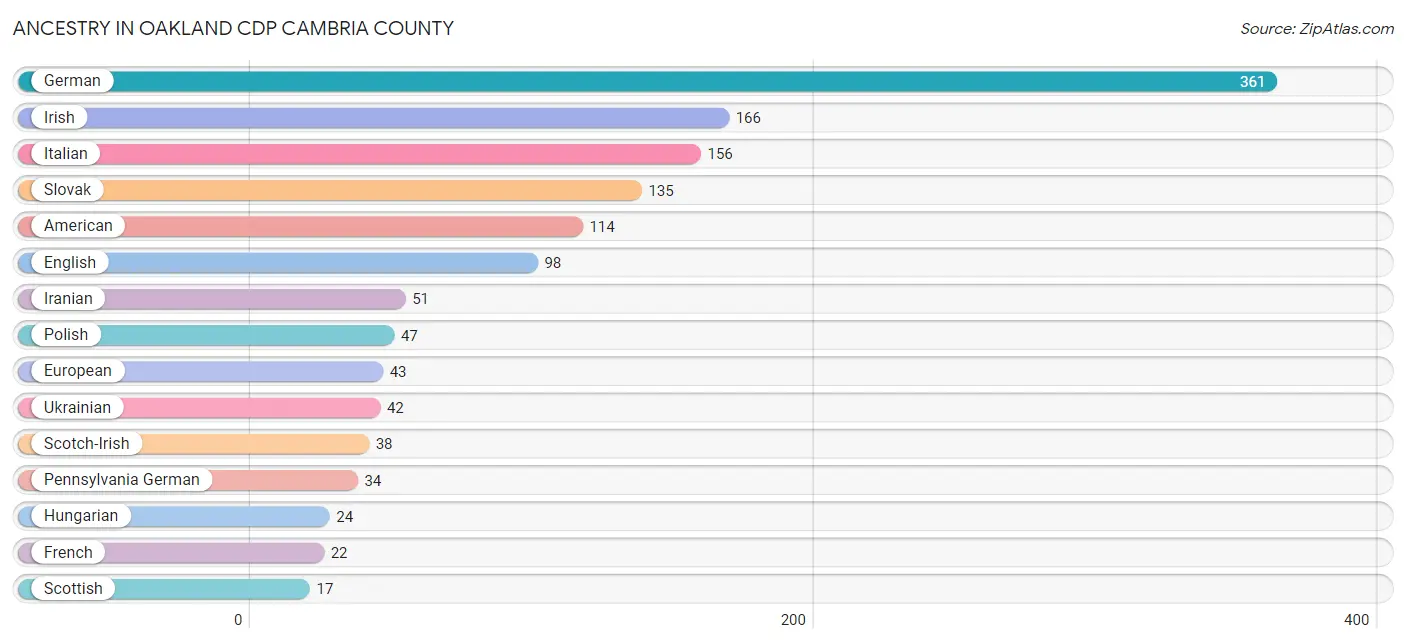
| Ancestry | # Population | % Population |
| American | 114 | 6.8% |
| Croatian | 10 | 0.6% |
| Czech | 9 | 0.5% |
| Eastern European | 11 | 0.7% |
| English | 98 | 5.9% |
| European | 43 | 2.6% |
| French | 22 | 1.3% |
| German | 361 | 21.7% |
| Hungarian | 24 | 1.4% |
| Iranian | 51 | 3.1% |
| Irish | 166 | 10.0% |
| Italian | 156 | 9.4% |
| Korean | 13 | 0.8% |
| Lithuanian | 11 | 0.7% |
| Pennsylvania German | 34 | 2.0% |
| Polish | 47 | 2.8% |
| Russian | 10 | 0.6% |
| Scotch-Irish | 38 | 2.3% |
| Scottish | 17 | 1.0% |
| Slavic | 10 | 0.6% |
| Slovak | 135 | 8.1% |
| Spaniard | 9 | 0.5% |
| Ukrainian | 42 | 2.5% | View All 23 Rows |
Immigrants in Oakland CDP Cambria County
The most numerous immigrant groups reported in Oakland CDP Cambria County came from Asia (64 | 3.8%), Iran (51 | 3.1%), South Central Asia (51 | 3.1%), Philippines (13 | 0.8%), and South Eastern Asia (13 | 0.8%), together accounting for 11.5% of all Oakland CDP Cambria County residents.
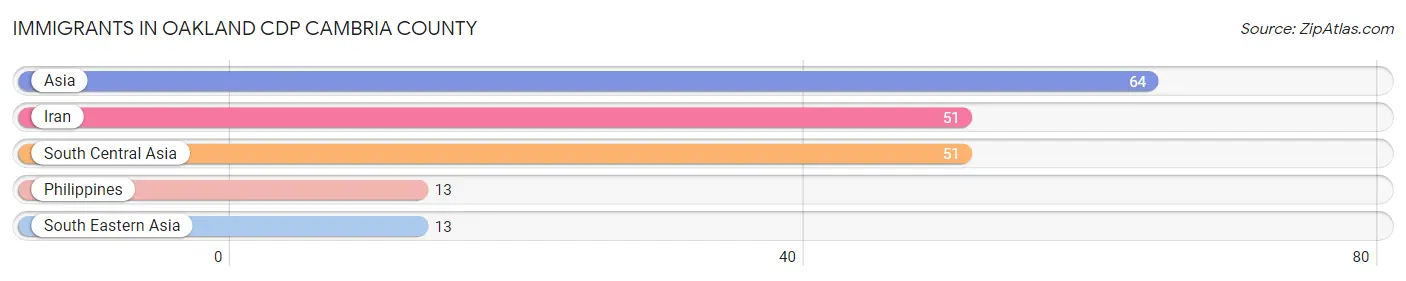
| Immigration Origin | # Population | % Population |
| Asia | 64 | 3.8% |
| Iran | 51 | 3.1% |
| Philippines | 13 | 0.8% |
| South Central Asia | 51 | 3.1% |
| South Eastern Asia | 13 | 0.8% | View All 5 Rows |
Sex and Age in Oakland CDP Cambria County
Sex and Age in Oakland CDP Cambria County
The most populous age groups in Oakland CDP Cambria County are 70 to 74 Years (139 | 15.5%) for men and 70 to 74 Years (117 | 15.2%) for women.
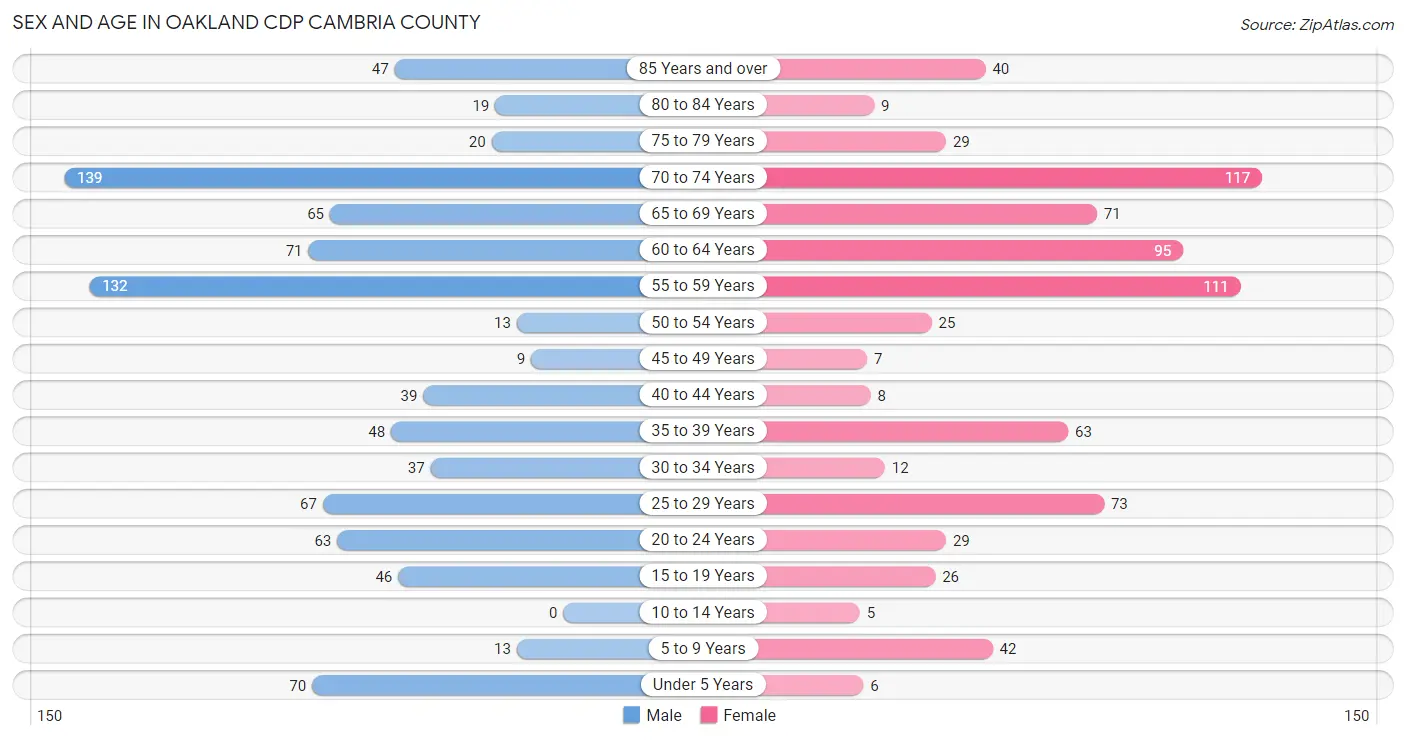
| Age Bracket | Male | Female |
| Under 5 Years | 70 (7.8%) | 6 (0.8%) |
| 5 to 9 Years | 13 (1.5%) | 42 (5.5%) |
| 10 to 14 Years | 0 (0.0%) | 5 (0.6%) |
| 15 to 19 Years | 46 (5.1%) | 26 (3.4%) |
| 20 to 24 Years | 63 (7.0%) | 29 (3.8%) |
| 25 to 29 Years | 67 (7.5%) | 73 (9.5%) |
| 30 to 34 Years | 37 (4.1%) | 12 (1.6%) |
| 35 to 39 Years | 48 (5.3%) | 63 (8.2%) |
| 40 to 44 Years | 39 (4.3%) | 8 (1.0%) |
| 45 to 49 Years | 9 (1.0%) | 7 (0.9%) |
| 50 to 54 Years | 13 (1.5%) | 25 (3.3%) |
| 55 to 59 Years | 132 (14.7%) | 111 (14.4%) |
| 60 to 64 Years | 71 (7.9%) | 95 (12.4%) |
| 65 to 69 Years | 65 (7.2%) | 71 (9.2%) |
| 70 to 74 Years | 139 (15.5%) | 117 (15.2%) |
| 75 to 79 Years | 20 (2.2%) | 29 (3.8%) |
| 80 to 84 Years | 19 (2.1%) | 9 (1.2%) |
| 85 Years and over | 47 (5.2%) | 40 (5.2%) |
| Total | 898 (100.0%) | 768 (100.0%) |
Families and Households in Oakland CDP Cambria County
Median Family Size in Oakland CDP Cambria County
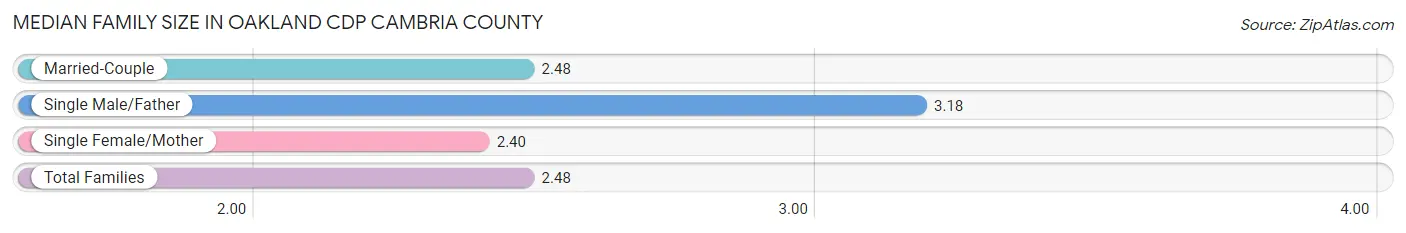
The median family size in Oakland CDP Cambria County is 2.48 persons per family, with single male/father families (11 | 2.3%) accounting for the largest median family size of 3.18 persons per family. On the other hand, single female/mother families (82 | 16.9%) represent the smallest median family size with 2.40 persons per family.
| Family Type | # Families | Family Size |
| Married-Couple | 392 (80.8%) | 2.48 |
| Single Male/Father | 11 (2.3%) | 3.18 |
| Single Female/Mother | 82 (16.9%) | 2.40 |
| Total Families | 485 (100.0%) | 2.48 |
Median Household Size in Oakland CDP Cambria County
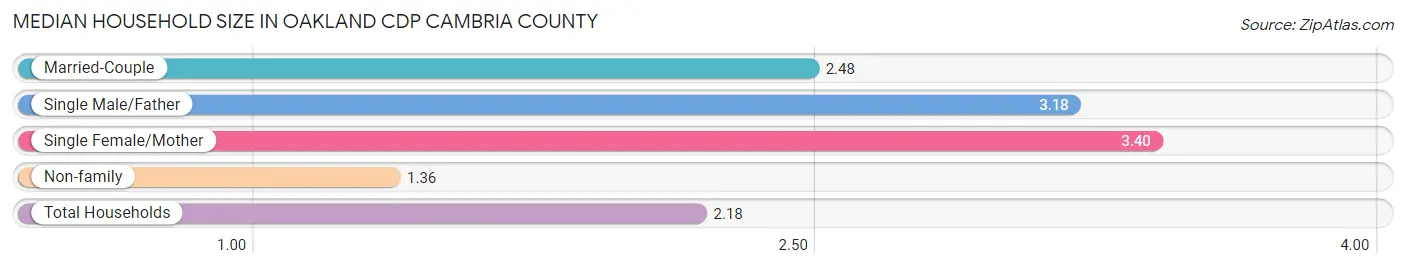
The median household size in Oakland CDP Cambria County is 2.18 persons per household, with single female/mother households (82 | 10.7%) accounting for the largest median household size of 3.4 persons per household. non-family households (280 | 36.6%) represent the smallest median household size with 1.36 persons per household.
| Household Type | # Households | Household Size |
| Married-Couple | 392 (51.2%) | 2.48 |
| Single Male/Father | 11 (1.4%) | 3.18 |
| Single Female/Mother | 82 (10.7%) | 3.40 |
| Non-family | 280 (36.6%) | 1.36 |
| Total Households | 765 (100.0%) | 2.18 |
Household Size by Marriage Status in Oakland CDP Cambria County
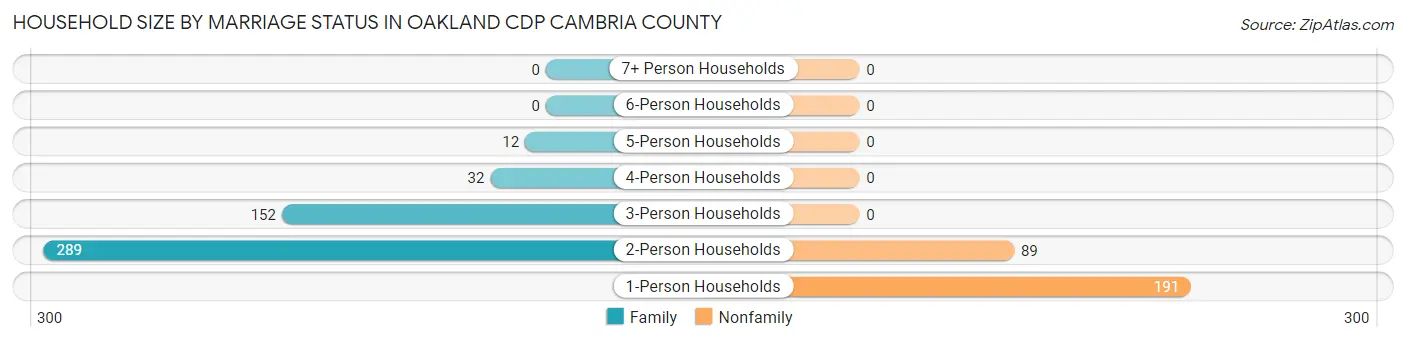
Out of a total of 765 households in Oakland CDP Cambria County, 485 (63.4%) are family households, while 280 (36.6%) are nonfamily households. The most numerous type of family households are 2-person households, comprising 289, and the most common type of nonfamily households are 1-person households, comprising 191.
| Household Size | Family Households | Nonfamily Households |
| 1-Person Households | - | 191 (25.0%) |
| 2-Person Households | 289 (37.8%) | 89 (11.6%) |
| 3-Person Households | 152 (19.9%) | 0 (0.0%) |
| 4-Person Households | 32 (4.2%) | 0 (0.0%) |
| 5-Person Households | 12 (1.6%) | 0 (0.0%) |
| 6-Person Households | 0 (0.0%) | 0 (0.0%) |
| 7+ Person Households | 0 (0.0%) | 0 (0.0%) |
| Total | 485 (63.4%) | 280 (36.6%) |
Female Fertility in Oakland CDP Cambria County
Fertility by Age in Oakland CDP Cambria County
| Age Bracket | Women with Births | Births / 1,000 Women |
| 15 to 19 years | 0 (0.0%) | 0.0 |
| 20 to 34 years | 0 (0.0%) | 0.0 |
| 35 to 50 years | 0 (0.0%) | 0.0 |
| Total | 0 (0.0%) | 0.0 |
Fertility by Age by Marriage Status in Oakland CDP Cambria County
| Age Bracket | Married | Unmarried |
| 15 to 19 years | 0 (0.0%) | 0 (0.0%) |
| 20 to 34 years | 0 (0.0%) | 0 (0.0%) |
| 35 to 50 years | 0 (0.0%) | 0 (0.0%) |
| Total | 0 (0.0%) | 0 (0.0%) |
Fertility by Education in Oakland CDP Cambria County
| Educational Attainment | Women with Births | Births / 1,000 Women |
| Less than High School | 0 (0.0%) | 0.0 |
| High School Diploma | 0 (0.0%) | 0.0 |
| College or Associate's Degree | 0 (0.0%) | 0.0 |
| Bachelor's Degree | 0 (0.0%) | 0.0 |
| Graduate Degree | 0 (0.0%) | 0.0 |
| Total | 0 (0.0%) | 0.0 |
Fertility by Education by Marriage Status in Oakland CDP Cambria County
| Educational Attainment | Married | Unmarried |
| Less than High School | 0 (0.0%) | 0 (0.0%) |
| High School Diploma | 0 (0.0%) | 0 (0.0%) |
| College or Associate's Degree | 0 (0.0%) | 0 (0.0%) |
| Bachelor's Degree | 0 (0.0%) | 0 (0.0%) |
| Graduate Degree | 0 (0.0%) | 0 (0.0%) |
| Total | 0 (0.0%) | 0 (0.0%) |
Employment Characteristics in Oakland CDP Cambria County
Employment by Class of Employer in Oakland CDP Cambria County
Among the 782 employed individuals in Oakland CDP Cambria County, private company employees (540 | 69.1%), not-for-profit organizations (101 | 12.9%), and state government employees (64 | 8.2%) make up the most common classes of employment.
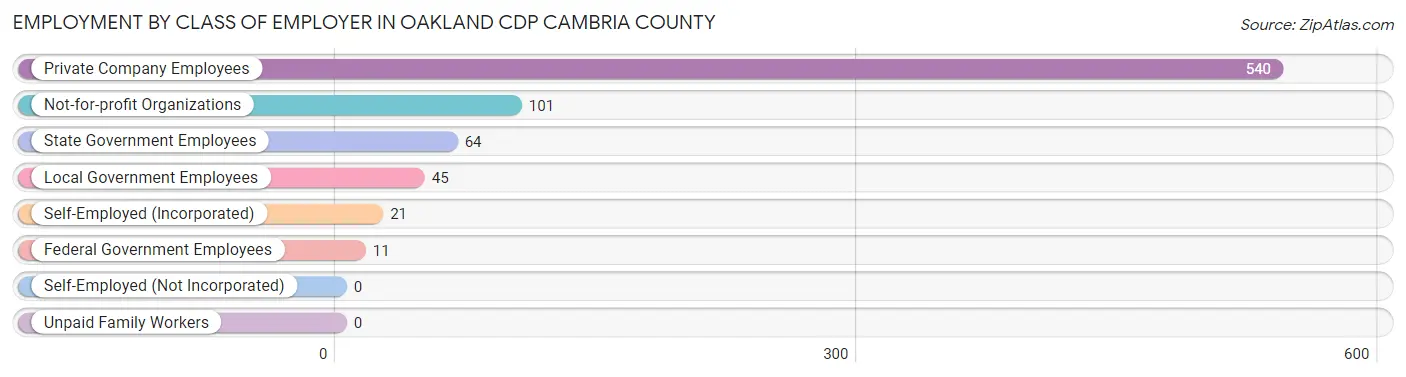
| Employer Class | # Employees | % Employees |
| Private Company Employees | 540 | 69.1% |
| Self-Employed (Incorporated) | 21 | 2.7% |
| Self-Employed (Not Incorporated) | 0 | 0.0% |
| Not-for-profit Organizations | 101 | 12.9% |
| Local Government Employees | 45 | 5.8% |
| State Government Employees | 64 | 8.2% |
| Federal Government Employees | 11 | 1.4% |
| Unpaid Family Workers | 0 | 0.0% |
| Total | 782 | 100.0% |
Employment Status by Age in Oakland CDP Cambria County
According to the labor force statistics for Oakland CDP Cambria County, out of the total population over 16 years of age (1,504), 54.8% or 824 individuals are in the labor force, with 4.2% or 35 of them unemployed. The age group with the highest labor force participation rate is 20 to 24 years, with 100.0% or 92 individuals in the labor force. Within the labor force, the 25 to 29 years age range has the highest percentage of unemployed individuals, with 26.9% or 35 of them being unemployed.
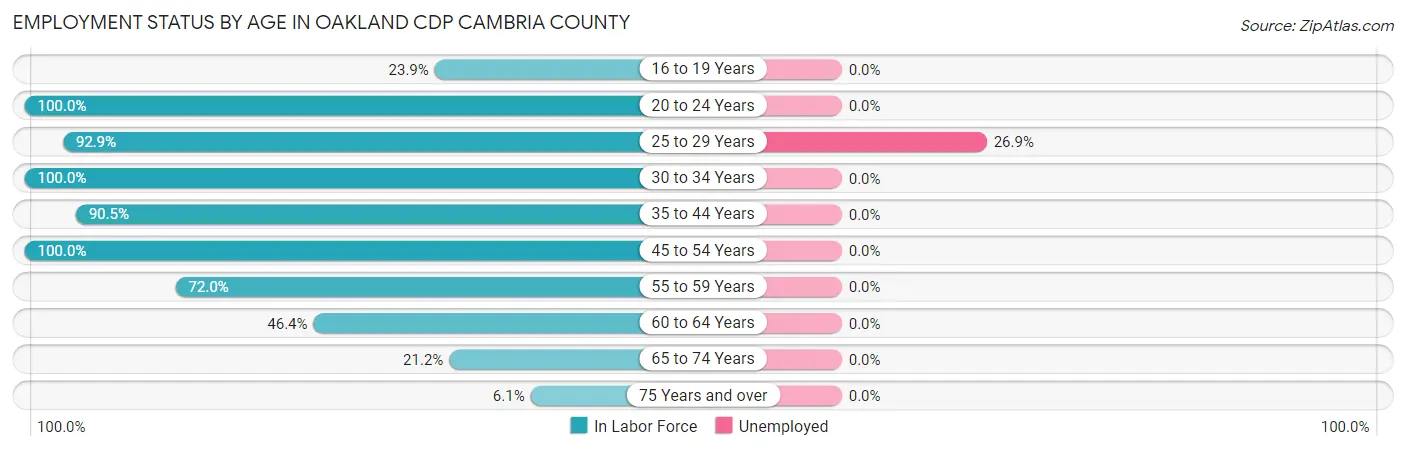
| Age Bracket | In Labor Force | Unemployed |
| 16 to 19 Years | 11 (23.9%) | 0 (0.0%) |
| 20 to 24 Years | 92 (100.0%) | 0 (0.0%) |
| 25 to 29 Years | 130 (92.9%) | 35 (26.9%) |
| 30 to 34 Years | 49 (100.0%) | 0 (0.0%) |
| 35 to 44 Years | 143 (90.5%) | 0 (0.0%) |
| 45 to 54 Years | 54 (100.0%) | 0 (0.0%) |
| 55 to 59 Years | 175 (72.0%) | 0 (0.0%) |
| 60 to 64 Years | 77 (46.4%) | 0 (0.0%) |
| 65 to 74 Years | 83 (21.2%) | 0 (0.0%) |
| 75 Years and over | 10 (6.1%) | 0 (0.0%) |
| Total | 824 (54.8%) | 35 (4.2%) |
Employment Status by Educational Attainment in Oakland CDP Cambria County
According to labor force statistics for Oakland CDP Cambria County, 77.5% of individuals (628) out of the total population between 25 and 64 years of age (810) are in the labor force, with 5.6% or 35 of them being unemployed. The group with the highest labor force participation rate are those with the educational attainment of bachelor's degree or higher, with 87.6% or 204 individuals in the labor force. Within the labor force, individuals with bachelor's degree or higher education have the highest percentage of unemployment, with 17.2% or 35 of them being unemployed.
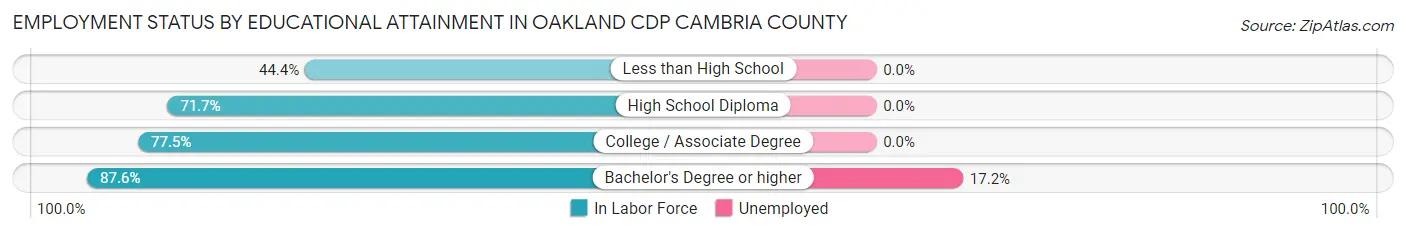
| Educational Attainment | In Labor Force | Unemployed |
| Less than High School | 8 (44.4%) | 0 (0.0%) |
| High School Diploma | 213 (71.7%) | 0 (0.0%) |
| College / Associate Degree | 203 (77.5%) | 0 (0.0%) |
| Bachelor's Degree or higher | 204 (87.6%) | 40 (17.2%) |
| Total | 628 (77.5%) | 45 (5.6%) |
Employment Occupations by Sex in Oakland CDP Cambria County
Management, Business, Science and Arts Occupations
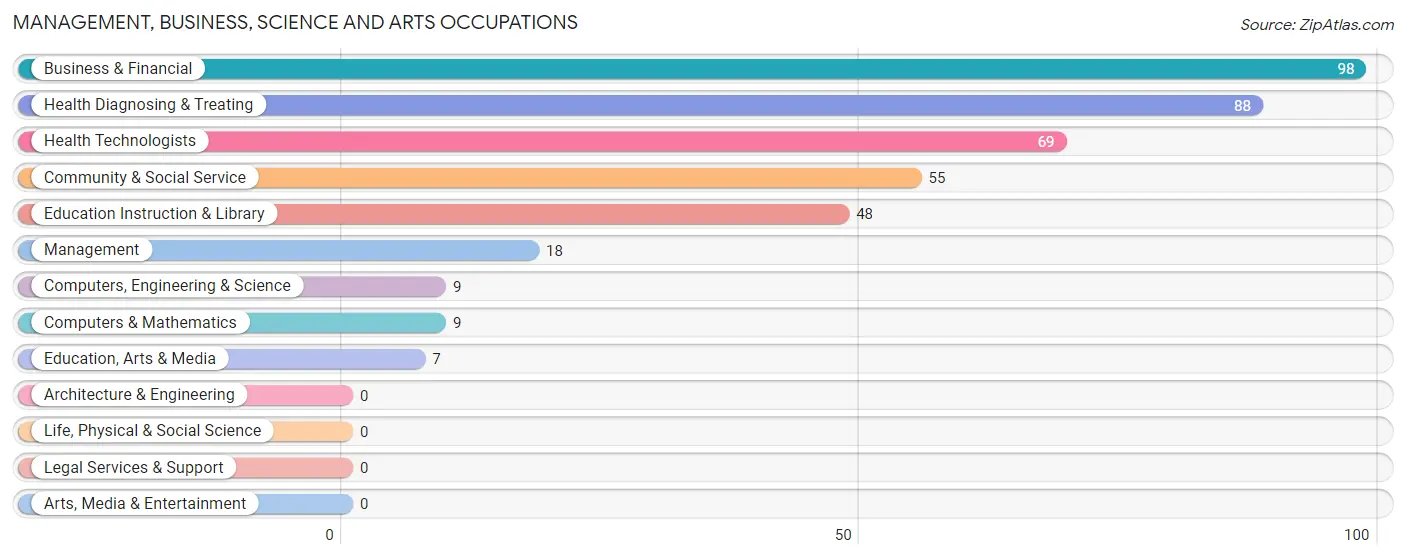
The most common Management, Business, Science and Arts occupations in Oakland CDP Cambria County are Business & Financial (98 | 12.4%), Health Diagnosing & Treating (88 | 11.2%), Health Technologists (69 | 8.7%), Community & Social Service (55 | 7.0%), and Education Instruction & Library (48 | 6.1%).
Management, Business, Science and Arts Occupations by Sex
Within the Management, Business, Science and Arts occupations in Oakland CDP Cambria County, the most male-oriented occupations are Computers, Engineering & Science (100.0%), Computers & Mathematics (100.0%), and Management (61.1%), while the most female-oriented occupations are Community & Social Service (100.0%), Education, Arts & Media (100.0%), and Education Instruction & Library (100.0%).
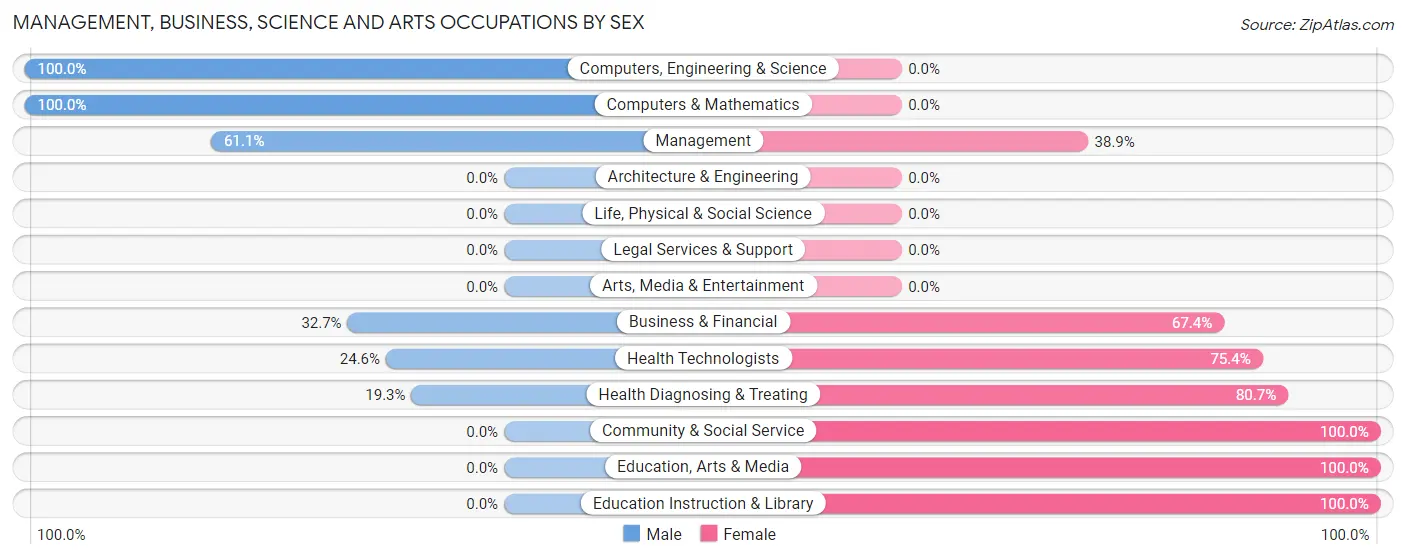
| Occupation | Male | Female |
| Management | 11 (61.1%) | 7 (38.9%) |
| Business & Financial | 32 (32.7%) | 66 (67.3%) |
| Computers, Engineering & Science | 9 (100.0%) | 0 (0.0%) |
| Computers & Mathematics | 9 (100.0%) | 0 (0.0%) |
| Architecture & Engineering | 0 (0.0%) | 0 (0.0%) |
| Life, Physical & Social Science | 0 (0.0%) | 0 (0.0%) |
| Community & Social Service | 0 (0.0%) | 55 (100.0%) |
| Education, Arts & Media | 0 (0.0%) | 7 (100.0%) |
| Legal Services & Support | 0 (0.0%) | 0 (0.0%) |
| Education Instruction & Library | 0 (0.0%) | 48 (100.0%) |
| Arts, Media & Entertainment | 0 (0.0%) | 0 (0.0%) |
| Health Diagnosing & Treating | 17 (19.3%) | 71 (80.7%) |
| Health Technologists | 17 (24.6%) | 52 (75.4%) |
| Total (Category) | 69 (25.8%) | 199 (74.3%) |
| Total (Overall) | 453 (57.4%) | 336 (42.6%) |
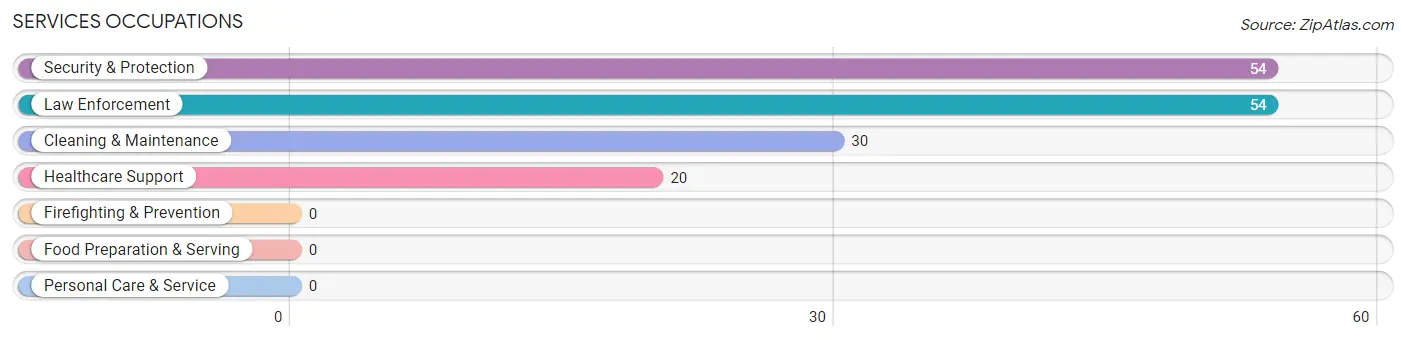
Services Occupations
The most common Services occupations in Oakland CDP Cambria County are Security & Protection (54 | 6.8%), Law Enforcement (54 | 6.8%), Cleaning & Maintenance (30 | 3.8%), and Healthcare Support (20 | 2.5%).
Services Occupations by Sex
Within the Services occupations in Oakland CDP Cambria County, the most male-oriented occupations are Security & Protection (100.0%), Law Enforcement (100.0%), and Cleaning & Maintenance (76.7%), while the most female-oriented occupations are Healthcare Support (55.0%), and Cleaning & Maintenance (23.3%).
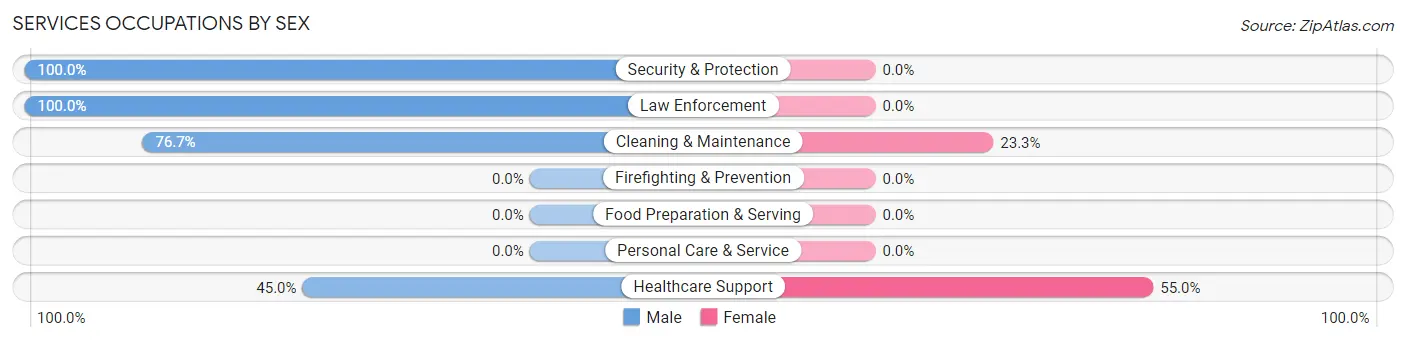
| Occupation | Male | Female |
| Healthcare Support | 9 (45.0%) | 11 (55.0%) |
| Security & Protection | 54 (100.0%) | 0 (0.0%) |
| Firefighting & Prevention | 0 (0.0%) | 0 (0.0%) |
| Law Enforcement | 54 (100.0%) | 0 (0.0%) |
| Food Preparation & Serving | 0 (0.0%) | 0 (0.0%) |
| Cleaning & Maintenance | 23 (76.7%) | 7 (23.3%) |
| Personal Care & Service | 0 (0.0%) | 0 (0.0%) |
| Total (Category) | 86 (82.7%) | 18 (17.3%) |
| Total (Overall) | 453 (57.4%) | 336 (42.6%) |
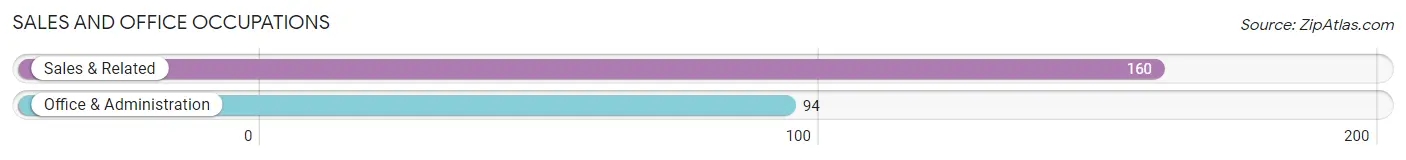
Sales and Office Occupations
The most common Sales and Office occupations in Oakland CDP Cambria County are Sales & Related (160 | 20.3%), and Office & Administration (94 | 11.9%).
Sales and Office Occupations by Sex
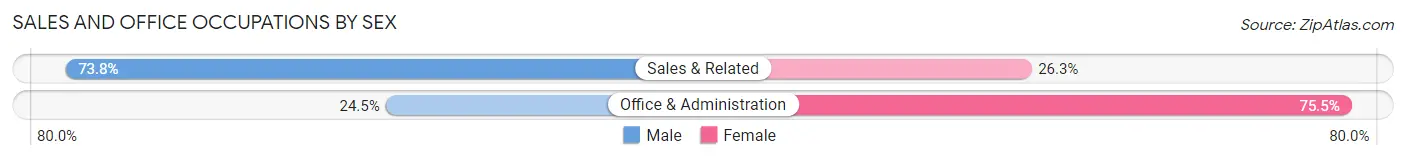
| Occupation | Male | Female |
| Sales & Related | 118 (73.8%) | 42 (26.3%) |
| Office & Administration | 23 (24.5%) | 71 (75.5%) |
| Total (Category) | 141 (55.5%) | 113 (44.5%) |
| Total (Overall) | 453 (57.4%) | 336 (42.6%) |
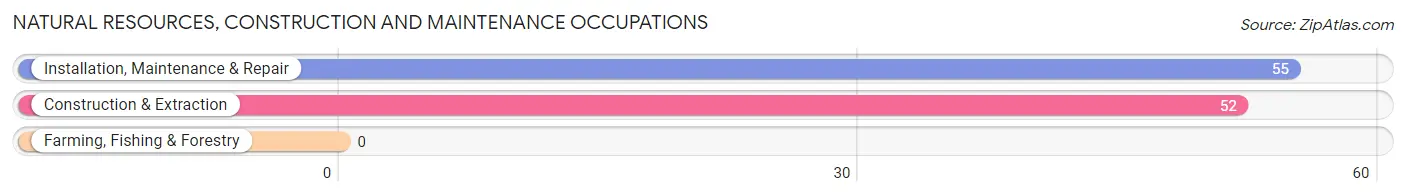
Natural Resources, Construction and Maintenance Occupations
The most common Natural Resources, Construction and Maintenance occupations in Oakland CDP Cambria County are Installation, Maintenance & Repair (55 | 7.0%), and Construction & Extraction (52 | 6.6%).
Natural Resources, Construction and Maintenance Occupations by Sex
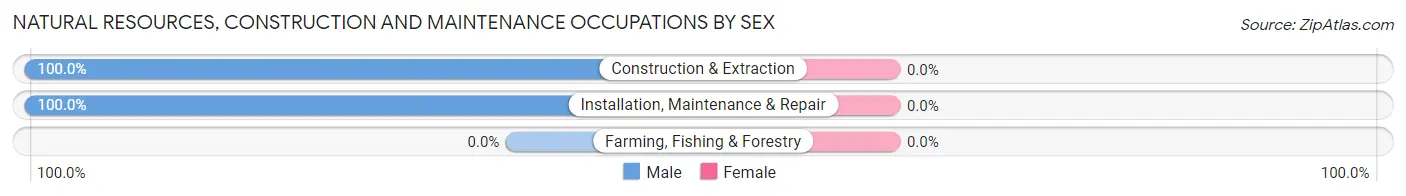
| Occupation | Male | Female |
| Farming, Fishing & Forestry | 0 (0.0%) | 0 (0.0%) |
| Construction & Extraction | 52 (100.0%) | 0 (0.0%) |
| Installation, Maintenance & Repair | 55 (100.0%) | 0 (0.0%) |
| Total (Category) | 107 (100.0%) | 0 (0.0%) |
| Total (Overall) | 453 (57.4%) | 336 (42.6%) |
Production, Transportation and Moving Occupations
The most common Production, Transportation and Moving occupations in Oakland CDP Cambria County are Transportation (44 | 5.6%), and Production (12 | 1.5%).
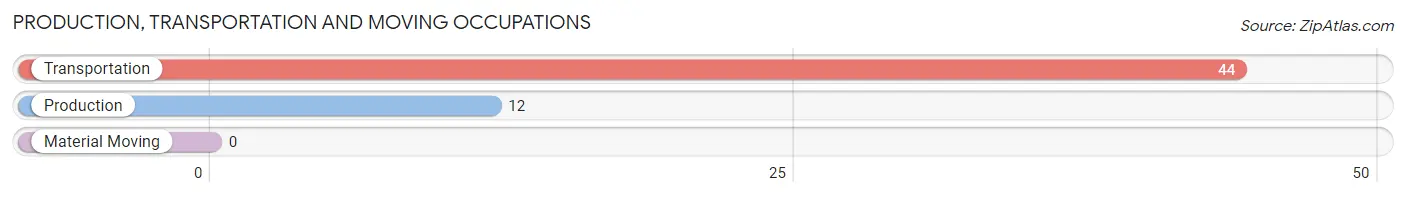
Production, Transportation and Moving Occupations by Sex
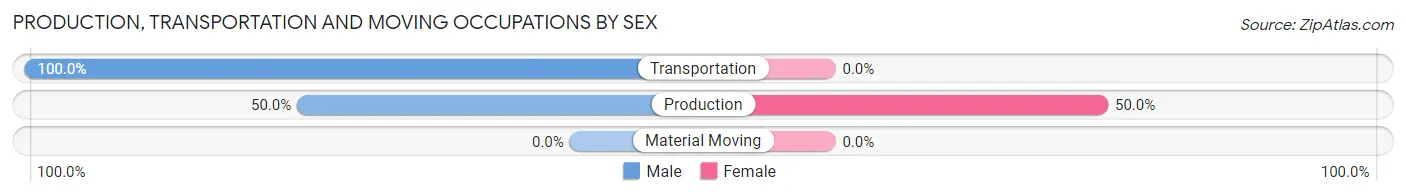
| Occupation | Male | Female |
| Production | 6 (50.0%) | 6 (50.0%) |
| Transportation | 44 (100.0%) | 0 (0.0%) |
| Material Moving | 0 (0.0%) | 0 (0.0%) |
| Total (Category) | 50 (89.3%) | 6 (10.7%) |
| Total (Overall) | 453 (57.4%) | 336 (42.6%) |
Employment Industries by Sex in Oakland CDP Cambria County
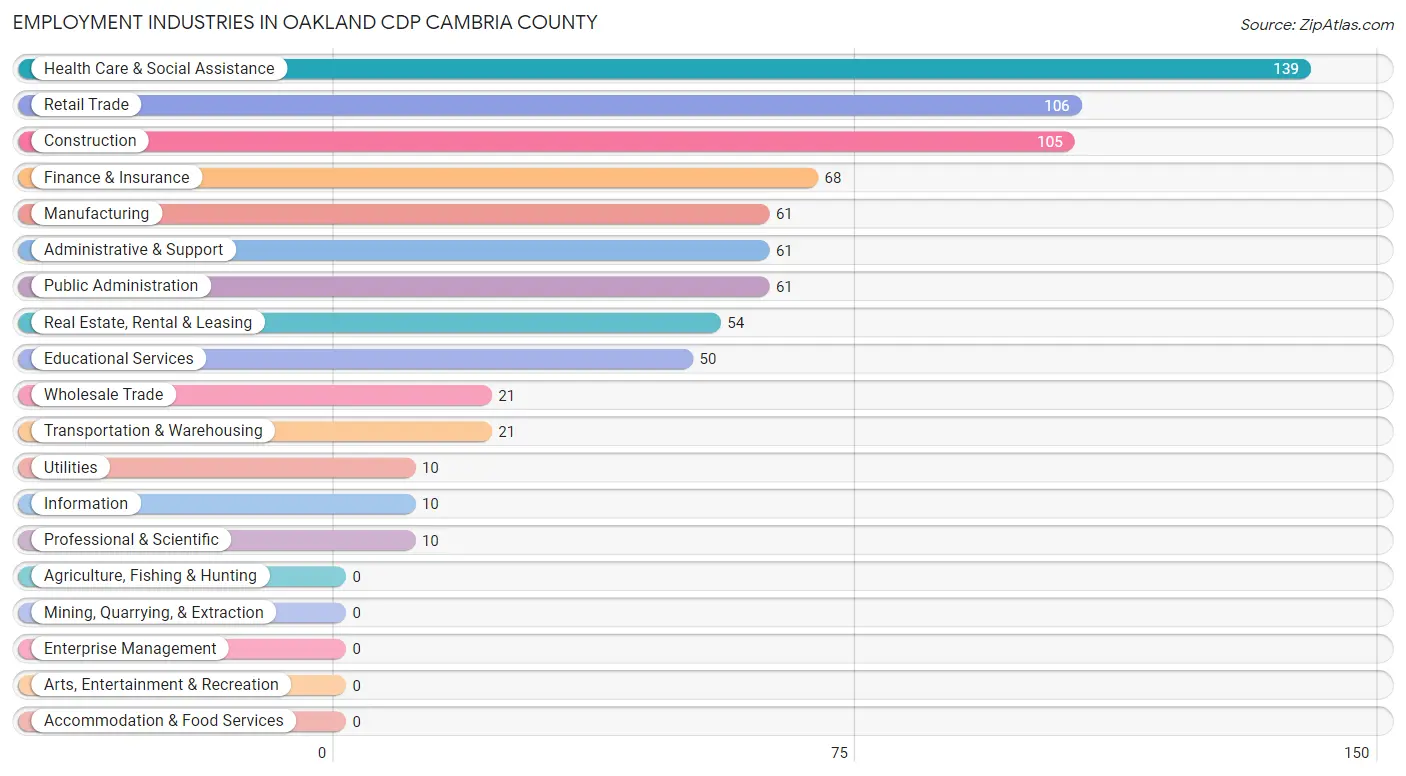
Employment Industries in Oakland CDP Cambria County
The major employment industries in Oakland CDP Cambria County include Health Care & Social Assistance (139 | 17.6%), Retail Trade (106 | 13.4%), Construction (105 | 13.3%), Finance & Insurance (68 | 8.6%), and Manufacturing (61 | 7.7%).
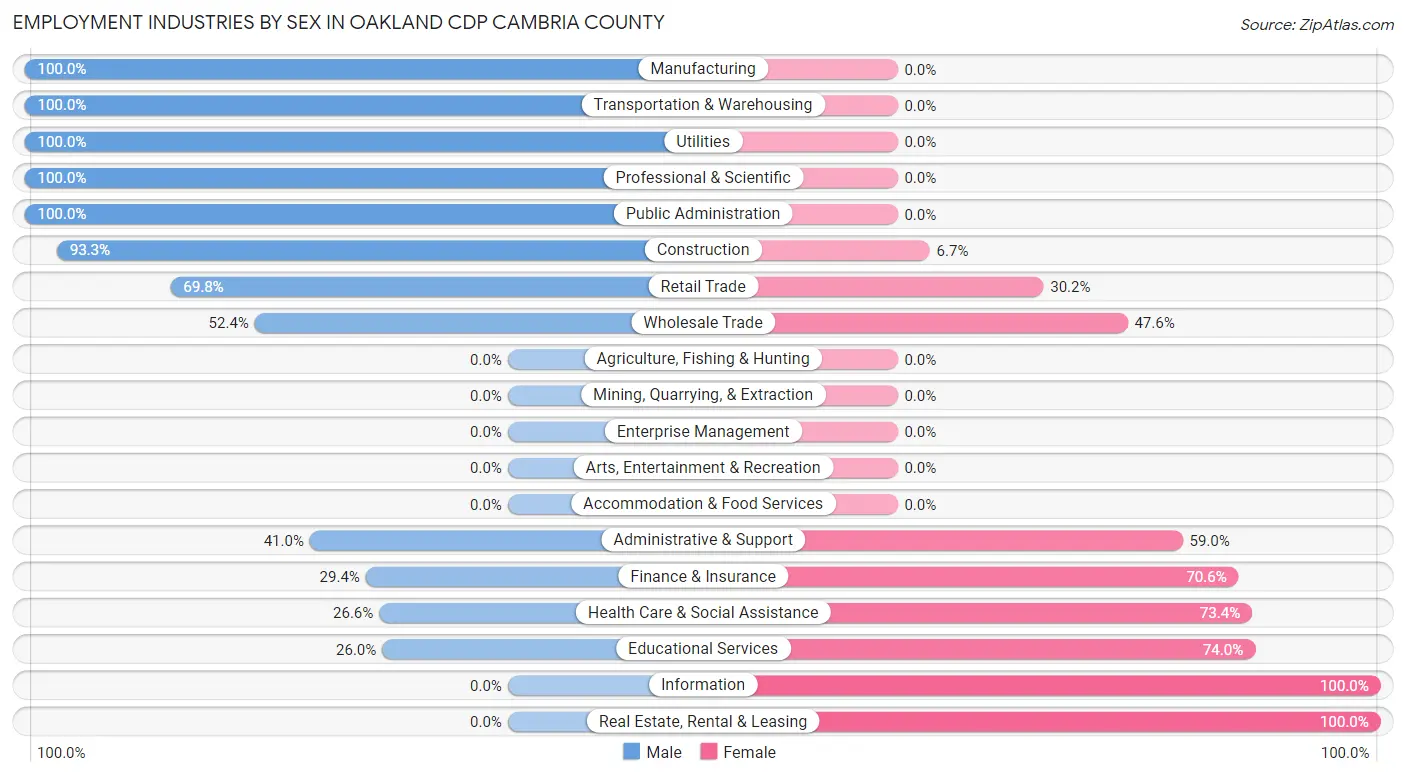
Employment Industries by Sex in Oakland CDP Cambria County
The Oakland CDP Cambria County industries that see more men than women are Manufacturing (100.0%), Transportation & Warehousing (100.0%), and Utilities (100.0%), whereas the industries that tend to have a higher number of women are Information (100.0%), Real Estate, Rental & Leasing (100.0%), and Educational Services (74.0%).
| Industry | Male | Female |
| Agriculture, Fishing & Hunting | 0 (0.0%) | 0 (0.0%) |
| Mining, Quarrying, & Extraction | 0 (0.0%) | 0 (0.0%) |
| Construction | 98 (93.3%) | 7 (6.7%) |
| Manufacturing | 61 (100.0%) | 0 (0.0%) |
| Wholesale Trade | 11 (52.4%) | 10 (47.6%) |
| Retail Trade | 74 (69.8%) | 32 (30.2%) |
| Transportation & Warehousing | 21 (100.0%) | 0 (0.0%) |
| Utilities | 10 (100.0%) | 0 (0.0%) |
| Information | 0 (0.0%) | 10 (100.0%) |
| Finance & Insurance | 20 (29.4%) | 48 (70.6%) |
| Real Estate, Rental & Leasing | 0 (0.0%) | 54 (100.0%) |
| Professional & Scientific | 10 (100.0%) | 0 (0.0%) |
| Enterprise Management | 0 (0.0%) | 0 (0.0%) |
| Administrative & Support | 25 (41.0%) | 36 (59.0%) |
| Educational Services | 13 (26.0%) | 37 (74.0%) |
| Health Care & Social Assistance | 37 (26.6%) | 102 (73.4%) |
| Arts, Entertainment & Recreation | 0 (0.0%) | 0 (0.0%) |
| Accommodation & Food Services | 0 (0.0%) | 0 (0.0%) |
| Public Administration | 61 (100.0%) | 0 (0.0%) |
| Total | 453 (57.4%) | 336 (42.6%) |
Education in Oakland CDP Cambria County
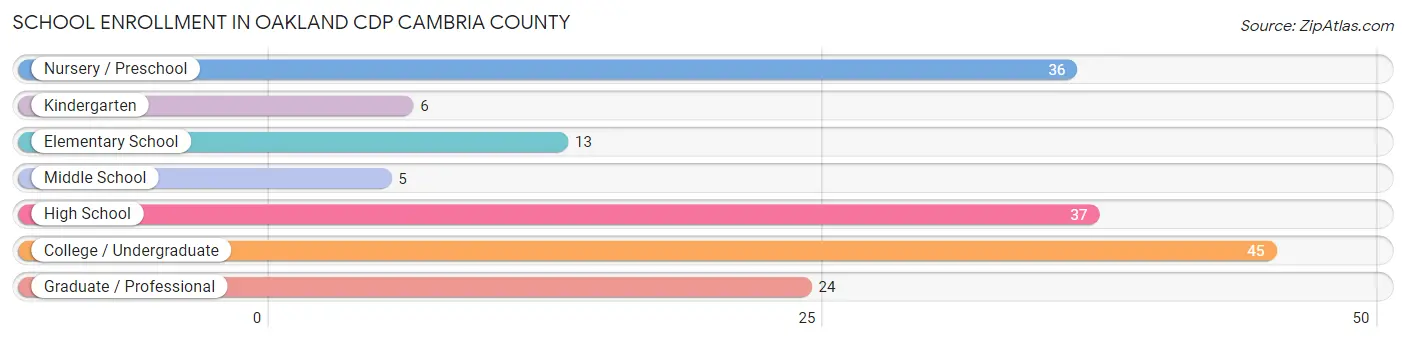
School Enrollment in Oakland CDP Cambria County
The most common levels of schooling among the 166 students in Oakland CDP Cambria County are college / undergraduate (45 | 27.1%), high school (37 | 22.3%), and nursery / preschool (36 | 21.7%).
| School Level | # Students | % Students |
| Nursery / Preschool | 36 | 21.7% |
| Kindergarten | 6 | 3.6% |
| Elementary School | 13 | 7.8% |
| Middle School | 5 | 3.0% |
| High School | 37 | 22.3% |
| College / Undergraduate | 45 | 27.1% |
| Graduate / Professional | 24 | 14.5% |
| Total | 166 | 100.0% |
School Enrollment by Age by Funding Source in Oakland CDP Cambria County
Out of a total of 166 students who are enrolled in schools in Oakland CDP Cambria County, 61 (36.7%) attend a private institution, while the remaining 105 (63.3%) are enrolled in public schools. The age group of 10 to 14 year olds has the highest likelihood of being enrolled in private schools, with 5 (100.0% in the age bracket) enrolled. Conversely, the age group of 18 to 19 year olds has the lowest likelihood of being enrolled in a private school, with 35 (100.0% in the age bracket) attending a public institution.
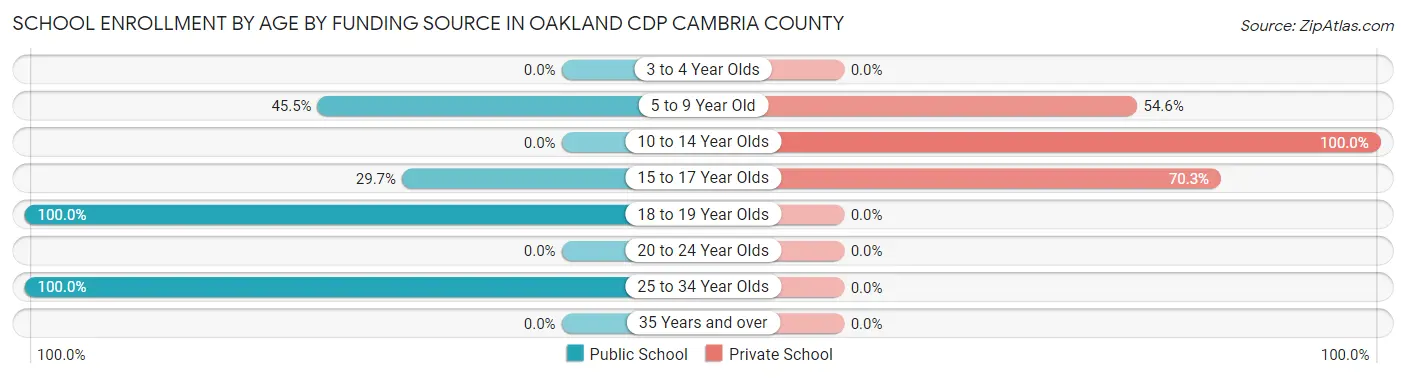
| Age Bracket | Public School | Private School |
| 3 to 4 Year Olds | 0 (0.0%) | 0 (0.0%) |
| 5 to 9 Year Old | 25 (45.5%) | 30 (54.5%) |
| 10 to 14 Year Olds | 0 (0.0%) | 5 (100.0%) |
| 15 to 17 Year Olds | 11 (29.7%) | 26 (70.3%) |
| 18 to 19 Year Olds | 35 (100.0%) | 0 (0.0%) |
| 20 to 24 Year Olds | 0 (0.0%) | 0 (0.0%) |
| 25 to 34 Year Olds | 34 (100.0%) | 0 (0.0%) |
| 35 Years and over | 0 (0.0%) | 0 (0.0%) |
| Total | 105 (63.3%) | 61 (36.7%) |
Educational Attainment by Field of Study in Oakland CDP Cambria County
Business (135 | 42.6%), bio, nature & agricultural (39 | 12.3%), education (39 | 12.3%), science & technology (28 | 8.8%), and psychology (22 | 6.9%) are the most common fields of study among 317 individuals in Oakland CDP Cambria County who have obtained a bachelor's degree or higher.
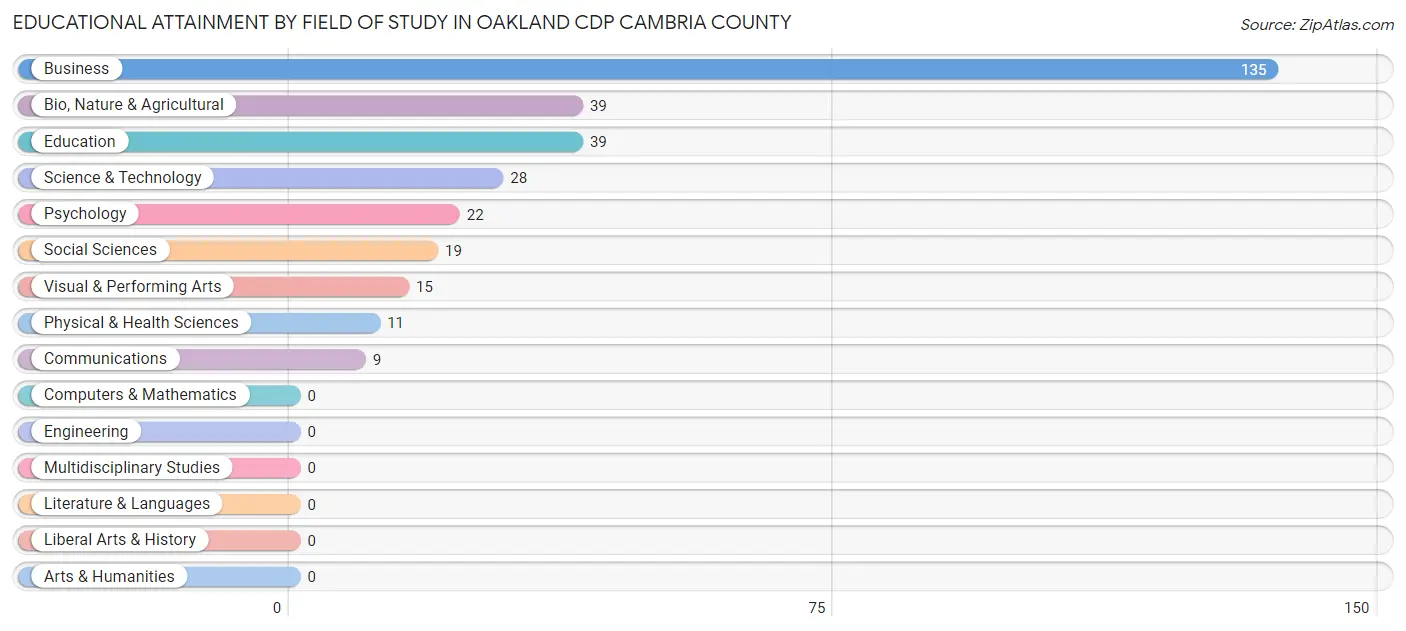
| Field of Study | # Graduates | % Graduates |
| Computers & Mathematics | 0 | 0.0% |
| Bio, Nature & Agricultural | 39 | 12.3% |
| Physical & Health Sciences | 11 | 3.5% |
| Psychology | 22 | 6.9% |
| Social Sciences | 19 | 6.0% |
| Engineering | 0 | 0.0% |
| Multidisciplinary Studies | 0 | 0.0% |
| Science & Technology | 28 | 8.8% |
| Business | 135 | 42.6% |
| Education | 39 | 12.3% |
| Literature & Languages | 0 | 0.0% |
| Liberal Arts & History | 0 | 0.0% |
| Visual & Performing Arts | 15 | 4.7% |
| Communications | 9 | 2.8% |
| Arts & Humanities | 0 | 0.0% |
| Total | 317 | 100.0% |
Transportation & Commute in Oakland CDP Cambria County
Vehicle Availability by Sex in Oakland CDP Cambria County
The most prevalent vehicle ownership categories in Oakland CDP Cambria County are males with 2 vehicles (288, accounting for 63.6%) and females with 2 vehicles (218, making up 87.5%).
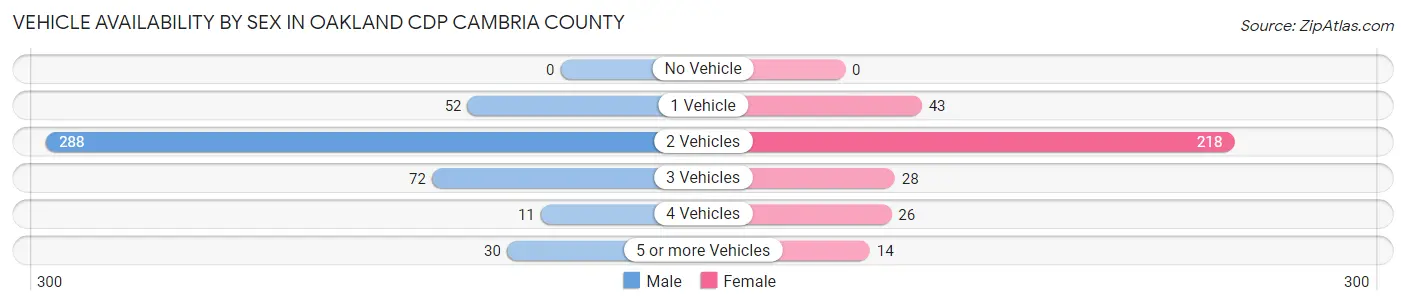
| Vehicles Available | Male | Female |
| No Vehicle | 0 (0.0%) | 0 (0.0%) |
| 1 Vehicle | 52 (11.5%) | 43 (13.1%) |
| 2 Vehicles | 288 (63.6%) | 218 (66.3%) |
| 3 Vehicles | 72 (15.9%) | 28 (8.5%) |
| 4 Vehicles | 11 (2.4%) | 26 (7.9%) |
| 5 or more Vehicles | 30 (6.6%) | 14 (4.3%) |
| Total | 453 (100.0%) | 329 (100.0%) |
Commute Time in Oakland CDP Cambria County
The most frequently occuring commute durations in Oakland CDP Cambria County are 10 to 14 minutes (201 commuters, 28.3%), 5 to 9 minutes (145 commuters, 20.4%), and 15 to 19 minutes (138 commuters, 19.4%).
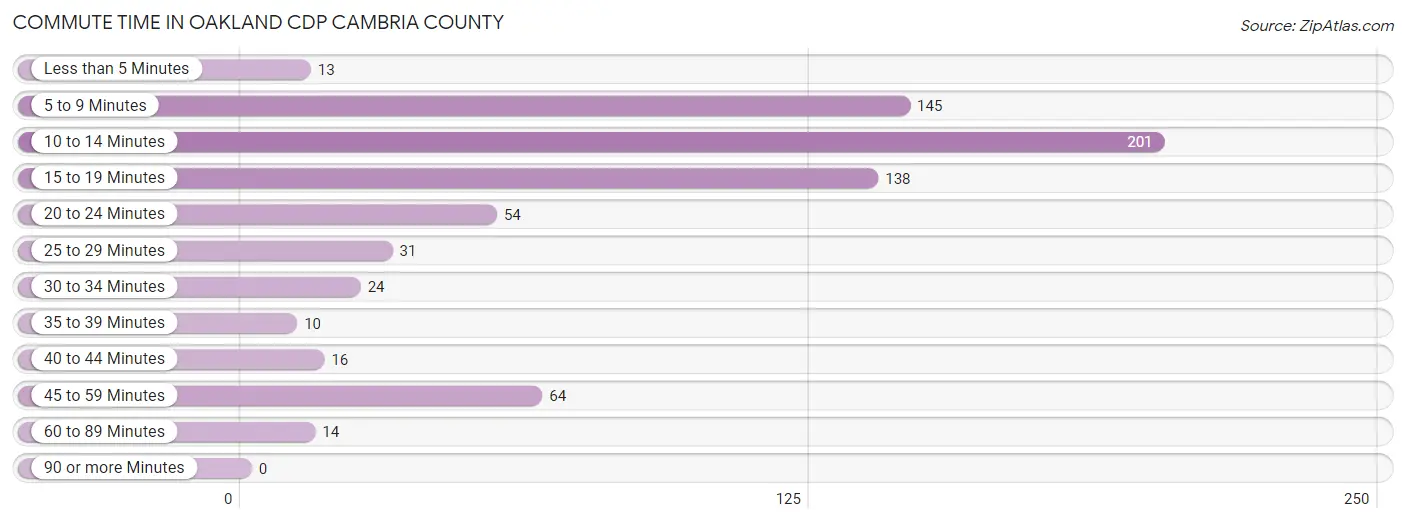
| Commute Time | # Commuters | % Commuters |
| Less than 5 Minutes | 13 | 1.8% |
| 5 to 9 Minutes | 145 | 20.4% |
| 10 to 14 Minutes | 201 | 28.3% |
| 15 to 19 Minutes | 138 | 19.4% |
| 20 to 24 Minutes | 54 | 7.6% |
| 25 to 29 Minutes | 31 | 4.4% |
| 30 to 34 Minutes | 24 | 3.4% |
| 35 to 39 Minutes | 10 | 1.4% |
| 40 to 44 Minutes | 16 | 2.2% |
| 45 to 59 Minutes | 64 | 9.0% |
| 60 to 89 Minutes | 14 | 2.0% |
| 90 or more Minutes | 0 | 0.0% |
Commute Time by Sex in Oakland CDP Cambria County
The most common commute times in Oakland CDP Cambria County are 10 to 14 minutes (150 commuters, 36.6%) for males and 15 to 19 minutes (110 commuters, 36.7%) for females.
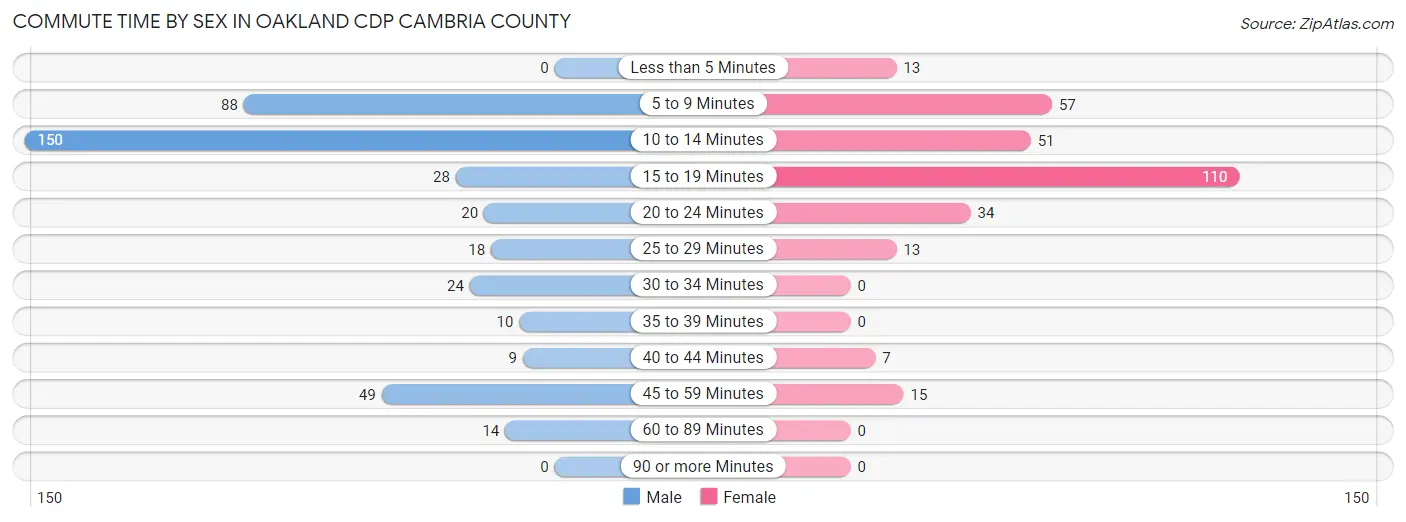
| Commute Time | Male | Female |
| Less than 5 Minutes | 0 (0.0%) | 13 (4.3%) |
| 5 to 9 Minutes | 88 (21.5%) | 57 (19.0%) |
| 10 to 14 Minutes | 150 (36.6%) | 51 (17.0%) |
| 15 to 19 Minutes | 28 (6.8%) | 110 (36.7%) |
| 20 to 24 Minutes | 20 (4.9%) | 34 (11.3%) |
| 25 to 29 Minutes | 18 (4.4%) | 13 (4.3%) |
| 30 to 34 Minutes | 24 (5.9%) | 0 (0.0%) |
| 35 to 39 Minutes | 10 (2.4%) | 0 (0.0%) |
| 40 to 44 Minutes | 9 (2.2%) | 7 (2.3%) |
| 45 to 59 Minutes | 49 (11.9%) | 15 (5.0%) |
| 60 to 89 Minutes | 14 (3.4%) | 0 (0.0%) |
| 90 or more Minutes | 0 (0.0%) | 0 (0.0%) |
Time of Departure to Work by Sex in Oakland CDP Cambria County
The most frequent times of departure to work in Oakland CDP Cambria County are 7:30 AM to 7:59 AM (89, 21.7%) for males and 8:00 AM to 8:29 AM (65, 21.7%) for females.
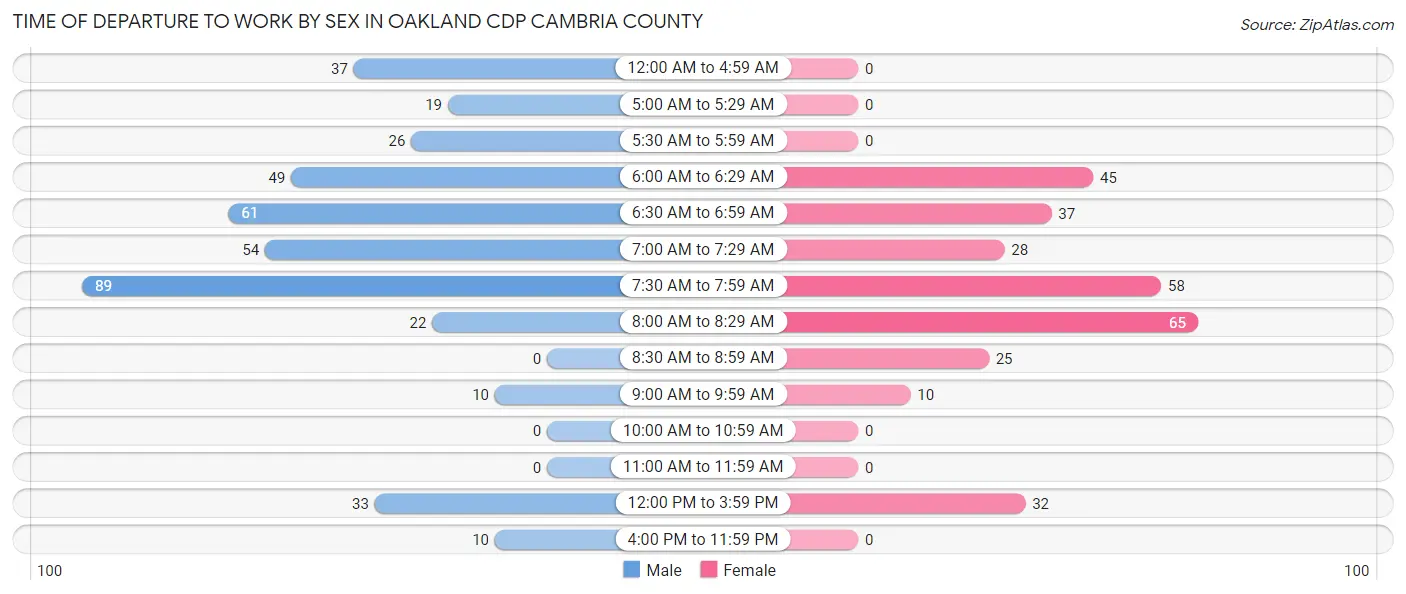
| Time of Departure | Male | Female |
| 12:00 AM to 4:59 AM | 37 (9.0%) | 0 (0.0%) |
| 5:00 AM to 5:29 AM | 19 (4.6%) | 0 (0.0%) |
| 5:30 AM to 5:59 AM | 26 (6.3%) | 0 (0.0%) |
| 6:00 AM to 6:29 AM | 49 (11.9%) | 45 (15.0%) |
| 6:30 AM to 6:59 AM | 61 (14.9%) | 37 (12.3%) |
| 7:00 AM to 7:29 AM | 54 (13.2%) | 28 (9.3%) |
| 7:30 AM to 7:59 AM | 89 (21.7%) | 58 (19.3%) |
| 8:00 AM to 8:29 AM | 22 (5.4%) | 65 (21.7%) |
| 8:30 AM to 8:59 AM | 0 (0.0%) | 25 (8.3%) |
| 9:00 AM to 9:59 AM | 10 (2.4%) | 10 (3.3%) |
| 10:00 AM to 10:59 AM | 0 (0.0%) | 0 (0.0%) |
| 11:00 AM to 11:59 AM | 0 (0.0%) | 0 (0.0%) |
| 12:00 PM to 3:59 PM | 33 (8.1%) | 32 (10.7%) |
| 4:00 PM to 11:59 PM | 10 (2.4%) | 0 (0.0%) |
| Total | 410 (100.0%) | 300 (100.0%) |
Housing Occupancy in Oakland CDP Cambria County
Occupancy by Ownership in Oakland CDP Cambria County
Of the total 765 dwellings in Oakland CDP Cambria County, owner-occupied units account for 689 (90.1%), while renter-occupied units make up 76 (9.9%).
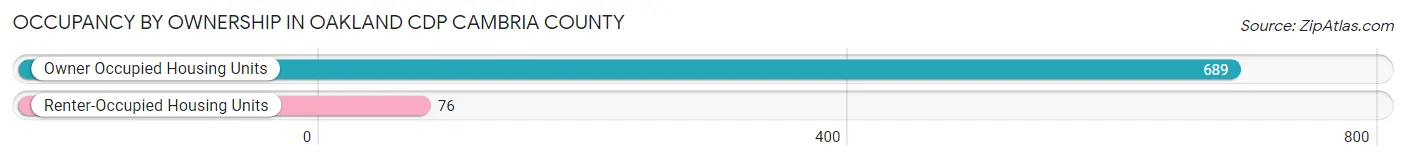
| Occupancy | # Housing Units | % Housing Units |
| Owner Occupied Housing Units | 689 | 90.1% |
| Renter-Occupied Housing Units | 76 | 9.9% |
| Total Occupied Housing Units | 765 | 100.0% |
Occupancy by Household Size in Oakland CDP Cambria County
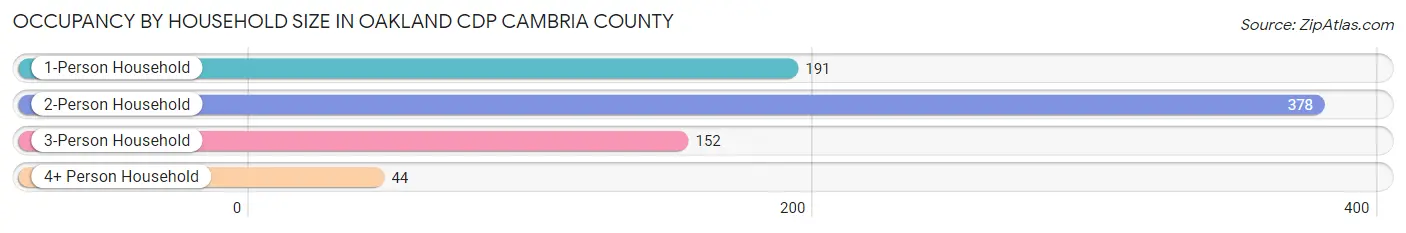
| Household Size | # Housing Units | % Housing Units |
| 1-Person Household | 191 | 25.0% |
| 2-Person Household | 378 | 49.4% |
| 3-Person Household | 152 | 19.9% |
| 4+ Person Household | 44 | 5.8% |
| Total Housing Units | 765 | 100.0% |
Occupancy by Ownership by Household Size in Oakland CDP Cambria County
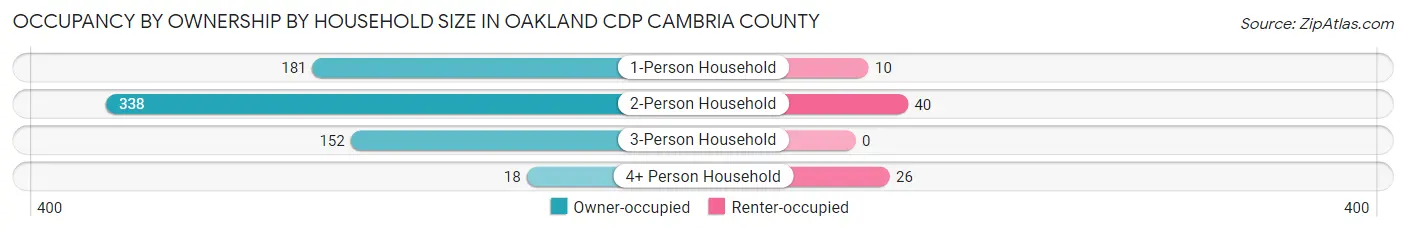
| Household Size | Owner-occupied | Renter-occupied |
| 1-Person Household | 181 (94.8%) | 10 (5.2%) |
| 2-Person Household | 338 (89.4%) | 40 (10.6%) |
| 3-Person Household | 152 (100.0%) | 0 (0.0%) |
| 4+ Person Household | 18 (40.9%) | 26 (59.1%) |
| Total Housing Units | 689 (90.1%) | 76 (9.9%) |
Occupancy by Educational Attainment in Oakland CDP Cambria County
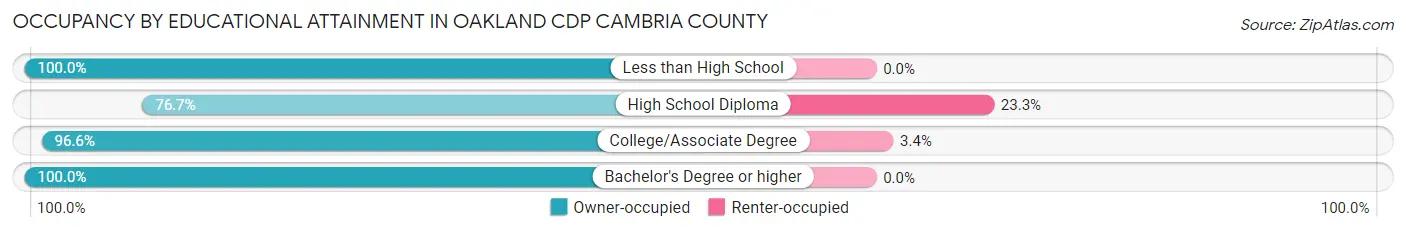
| Household Size | Owner-occupied | Renter-occupied |
| Less than High School | 8 (100.0%) | 0 (0.0%) |
| High School Diploma | 220 (76.7%) | 67 (23.3%) |
| College/Associate Degree | 258 (96.6%) | 9 (3.4%) |
| Bachelor's Degree or higher | 203 (100.0%) | 0 (0.0%) |
Occupancy by Age of Householder in Oakland CDP Cambria County
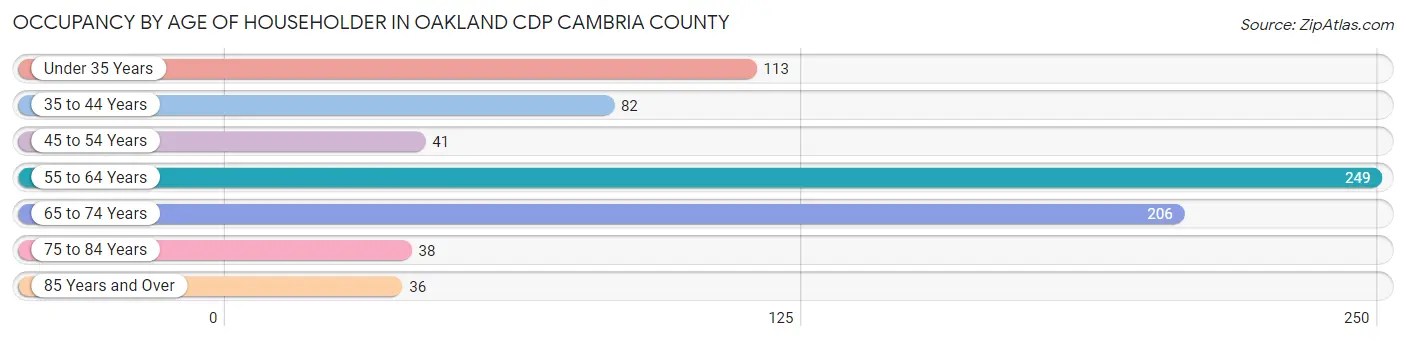
| Age Bracket | # Households | % Households |
| Under 35 Years | 113 | 14.8% |
| 35 to 44 Years | 82 | 10.7% |
| 45 to 54 Years | 41 | 5.4% |
| 55 to 64 Years | 249 | 32.6% |
| 65 to 74 Years | 206 | 26.9% |
| 75 to 84 Years | 38 | 5.0% |
| 85 Years and Over | 36 | 4.7% |
| Total | 765 | 100.0% |
Housing Finances in Oakland CDP Cambria County
Median Income by Occupancy in Oakland CDP Cambria County
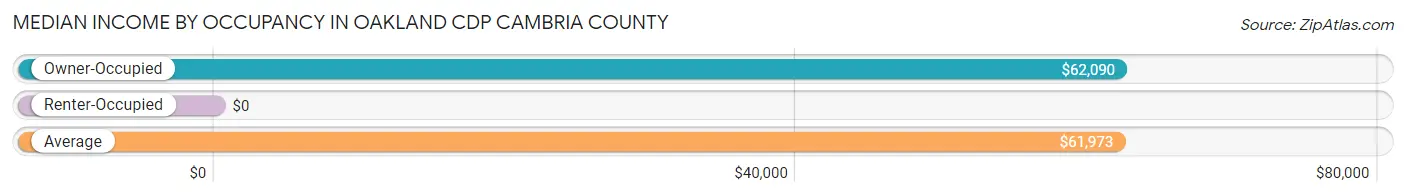
| Occupancy Type | # Households | Median Income |
| Owner-Occupied | 689 (90.1%) | $62,090 |
| Renter-Occupied | 76 (9.9%) | $0 |
| Average | 765 (100.0%) | $61,973 |
Occupancy by Householder Income Bracket in Oakland CDP Cambria County
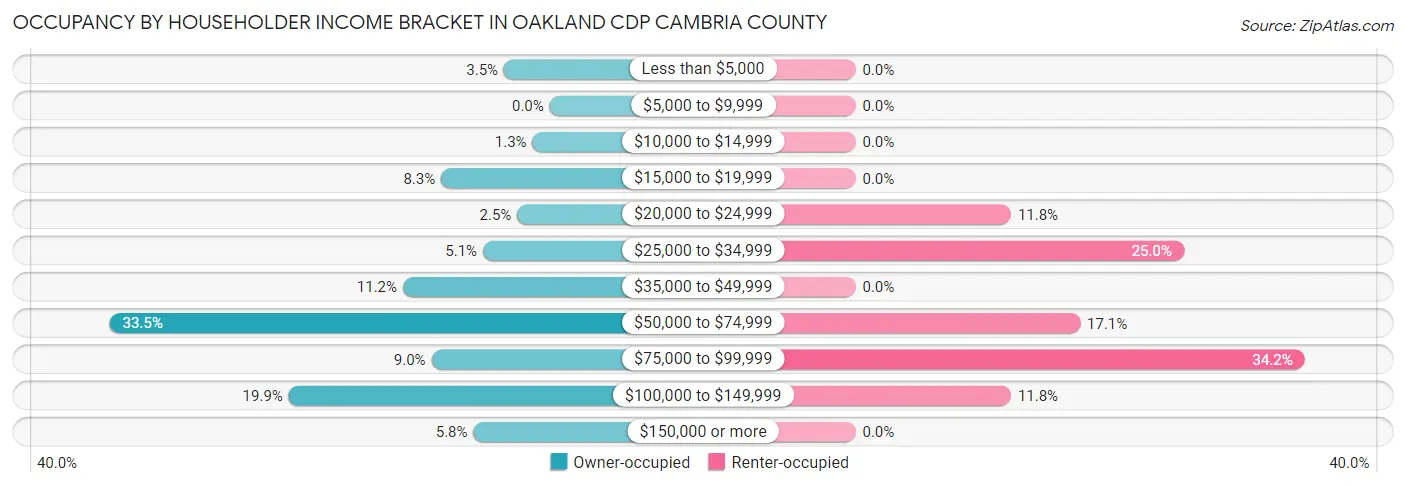
| Income Bracket | Owner-occupied | Renter-occupied |
| Less than $5,000 | 24 (3.5%) | 0 (0.0%) |
| $5,000 to $9,999 | 0 (0.0%) | 0 (0.0%) |
| $10,000 to $14,999 | 9 (1.3%) | 0 (0.0%) |
| $15,000 to $19,999 | 57 (8.3%) | 0 (0.0%) |
| $20,000 to $24,999 | 17 (2.5%) | 9 (11.8%) |
| $25,000 to $34,999 | 35 (5.1%) | 19 (25.0%) |
| $35,000 to $49,999 | 77 (11.2%) | 0 (0.0%) |
| $50,000 to $74,999 | 231 (33.5%) | 13 (17.1%) |
| $75,000 to $99,999 | 62 (9.0%) | 26 (34.2%) |
| $100,000 to $149,999 | 137 (19.9%) | 9 (11.8%) |
| $150,000 or more | 40 (5.8%) | 0 (0.0%) |
| Total | 689 (100.0%) | 76 (100.0%) |
Monthly Housing Cost Tiers in Oakland CDP Cambria County
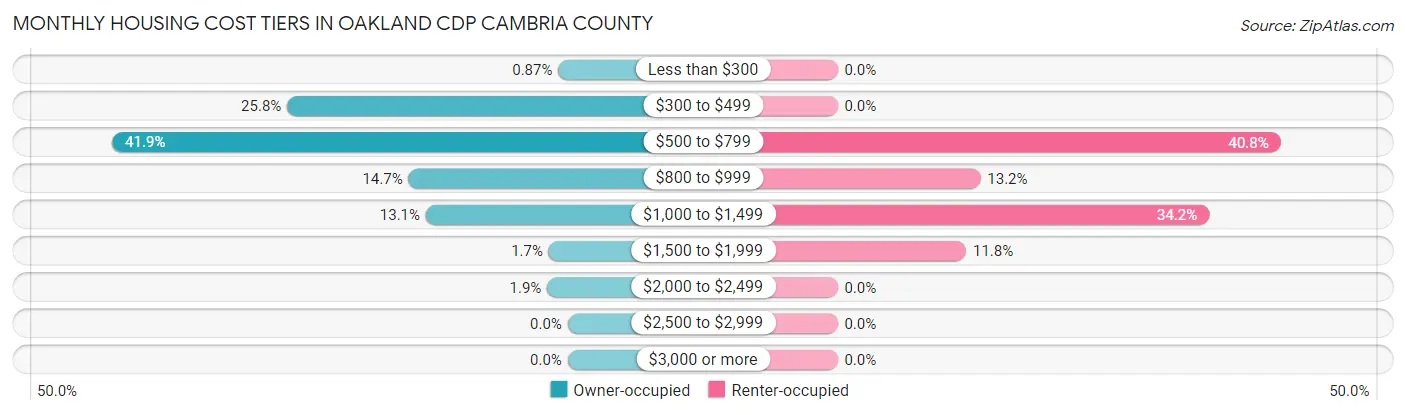
| Monthly Cost | Owner-occupied | Renter-occupied |
| Less than $300 | 6 (0.9%) | 0 (0.0%) |
| $300 to $499 | 178 (25.8%) | 0 (0.0%) |
| $500 to $799 | 289 (41.9%) | 31 (40.8%) |
| $800 to $999 | 101 (14.7%) | 10 (13.2%) |
| $1,000 to $1,499 | 90 (13.1%) | 26 (34.2%) |
| $1,500 to $1,999 | 12 (1.7%) | 9 (11.8%) |
| $2,000 to $2,499 | 13 (1.9%) | 0 (0.0%) |
| $2,500 to $2,999 | 0 (0.0%) | 0 (0.0%) |
| $3,000 or more | 0 (0.0%) | 0 (0.0%) |
| Total | 689 (100.0%) | 76 (100.0%) |
Physical Housing Characteristics in Oakland CDP Cambria County
Housing Structures in Oakland CDP Cambria County
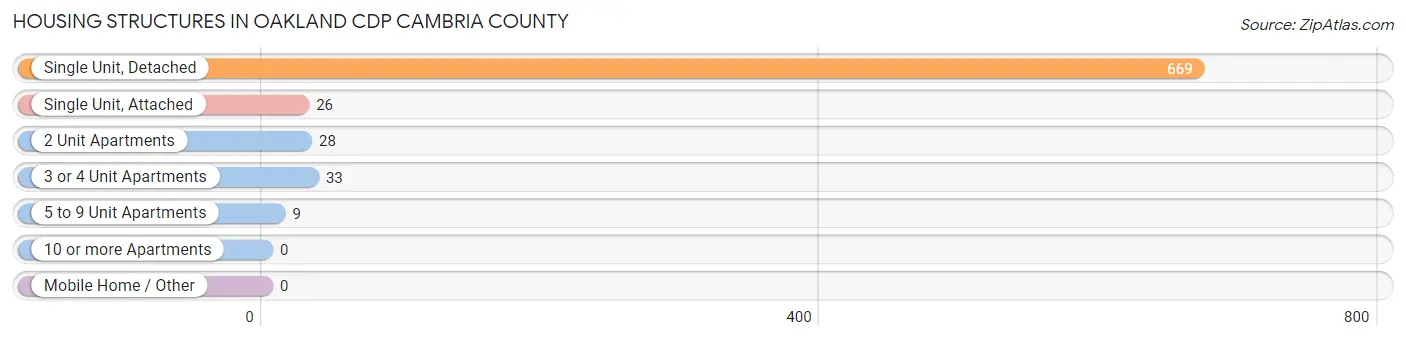
| Structure Type | # Housing Units | % Housing Units |
| Single Unit, Detached | 669 | 87.5% |
| Single Unit, Attached | 26 | 3.4% |
| 2 Unit Apartments | 28 | 3.7% |
| 3 or 4 Unit Apartments | 33 | 4.3% |
| 5 to 9 Unit Apartments | 9 | 1.2% |
| 10 or more Apartments | 0 | 0.0% |
| Mobile Home / Other | 0 | 0.0% |
| Total | 765 | 100.0% |
Housing Structures by Occupancy in Oakland CDP Cambria County
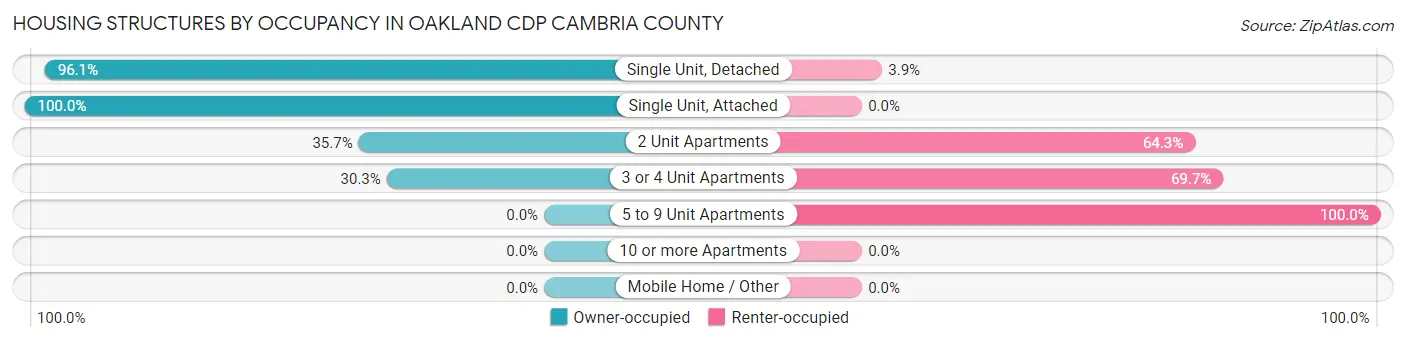
| Structure Type | Owner-occupied | Renter-occupied |
| Single Unit, Detached | 643 (96.1%) | 26 (3.9%) |
| Single Unit, Attached | 26 (100.0%) | 0 (0.0%) |
| 2 Unit Apartments | 10 (35.7%) | 18 (64.3%) |
| 3 or 4 Unit Apartments | 10 (30.3%) | 23 (69.7%) |
| 5 to 9 Unit Apartments | 0 (0.0%) | 9 (100.0%) |
| 10 or more Apartments | 0 (0.0%) | 0 (0.0%) |
| Mobile Home / Other | 0 (0.0%) | 0 (0.0%) |
| Total | 689 (90.1%) | 76 (9.9%) |
Housing Structures by Number of Rooms in Oakland CDP Cambria County
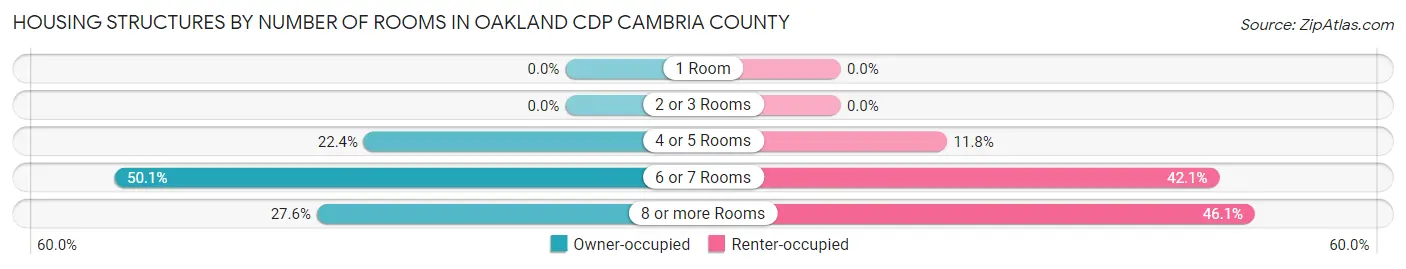
| Number of Rooms | Owner-occupied | Renter-occupied |
| 1 Room | 0 (0.0%) | 0 (0.0%) |
| 2 or 3 Rooms | 0 (0.0%) | 0 (0.0%) |
| 4 or 5 Rooms | 154 (22.4%) | 9 (11.8%) |
| 6 or 7 Rooms | 345 (50.1%) | 32 (42.1%) |
| 8 or more Rooms | 190 (27.6%) | 35 (46.1%) |
| Total | 689 (100.0%) | 76 (100.0%) |
Housing Structure by Heating Type in Oakland CDP Cambria County
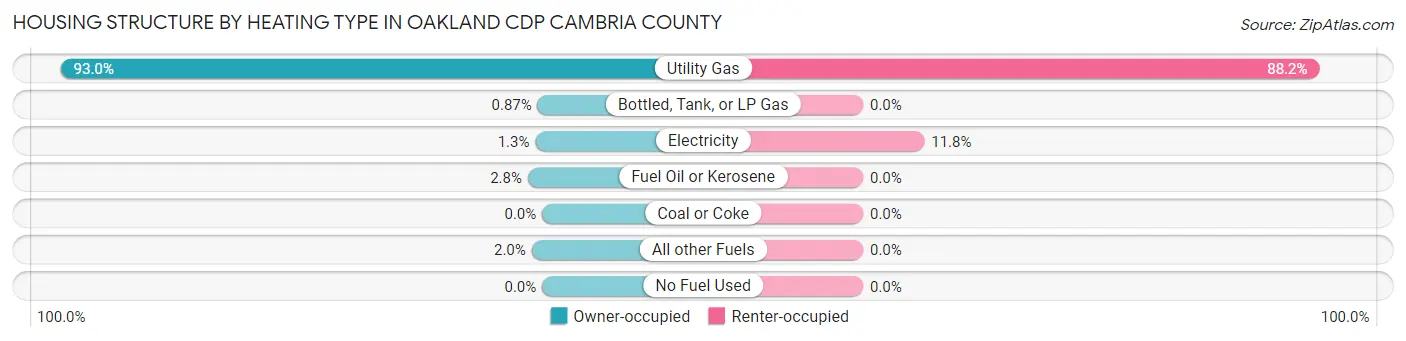
| Heating Type | Owner-occupied | Renter-occupied |
| Utility Gas | 641 (93.0%) | 67 (88.2%) |
| Bottled, Tank, or LP Gas | 6 (0.9%) | 0 (0.0%) |
| Electricity | 9 (1.3%) | 9 (11.8%) |
| Fuel Oil or Kerosene | 19 (2.8%) | 0 (0.0%) |
| Coal or Coke | 0 (0.0%) | 0 (0.0%) |
| All other Fuels | 14 (2.0%) | 0 (0.0%) |
| No Fuel Used | 0 (0.0%) | 0 (0.0%) |
| Total | 689 (100.0%) | 76 (100.0%) |
Household Vehicle Usage in Oakland CDP Cambria County
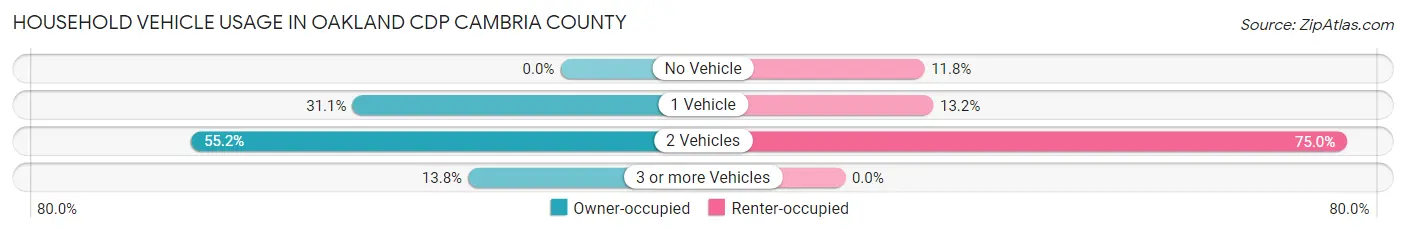
| Vehicles per Household | Owner-occupied | Renter-occupied |
| No Vehicle | 0 (0.0%) | 9 (11.8%) |
| 1 Vehicle | 214 (31.1%) | 10 (13.2%) |
| 2 Vehicles | 380 (55.1%) | 57 (75.0%) |
| 3 or more Vehicles | 95 (13.8%) | 0 (0.0%) |
| Total | 689 (100.0%) | 76 (100.0%) |
Real Estate & Mortgages in Oakland CDP Cambria County
Real Estate and Mortgage Overview in Oakland CDP Cambria County
| Characteristic | Without Mortgage | With Mortgage |
| Housing Units | 262 | 427 |
| Median Property Value | $90,900 | $97,100 |
| Median Household Income | $52,045 | $40 |
| Monthly Housing Costs | $425 | $0 |
| Real Estate Taxes | $1,404 | $10 |
Property Value by Mortgage Status in Oakland CDP Cambria County
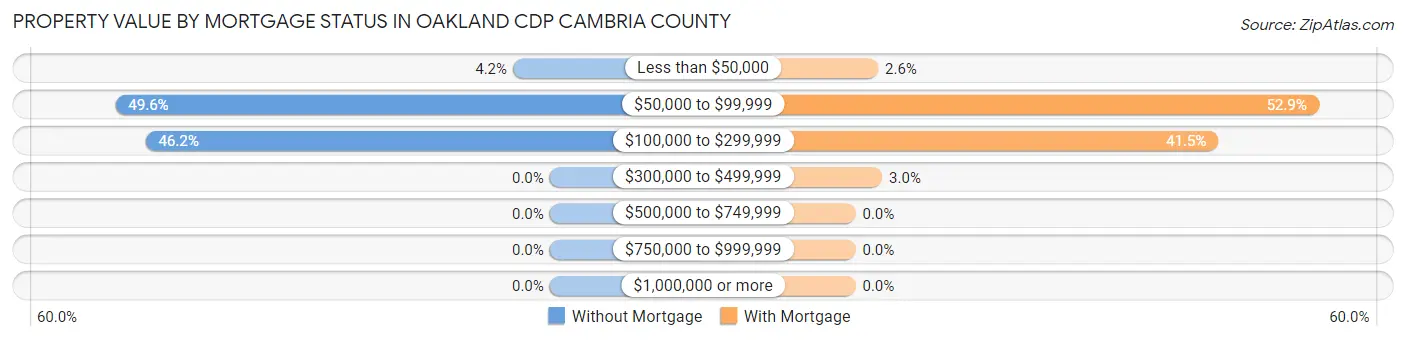
| Property Value | Without Mortgage | With Mortgage |
| Less than $50,000 | 11 (4.2%) | 11 (2.6%) |
| $50,000 to $99,999 | 130 (49.6%) | 226 (52.9%) |
| $100,000 to $299,999 | 121 (46.2%) | 177 (41.4%) |
| $300,000 to $499,999 | 0 (0.0%) | 13 (3.0%) |
| $500,000 to $749,999 | 0 (0.0%) | 0 (0.0%) |
| $750,000 to $999,999 | 0 (0.0%) | 0 (0.0%) |
| $1,000,000 or more | 0 (0.0%) | 0 (0.0%) |
| Total | 262 (100.0%) | 427 (100.0%) |
Household Income by Mortgage Status in Oakland CDP Cambria County
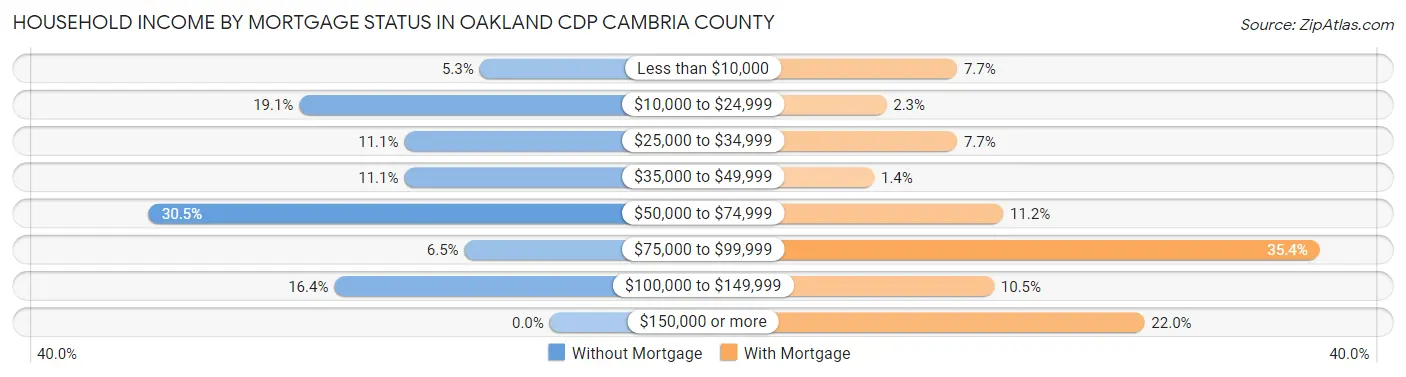
| Household Income | Without Mortgage | With Mortgage |
| Less than $10,000 | 14 (5.3%) | 33 (7.7%) |
| $10,000 to $24,999 | 50 (19.1%) | 10 (2.3%) |
| $25,000 to $34,999 | 29 (11.1%) | 33 (7.7%) |
| $35,000 to $49,999 | 29 (11.1%) | 6 (1.4%) |
| $50,000 to $74,999 | 80 (30.5%) | 48 (11.2%) |
| $75,000 to $99,999 | 17 (6.5%) | 151 (35.4%) |
| $100,000 to $149,999 | 43 (16.4%) | 45 (10.5%) |
| $150,000 or more | 0 (0.0%) | 94 (22.0%) |
| Total | 262 (100.0%) | 427 (100.0%) |
Property Value to Household Income Ratio in Oakland CDP Cambria County
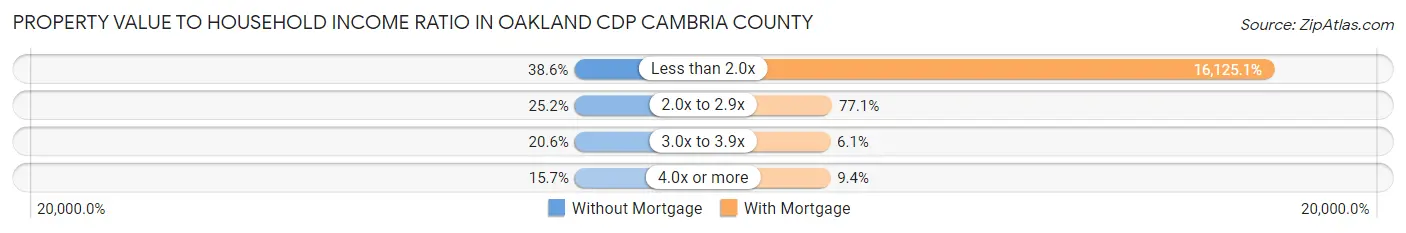
| Value-to-Income Ratio | Without Mortgage | With Mortgage |
| Less than 2.0x | 101 (38.6%) | 68,854 (16,125.1%) |
| 2.0x to 2.9x | 66 (25.2%) | 329 (77.0%) |
| 3.0x to 3.9x | 54 (20.6%) | 26 (6.1%) |
| 4.0x or more | 41 (15.7%) | 40 (9.4%) |
| Total | 262 (100.0%) | 427 (100.0%) |
Real Estate Taxes by Mortgage Status in Oakland CDP Cambria County
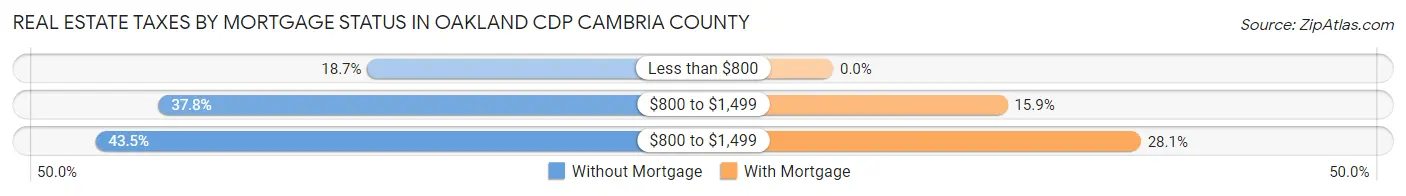
| Property Taxes | Without Mortgage | With Mortgage |
| Less than $800 | 49 (18.7%) | 0 (0.0%) |
| $800 to $1,499 | 99 (37.8%) | 68 (15.9%) |
| $800 to $1,499 | 114 (43.5%) | 120 (28.1%) |
| Total | 262 (100.0%) | 427 (100.0%) |
Health & Disability in Oakland CDP Cambria County
Health Insurance Coverage by Age in Oakland CDP Cambria County
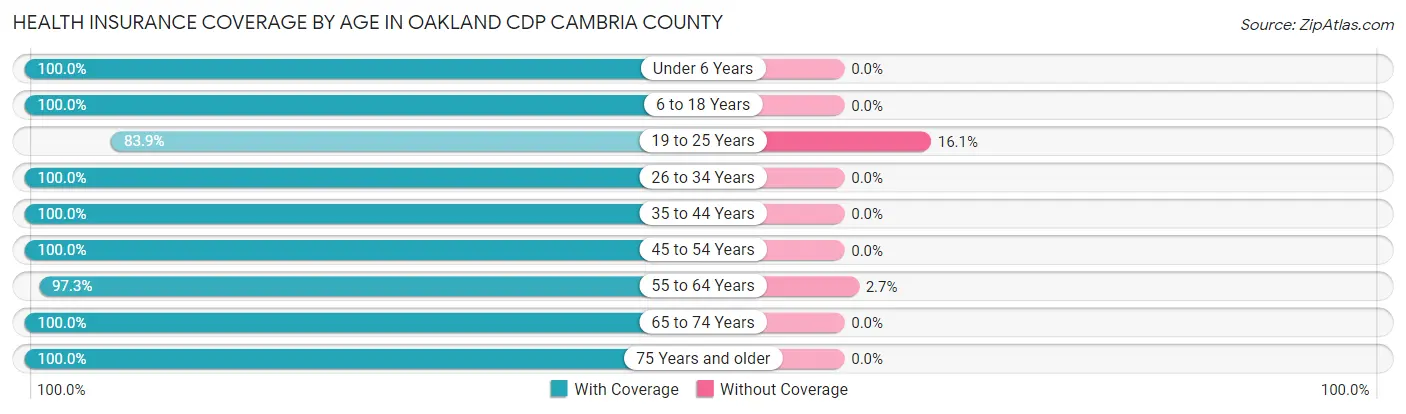
| Age Bracket | With Coverage | Without Coverage |
| Under 6 Years | 112 (100.0%) | 0 (0.0%) |
| 6 to 18 Years | 61 (100.0%) | 0 (0.0%) |
| 19 to 25 Years | 182 (83.9%) | 35 (16.1%) |
| 26 to 34 Years | 99 (100.0%) | 0 (0.0%) |
| 35 to 44 Years | 158 (100.0%) | 0 (0.0%) |
| 45 to 54 Years | 54 (100.0%) | 0 (0.0%) |
| 55 to 64 Years | 398 (97.3%) | 11 (2.7%) |
| 65 to 74 Years | 392 (100.0%) | 0 (0.0%) |
| 75 Years and older | 164 (100.0%) | 0 (0.0%) |
| Total | 1,620 (97.2%) | 46 (2.8%) |
Health Insurance Coverage by Citizenship Status in Oakland CDP Cambria County
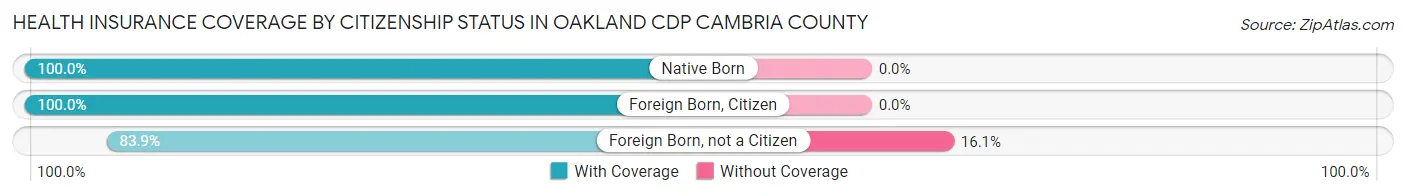
| Citizenship Status | With Coverage | Without Coverage |
| Native Born | 112 (100.0%) | 0 (0.0%) |
| Foreign Born, Citizen | 61 (100.0%) | 0 (0.0%) |
| Foreign Born, not a Citizen | 182 (83.9%) | 35 (16.1%) |
Health Insurance Coverage by Household Income in Oakland CDP Cambria County
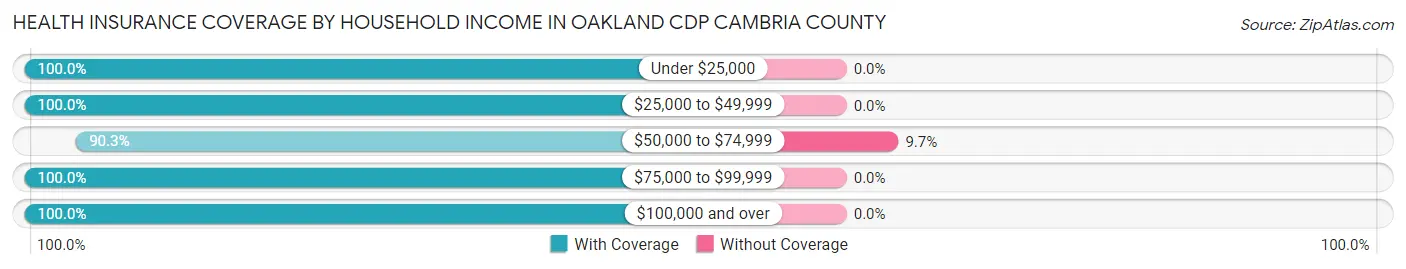
| Household Income | With Coverage | Without Coverage |
| Under $25,000 | 154 (100.0%) | 0 (0.0%) |
| $25,000 to $49,999 | 270 (100.0%) | 0 (0.0%) |
| $50,000 to $74,999 | 429 (90.3%) | 46 (9.7%) |
| $75,000 to $99,999 | 245 (100.0%) | 0 (0.0%) |
| $100,000 and over | 522 (100.0%) | 0 (0.0%) |
Public vs Private Health Insurance Coverage by Age in Oakland CDP Cambria County
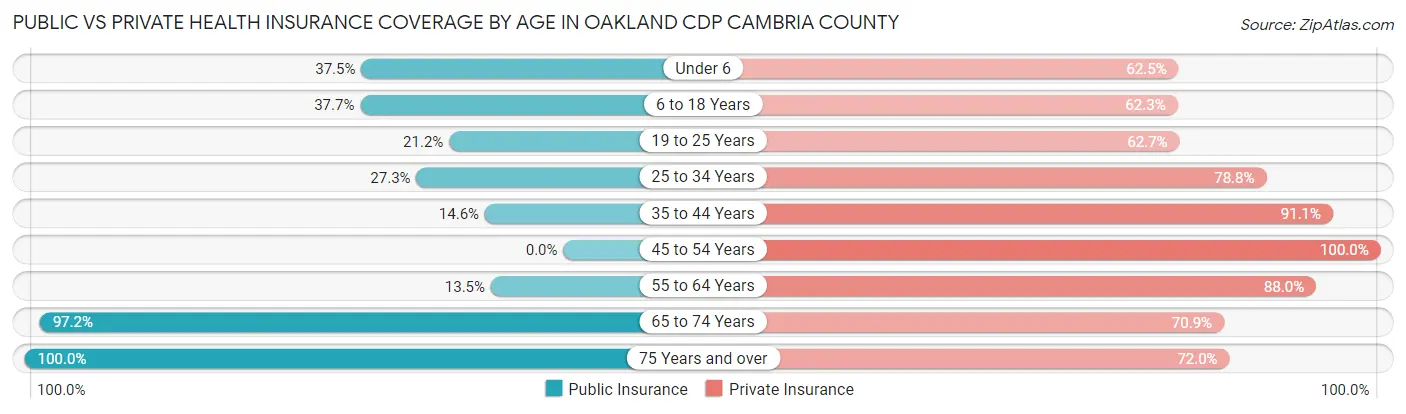
| Age Bracket | Public Insurance | Private Insurance |
| Under 6 | 42 (37.5%) | 70 (62.5%) |
| 6 to 18 Years | 23 (37.7%) | 38 (62.3%) |
| 19 to 25 Years | 46 (21.2%) | 136 (62.7%) |
| 25 to 34 Years | 27 (27.3%) | 78 (78.8%) |
| 35 to 44 Years | 23 (14.6%) | 144 (91.1%) |
| 45 to 54 Years | 0 (0.0%) | 54 (100.0%) |
| 55 to 64 Years | 55 (13.5%) | 360 (88.0%) |
| 65 to 74 Years | 381 (97.2%) | 278 (70.9%) |
| 75 Years and over | 164 (100.0%) | 118 (72.0%) |
| Total | 761 (45.7%) | 1,276 (76.6%) |
Disability Status by Sex by Age in Oakland CDP Cambria County
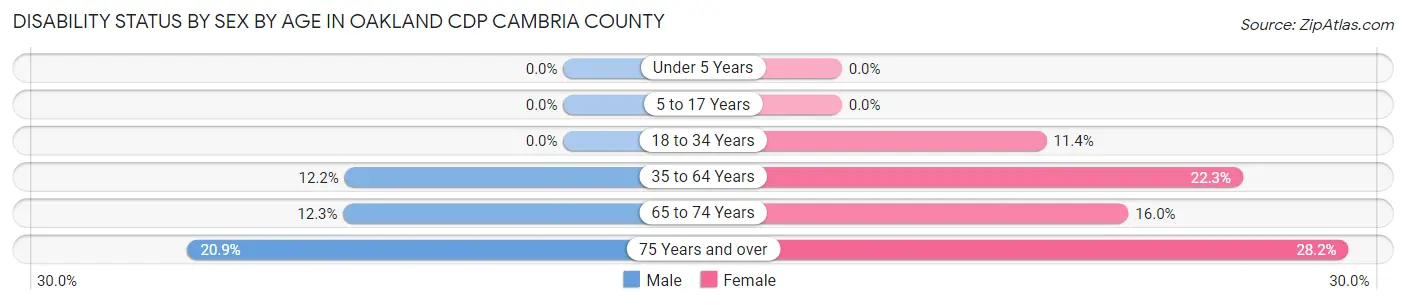
| Age Bracket | Male | Female |
| Under 5 Years | 0 (0.0%) | 0 (0.0%) |
| 5 to 17 Years | 0 (0.0%) | 0 (0.0%) |
| 18 to 34 Years | 0 (0.0%) | 13 (11.4%) |
| 35 to 64 Years | 38 (12.2%) | 69 (22.3%) |
| 65 to 74 Years | 25 (12.2%) | 30 (16.0%) |
| 75 Years and over | 18 (20.9%) | 22 (28.2%) |
Disability Class by Sex by Age in Oakland CDP Cambria County
Disability Class: Hearing Difficulty
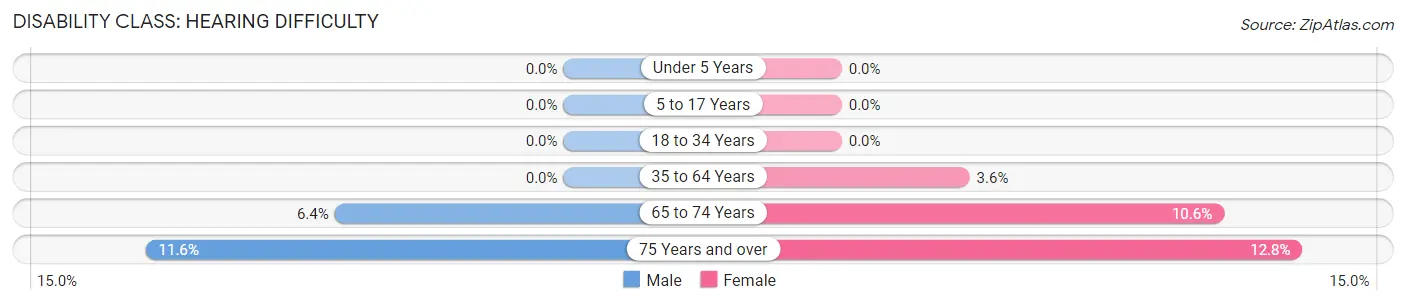
| Age Bracket | Male | Female |
| Under 5 Years | 0 (0.0%) | 0 (0.0%) |
| 5 to 17 Years | 0 (0.0%) | 0 (0.0%) |
| 18 to 34 Years | 0 (0.0%) | 0 (0.0%) |
| 35 to 64 Years | 0 (0.0%) | 11 (3.6%) |
| 65 to 74 Years | 13 (6.4%) | 20 (10.6%) |
| 75 Years and over | 10 (11.6%) | 10 (12.8%) |
Disability Class: Vision Difficulty
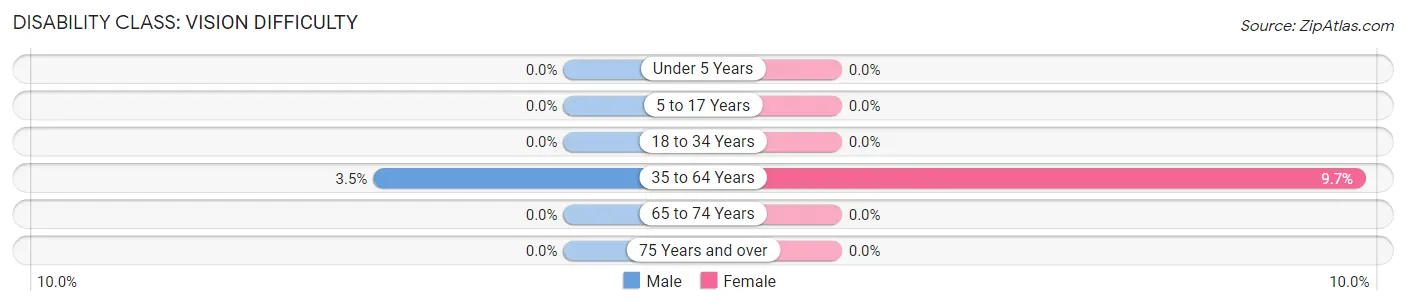
| Age Bracket | Male | Female |
| Under 5 Years | 0 (0.0%) | 0 (0.0%) |
| 5 to 17 Years | 0 (0.0%) | 0 (0.0%) |
| 18 to 34 Years | 0 (0.0%) | 0 (0.0%) |
| 35 to 64 Years | 11 (3.5%) | 30 (9.7%) |
| 65 to 74 Years | 0 (0.0%) | 0 (0.0%) |
| 75 Years and over | 0 (0.0%) | 0 (0.0%) |
Disability Class: Cognitive Difficulty
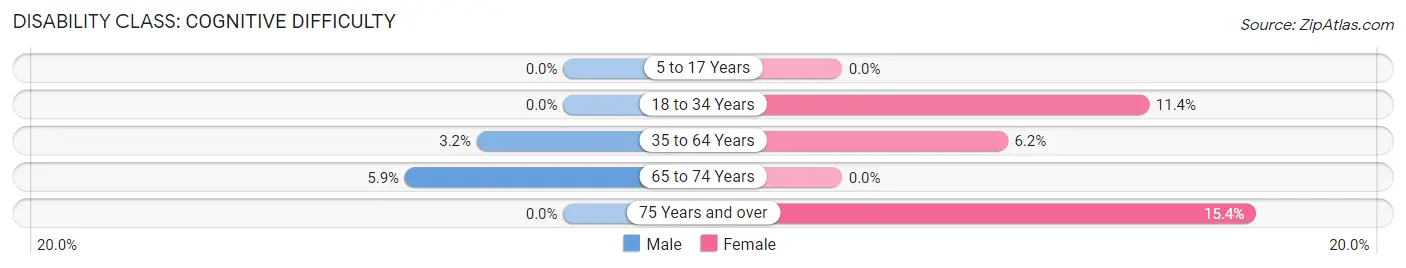
| Age Bracket | Male | Female |
| 5 to 17 Years | 0 (0.0%) | 0 (0.0%) |
| 18 to 34 Years | 0 (0.0%) | 13 (11.4%) |
| 35 to 64 Years | 10 (3.2%) | 19 (6.1%) |
| 65 to 74 Years | 12 (5.9%) | 0 (0.0%) |
| 75 Years and over | 0 (0.0%) | 12 (15.4%) |
Disability Class: Ambulatory Difficulty
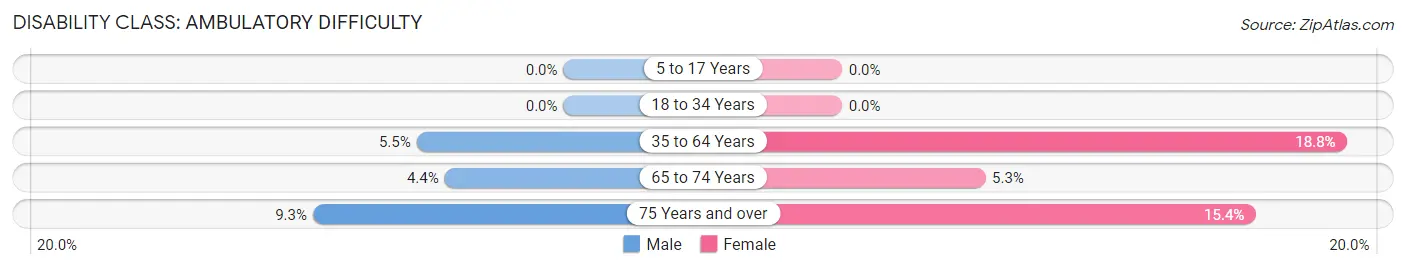
| Age Bracket | Male | Female |
| 5 to 17 Years | 0 (0.0%) | 0 (0.0%) |
| 18 to 34 Years | 0 (0.0%) | 0 (0.0%) |
| 35 to 64 Years | 17 (5.4%) | 58 (18.8%) |
| 65 to 74 Years | 9 (4.4%) | 10 (5.3%) |
| 75 Years and over | 8 (9.3%) | 12 (15.4%) |
Disability Class: Self-Care Difficulty
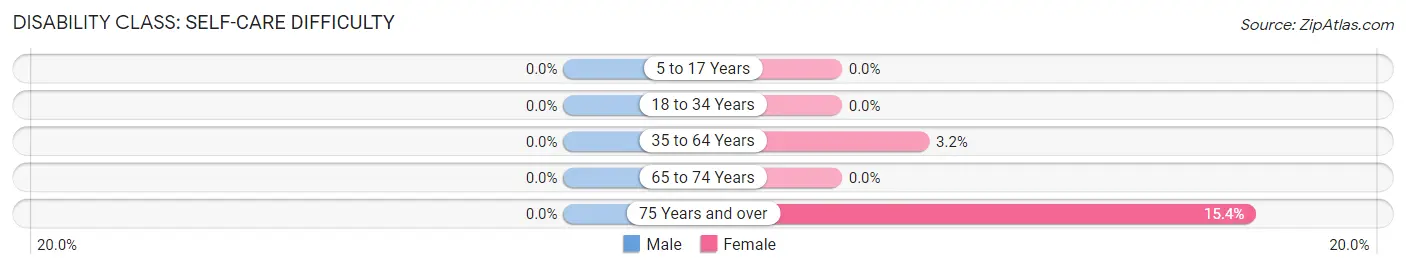
| Age Bracket | Male | Female |
| 5 to 17 Years | 0 (0.0%) | 0 (0.0%) |
| 18 to 34 Years | 0 (0.0%) | 0 (0.0%) |
| 35 to 64 Years | 0 (0.0%) | 10 (3.2%) |
| 65 to 74 Years | 0 (0.0%) | 0 (0.0%) |
| 75 Years and over | 0 (0.0%) | 12 (15.4%) |
Technology Access in Oakland CDP Cambria County
Computing Device Access in Oakland CDP Cambria County
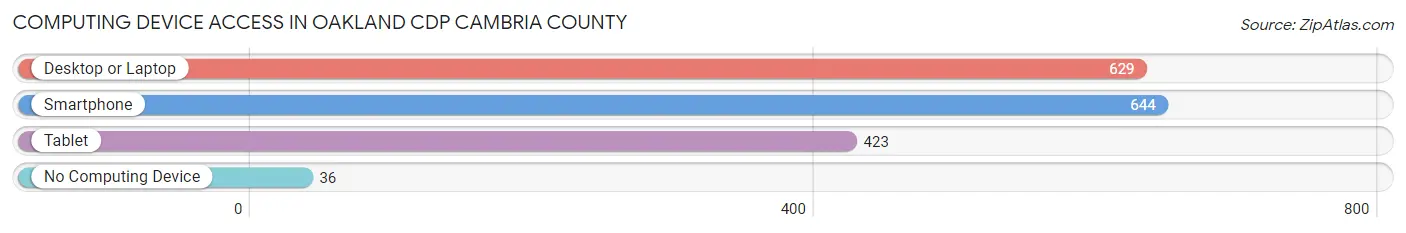
| Device Type | # Households | % Households |
| Desktop or Laptop | 629 | 82.2% |
| Smartphone | 644 | 84.2% |
| Tablet | 423 | 55.3% |
| No Computing Device | 36 | 4.7% |
| Total | 765 | 100.0% |
Internet Access in Oakland CDP Cambria County
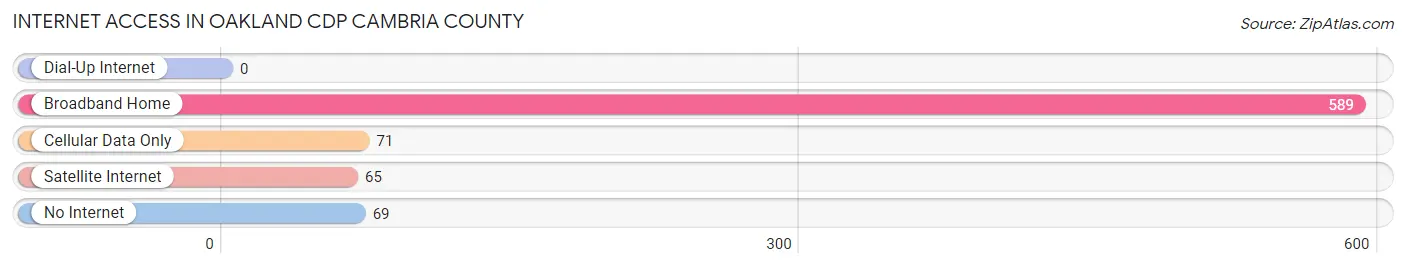
| Internet Type | # Households | % Households |
| Dial-Up Internet | 0 | 0.0% |
| Broadband Home | 589 | 77.0% |
| Cellular Data Only | 71 | 9.3% |
| Satellite Internet | 65 | 8.5% |
| No Internet | 69 | 9.0% |
| Total | 765 | 100.0% |
Oakland CDP Cambria County Summary
Oakland Cdp is a census-designated place (CDP) located in Cambria County, Pennsylvania. It is situated in the foothills of the Allegheny Mountains, approximately 10 miles east of Johnstown. The population of Oakland Cdp was 1,845 at the 2010 census.
Geography
Oakland Cdp is located at 40°25'17" North, 78°45'45" West (40.4214, -78.7625). It has an area of 1.3 square miles, all of which is land.
History
Oakland Cdp was first settled in the early 1800s by German immigrants. The area was originally known as "Oakland Mills" and was a small farming community. In 1872, the Oakland Mills post office was established. The post office was renamed to Oakland Cdp in 1891.
In the late 1800s, the area began to experience a period of industrial growth. The Cambria Iron Company opened a steel mill in Oakland Cdp in 1881, and the Pennsylvania Railroad opened a line through the area in 1883. This period of industrial growth led to an influx of immigrants from Eastern Europe, particularly Poland and Slovakia.
By the early 1900s, Oakland Cdp had become a bustling industrial center. The steel mill employed hundreds of workers, and the railroad provided transportation for goods and passengers. The population of Oakland Cdp grew rapidly during this period, reaching a peak of 2,845 in 1920.
Economy
Oakland Cdp is primarily a residential community, with a small industrial base. The largest employer in the area is the Cambria Iron Company, which operates a steel mill in Oakland Cdp. Other employers include a variety of small businesses, such as restaurants, retail stores, and service providers.
Demographics
As of the 2010 census, the population of Oakland Cdp was 1,845. The racial makeup of the population was 97.3% White, 0.7% African American, 0.3% Native American, 0.3% Asian, and 1.4% from other races. Hispanic or Latino of any race were 1.2% of the population.
The median household income in Oakland Cdp was $37,917, and the median family income was $45,938. The per capita income was $19,945. About 11.2% of families and 13.2% of the population were below the poverty line, including 17.2% of those under age 18 and 8.2% of those age 65 or over.
Conclusion
Oakland Cdp is a small census-designated place located in Cambria County, Pennsylvania. It is situated in the foothills of the Allegheny Mountains, approximately 10 miles east of Johnstown. The population of Oakland Cdp was 1,845 at the 2010 census. The area was originally settled in the early 1800s by German immigrants, and experienced a period of industrial growth in the late 1800s. Today, Oakland Cdp is primarily a residential community, with a small industrial base. The largest employer in the area is the Cambria Iron Company, which operates a steel mill in Oakland Cdp. The population of Oakland Cdp is predominantly White, with a small percentage of African American, Native American, Asian, and other races. The median household income in Oakland Cdp was $37,917, and the median family income was $45,938.
Common Questions
What is Per Capita Income in Oakland CDP Cambria County?
Per Capita income in Oakland CDP Cambria County is $34,629.
What is the Median Family Income in Oakland CDP Cambria County?
Median Family Income in Oakland CDP Cambria County is $61,674.
What is the Median Household income in Oakland CDP Cambria County?
Median Household Income in Oakland CDP Cambria County is $61,973.
What is Income or Wage Gap in Oakland CDP Cambria County?
Income or Wage Gap in Oakland CDP Cambria County is 24.2%.
Women in Oakland CDP Cambria County earn 75.8 cents for every dollar earned by a man.
What is Inequality or Gini Index in Oakland CDP Cambria County?
Inequality or Gini Index in Oakland CDP Cambria County is 0.37.
What is the Total Population of Oakland CDP Cambria County?
Total Population of Oakland CDP Cambria County is 1,666.
What is the Total Male Population of Oakland CDP Cambria County?
Total Male Population of Oakland CDP Cambria County is 898.
What is the Total Female Population of Oakland CDP Cambria County?
Total Female Population of Oakland CDP Cambria County is 768.
What is the Ratio of Males per 100 Females in Oakland CDP Cambria County?
There are 116.93 Males per 100 Females in Oakland CDP Cambria County.
What is the Ratio of Females per 100 Males in Oakland CDP Cambria County?
There are 85.52 Females per 100 Males in Oakland CDP Cambria County.
What is the Median Population Age in Oakland CDP Cambria County?
Median Population Age in Oakland CDP Cambria County is 56.5 Years.
What is the Average Family Size in Oakland CDP Cambria County
Average Family Size in Oakland CDP Cambria County is 2.5 People.
What is the Average Household Size in Oakland CDP Cambria County
Average Household Size in Oakland CDP Cambria County is 2.2 People.
How Large is the Labor Force in Oakland CDP Cambria County?
There are 824 People in the Labor Forcein in Oakland CDP Cambria County.
What is the Percentage of People in the Labor Force in Oakland CDP Cambria County?
54.8% of People are in the Labor Force in Oakland CDP Cambria County.
What is the Unemployment Rate in Oakland CDP Cambria County?
Unemployment Rate in Oakland CDP Cambria County is 4.2%.