Cities with the Highest Percentage of Population Employed in Production in Kansas
RELATED REPORTS & OPTIONS
Production
Kansas
Compare Cities
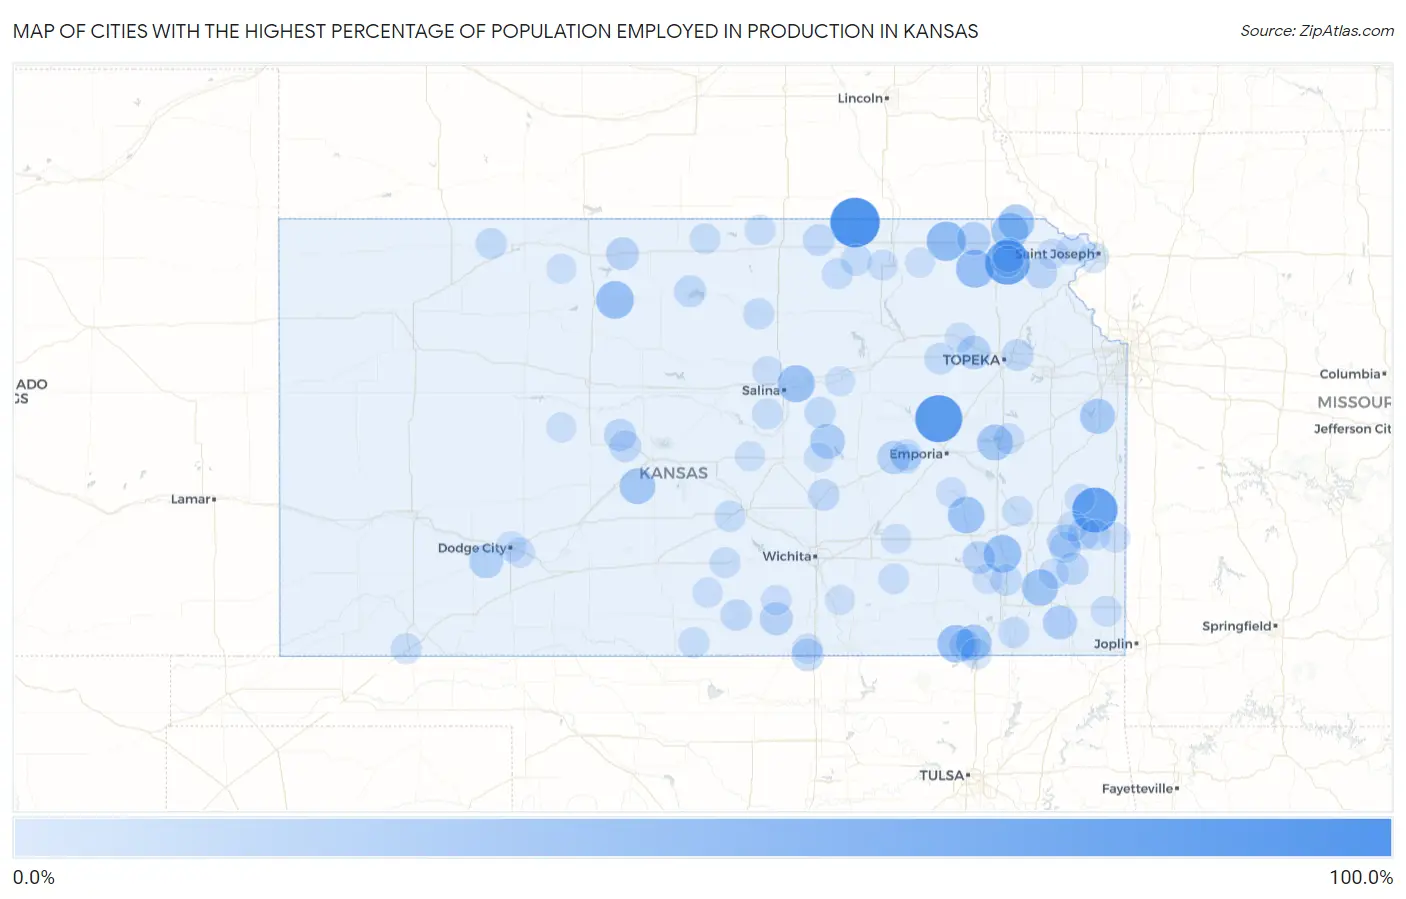
Map of Cities with the Highest Percentage of Population Employed in Production in Kansas
0.0%
100.0%
Cities with the Highest Percentage of Population Employed in Production in Kansas
| City | % Employed | vs State | vs National | |
| 1. | Crestline | 100.0% | 6.9%(+93.1)#1 | 5.5%(+94.5)#21 |
| 2. | Hollenberg | 100.0% | 6.9%(+93.1)#2 | 5.5%(+94.5)#37 |
| 3. | Ogallah | 100.0% | 6.9%(+93.1)#3 | 5.5%(+94.5)#41 |
| 4. | Opolis | 100.0% | 6.9%(+93.1)#4 | 5.5%(+94.5)#42 |
| 5. | Bushong | 89.5% | 6.9%(+82.6)#5 | 5.5%(+84.0)#51 |
| 6. | Mapleton | 80.3% | 6.9%(+73.4)#6 | 5.5%(+74.8)#59 |
| 7. | Kickapoo Site 2 | 78.6% | 6.9%(+71.7)#7 | 5.5%(+73.1)#63 |
| 8. | Baileyville | 54.5% | 6.9%(+47.6)#8 | 5.5%(+49.1)#161 |
| 9. | Goff | 50.0% | 6.9%(+43.1)#9 | 5.5%(+44.5)#196 |
| 10. | Woodston | 48.5% | 6.9%(+41.6)#10 | 5.5%(+43.0)#221 |
| 11. | Buffalo | 48.2% | 6.9%(+41.3)#11 | 5.5%(+42.7)#224 |
| 12. | Peru | 48.0% | 6.9%(+41.1)#12 | 5.5%(+42.5)#226 |
| 13. | New Cambria | 46.2% | 6.9%(+39.2)#13 | 5.5%(+40.7)#254 |
| 14. | Virgil | 44.4% | 6.9%(+37.5)#14 | 5.5%(+39.0)#274 |
| 15. | Galesburg | 42.9% | 6.9%(+35.9)#15 | 5.5%(+37.4)#297 |
| 16. | Hamlin | 42.9% | 6.9%(+35.9)#16 | 5.5%(+37.4)#300 |
| 17. | Reserve | 41.9% | 6.9%(+35.0)#17 | 5.5%(+36.5)#315 |
| 18. | Olivet | 40.9% | 6.9%(+34.0)#18 | 5.5%(+35.4)#338 |
| 19. | Havana | 40.0% | 6.9%(+33.1)#19 | 5.5%(+34.5)#352 |
| 20. | Radium | 40.0% | 6.9%(+33.1)#20 | 5.5%(+34.5)#360 |
| 21. | Hillsdale | 37.9% | 6.9%(+31.0)#21 | 5.5%(+32.5)#412 |
| 22. | Durham | 36.4% | 6.9%(+29.5)#22 | 5.5%(+30.9)#457 |
| 23. | St. Marks | 33.3% | 6.9%(+26.4)#23 | 5.5%(+27.9)#571 |
| 24. | Powhattan | 33.3% | 6.9%(+26.4)#24 | 5.5%(+27.9)#574 |
| 25. | Labette | 33.3% | 6.9%(+26.4)#25 | 5.5%(+27.9)#585 |
| 26. | Ensign | 32.2% | 6.9%(+25.3)#26 | 5.5%(+26.8)#633 |
| 27. | Willard | 31.8% | 6.9%(+24.9)#27 | 5.5%(+26.3)#652 |
| 28. | Oneida | 31.4% | 6.9%(+24.5)#28 | 5.5%(+25.9)#684 |
| 29. | Milan | 29.5% | 6.9%(+22.6)#29 | 5.5%(+24.1)#796 |
| 30. | Elmdale | 29.4% | 6.9%(+22.5)#30 | 5.5%(+23.9)#811 |
| 31. | Elsmore | 29.2% | 6.9%(+22.3)#31 | 5.5%(+23.7)#829 |
| 32. | Coyville | 28.6% | 6.9%(+21.7)#32 | 5.5%(+23.1)#880 |
| 33. | Ludell | 28.6% | 6.9%(+21.7)#33 | 5.5%(+23.1)#885 |
| 34. | Kensington | 28.2% | 6.9%(+21.3)#34 | 5.5%(+22.7)#920 |
| 35. | Walnut | 27.4% | 6.9%(+20.5)#35 | 5.5%(+22.0)#980 |
| 36. | Bavaria | 27.3% | 6.9%(+20.4)#36 | 5.5%(+21.8)#1,006 |
| 37. | Hunnewell | 26.7% | 6.9%(+19.8)#37 | 5.5%(+21.2)#1,063 |
| 38. | Otis | 26.1% | 6.9%(+19.2)#38 | 5.5%(+20.6)#1,120 |
| 39. | Uniontown | 25.2% | 6.9%(+18.3)#39 | 5.5%(+19.8)#1,229 |
| 40. | Niotaze | 25.0% | 6.9%(+18.1)#40 | 5.5%(+19.5)#1,266 |
| 41. | Huron | 25.0% | 6.9%(+18.1)#41 | 5.5%(+19.5)#1,280 |
| 42. | Cawker City | 24.5% | 6.9%(+17.6)#42 | 5.5%(+19.0)#1,349 |
| 43. | Albert | 24.5% | 6.9%(+17.6)#43 | 5.5%(+19.0)#1,353 |
| 44. | Grantville | 24.2% | 6.9%(+17.3)#44 | 5.5%(+18.8)#1,380 |
| 45. | Walton | 24.1% | 6.9%(+17.2)#45 | 5.5%(+18.6)#1,404 |
| 46. | Haddam | 24.1% | 6.9%(+17.2)#46 | 5.5%(+18.6)#1,407 |
| 47. | Harper | 23.5% | 6.9%(+16.6)#47 | 5.5%(+18.1)#1,493 |
| 48. | Kickapoo Site 1 | 23.1% | 6.9%(+16.2)#48 | 5.5%(+17.6)#1,582 |
| 49. | Strong City | 23.0% | 6.9%(+16.1)#49 | 5.5%(+17.5)#1,593 |
| 50. | Mcfarland | 23.0% | 6.9%(+16.1)#50 | 5.5%(+17.5)#1,595 |
| 51. | Savonburg | 22.7% | 6.9%(+15.8)#51 | 5.5%(+17.3)#1,637 |
| 52. | Piedmont | 22.6% | 6.9%(+15.7)#52 | 5.5%(+17.1)#1,663 |
| 53. | Farlington | 22.5% | 6.9%(+15.6)#53 | 5.5%(+17.0)#1,677 |
| 54. | Altoona | 22.3% | 6.9%(+15.4)#54 | 5.5%(+16.8)#1,705 |
| 55. | Norcatur | 22.2% | 6.9%(+15.3)#55 | 5.5%(+16.8)#1,721 |
| 56. | Carlton | 22.2% | 6.9%(+15.3)#56 | 5.5%(+16.8)#1,744 |
| 57. | Glasco | 21.9% | 6.9%(+15.0)#57 | 5.5%(+16.4)#1,795 |
| 58. | Partridge | 21.8% | 6.9%(+14.9)#58 | 5.5%(+16.4)#1,805 |
| 59. | Greenleaf | 21.6% | 6.9%(+14.7)#59 | 5.5%(+16.2)#1,852 |
| 60. | Furley | 21.4% | 6.9%(+14.5)#60 | 5.5%(+16.0)#1,899 |
| 61. | Palmer | 21.2% | 6.9%(+14.3)#61 | 5.5%(+15.7)#1,947 |
| 62. | Liberty | 21.2% | 6.9%(+14.3)#62 | 5.5%(+15.7)#1,948 |
| 63. | Elwood | 21.0% | 6.9%(+14.1)#63 | 5.5%(+15.5)#2,006 |
| 64. | Caney | 20.7% | 6.9%(+13.8)#64 | 5.5%(+15.2)#2,080 |
| 65. | Hazelton | 20.6% | 6.9%(+13.7)#65 | 5.5%(+15.1)#2,113 |
| 66. | Liberal | 20.5% | 6.9%(+13.6)#66 | 5.5%(+15.1)#2,120 |
| 67. | Bronson | 20.5% | 6.9%(+13.6)#67 | 5.5%(+15.1)#2,126 |
| 68. | Burr Oak | 20.5% | 6.9%(+13.5)#68 | 5.5%(+15.0)#2,145 |
| 69. | Weir | 20.4% | 6.9%(+13.5)#69 | 5.5%(+14.9)#2,156 |
| 70. | Falun | 20.4% | 6.9%(+13.5)#70 | 5.5%(+14.9)#2,168 |
| 71. | Kingman | 20.0% | 6.9%(+13.1)#71 | 5.5%(+14.5)#2,239 |
| 72. | Republic | 20.0% | 6.9%(+13.1)#72 | 5.5%(+14.5)#2,259 |
| 73. | Waterville | 19.8% | 6.9%(+12.9)#73 | 5.5%(+14.3)#2,322 |
| 74. | Neosho Falls | 19.6% | 6.9%(+12.7)#74 | 5.5%(+14.1)#2,388 |
| 75. | Melvern | 19.4% | 6.9%(+12.5)#75 | 5.5%(+14.0)#2,425 |
| 76. | Redfield | 19.4% | 6.9%(+12.5)#76 | 5.5%(+14.0)#2,426 |
| 77. | Latham | 19.4% | 6.9%(+12.4)#77 | 5.5%(+13.9)#2,450 |
| 78. | Madison | 19.1% | 6.9%(+12.2)#78 | 5.5%(+13.6)#2,530 |
| 79. | Conway Springs | 19.1% | 6.9%(+12.1)#79 | 5.5%(+13.6)#2,532 |
| 80. | Culver | 19.0% | 6.9%(+12.1)#80 | 5.5%(+13.6)#2,541 |
| 81. | Dodge City | 19.0% | 6.9%(+12.1)#81 | 5.5%(+13.5)#2,558 |
| 82. | Fredonia | 18.9% | 6.9%(+12.0)#82 | 5.5%(+13.5)#2,579 |
| 83. | Erie | 18.8% | 6.9%(+11.9)#83 | 5.5%(+13.3)#2,637 |
| 84. | Severance | 18.8% | 6.9%(+11.8)#84 | 5.5%(+13.3)#2,659 |
| 85. | Troy | 18.7% | 6.9%(+11.8)#85 | 5.5%(+13.2)#2,668 |
| 86. | Zenda | 18.4% | 6.9%(+11.5)#86 | 5.5%(+13.0)#2,761 |
| 87. | St Marys | 18.4% | 6.9%(+11.5)#87 | 5.5%(+12.9)#2,764 |
| 88. | Wilroads Gardens | 18.4% | 6.9%(+11.5)#88 | 5.5%(+12.9)#2,778 |
| 89. | Fort Scott | 18.3% | 6.9%(+11.4)#89 | 5.5%(+12.9)#2,795 |
| 90. | Blue Mound | 18.3% | 6.9%(+11.4)#90 | 5.5%(+12.8)#2,816 |
| 91. | South Haven | 18.0% | 6.9%(+11.1)#91 | 5.5%(+12.5)#2,949 |
| 92. | Windom | 17.9% | 6.9%(+10.9)#92 | 5.5%(+12.4)#3,008 |
| 93. | Cottonwood Falls | 17.8% | 6.9%(+10.8)#93 | 5.5%(+12.3)#3,032 |
| 94. | Logan | 17.5% | 6.9%(+10.6)#94 | 5.5%(+12.1)#3,115 |
| 95. | Rosalia | 17.5% | 6.9%(+10.5)#95 | 5.5%(+12.0)#3,141 |
| 96. | Mccracken | 17.4% | 6.9%(+10.5)#96 | 5.5%(+11.9)#3,171 |
| 97. | Lehigh | 17.3% | 6.9%(+10.4)#97 | 5.5%(+11.9)#3,191 |
| 98. | Udall | 17.3% | 6.9%(+10.3)#98 | 5.5%(+11.8)#3,230 |
| 99. | Frankfort | 17.3% | 6.9%(+10.3)#99 | 5.5%(+11.8)#3,232 |
| 100. | Enterprise | 17.2% | 6.9%(+10.3)#100 | 5.5%(+11.8)#3,251 |
Common Questions
What are the Top 10 Cities with the Highest Percentage of Population Employed in Production in Kansas?
Top 10 Cities with the Highest Percentage of Population Employed in Production in Kansas are:
#1
100.0%
#2
89.5%
#3
80.3%
#4
78.6%
#5
54.5%
#6
50.0%
#7
48.5%
#8
48.2%
#9
48.0%
#10
46.2%
What city has the Highest Percentage of Population Employed in Production in Kansas?
Hollenberg has the Highest Percentage of Population Employed in Production in Kansas with 100.0%.
What is the Percentage of Population Employed in Production in the State of Kansas?
Percentage of Population Employed in Production in Kansas is 6.9%.
What is the Percentage of Population Employed in Production in the United States?
Percentage of Population Employed in Production in the United States is 5.5%.