Cities with the Highest Percentage of Population Employed in Production in Oregon
RELATED REPORTS & OPTIONS
Production
Oregon
Compare Cities
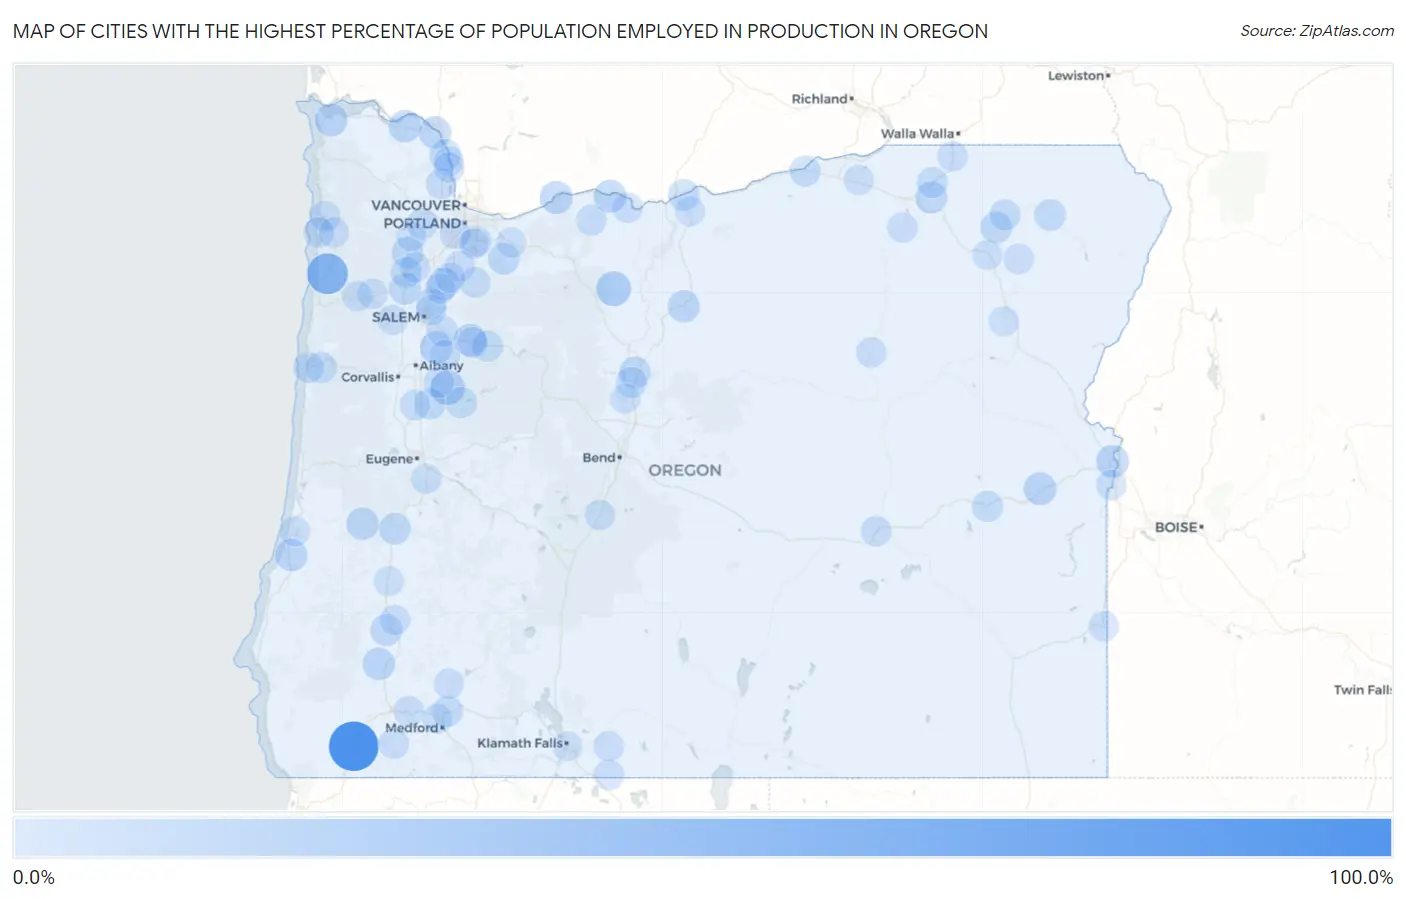
Map of Cities with the Highest Percentage of Population Employed in Production in Oregon
0.0%
100.0%
Cities with the Highest Percentage of Population Employed in Production in Oregon
| City | % Employed | vs State | vs National | |
| 1. | Kerby | 100.0% | 5.2%(+94.8)#1 | 5.5%(+94.5)#2 |
| 2. | Wedderburn | 60.6% | 5.2%(+55.4)#2 | 5.5%(+55.1)#114 |
| 3. | Cloverdale | 57.1% | 5.2%(+52.0)#3 | 5.5%(+51.7)#138 |
| 4. | Pine Grove | 28.6% | 5.2%(+23.4)#4 | 5.5%(+23.1)#878 |
| 5. | Crescent | 27.9% | 5.2%(+22.7)#5 | 5.5%(+22.4)#939 |
| 6. | Waterloo | 27.6% | 5.2%(+22.4)#6 | 5.5%(+22.1)#972 |
| 7. | Dilley | 22.2% | 5.2%(+17.0)#7 | 5.5%(+16.8)#1,723 |
| 8. | Harper | 20.0% | 5.2%(+14.8)#8 | 5.5%(+14.5)#2,253 |
| 9. | Jeffers Gardens | 20.0% | 5.2%(+14.8)#9 | 5.5%(+14.5)#2,263 |
| 10. | Cascade Locks | 19.9% | 5.2%(+14.8)#10 | 5.5%(+14.5)#2,283 |
| 11. | Marion | 19.5% | 5.2%(+14.3)#11 | 5.5%(+14.0)#2,422 |
| 12. | Mosier | 19.4% | 5.2%(+14.2)#12 | 5.5%(+13.9)#2,434 |
| 13. | Ontario | 19.4% | 5.2%(+14.2)#13 | 5.5%(+13.9)#2,443 |
| 14. | Clatskanie | 18.1% | 5.2%(+13.0)#14 | 5.5%(+12.7)#2,886 |
| 15. | Glendale | 18.1% | 5.2%(+12.9)#15 | 5.5%(+12.6)#2,908 |
| 16. | Glasgow | 17.9% | 5.2%(+12.7)#16 | 5.5%(+12.4)#3,004 |
| 17. | Mehama | 17.8% | 5.2%(+12.6)#17 | 5.5%(+12.3)#3,026 |
| 18. | Elkton | 17.3% | 5.2%(+12.1)#18 | 5.5%(+11.8)#3,210 |
| 19. | Rainier | 17.3% | 5.2%(+12.1)#19 | 5.5%(+11.8)#3,223 |
| 20. | Woodburn | 17.1% | 5.2%(+11.9)#20 | 5.5%(+11.6)#3,320 |
| 21. | Shaniko | 16.7% | 5.2%(+11.5)#21 | 5.5%(+11.2)#3,542 |
| 22. | Cherry Grove | 16.6% | 5.2%(+11.4)#22 | 5.5%(+11.1)#3,576 |
| 23. | Riddle | 15.9% | 5.2%(+10.7)#23 | 5.5%(+10.4)#3,940 |
| 24. | Cayuse | 15.8% | 5.2%(+10.6)#24 | 5.5%(+10.3)#3,987 |
| 25. | Amity | 15.7% | 5.2%(+10.6)#25 | 5.5%(+10.3)#4,007 |
| 26. | Yamhill | 15.6% | 5.2%(+10.4)#26 | 5.5%(+10.2)#4,052 |
| 27. | Metolius | 15.4% | 5.2%(+10.3)#27 | 5.5%(+9.97)#4,134 |
| 28. | Yoncalla | 15.4% | 5.2%(+10.2)#28 | 5.5%(+9.96)#4,144 |
| 29. | Oregon Shores | 15.4% | 5.2%(+10.2)#29 | 5.5%(+9.92)#4,162 |
| 30. | Summerville | 15.3% | 5.2%(+10.1)#30 | 5.5%(+9.79)#4,248 |
| 31. | Estacada | 15.2% | 5.2%(+9.98)#31 | 5.5%(+9.70)#4,301 |
| 32. | Deer Island | 14.6% | 5.2%(+9.40)#32 | 5.5%(+9.11)#4,675 |
| 33. | Rufus | 14.3% | 5.2%(+9.11)#33 | 5.5%(+8.82)#4,840 |
| 34. | Wallowa | 13.6% | 5.2%(+8.43)#34 | 5.5%(+8.14)#5,278 |
| 35. | Svensen | 13.2% | 5.2%(+8.05)#35 | 5.5%(+7.76)#5,581 |
| 36. | Brownsville | 12.9% | 5.2%(+7.69)#36 | 5.5%(+7.40)#5,880 |
| 37. | Cornelius | 12.8% | 5.2%(+7.59)#37 | 5.5%(+7.30)#5,968 |
| 38. | Toledo | 12.6% | 5.2%(+7.44)#38 | 5.5%(+7.15)#6,081 |
| 39. | Culver | 12.6% | 5.2%(+7.42)#39 | 5.5%(+7.13)#6,097 |
| 40. | Mill City | 12.6% | 5.2%(+7.39)#40 | 5.5%(+7.10)#6,118 |
| 41. | Sweet Home | 12.6% | 5.2%(+7.37)#41 | 5.5%(+7.09)#6,128 |
| 42. | Juntura | 12.5% | 5.2%(+7.32)#42 | 5.5%(+7.03)#6,211 |
| 43. | Mcminnville | 12.3% | 5.2%(+7.10)#43 | 5.5%(+6.81)#6,387 |
| 44. | White City | 12.2% | 5.2%(+7.03)#44 | 5.5%(+6.75)#6,435 |
| 45. | Labish Village | 12.0% | 5.2%(+6.86)#45 | 5.5%(+6.58)#6,582 |
| 46. | Boardman | 12.0% | 5.2%(+6.85)#46 | 5.5%(+6.57)#6,594 |
| 47. | Adams | 11.8% | 5.2%(+6.65)#47 | 5.5%(+6.37)#6,792 |
| 48. | Elgin | 11.7% | 5.2%(+6.51)#48 | 5.5%(+6.23)#6,944 |
| 49. | Aumsville | 11.6% | 5.2%(+6.45)#49 | 5.5%(+6.16)#7,008 |
| 50. | Mount Hood | 11.3% | 5.2%(+6.13)#50 | 5.5%(+5.84)#7,314 |
| 51. | Newport | 11.0% | 5.2%(+5.86)#51 | 5.5%(+5.58)#7,602 |
| 52. | Lyons | 10.9% | 5.2%(+5.77)#52 | 5.5%(+5.48)#7,711 |
| 53. | Molalla | 10.7% | 5.2%(+5.53)#53 | 5.5%(+5.25)#7,938 |
| 54. | Rogue River | 10.6% | 5.2%(+5.45)#54 | 5.5%(+5.16)#8,010 |
| 55. | Burns | 10.6% | 5.2%(+5.39)#55 | 5.5%(+5.10)#8,072 |
| 56. | Lebanon | 10.5% | 5.2%(+5.32)#56 | 5.5%(+5.03)#8,143 |
| 57. | Scappoose | 10.5% | 5.2%(+5.31)#57 | 5.5%(+5.02)#8,159 |
| 58. | Garibaldi | 10.4% | 5.2%(+5.26)#58 | 5.5%(+4.97)#8,233 |
| 59. | Halsey | 10.4% | 5.2%(+5.20)#59 | 5.5%(+4.91)#8,286 |
| 60. | Johnson City | 10.3% | 5.2%(+5.16)#60 | 5.5%(+4.88)#8,323 |
| 61. | Oceanside | 10.1% | 5.2%(+4.95)#61 | 5.5%(+4.66)#8,601 |
| 62. | Barlow | 10.1% | 5.2%(+4.90)#62 | 5.5%(+4.62)#8,652 |
| 63. | Pilot Rock | 9.9% | 5.2%(+4.71)#63 | 5.5%(+4.42)#8,871 |
| 64. | Willamina | 9.9% | 5.2%(+4.69)#64 | 5.5%(+4.40)#8,899 |
| 65. | Williams | 9.8% | 5.2%(+4.61)#65 | 5.5%(+4.32)#9,006 |
| 66. | Malin | 9.6% | 5.2%(+4.42)#66 | 5.5%(+4.13)#9,212 |
| 67. | Milton Freewater | 9.5% | 5.2%(+4.33)#67 | 5.5%(+4.04)#9,329 |
| 68. | St Helens | 9.5% | 5.2%(+4.27)#68 | 5.5%(+3.99)#9,401 |
| 69. | Chenoweth | 9.5% | 5.2%(+4.27)#69 | 5.5%(+3.99)#9,402 |
| 70. | Grand Ronde | 9.4% | 5.2%(+4.22)#70 | 5.5%(+3.93)#9,475 |
| 71. | Myrtle Creek | 9.4% | 5.2%(+4.17)#71 | 5.5%(+3.89)#9,530 |
| 72. | Shady Cove | 9.3% | 5.2%(+4.14)#72 | 5.5%(+3.85)#9,571 |
| 73. | Bonanza | 9.2% | 5.2%(+4.05)#73 | 5.5%(+3.76)#9,660 |
| 74. | Hayesville | 9.2% | 5.2%(+4.02)#74 | 5.5%(+3.73)#9,708 |
| 75. | Tillamook | 9.2% | 5.2%(+4.01)#75 | 5.5%(+3.72)#9,725 |
| 76. | Cove | 9.2% | 5.2%(+3.98)#76 | 5.5%(+3.69)#9,748 |
| 77. | Lafayette | 9.2% | 5.2%(+3.98)#77 | 5.5%(+3.69)#9,755 |
| 78. | Metzger | 9.1% | 5.2%(+3.96)#78 | 5.5%(+3.67)#9,776 |
| 79. | Long Creek | 9.1% | 5.2%(+3.91)#79 | 5.5%(+3.62)#9,854 |
| 80. | Jordan Valley | 9.1% | 5.2%(+3.91)#80 | 5.5%(+3.62)#9,860 |
| 81. | Creswell | 9.0% | 5.2%(+3.85)#81 | 5.5%(+3.56)#9,932 |
| 82. | Gladstone | 9.0% | 5.2%(+3.83)#82 | 5.5%(+3.54)#9,953 |
| 83. | Dallas | 9.0% | 5.2%(+3.78)#83 | 5.5%(+3.49)#10,021 |
| 84. | Gaston | 8.8% | 5.2%(+3.60)#84 | 5.5%(+3.32)#10,248 |
| 85. | Nyssa | 8.8% | 5.2%(+3.60)#85 | 5.5%(+3.31)#10,253 |
| 86. | Gervais | 8.7% | 5.2%(+3.56)#86 | 5.5%(+3.27)#10,311 |
| 87. | Hubbard | 8.7% | 5.2%(+3.50)#87 | 5.5%(+3.22)#10,387 |
| 88. | La Pine | 8.7% | 5.2%(+3.48)#88 | 5.5%(+3.20)#10,407 |
| 89. | Sandy | 8.6% | 5.2%(+3.39)#89 | 5.5%(+3.10)#10,547 |
| 90. | Columbia City | 8.5% | 5.2%(+3.34)#90 | 5.5%(+3.06)#10,606 |
| 91. | Crooked River Ranch | 8.5% | 5.2%(+3.33)#91 | 5.5%(+3.04)#10,634 |
| 92. | Roseburg North | 8.3% | 5.2%(+3.16)#92 | 5.5%(+2.87)#10,867 |
| 93. | Wasco | 8.3% | 5.2%(+3.15)#93 | 5.5%(+2.86)#10,878 |
| 94. | Haines | 8.3% | 5.2%(+3.15)#94 | 5.5%(+2.86)#10,895 |
| 95. | Scio | 8.1% | 5.2%(+2.96)#95 | 5.5%(+2.67)#11,164 |
| 96. | Central Point | 8.1% | 5.2%(+2.95)#96 | 5.5%(+2.66)#11,168 |
| 97. | La Grande | 8.1% | 5.2%(+2.94)#97 | 5.5%(+2.65)#11,190 |
| 98. | Lakeside | 8.1% | 5.2%(+2.91)#98 | 5.5%(+2.63)#11,226 |
| 99. | Stanfield | 7.9% | 5.2%(+2.74)#99 | 5.5%(+2.45)#11,472 |
| 100. | Klamath Falls | 7.8% | 5.2%(+2.64)#100 | 5.5%(+2.35)#11,642 |
Common Questions
What are the Top 10 Cities with the Highest Percentage of Population Employed in Production in Oregon?
Top 10 Cities with the Highest Percentage of Population Employed in Production in Oregon are:
#1
100.0%
#2
57.1%
#3
28.6%
#4
27.6%
#5
20.0%
#6
20.0%
#7
19.9%
#8
19.5%
#9
19.4%
#10
19.4%
What city has the Highest Percentage of Population Employed in Production in Oregon?
Kerby has the Highest Percentage of Population Employed in Production in Oregon with 100.0%.
What is the Percentage of Population Employed in Production in the State of Oregon?
Percentage of Population Employed in Production in Oregon is 5.2%.
What is the Percentage of Population Employed in Production in the United States?
Percentage of Population Employed in Production in the United States is 5.5%.