Schubert, PA Map & Demographics
Schubert Map
Schubert Overview
$31,520
PER CAPITA INCOME
34.8%
WAGE / INCOME GAP [ % ]
65.2¢/ $1
WAGE / INCOME GAP [ $ ]
0.28
INEQUALITY / GINI INDEX
110
TOTAL POPULATION
50
MALE POPULATION
60
FEMALE POPULATION
83.33
MALES / 100 FEMALES
120.00
FEMALES / 100 MALES
43.3
MEDIAN AGE
3.1
AVG FAMILY SIZE
3.8
AVG HOUSEHOLD SIZE
92
LABOR FORCE [ PEOPLE ]
92.0%
PERCENT IN LABOR FORCE
12.0%
UNEMPLOYMENT RATE
Income in Schubert
Income Overview in Schubert
| Characteristic | Number | Measure |
| Per Capita Income | 110 | $31,520 |
| Median Family Income | 29 | $0 |
| Mean Family Income | 29 | $101,186 |
| Median Household Income | 29 | $0 |
| Mean Household Income | 29 | $112,817 |
| Income Deficit | 29 | $0 |
| Wage / Income Gap (%) | 110 | 34.78% |
| Wage / Income Gap ($) | 110 | 65.22¢ per $1 |
| Gini / Inequality Index | 110 | 0.28 |
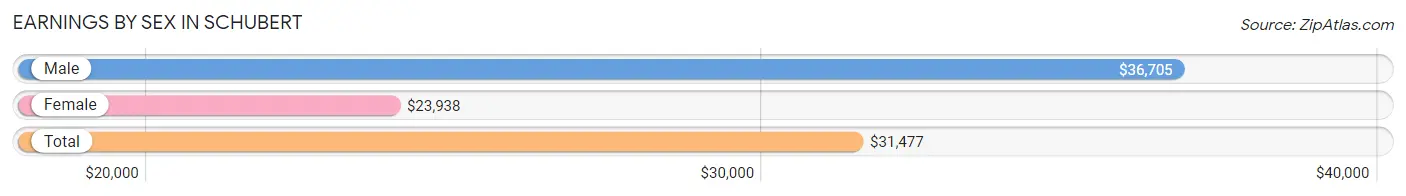
Earnings by Sex in Schubert
Average Earnings in Schubert are $31,477, $36,705 for men and $23,938 for women, a difference of 34.8%.
| Sex | Number | Average Earnings |
| Male | 50 (56.2%) | $36,705 |
| Female | 39 (43.8%) | $23,938 |
| Total | 89 (100.0%) | $31,477 |
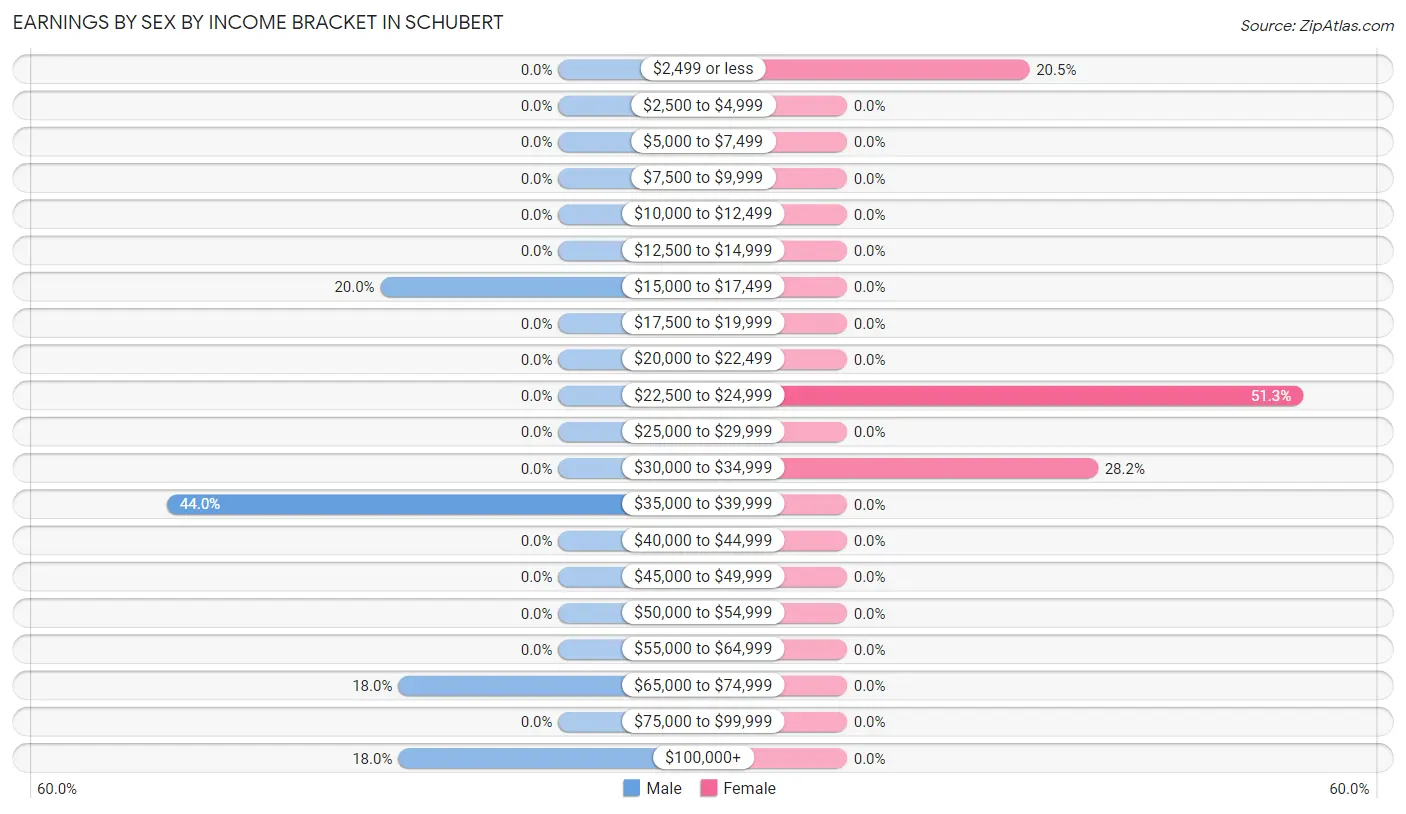
Earnings by Sex by Income Bracket in Schubert
The most common earnings brackets in Schubert are $35,000 to $39,999 for men (22 | 44.0%) and $22,500 to $24,999 for women (20 | 51.3%).
| Income | Male | Female |
| $2,499 or less | 0 (0.0%) | 8 (20.5%) |
| $2,500 to $4,999 | 0 (0.0%) | 0 (0.0%) |
| $5,000 to $7,499 | 0 (0.0%) | 0 (0.0%) |
| $7,500 to $9,999 | 0 (0.0%) | 0 (0.0%) |
| $10,000 to $12,499 | 0 (0.0%) | 0 (0.0%) |
| $12,500 to $14,999 | 0 (0.0%) | 0 (0.0%) |
| $15,000 to $17,499 | 10 (20.0%) | 0 (0.0%) |
| $17,500 to $19,999 | 0 (0.0%) | 0 (0.0%) |
| $20,000 to $22,499 | 0 (0.0%) | 0 (0.0%) |
| $22,500 to $24,999 | 0 (0.0%) | 20 (51.3%) |
| $25,000 to $29,999 | 0 (0.0%) | 0 (0.0%) |
| $30,000 to $34,999 | 0 (0.0%) | 11 (28.2%) |
| $35,000 to $39,999 | 22 (44.0%) | 0 (0.0%) |
| $40,000 to $44,999 | 0 (0.0%) | 0 (0.0%) |
| $45,000 to $49,999 | 0 (0.0%) | 0 (0.0%) |
| $50,000 to $54,999 | 0 (0.0%) | 0 (0.0%) |
| $55,000 to $64,999 | 0 (0.0%) | 0 (0.0%) |
| $65,000 to $74,999 | 9 (18.0%) | 0 (0.0%) |
| $75,000 to $99,999 | 0 (0.0%) | 0 (0.0%) |
| $100,000+ | 9 (18.0%) | 0 (0.0%) |
| Total | 50 (100.0%) | 39 (100.0%) |
Earnings by Sex by Educational Attainment in Schubert
| Educational Attainment | Male Income | Female Income |
| Less than High School | - | - |
| High School Diploma | - | - |
| College or Associate's Degree | - | - |
| Bachelor's Degree | - | - |
| Graduate Degree | - | - |
| Total | - | - |
Family Income in Schubert
Family Income Brackets in Schubert
According to the Schubert family income data, there are 11 families falling into the $35,000 to $49,999 income range, which is the most common income bracket and makes up 37.9% of all families.
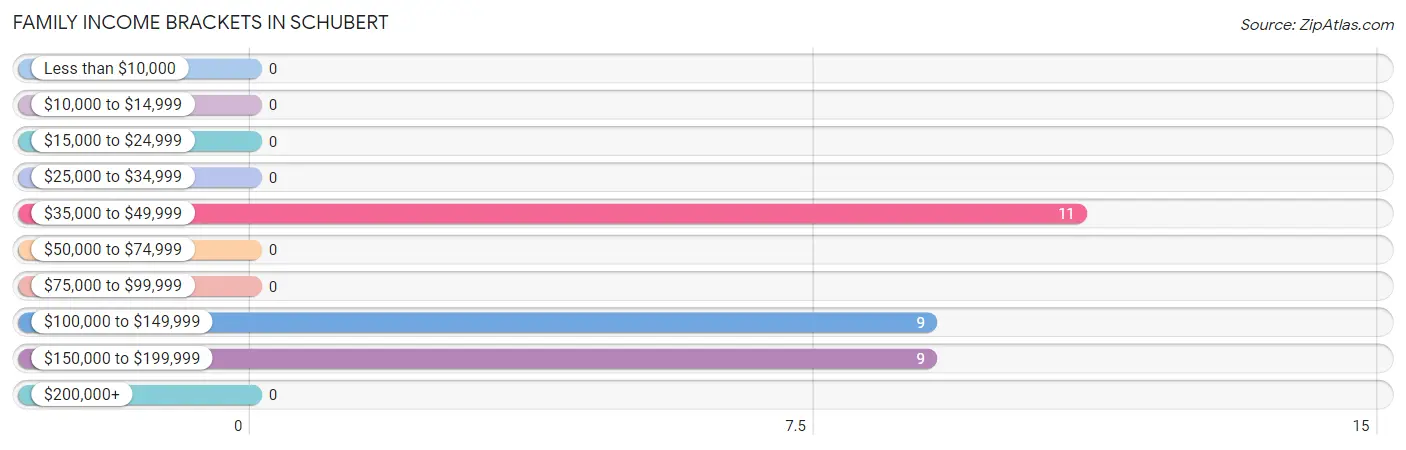
| Income Bracket | # Families | % Families |
| Less than $10,000 | 0 | 0.0% |
| $10,000 to $14,999 | 0 | 0.0% |
| $15,000 to $24,999 | 0 | 0.0% |
| $25,000 to $34,999 | 0 | 0.0% |
| $35,000 to $49,999 | 11 | 37.9% |
| $50,000 to $74,999 | 0 | 0.0% |
| $75,000 to $99,999 | 0 | 0.0% |
| $100,000 to $149,999 | 9 | 31.0% |
| $150,000 to $199,999 | 9 | 31.0% |
| $200,000+ | 0 | 0.0% |
Family Income by Famaliy Size in Schubert
| Income Bracket | # Families | Median Income |
| 2-Person Families | 9 (31.0%) | $0 |
| 3-Person Families | 11 (37.9%) | $0 |
| 4-Person Families | 9 (31.0%) | $0 |
| 5-Person Families | 0 (0.0%) | $0 |
| 6-Person Families | 0 (0.0%) | $0 |
| 7+ Person Families | 0 (0.0%) | $0 |
| Total | 29 (100.0%) | $0 |
Family Income by Number of Earners in Schubert
| Number of Earners | # Families | Median Income |
| No Earners | 0 (0.0%) | $0 |
| 1 Earner | 11 (37.9%) | $0 |
| 2 Earners | 9 (31.0%) | $0 |
| 3+ Earners | 9 (31.0%) | $0 |
| Total | 29 (100.0%) | $0 |
Household Income in Schubert
Household Income Brackets in Schubert
With 11 households falling in the category, the $35,000 to $49,999 income range is the most frequent in Schubert, accounting for 37.9% of all households.
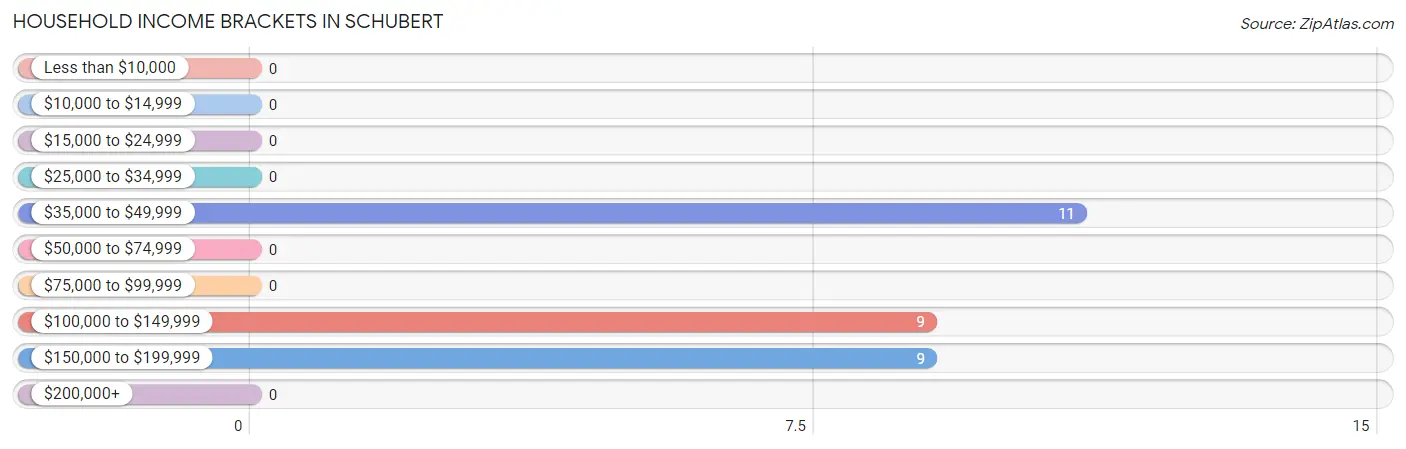
| Income Bracket | # Households | % Households |
| Less than $10,000 | 0 | 0.0% |
| $10,000 to $14,999 | 0 | 0.0% |
| $15,000 to $24,999 | 0 | 0.0% |
| $25,000 to $34,999 | 0 | 0.0% |
| $35,000 to $49,999 | 11 | 37.9% |
| $50,000 to $74,999 | 0 | 0.0% |
| $75,000 to $99,999 | 0 | 0.0% |
| $100,000 to $149,999 | 9 | 31.0% |
| $150,000 to $199,999 | 9 | 31.0% |
| $200,000+ | 0 | 0.0% |
Household Income by Householder Age in Schubert
| Income Bracket | # Households | Median Income |
| 15 to 24 Years | 0 (0.0%) | $0 |
| 25 to 44 Years | 0 (0.0%) | $0 |
| 45 to 64 Years | 29 (100.0%) | $0 |
| 65+ Years | 0 (0.0%) | $0 |
| Total | 29 (100.0%) | $0 |
Poverty in Schubert
Income Below Poverty by Sex and Age in Schubert
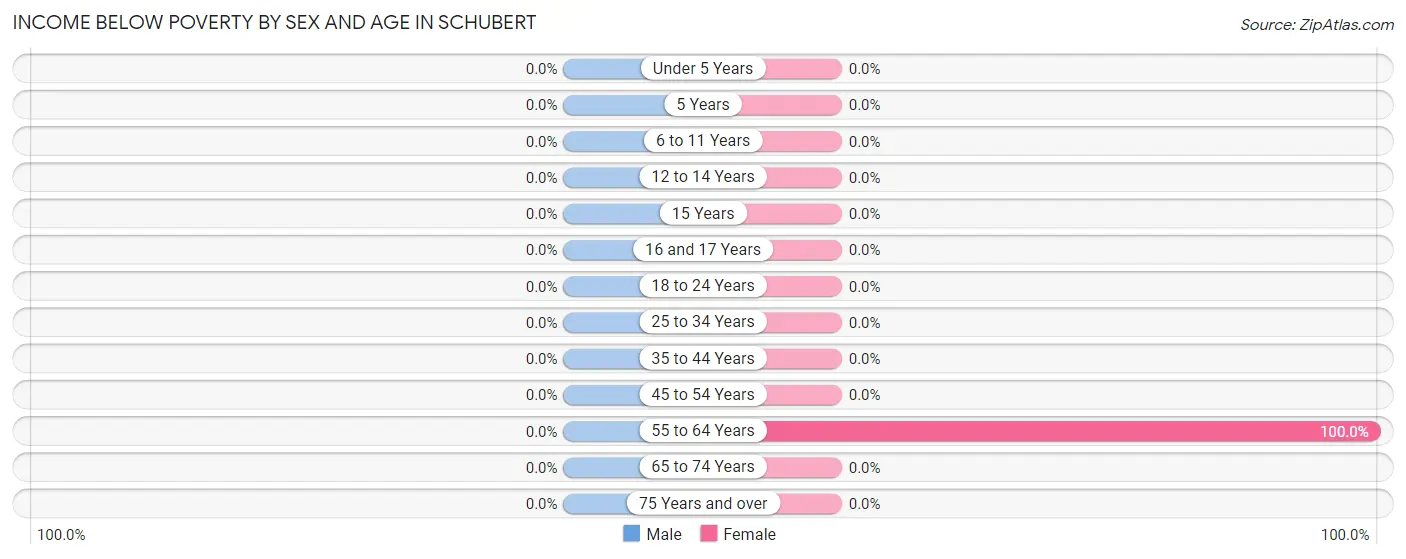
| Age Bracket | Male | Female |
| Under 5 Years | 0 (0.0%) | 0 (0.0%) |
| 5 Years | 0 (0.0%) | 0 (0.0%) |
| 6 to 11 Years | 0 (0.0%) | 0 (0.0%) |
| 12 to 14 Years | 0 (0.0%) | 0 (0.0%) |
| 15 Years | 0 (0.0%) | 0 (0.0%) |
| 16 and 17 Years | 0 (0.0%) | 0 (0.0%) |
| 18 to 24 Years | 0 (0.0%) | 0 (0.0%) |
| 25 to 34 Years | 0 (0.0%) | 0 (0.0%) |
| 35 to 44 Years | 0 (0.0%) | 0 (0.0%) |
| 45 to 54 Years | 0 (0.0%) | 0 (0.0%) |
| 55 to 64 Years | 0 (0.0%) | 8 (100.0%) |
| 65 to 74 Years | 0 (0.0%) | 0 (0.0%) |
| 75 Years and over | 0 (0.0%) | 0 (0.0%) |
| Total | 0 (0.0%) | 8 (13.3%) |
Income Above Poverty by Sex and Age in Schubert
According to the poverty statistics in Schubert, males aged 18 to 24 years and females aged 12 to 14 years are the age groups that are most secure financially, with 100.0% of males and 100.0% of females in these age groups living above the poverty line.
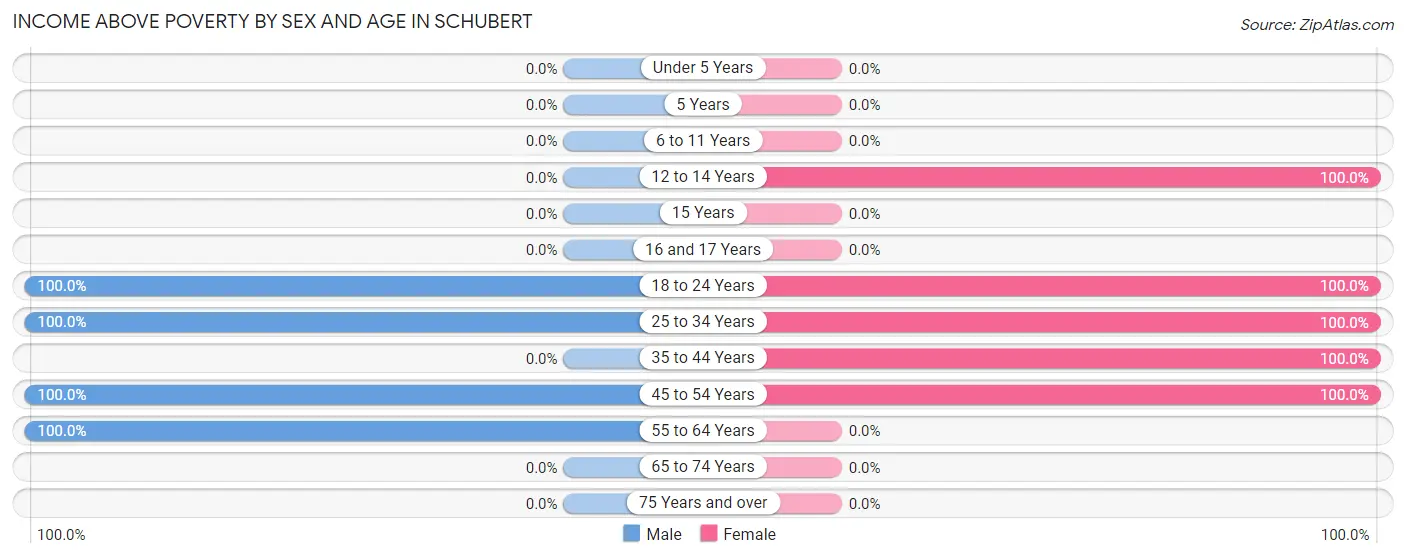
| Age Bracket | Male | Female |
| Under 5 Years | 0 (0.0%) | 0 (0.0%) |
| 5 Years | 0 (0.0%) | 0 (0.0%) |
| 6 to 11 Years | 0 (0.0%) | 0 (0.0%) |
| 12 to 14 Years | 0 (0.0%) | 10 (100.0%) |
| 15 Years | 0 (0.0%) | 0 (0.0%) |
| 16 and 17 Years | 0 (0.0%) | 0 (0.0%) |
| 18 to 24 Years | 10 (100.0%) | 10 (100.0%) |
| 25 to 34 Years | 11 (100.0%) | 11 (100.0%) |
| 35 to 44 Years | 0 (0.0%) | 11 (100.0%) |
| 45 to 54 Years | 20 (100.0%) | 10 (100.0%) |
| 55 to 64 Years | 9 (100.0%) | 0 (0.0%) |
| 65 to 74 Years | 0 (0.0%) | 0 (0.0%) |
| 75 Years and over | 0 (0.0%) | 0 (0.0%) |
| Total | 50 (100.0%) | 52 (86.7%) |
Income Below Poverty Among Married-Couple Families in Schubert
| Children | Above Poverty | Below Poverty |
| No Children | 9 (100.0%) | 0 (0.0%) |
| 1 or 2 Children | 11 (100.0%) | 0 (0.0%) |
| 3 or 4 Children | 0 (0.0%) | 0 (0.0%) |
| 5 or more Children | 0 (0.0%) | 0 (0.0%) |
| Total | 20 (100.0%) | 0 (0.0%) |
Income Below Poverty Among Single-Parent Households in Schubert
| Children | Single Father | Single Mother |
| No Children | 0 (0.0%) | 0 (0.0%) |
| 1 or 2 Children | 0 (0.0%) | 0 (0.0%) |
| 3 or 4 Children | 0 (0.0%) | 0 (0.0%) |
| 5 or more Children | 0 (0.0%) | 0 (0.0%) |
| Total | 0 (0.0%) | 0 (0.0%) |
Income Below Poverty Among Married-Couple vs Single-Parent Households in Schubert
| Children | Married-Couple Families | Single-Parent Households |
| No Children | 0 (0.0%) | 0 (0.0%) |
| 1 or 2 Children | 0 (0.0%) | 0 (0.0%) |
| 3 or 4 Children | 0 (0.0%) | 0 (0.0%) |
| 5 or more Children | 0 (0.0%) | 0 (0.0%) |
| Total | 0 (0.0%) | 0 (0.0%) |
Race in Schubert
The most populous races in Schubert are , and White / Caucasian (110 | 100.0%).
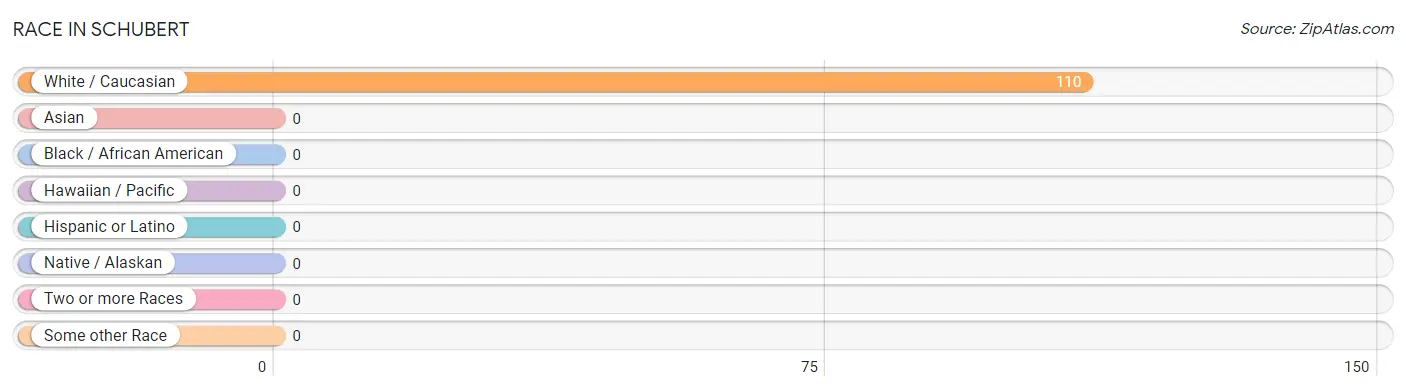
| Race | # Population | % Population |
| Asian | 0 | 0.0% |
| Black / African American | 0 | 0.0% |
| Hawaiian / Pacific | 0 | 0.0% |
| Hispanic or Latino | 0 | 0.0% |
| Native / Alaskan | 0 | 0.0% |
| White / Caucasian | 110 | 100.0% |
| Two or more Races | 0 | 0.0% |
| Some other Race | 0 | 0.0% |
| Total | 110 | 100.0% |
Ancestry in Schubert
The most populous ancestries reported in Schubert are German (68 | 61.8%), American (31 | 28.2%), Italian (21 | 19.1%), and English (8 | 7.3%), together accounting for 116.4% of all Schubert residents.
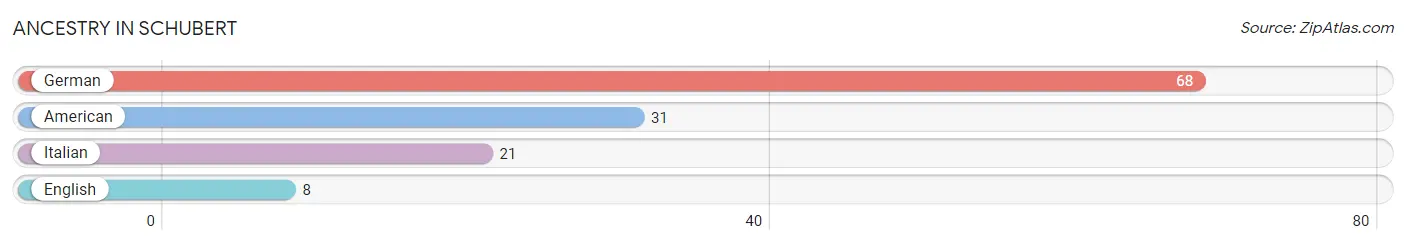
| Ancestry | # Population | % Population |
| American | 31 | 28.2% |
| English | 8 | 7.3% |
| German | 68 | 61.8% |
| Italian | 21 | 19.1% | View All 4 Rows |
Immigrants in Schubert

| Immigration Origin | # Population | % Population | View All 0 Rows |
Sex and Age in Schubert
Sex and Age in Schubert
The most populous age groups in Schubert are 45 to 49 Years (20 | 40.0%) for men and 25 to 29 Years (11 | 18.3%) for women.
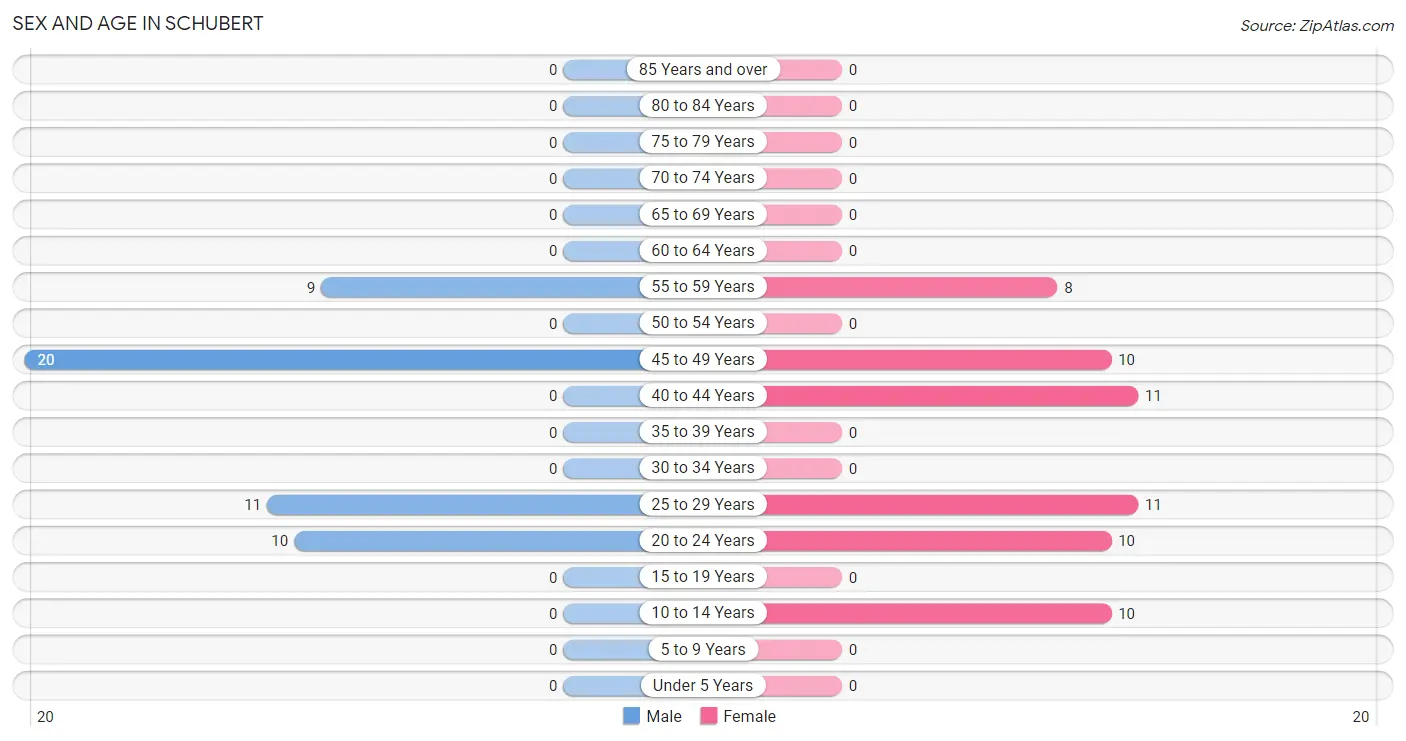
| Age Bracket | Male | Female |
| Under 5 Years | 0 (0.0%) | 0 (0.0%) |
| 5 to 9 Years | 0 (0.0%) | 0 (0.0%) |
| 10 to 14 Years | 0 (0.0%) | 10 (16.7%) |
| 15 to 19 Years | 0 (0.0%) | 0 (0.0%) |
| 20 to 24 Years | 10 (20.0%) | 10 (16.7%) |
| 25 to 29 Years | 11 (22.0%) | 11 (18.3%) |
| 30 to 34 Years | 0 (0.0%) | 0 (0.0%) |
| 35 to 39 Years | 0 (0.0%) | 0 (0.0%) |
| 40 to 44 Years | 0 (0.0%) | 11 (18.3%) |
| 45 to 49 Years | 20 (40.0%) | 10 (16.7%) |
| 50 to 54 Years | 0 (0.0%) | 0 (0.0%) |
| 55 to 59 Years | 9 (18.0%) | 8 (13.3%) |
| 60 to 64 Years | 0 (0.0%) | 0 (0.0%) |
| 65 to 69 Years | 0 (0.0%) | 0 (0.0%) |
| 70 to 74 Years | 0 (0.0%) | 0 (0.0%) |
| 75 to 79 Years | 0 (0.0%) | 0 (0.0%) |
| 80 to 84 Years | 0 (0.0%) | 0 (0.0%) |
| 85 Years and over | 0 (0.0%) | 0 (0.0%) |
| Total | 50 (100.0%) | 60 (100.0%) |
Families and Households in Schubert
Median Family Size in Schubert
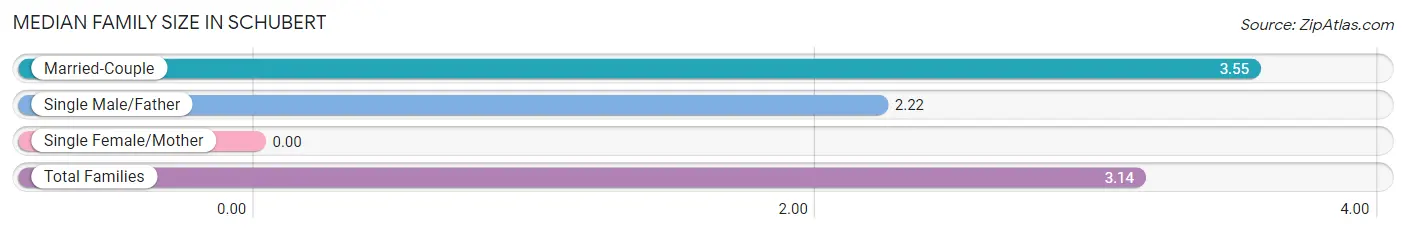
| Family Type | # Families | Family Size |
| Married-Couple | 20 (69.0%) | 3.55 |
| Single Male/Father | 9 (31.0%) | 2.22 |
| Single Female/Mother | 0 (0.0%) | - |
| Total Families | 29 (100.0%) | 3.14 |
Median Household Size in Schubert
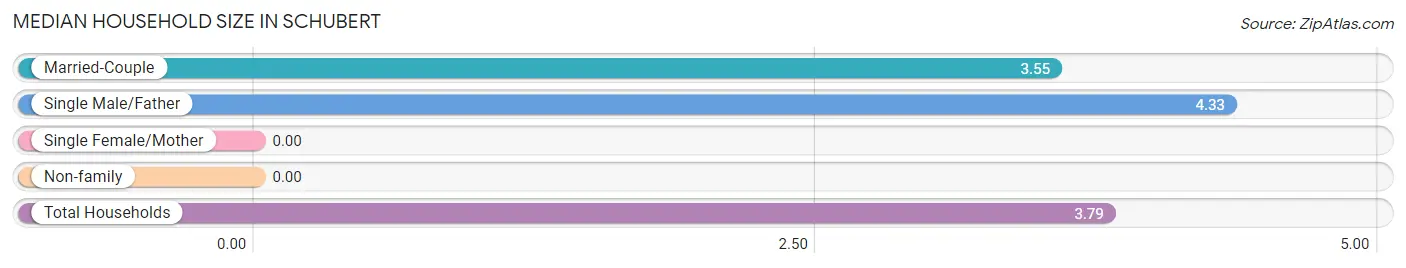
| Household Type | # Households | Household Size |
| Married-Couple | 20 (69.0%) | 3.55 |
| Single Male/Father | 9 (31.0%) | 4.33 |
| Single Female/Mother | 0 (0.0%) | - |
| Non-family | 0 (0.0%) | - |
| Total Households | 29 (100.0%) | 3.79 |
Household Size by Marriage Status in Schubert
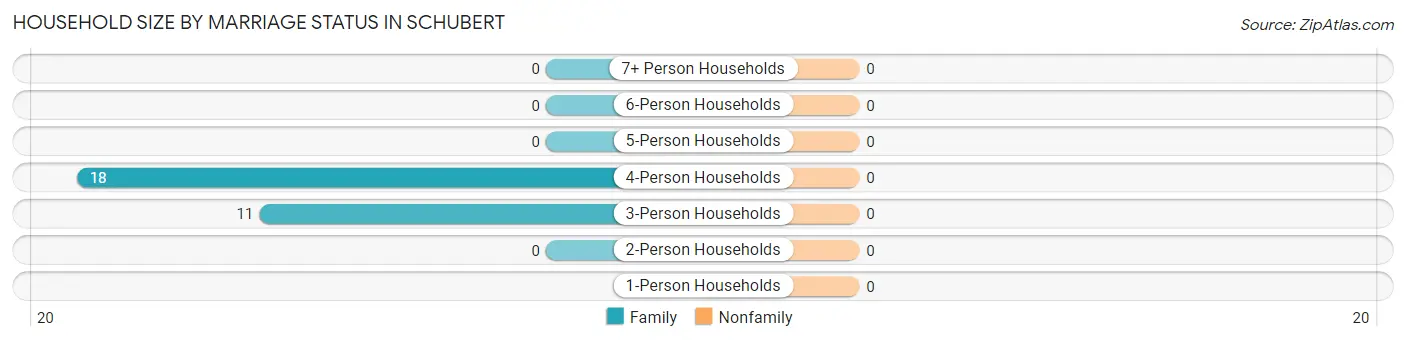
| Household Size | Family Households | Nonfamily Households |
| 1-Person Households | - | 0 (0.0%) |
| 2-Person Households | 0 (0.0%) | 0 (0.0%) |
| 3-Person Households | 11 (37.9%) | 0 (0.0%) |
| 4-Person Households | 18 (62.1%) | 0 (0.0%) |
| 5-Person Households | 0 (0.0%) | 0 (0.0%) |
| 6-Person Households | 0 (0.0%) | 0 (0.0%) |
| 7+ Person Households | 0 (0.0%) | 0 (0.0%) |
| Total | 29 (100.0%) | 0 (0.0%) |
Female Fertility in Schubert
Fertility by Age in Schubert
| Age Bracket | Women with Births | Births / 1,000 Women |
| 15 to 19 years | 0 (0.0%) | 0.0 |
| 20 to 34 years | 0 (0.0%) | 0.0 |
| 35 to 50 years | 0 (0.0%) | 0.0 |
| Total | 0 (0.0%) | 0.0 |
Fertility by Age by Marriage Status in Schubert
| Age Bracket | Married | Unmarried |
| 15 to 19 years | 0 (0.0%) | 0 (0.0%) |
| 20 to 34 years | 0 (0.0%) | 0 (0.0%) |
| 35 to 50 years | 0 (0.0%) | 0 (0.0%) |
| Total | 0 (0.0%) | 0 (0.0%) |
Fertility by Education in Schubert
| Educational Attainment | Women with Births | Births / 1,000 Women |
| Less than High School | 0 (0.0%) | 0.0 |
| High School Diploma | 0 (0.0%) | 0.0 |
| College or Associate's Degree | 0 (0.0%) | 0.0 |
| Bachelor's Degree | 0 (0.0%) | 0.0 |
| Graduate Degree | 0 (0.0%) | 0.0 |
| Total | 0 (0.0%) | 0.0 |
Fertility by Education by Marriage Status in Schubert
| Educational Attainment | Married | Unmarried |
| Less than High School | 0 (0.0%) | 0 (0.0%) |
| High School Diploma | 0 (0.0%) | 0 (0.0%) |
| College or Associate's Degree | 0 (0.0%) | 0 (0.0%) |
| Bachelor's Degree | 0 (0.0%) | 0 (0.0%) |
| Graduate Degree | 0 (0.0%) | 0 (0.0%) |
| Total | 0 (0.0%) | 0 (0.0%) |
Employment Characteristics in Schubert
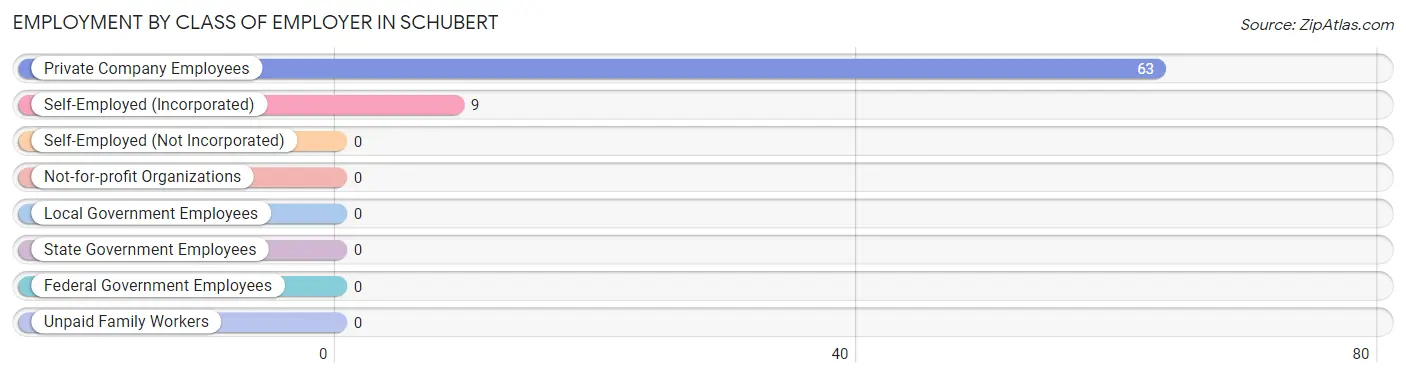
Employment by Class of Employer in Schubert
Among the 72 employed individuals in Schubert, private company employees (63 | 87.5%), and self-employed (incorporated) (9 | 12.5%) make up the most common classes of employment.
| Employer Class | # Employees | % Employees |
| Private Company Employees | 63 | 87.5% |
| Self-Employed (Incorporated) | 9 | 12.5% |
| Self-Employed (Not Incorporated) | 0 | 0.0% |
| Not-for-profit Organizations | 0 | 0.0% |
| Local Government Employees | 0 | 0.0% |
| State Government Employees | 0 | 0.0% |
| Federal Government Employees | 0 | 0.0% |
| Unpaid Family Workers | 0 | 0.0% |
| Total | 72 | 100.0% |
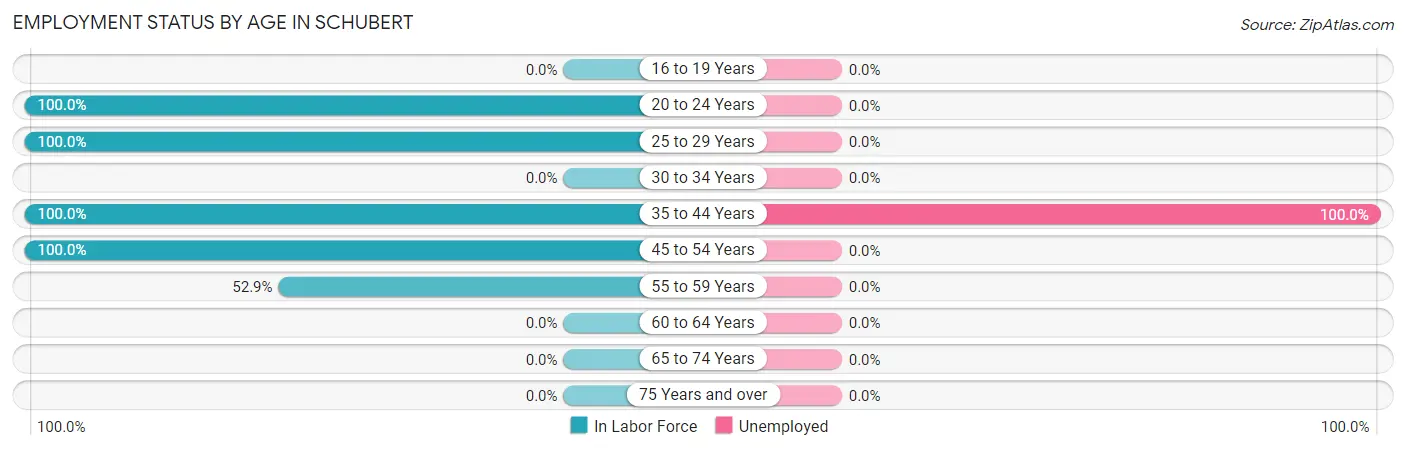
Employment Status by Age in Schubert
According to the labor force statistics for Schubert, out of the total population over 16 years of age (100), 92.0% or 92 individuals are in the labor force, with 12.0% or 11 of them unemployed. The age group with the highest labor force participation rate is 20 to 24 years, with 100.0% or 20 individuals in the labor force. Within the labor force, the 35 to 44 years age range has the highest percentage of unemployed individuals, with 100.0% or 11 of them being unemployed.
| Age Bracket | In Labor Force | Unemployed |
| 16 to 19 Years | 0 (0.0%) | 0 (0.0%) |
| 20 to 24 Years | 20 (100.0%) | 0 (0.0%) |
| 25 to 29 Years | 22 (100.0%) | 0 (0.0%) |
| 30 to 34 Years | 0 (0.0%) | 0 (0.0%) |
| 35 to 44 Years | 11 (100.0%) | 11 (100.0%) |
| 45 to 54 Years | 30 (100.0%) | 0 (0.0%) |
| 55 to 59 Years | 9 (52.9%) | 0 (0.0%) |
| 60 to 64 Years | 0 (0.0%) | 0 (0.0%) |
| 65 to 74 Years | 0 (0.0%) | 0 (0.0%) |
| 75 Years and over | 0 (0.0%) | 0 (0.0%) |
| Total | 92 (92.0%) | 11 (12.0%) |
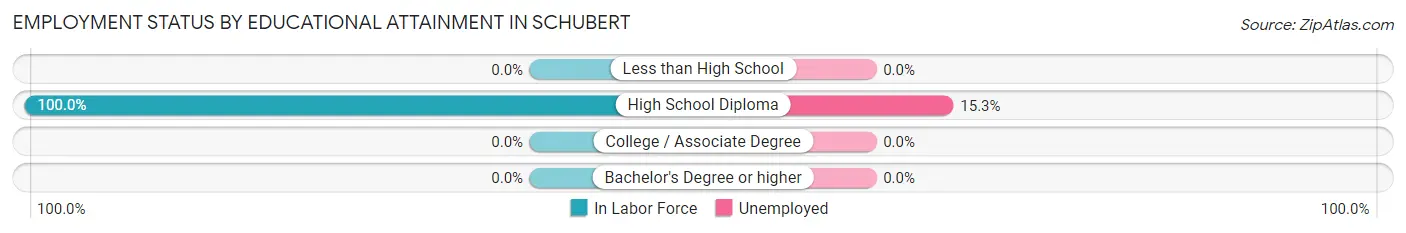
Employment Status by Educational Attainment in Schubert
According to labor force statistics for Schubert, 90.0% of individuals (72) out of the total population between 25 and 64 years of age (80) are in the labor force, with 15.3% or 11 of them being unemployed. The group with the highest labor force participation rate are those with the educational attainment of high school diploma, with 100.0% or 72 individuals in the labor force. Within the labor force, individuals with high school diploma education have the highest percentage of unemployment, with 15.3% or 11 of them being unemployed.
| Educational Attainment | In Labor Force | Unemployed |
| Less than High School | 0 (0.0%) | 0 (0.0%) |
| High School Diploma | 72 (100.0%) | 11 (15.3%) |
| College / Associate Degree | 0 (0.0%) | 0 (0.0%) |
| Bachelor's Degree or higher | 0 (0.0%) | 0 (0.0%) |
| Total | 72 (90.0%) | 12 (15.3%) |
Employment Occupations by Sex in Schubert
Management, Business, Science and Arts Occupations
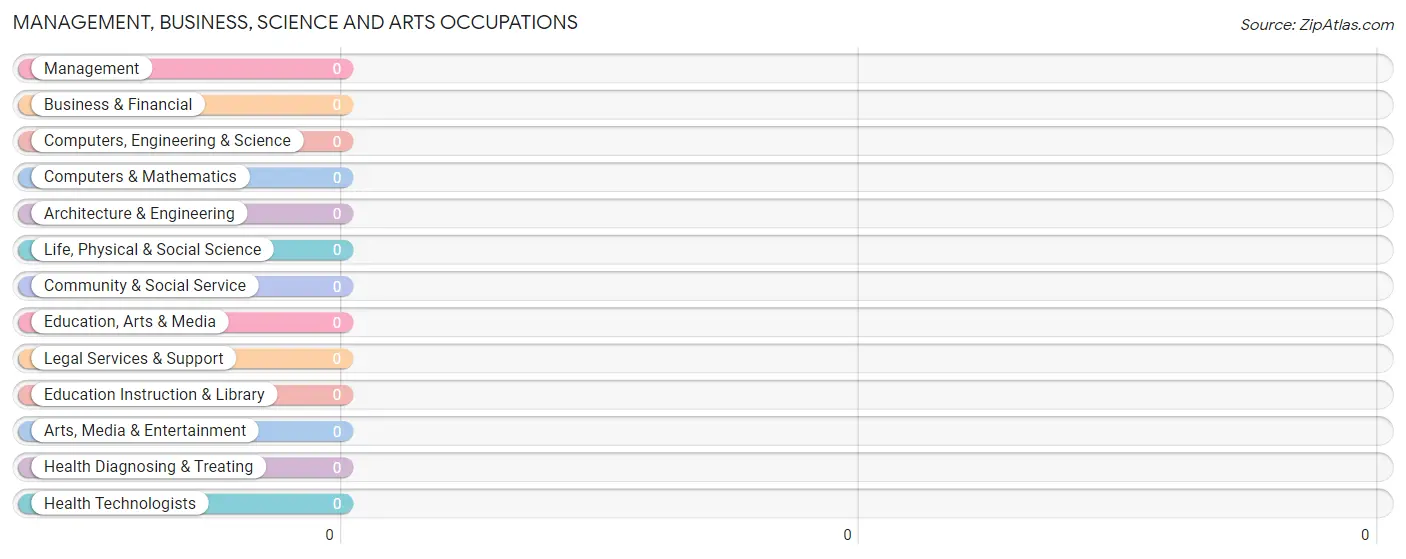
Management, Business, Science and Arts Occupations by Sex
| Occupation | Male | Female |
| Management | 0 (0.0%) | 0 (0.0%) |
| Business & Financial | 0 (0.0%) | 0 (0.0%) |
| Computers, Engineering & Science | 0 (0.0%) | 0 (0.0%) |
| Computers & Mathematics | 0 (0.0%) | 0 (0.0%) |
| Architecture & Engineering | 0 (0.0%) | 0 (0.0%) |
| Life, Physical & Social Science | 0 (0.0%) | 0 (0.0%) |
| Community & Social Service | 0 (0.0%) | 0 (0.0%) |
| Education, Arts & Media | 0 (0.0%) | 0 (0.0%) |
| Legal Services & Support | 0 (0.0%) | 0 (0.0%) |
| Education Instruction & Library | 0 (0.0%) | 0 (0.0%) |
| Arts, Media & Entertainment | 0 (0.0%) | 0 (0.0%) |
| Health Diagnosing & Treating | 0 (0.0%) | 0 (0.0%) |
| Health Technologists | 0 (0.0%) | 0 (0.0%) |
| Total (Category) | 0 (0.0%) | 0 (0.0%) |
| Total (Overall) | 50 (61.7%) | 31 (38.3%) |
Services Occupations
The most common Services occupations in Schubert are , and Food Preparation & Serving (11 | 13.6%).
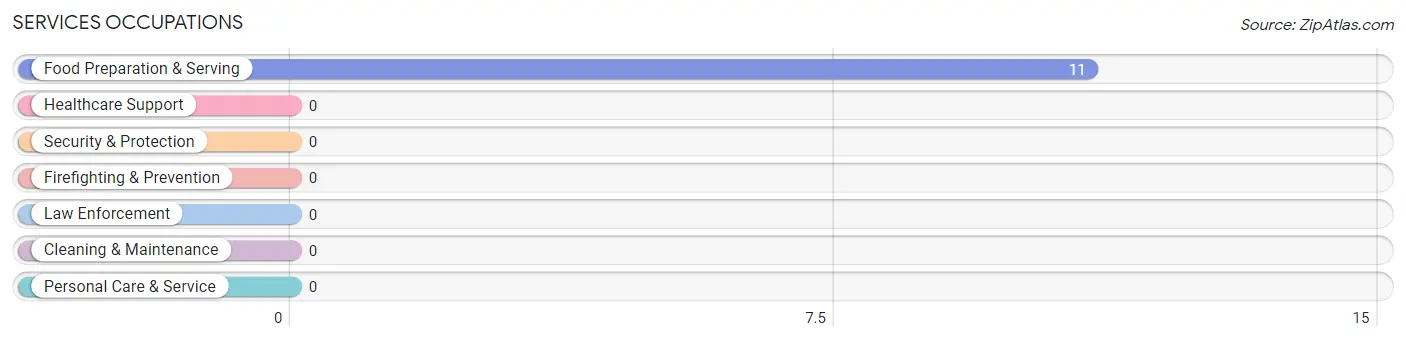
Services Occupations by Sex
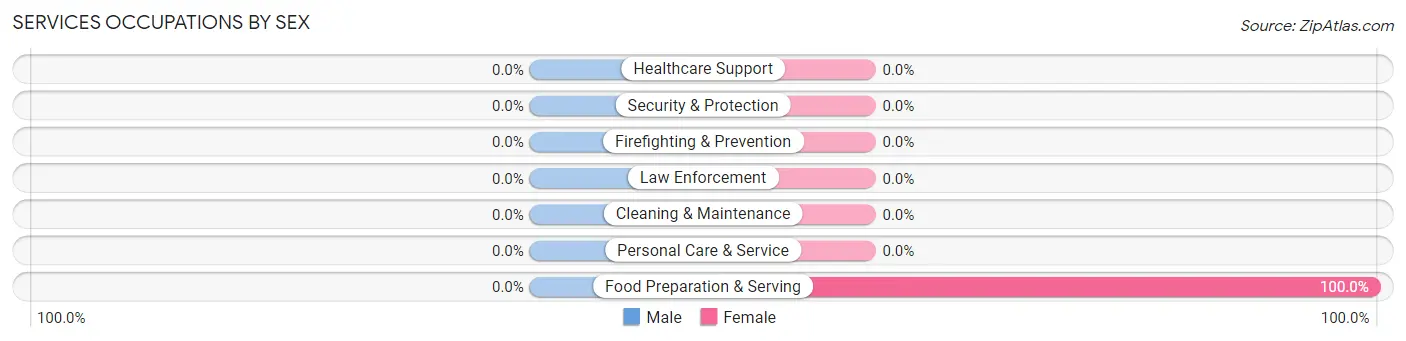
| Occupation | Male | Female |
| Healthcare Support | 0 (0.0%) | 0 (0.0%) |
| Security & Protection | 0 (0.0%) | 0 (0.0%) |
| Firefighting & Prevention | 0 (0.0%) | 0 (0.0%) |
| Law Enforcement | 0 (0.0%) | 0 (0.0%) |
| Food Preparation & Serving | 0 (0.0%) | 11 (100.0%) |
| Cleaning & Maintenance | 0 (0.0%) | 0 (0.0%) |
| Personal Care & Service | 0 (0.0%) | 0 (0.0%) |
| Total (Category) | 0 (0.0%) | 11 (100.0%) |
| Total (Overall) | 50 (61.7%) | 31 (38.3%) |
Sales and Office Occupations
The most common Sales and Office occupations in Schubert are Office & Administration (20 | 24.7%), and Sales & Related (10 | 12.3%).
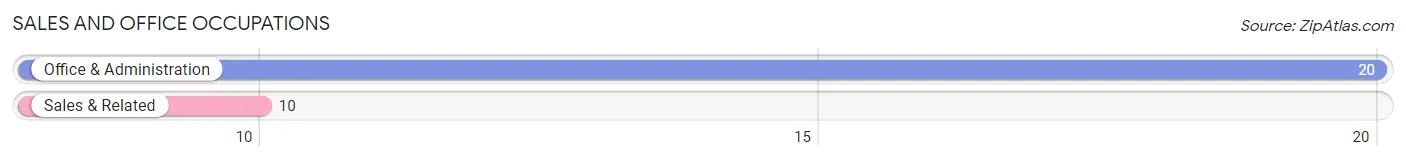
Sales and Office Occupations by Sex
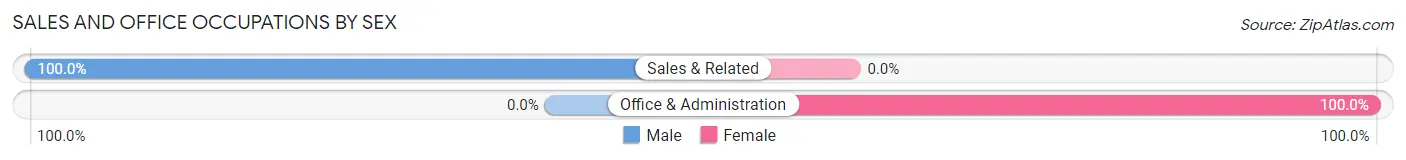
| Occupation | Male | Female |
| Sales & Related | 10 (100.0%) | 0 (0.0%) |
| Office & Administration | 0 (0.0%) | 20 (100.0%) |
| Total (Category) | 10 (33.3%) | 20 (66.7%) |
| Total (Overall) | 50 (61.7%) | 31 (38.3%) |
Natural Resources, Construction and Maintenance Occupations
The most common Natural Resources, Construction and Maintenance occupations in Schubert are , and Construction & Extraction (9 | 11.1%).
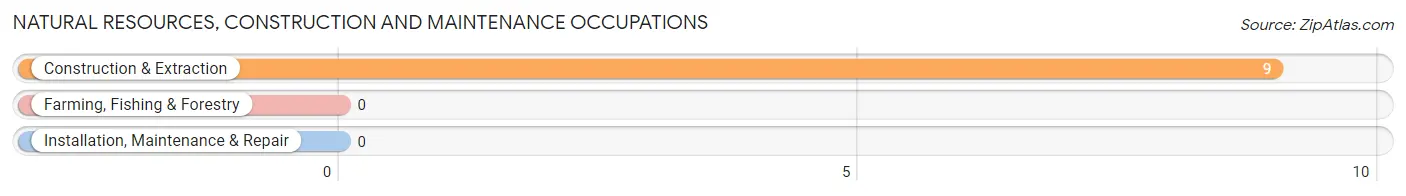
Natural Resources, Construction and Maintenance Occupations by Sex
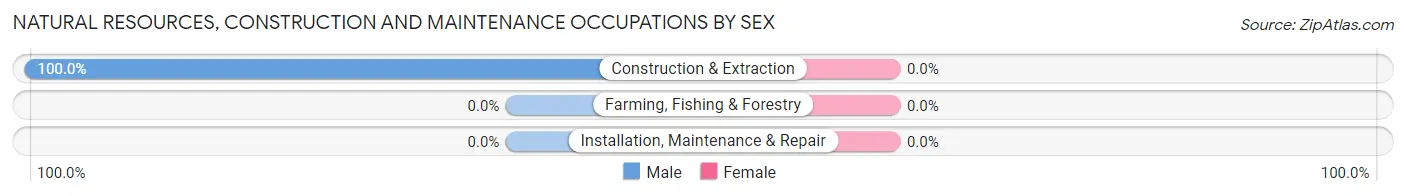
| Occupation | Male | Female |
| Farming, Fishing & Forestry | 0 (0.0%) | 0 (0.0%) |
| Construction & Extraction | 9 (100.0%) | 0 (0.0%) |
| Installation, Maintenance & Repair | 0 (0.0%) | 0 (0.0%) |
| Total (Category) | 9 (100.0%) | 0 (0.0%) |
| Total (Overall) | 50 (61.7%) | 31 (38.3%) |
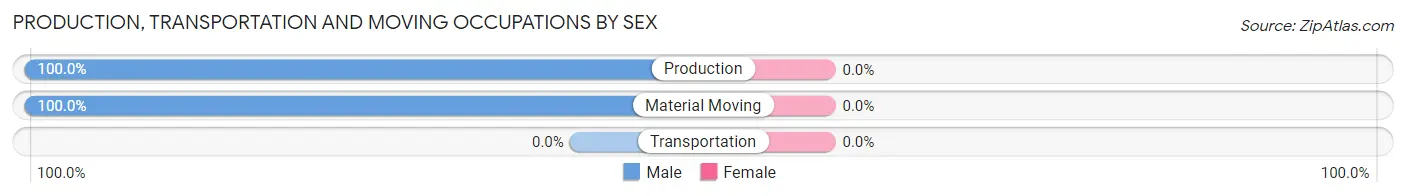
Production, Transportation and Moving Occupations
The most common Production, Transportation and Moving occupations in Schubert are Production (20 | 24.7%), and Material Moving (11 | 13.6%).
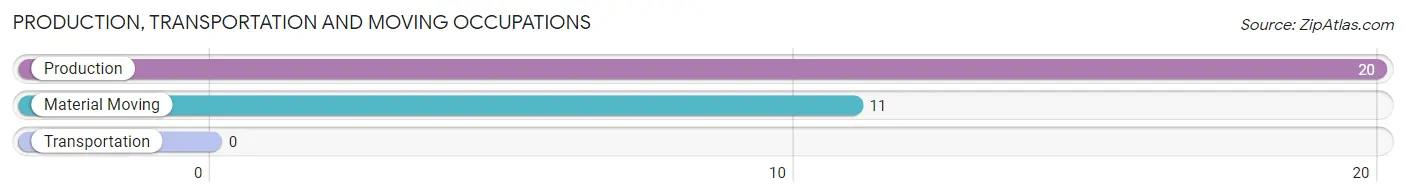
Production, Transportation and Moving Occupations by Sex
| Occupation | Male | Female |
| Production | 20 (100.0%) | 0 (0.0%) |
| Transportation | 0 (0.0%) | 0 (0.0%) |
| Material Moving | 11 (100.0%) | 0 (0.0%) |
| Total (Category) | 31 (100.0%) | 0 (0.0%) |
| Total (Overall) | 50 (61.7%) | 31 (38.3%) |
Employment Industries by Sex in Schubert
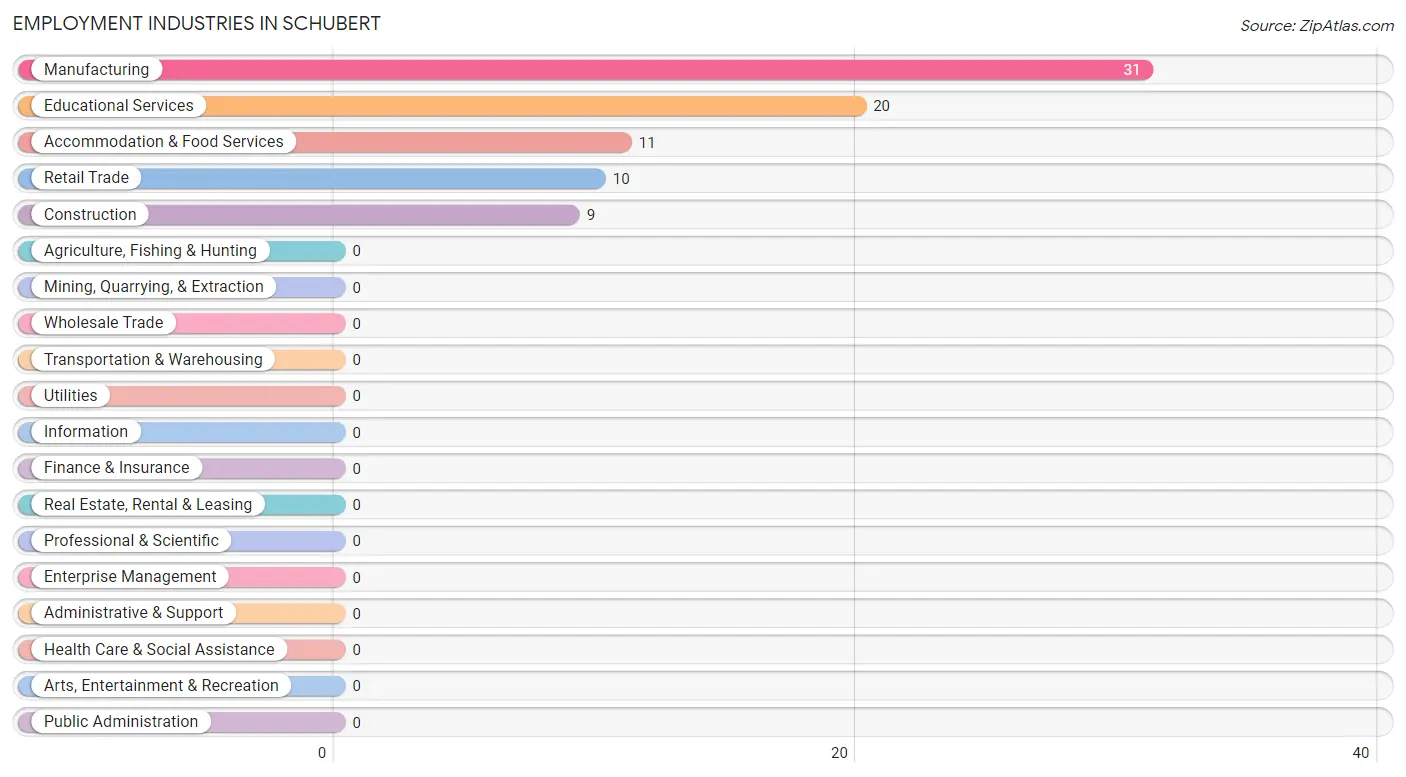
Employment Industries in Schubert
The major employment industries in Schubert include Manufacturing (31 | 38.3%), Educational Services (20 | 24.7%), Accommodation & Food Services (11 | 13.6%), Retail Trade (10 | 12.3%), and Construction (9 | 11.1%).
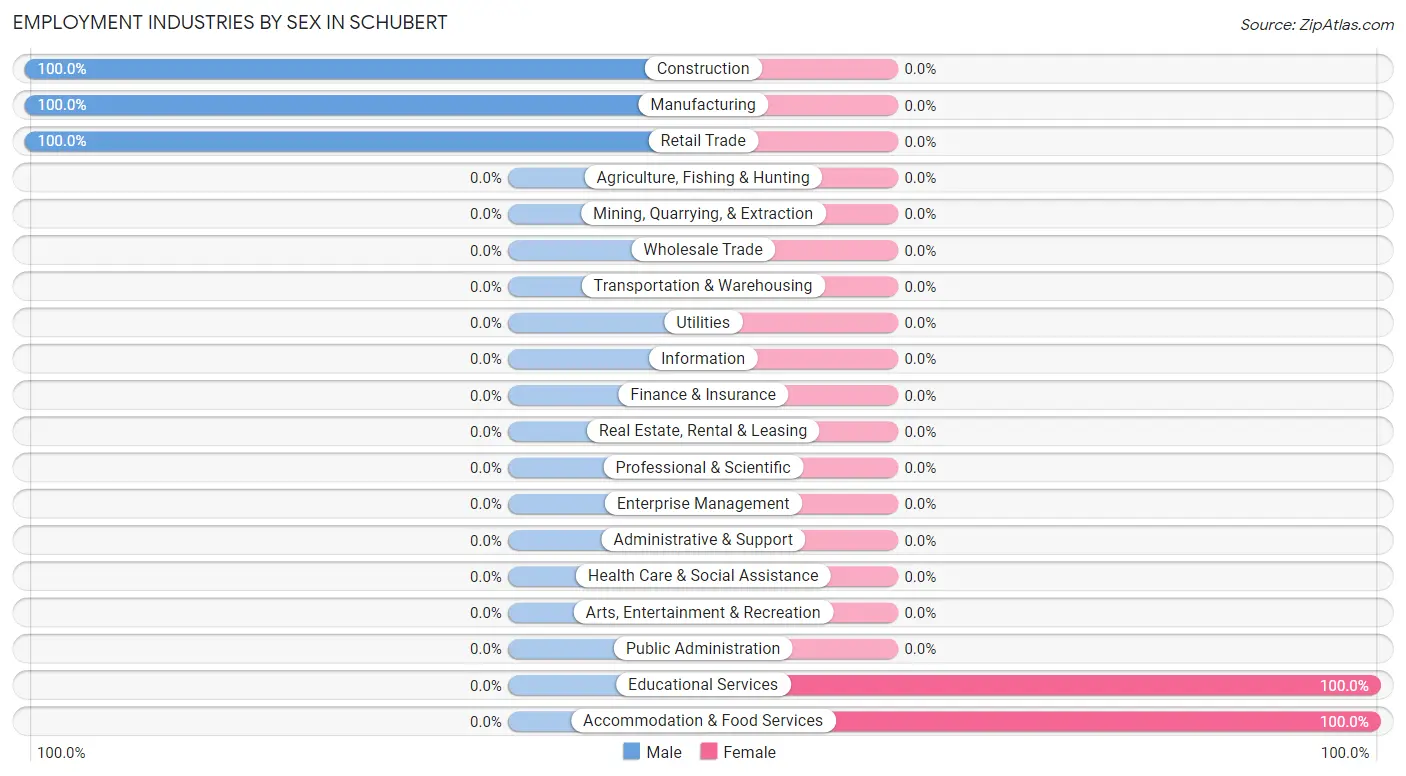
Employment Industries by Sex in Schubert
The Schubert industries that see more men than women are Construction (100.0%), Manufacturing (100.0%), and Retail Trade (100.0%), whereas the industries that tend to have a higher number of women are Educational Services (100.0%), and Accommodation & Food Services (100.0%).
| Industry | Male | Female |
| Agriculture, Fishing & Hunting | 0 (0.0%) | 0 (0.0%) |
| Mining, Quarrying, & Extraction | 0 (0.0%) | 0 (0.0%) |
| Construction | 9 (100.0%) | 0 (0.0%) |
| Manufacturing | 31 (100.0%) | 0 (0.0%) |
| Wholesale Trade | 0 (0.0%) | 0 (0.0%) |
| Retail Trade | 10 (100.0%) | 0 (0.0%) |
| Transportation & Warehousing | 0 (0.0%) | 0 (0.0%) |
| Utilities | 0 (0.0%) | 0 (0.0%) |
| Information | 0 (0.0%) | 0 (0.0%) |
| Finance & Insurance | 0 (0.0%) | 0 (0.0%) |
| Real Estate, Rental & Leasing | 0 (0.0%) | 0 (0.0%) |
| Professional & Scientific | 0 (0.0%) | 0 (0.0%) |
| Enterprise Management | 0 (0.0%) | 0 (0.0%) |
| Administrative & Support | 0 (0.0%) | 0 (0.0%) |
| Educational Services | 0 (0.0%) | 20 (100.0%) |
| Health Care & Social Assistance | 0 (0.0%) | 0 (0.0%) |
| Arts, Entertainment & Recreation | 0 (0.0%) | 0 (0.0%) |
| Accommodation & Food Services | 0 (0.0%) | 11 (100.0%) |
| Public Administration | 0 (0.0%) | 0 (0.0%) |
| Total | 50 (61.7%) | 31 (38.3%) |
Education in Schubert
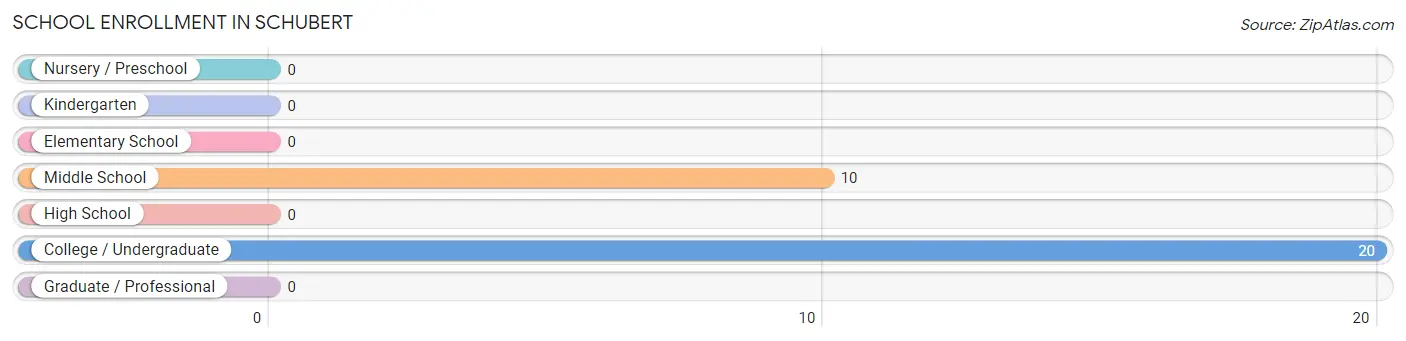
School Enrollment in Schubert
The most common levels of schooling among the 30 students in Schubert are college / undergraduate (20 | 66.7%), and middle school (10 | 33.3%).
| School Level | # Students | % Students |
| Nursery / Preschool | 0 | 0.0% |
| Kindergarten | 0 | 0.0% |
| Elementary School | 0 | 0.0% |
| Middle School | 10 | 33.3% |
| High School | 0 | 0.0% |
| College / Undergraduate | 20 | 66.7% |
| Graduate / Professional | 0 | 0.0% |
| Total | 30 | 100.0% |
School Enrollment by Age by Funding Source in Schubert
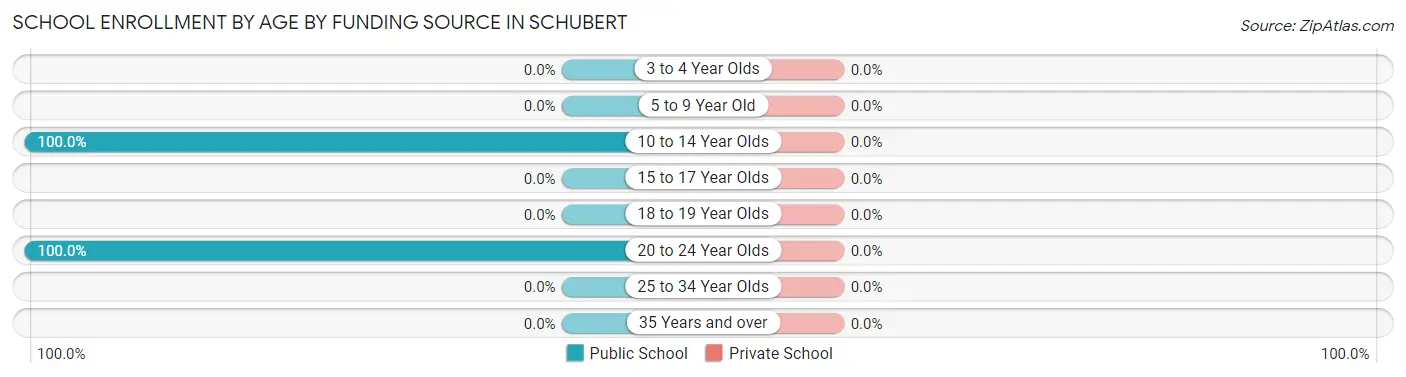
| Age Bracket | Public School | Private School |
| 3 to 4 Year Olds | 0 (0.0%) | 0 (0.0%) |
| 5 to 9 Year Old | 0 (0.0%) | 0 (0.0%) |
| 10 to 14 Year Olds | 10 (100.0%) | 0 (0.0%) |
| 15 to 17 Year Olds | 0 (0.0%) | 0 (0.0%) |
| 18 to 19 Year Olds | 0 (0.0%) | 0 (0.0%) |
| 20 to 24 Year Olds | 20 (100.0%) | 0 (0.0%) |
| 25 to 34 Year Olds | 0 (0.0%) | 0 (0.0%) |
| 35 Years and over | 0 (0.0%) | 0 (0.0%) |
| Total | 30 (100.0%) | 0 (0.0%) |
Educational Attainment by Field of Study in Schubert
, and business (8 | 100.0%) are the most common fields of study among 8 individuals in Schubert who have obtained a bachelor's degree or higher.
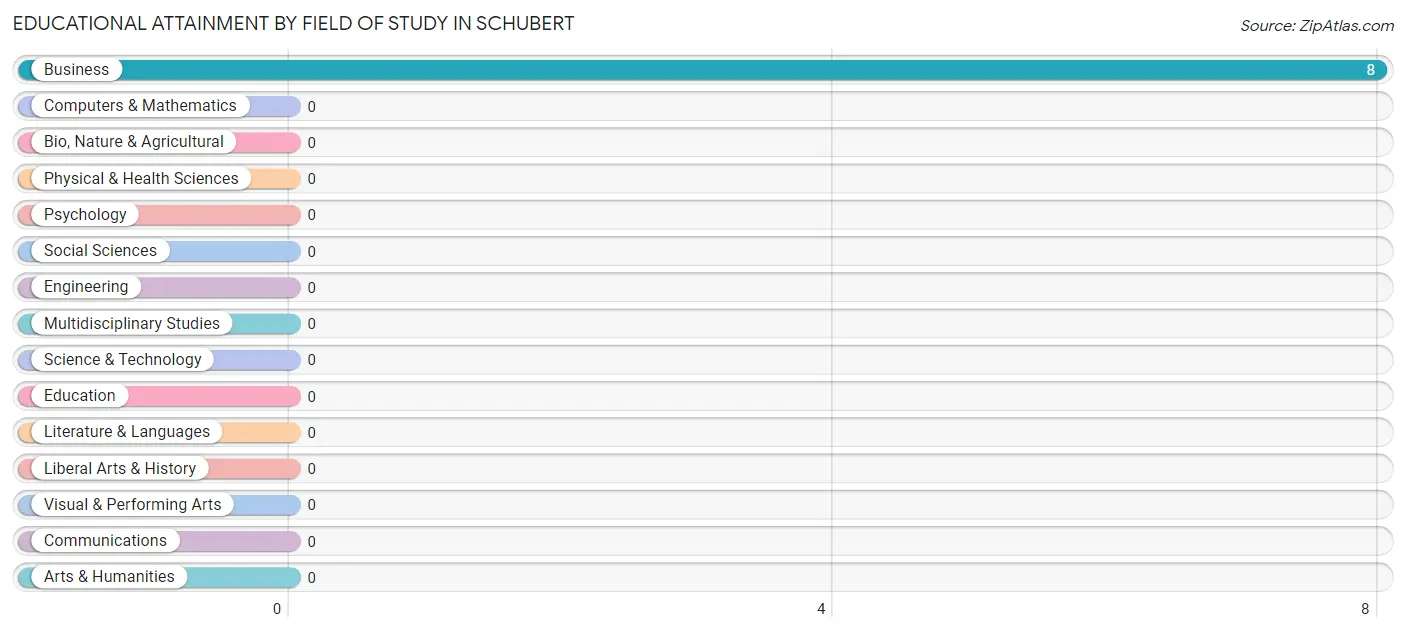
| Field of Study | # Graduates | % Graduates |
| Computers & Mathematics | 0 | 0.0% |
| Bio, Nature & Agricultural | 0 | 0.0% |
| Physical & Health Sciences | 0 | 0.0% |
| Psychology | 0 | 0.0% |
| Social Sciences | 0 | 0.0% |
| Engineering | 0 | 0.0% |
| Multidisciplinary Studies | 0 | 0.0% |
| Science & Technology | 0 | 0.0% |
| Business | 8 | 100.0% |
| Education | 0 | 0.0% |
| Literature & Languages | 0 | 0.0% |
| Liberal Arts & History | 0 | 0.0% |
| Visual & Performing Arts | 0 | 0.0% |
| Communications | 0 | 0.0% |
| Arts & Humanities | 0 | 0.0% |
| Total | 8 | 100.0% |
Transportation & Commute in Schubert
Vehicle Availability by Sex in Schubert
The most prevalent vehicle ownership categories in Schubert are males with 4 vehicles (41, accounting for 100.0%) and females with 4 vehicles (31, making up 132.3%).
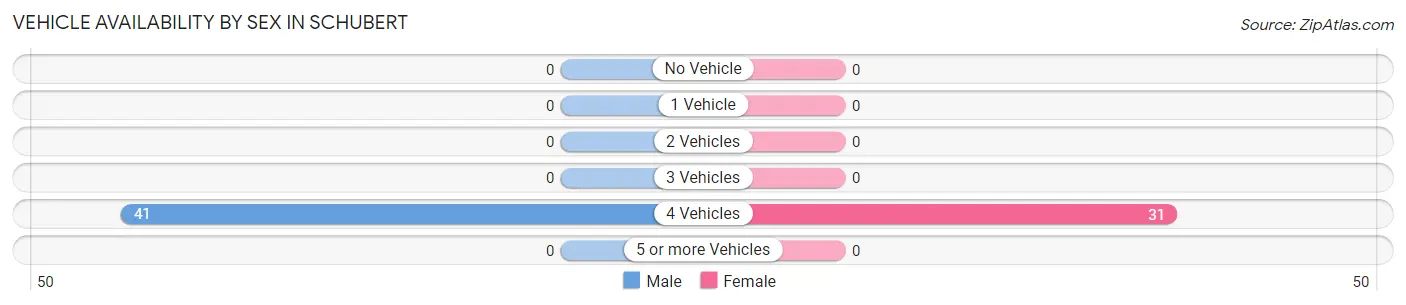
| Vehicles Available | Male | Female |
| No Vehicle | 0 (0.0%) | 0 (0.0%) |
| 1 Vehicle | 0 (0.0%) | 0 (0.0%) |
| 2 Vehicles | 0 (0.0%) | 0 (0.0%) |
| 3 Vehicles | 0 (0.0%) | 0 (0.0%) |
| 4 Vehicles | 41 (100.0%) | 31 (100.0%) |
| 5 or more Vehicles | 0 (0.0%) | 0 (0.0%) |
| Total | 41 (100.0%) | 31 (100.0%) |
Commute Time in Schubert
The most frequently occuring commute durations in Schubert are 15 to 19 minutes (11 commuters, 15.3%), 20 to 24 minutes (11 commuters, 15.3%), and 25 to 29 minutes (11 commuters, 15.3%).
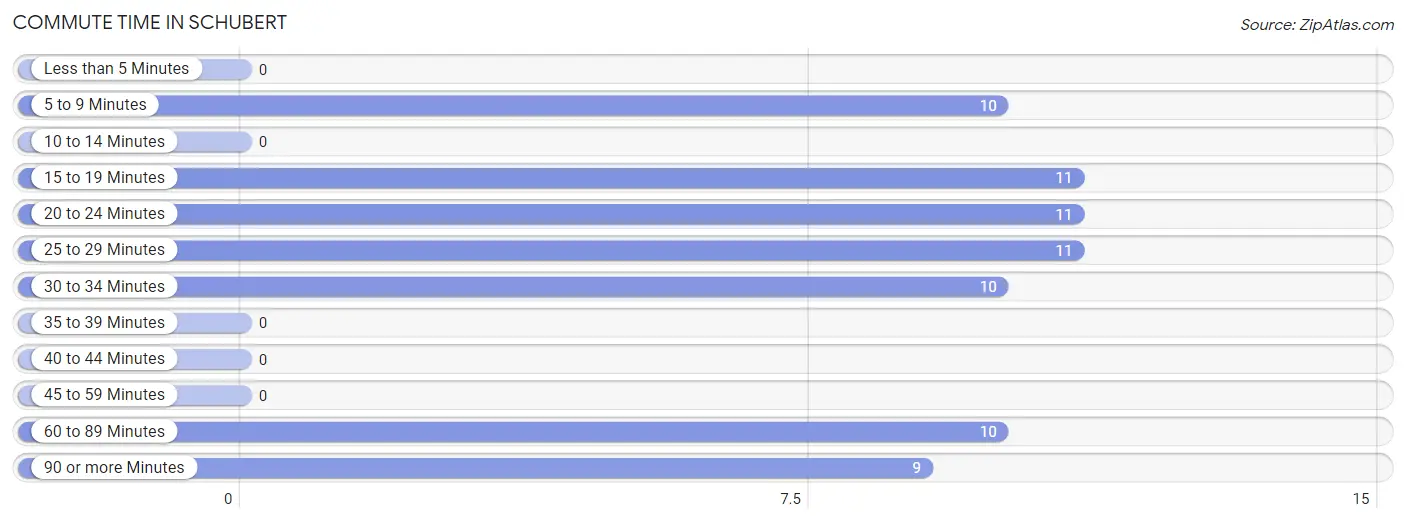
| Commute Time | # Commuters | % Commuters |
| Less than 5 Minutes | 0 | 0.0% |
| 5 to 9 Minutes | 10 | 13.9% |
| 10 to 14 Minutes | 0 | 0.0% |
| 15 to 19 Minutes | 11 | 15.3% |
| 20 to 24 Minutes | 11 | 15.3% |
| 25 to 29 Minutes | 11 | 15.3% |
| 30 to 34 Minutes | 10 | 13.9% |
| 35 to 39 Minutes | 0 | 0.0% |
| 40 to 44 Minutes | 0 | 0.0% |
| 45 to 59 Minutes | 0 | 0.0% |
| 60 to 89 Minutes | 10 | 13.9% |
| 90 or more Minutes | 9 | 12.5% |
Commute Time by Sex in Schubert
The most common commute times in Schubert are 15 to 19 minutes (11 commuters, 26.8%) for males and 25 to 29 minutes (11 commuters, 35.5%) for females.
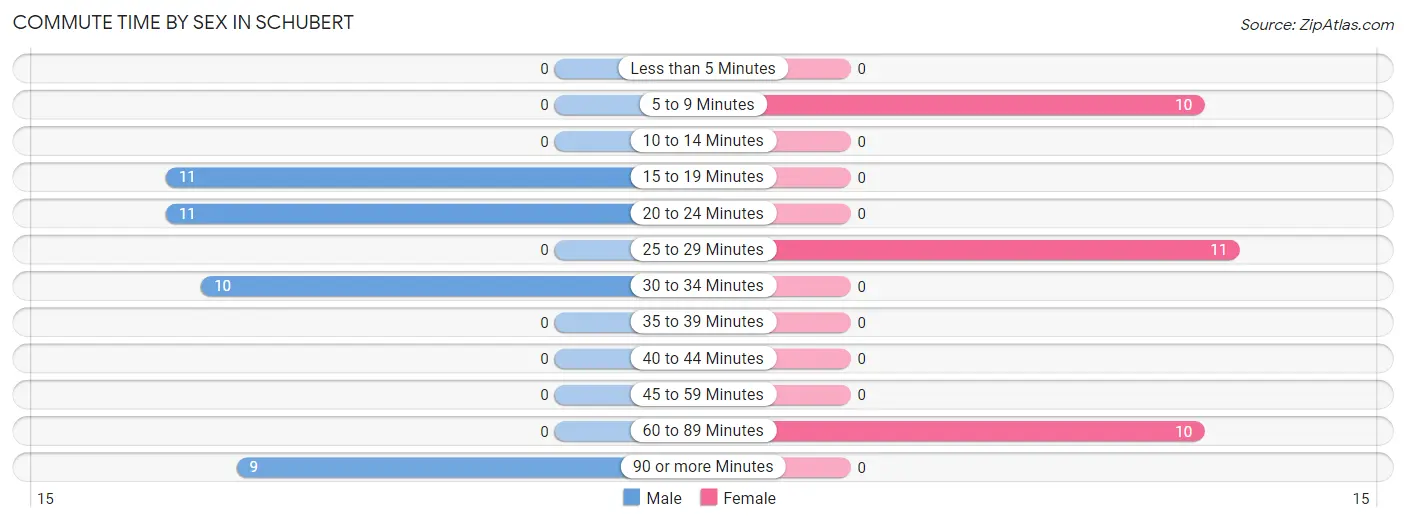
| Commute Time | Male | Female |
| Less than 5 Minutes | 0 (0.0%) | 0 (0.0%) |
| 5 to 9 Minutes | 0 (0.0%) | 10 (32.3%) |
| 10 to 14 Minutes | 0 (0.0%) | 0 (0.0%) |
| 15 to 19 Minutes | 11 (26.8%) | 0 (0.0%) |
| 20 to 24 Minutes | 11 (26.8%) | 0 (0.0%) |
| 25 to 29 Minutes | 0 (0.0%) | 11 (35.5%) |
| 30 to 34 Minutes | 10 (24.4%) | 0 (0.0%) |
| 35 to 39 Minutes | 0 (0.0%) | 0 (0.0%) |
| 40 to 44 Minutes | 0 (0.0%) | 0 (0.0%) |
| 45 to 59 Minutes | 0 (0.0%) | 0 (0.0%) |
| 60 to 89 Minutes | 0 (0.0%) | 10 (32.3%) |
| 90 or more Minutes | 9 (22.0%) | 0 (0.0%) |
Time of Departure to Work by Sex in Schubert
The most frequent times of departure to work in Schubert are 5:00 AM to 5:29 AM (11, 26.8%) for males and 6:30 AM to 6:59 AM (11, 35.5%) for females.
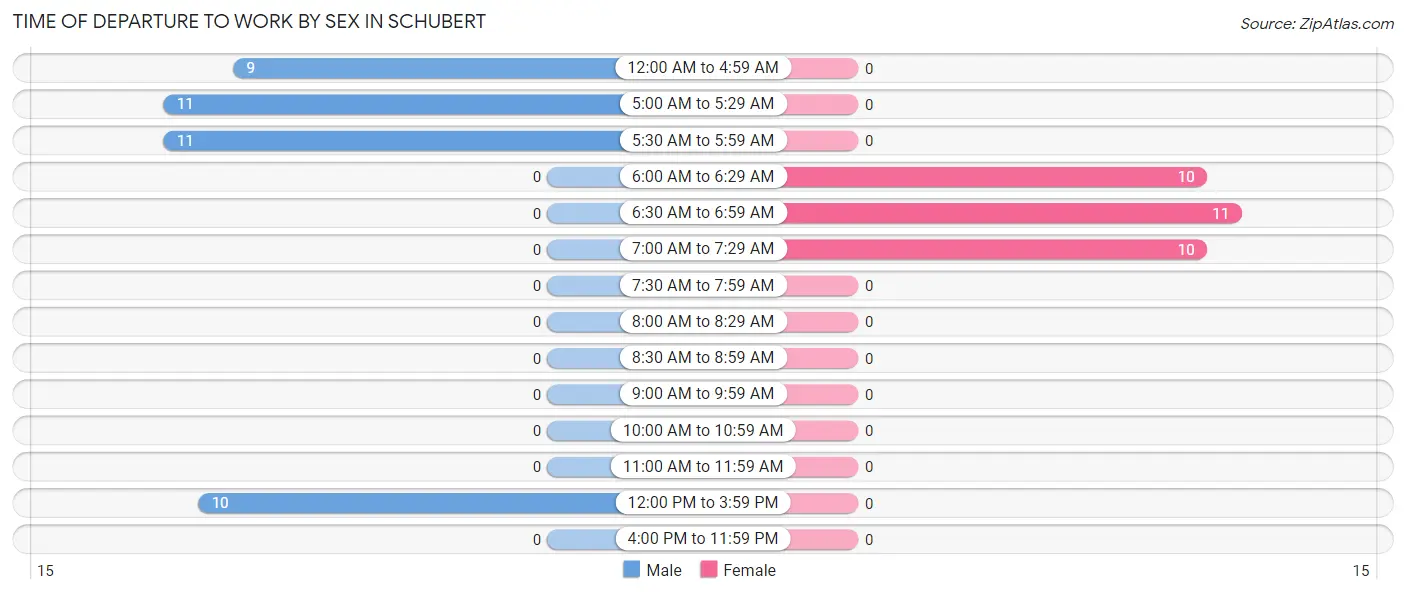
| Time of Departure | Male | Female |
| 12:00 AM to 4:59 AM | 9 (22.0%) | 0 (0.0%) |
| 5:00 AM to 5:29 AM | 11 (26.8%) | 0 (0.0%) |
| 5:30 AM to 5:59 AM | 11 (26.8%) | 0 (0.0%) |
| 6:00 AM to 6:29 AM | 0 (0.0%) | 10 (32.3%) |
| 6:30 AM to 6:59 AM | 0 (0.0%) | 11 (35.5%) |
| 7:00 AM to 7:29 AM | 0 (0.0%) | 10 (32.3%) |
| 7:30 AM to 7:59 AM | 0 (0.0%) | 0 (0.0%) |
| 8:00 AM to 8:29 AM | 0 (0.0%) | 0 (0.0%) |
| 8:30 AM to 8:59 AM | 0 (0.0%) | 0 (0.0%) |
| 9:00 AM to 9:59 AM | 0 (0.0%) | 0 (0.0%) |
| 10:00 AM to 10:59 AM | 0 (0.0%) | 0 (0.0%) |
| 11:00 AM to 11:59 AM | 0 (0.0%) | 0 (0.0%) |
| 12:00 PM to 3:59 PM | 10 (24.4%) | 0 (0.0%) |
| 4:00 PM to 11:59 PM | 0 (0.0%) | 0 (0.0%) |
| Total | 41 (100.0%) | 31 (100.0%) |
Housing Occupancy in Schubert
Occupancy by Ownership in Schubert
Of the total 29 dwellings in Schubert, owner-occupied units account for 20 (69.0%), while renter-occupied units make up 9 (31.0%).
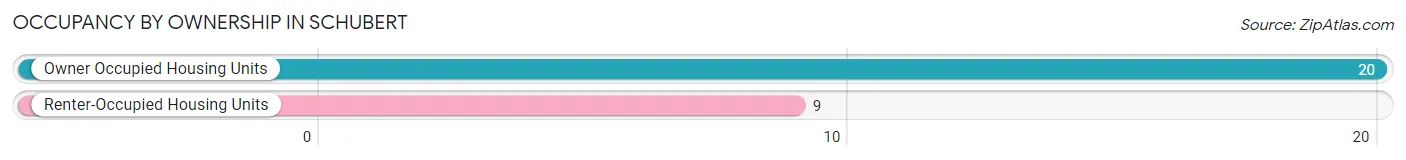
| Occupancy | # Housing Units | % Housing Units |
| Owner Occupied Housing Units | 20 | 69.0% |
| Renter-Occupied Housing Units | 9 | 31.0% |
| Total Occupied Housing Units | 29 | 100.0% |
Occupancy by Household Size in Schubert
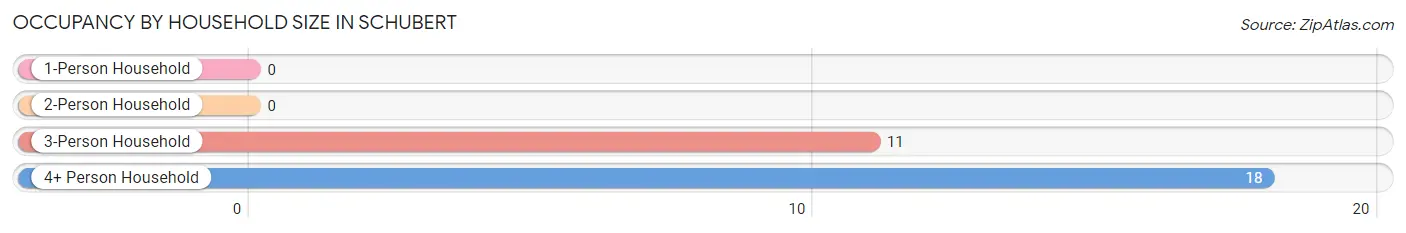
| Household Size | # Housing Units | % Housing Units |
| 1-Person Household | 0 | 0.0% |
| 2-Person Household | 0 | 0.0% |
| 3-Person Household | 11 | 37.9% |
| 4+ Person Household | 18 | 62.1% |
| Total Housing Units | 29 | 100.0% |
Occupancy by Ownership by Household Size in Schubert
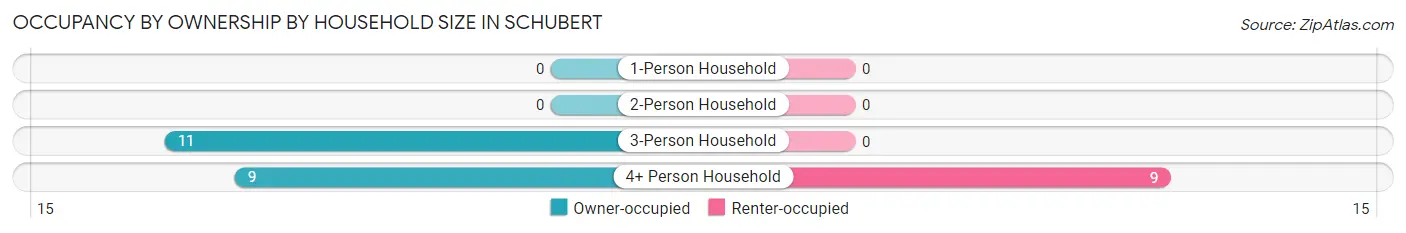
| Household Size | Owner-occupied | Renter-occupied |
| 1-Person Household | 0 (0.0%) | 0 (0.0%) |
| 2-Person Household | 0 (0.0%) | 0 (0.0%) |
| 3-Person Household | 11 (100.0%) | 0 (0.0%) |
| 4+ Person Household | 9 (50.0%) | 9 (50.0%) |
| Total Housing Units | 20 (69.0%) | 9 (31.0%) |
Occupancy by Educational Attainment in Schubert
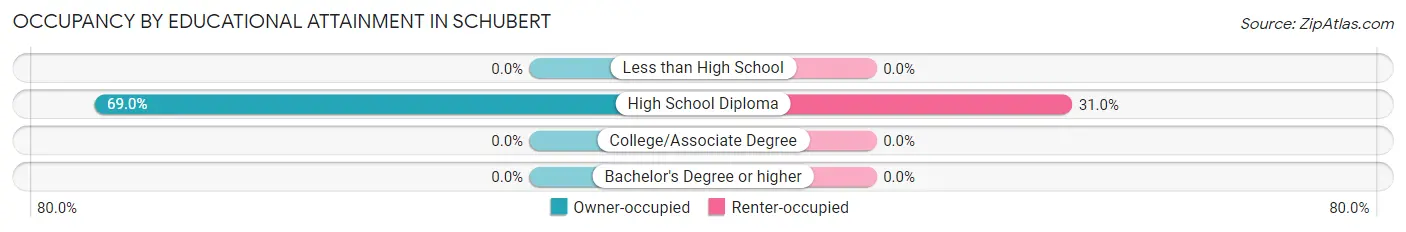
| Household Size | Owner-occupied | Renter-occupied |
| Less than High School | 0 (0.0%) | 0 (0.0%) |
| High School Diploma | 20 (69.0%) | 9 (31.0%) |
| College/Associate Degree | 0 (0.0%) | 0 (0.0%) |
| Bachelor's Degree or higher | 0 (0.0%) | 0 (0.0%) |
Occupancy by Age of Householder in Schubert
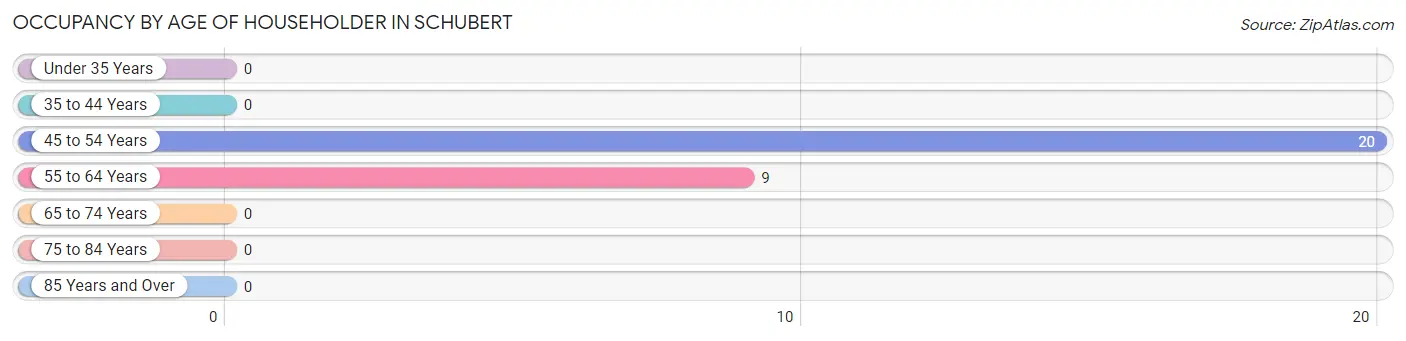
| Age Bracket | # Households | % Households |
| Under 35 Years | 0 | 0.0% |
| 35 to 44 Years | 0 | 0.0% |
| 45 to 54 Years | 20 | 69.0% |
| 55 to 64 Years | 9 | 31.0% |
| 65 to 74 Years | 0 | 0.0% |
| 75 to 84 Years | 0 | 0.0% |
| 85 Years and Over | 0 | 0.0% |
| Total | 29 | 100.0% |
Housing Finances in Schubert
Median Income by Occupancy in Schubert
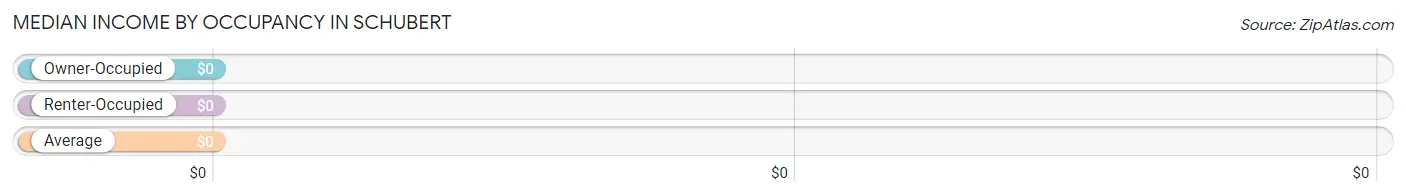
| Occupancy Type | # Households | Median Income |
| Owner-Occupied | 20 (69.0%) | $0 |
| Renter-Occupied | 9 (31.0%) | $0 |
| Average | 29 (100.0%) | $0 |
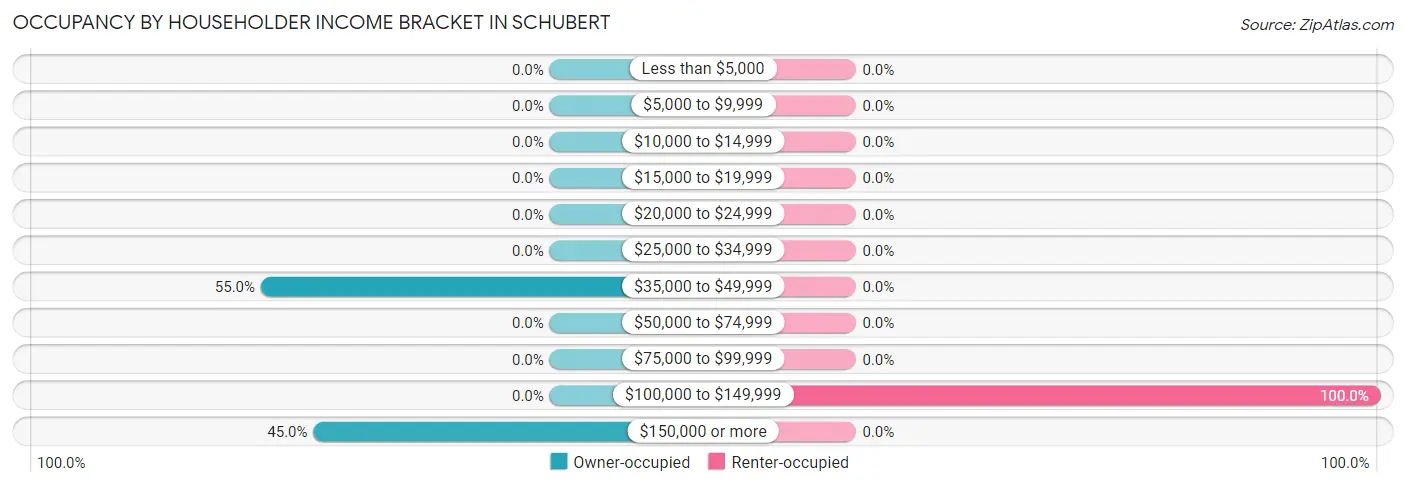
Occupancy by Householder Income Bracket in Schubert
| Income Bracket | Owner-occupied | Renter-occupied |
| Less than $5,000 | 0 (0.0%) | 0 (0.0%) |
| $5,000 to $9,999 | 0 (0.0%) | 0 (0.0%) |
| $10,000 to $14,999 | 0 (0.0%) | 0 (0.0%) |
| $15,000 to $19,999 | 0 (0.0%) | 0 (0.0%) |
| $20,000 to $24,999 | 0 (0.0%) | 0 (0.0%) |
| $25,000 to $34,999 | 0 (0.0%) | 0 (0.0%) |
| $35,000 to $49,999 | 11 (55.0%) | 0 (0.0%) |
| $50,000 to $74,999 | 0 (0.0%) | 0 (0.0%) |
| $75,000 to $99,999 | 0 (0.0%) | 0 (0.0%) |
| $100,000 to $149,999 | 0 (0.0%) | 9 (100.0%) |
| $150,000 or more | 9 (45.0%) | 0 (0.0%) |
| Total | 20 (100.0%) | 9 (100.0%) |
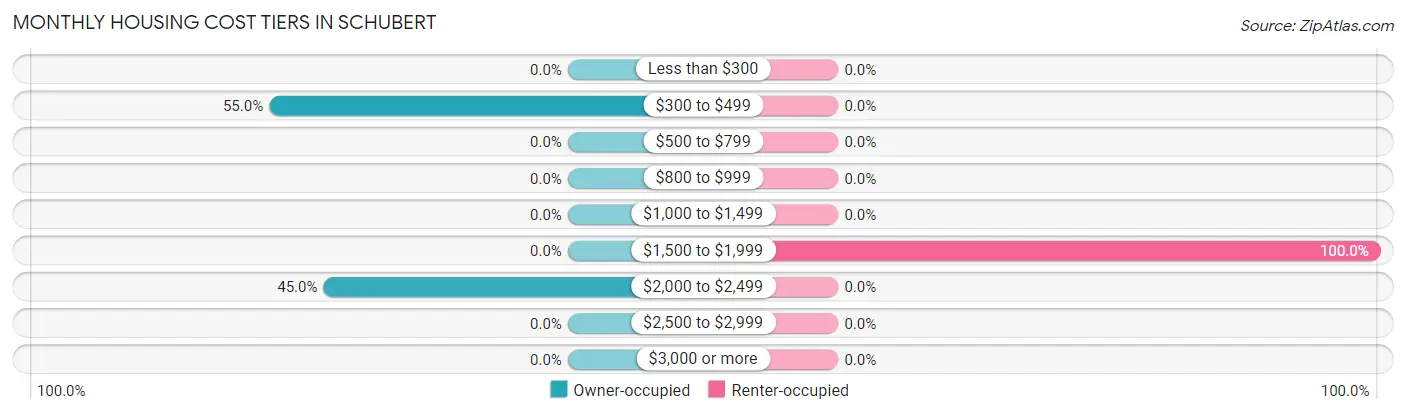
Monthly Housing Cost Tiers in Schubert
| Monthly Cost | Owner-occupied | Renter-occupied |
| Less than $300 | 0 (0.0%) | 0 (0.0%) |
| $300 to $499 | 11 (55.0%) | 0 (0.0%) |
| $500 to $799 | 0 (0.0%) | 0 (0.0%) |
| $800 to $999 | 0 (0.0%) | 0 (0.0%) |
| $1,000 to $1,499 | 0 (0.0%) | 0 (0.0%) |
| $1,500 to $1,999 | 0 (0.0%) | 9 (100.0%) |
| $2,000 to $2,499 | 9 (45.0%) | 0 (0.0%) |
| $2,500 to $2,999 | 0 (0.0%) | 0 (0.0%) |
| $3,000 or more | 0 (0.0%) | 0 (0.0%) |
| Total | 20 (100.0%) | 9 (100.0%) |
Physical Housing Characteristics in Schubert
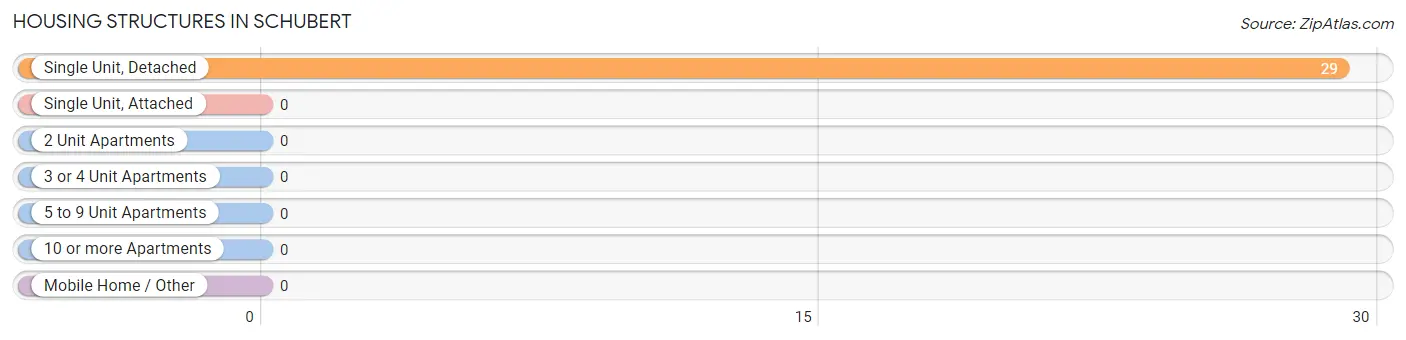
Housing Structures in Schubert
| Structure Type | # Housing Units | % Housing Units |
| Single Unit, Detached | 29 | 100.0% |
| Single Unit, Attached | 0 | 0.0% |
| 2 Unit Apartments | 0 | 0.0% |
| 3 or 4 Unit Apartments | 0 | 0.0% |
| 5 to 9 Unit Apartments | 0 | 0.0% |
| 10 or more Apartments | 0 | 0.0% |
| Mobile Home / Other | 0 | 0.0% |
| Total | 29 | 100.0% |
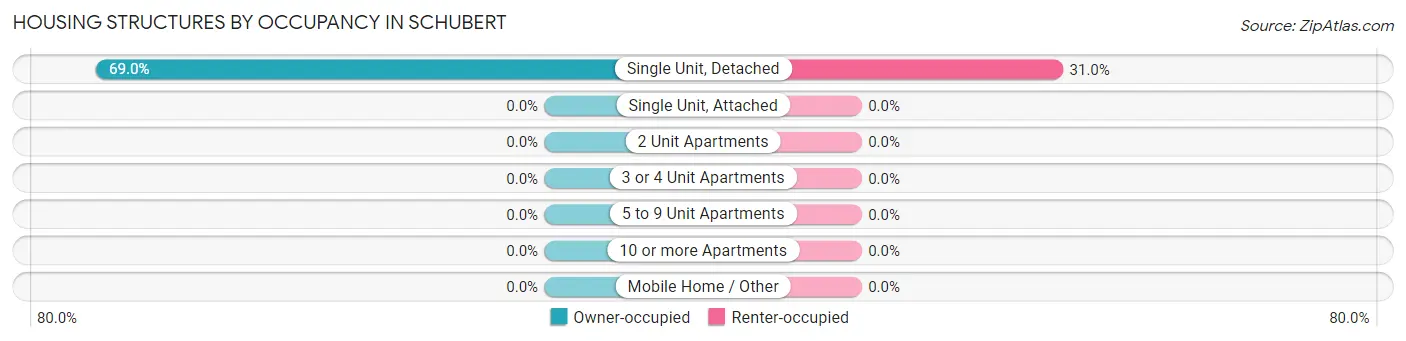
Housing Structures by Occupancy in Schubert
| Structure Type | Owner-occupied | Renter-occupied |
| Single Unit, Detached | 20 (69.0%) | 9 (31.0%) |
| Single Unit, Attached | 0 (0.0%) | 0 (0.0%) |
| 2 Unit Apartments | 0 (0.0%) | 0 (0.0%) |
| 3 or 4 Unit Apartments | 0 (0.0%) | 0 (0.0%) |
| 5 to 9 Unit Apartments | 0 (0.0%) | 0 (0.0%) |
| 10 or more Apartments | 0 (0.0%) | 0 (0.0%) |
| Mobile Home / Other | 0 (0.0%) | 0 (0.0%) |
| Total | 20 (69.0%) | 9 (31.0%) |
Housing Structures by Number of Rooms in Schubert
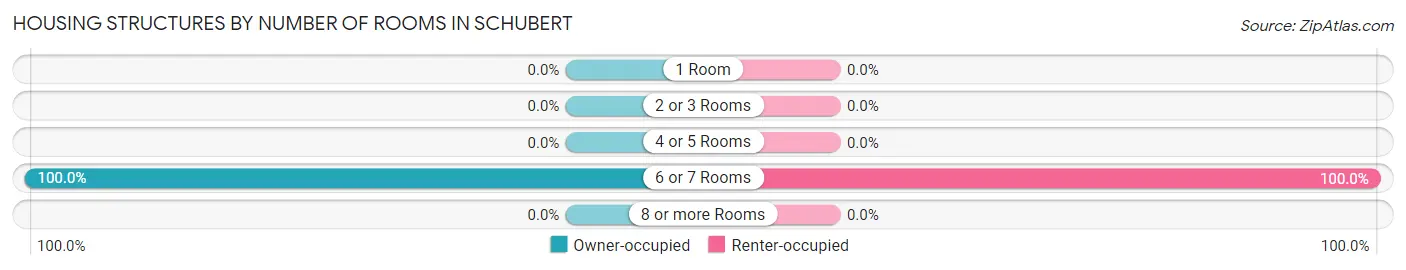
| Number of Rooms | Owner-occupied | Renter-occupied |
| 1 Room | 0 (0.0%) | 0 (0.0%) |
| 2 or 3 Rooms | 0 (0.0%) | 0 (0.0%) |
| 4 or 5 Rooms | 0 (0.0%) | 0 (0.0%) |
| 6 or 7 Rooms | 20 (100.0%) | 9 (100.0%) |
| 8 or more Rooms | 0 (0.0%) | 0 (0.0%) |
| Total | 20 (100.0%) | 9 (100.0%) |
Housing Structure by Heating Type in Schubert
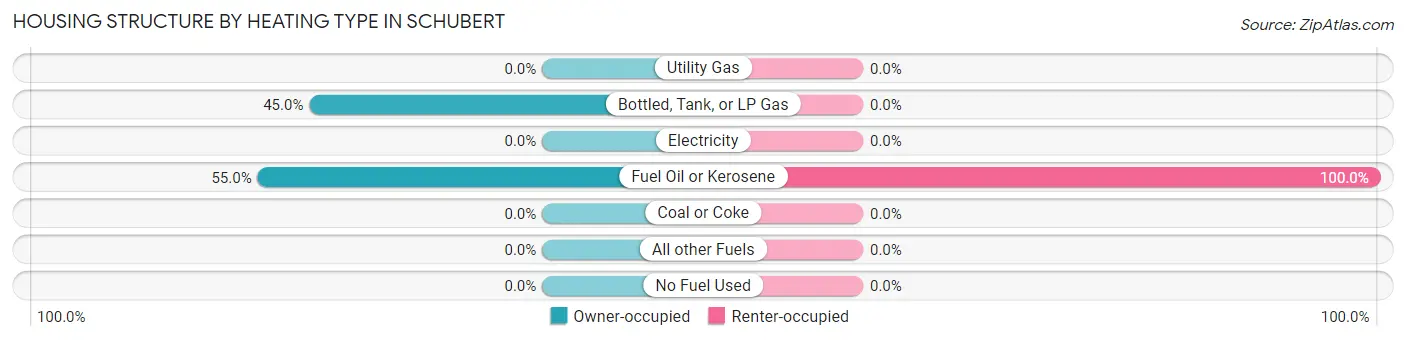
| Heating Type | Owner-occupied | Renter-occupied |
| Utility Gas | 0 (0.0%) | 0 (0.0%) |
| Bottled, Tank, or LP Gas | 9 (45.0%) | 0 (0.0%) |
| Electricity | 0 (0.0%) | 0 (0.0%) |
| Fuel Oil or Kerosene | 11 (55.0%) | 9 (100.0%) |
| Coal or Coke | 0 (0.0%) | 0 (0.0%) |
| All other Fuels | 0 (0.0%) | 0 (0.0%) |
| No Fuel Used | 0 (0.0%) | 0 (0.0%) |
| Total | 20 (100.0%) | 9 (100.0%) |
Household Vehicle Usage in Schubert
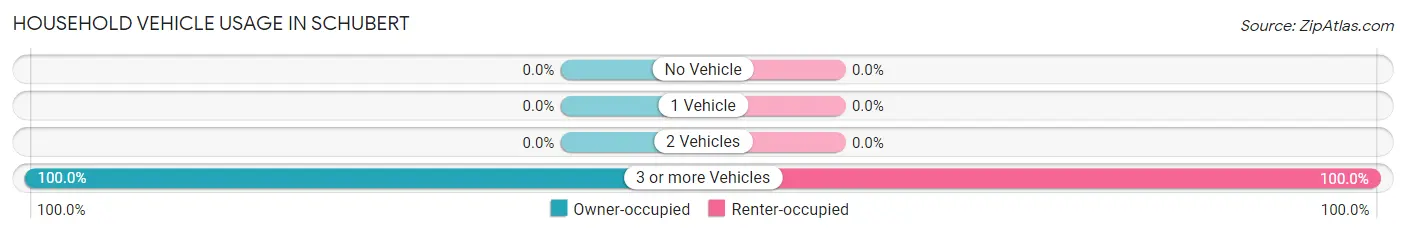
| Vehicles per Household | Owner-occupied | Renter-occupied |
| No Vehicle | 0 (0.0%) | 0 (0.0%) |
| 1 Vehicle | 0 (0.0%) | 0 (0.0%) |
| 2 Vehicles | 0 (0.0%) | 0 (0.0%) |
| 3 or more Vehicles | 20 (100.0%) | 9 (100.0%) |
| Total | 20 (100.0%) | 9 (100.0%) |
Real Estate & Mortgages in Schubert
Real Estate and Mortgage Overview in Schubert
| Characteristic | Without Mortgage | With Mortgage |
| Housing Units | 11 | 9 |
| Median Property Value | - | - |
| Median Household Income | - | - |
| Monthly Housing Costs | - | - |
| Real Estate Taxes | - | - |
Property Value by Mortgage Status in Schubert
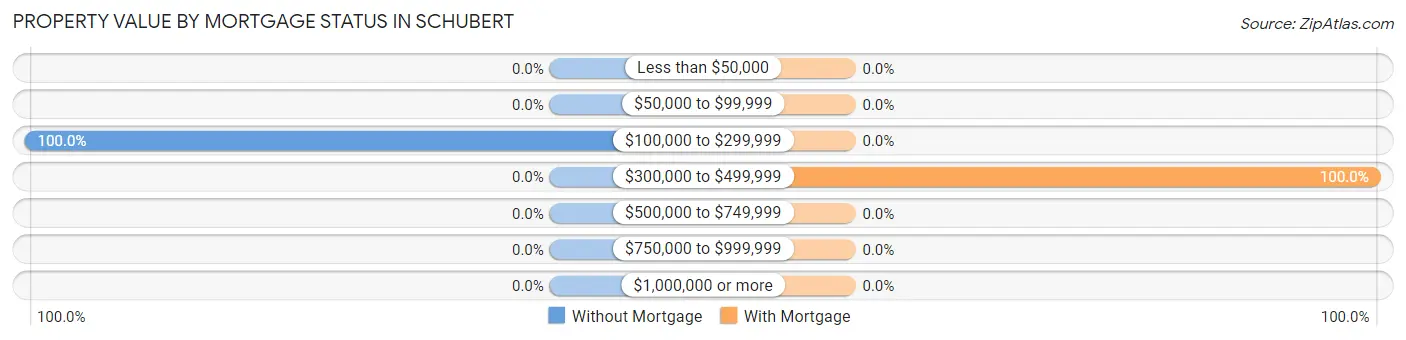
| Property Value | Without Mortgage | With Mortgage |
| Less than $50,000 | 0 (0.0%) | 0 (0.0%) |
| $50,000 to $99,999 | 0 (0.0%) | 0 (0.0%) |
| $100,000 to $299,999 | 11 (100.0%) | 0 (0.0%) |
| $300,000 to $499,999 | 0 (0.0%) | 9 (100.0%) |
| $500,000 to $749,999 | 0 (0.0%) | 0 (0.0%) |
| $750,000 to $999,999 | 0 (0.0%) | 0 (0.0%) |
| $1,000,000 or more | 0 (0.0%) | 0 (0.0%) |
| Total | 11 (100.0%) | 9 (100.0%) |
Household Income by Mortgage Status in Schubert
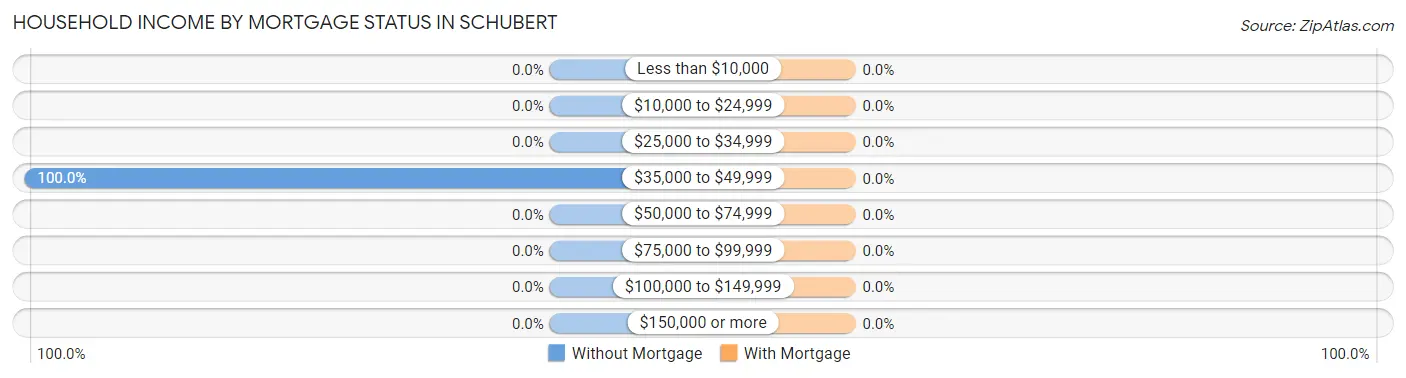
| Household Income | Without Mortgage | With Mortgage |
| Less than $10,000 | 0 (0.0%) | 0 (0.0%) |
| $10,000 to $24,999 | 0 (0.0%) | 0 (0.0%) |
| $25,000 to $34,999 | 0 (0.0%) | 0 (0.0%) |
| $35,000 to $49,999 | 11 (100.0%) | 0 (0.0%) |
| $50,000 to $74,999 | 0 (0.0%) | 0 (0.0%) |
| $75,000 to $99,999 | 0 (0.0%) | 0 (0.0%) |
| $100,000 to $149,999 | 0 (0.0%) | 0 (0.0%) |
| $150,000 or more | 0 (0.0%) | 0 (0.0%) |
| Total | 11 (100.0%) | 9 (100.0%) |
Property Value to Household Income Ratio in Schubert
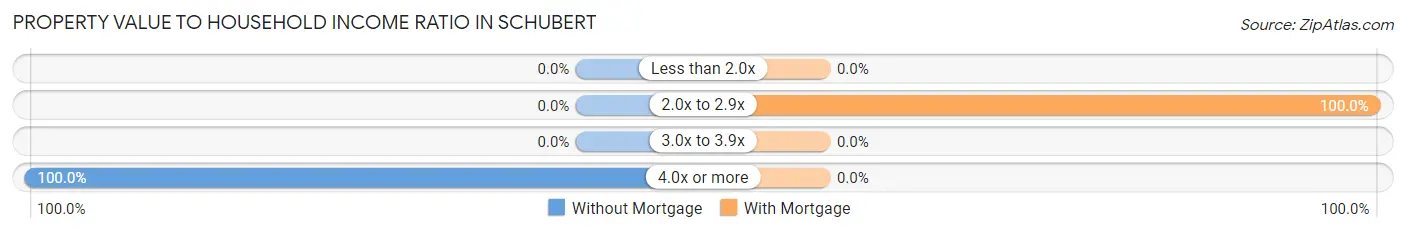
| Value-to-Income Ratio | Without Mortgage | With Mortgage |
| Less than 2.0x | 0 (0.0%) | 0 (0.0%) |
| 2.0x to 2.9x | 0 (0.0%) | 9 (100.0%) |
| 3.0x to 3.9x | 0 (0.0%) | 0 (0.0%) |
| 4.0x or more | 11 (100.0%) | 0 (0.0%) |
| Total | 11 (100.0%) | 9 (100.0%) |
Real Estate Taxes by Mortgage Status in Schubert
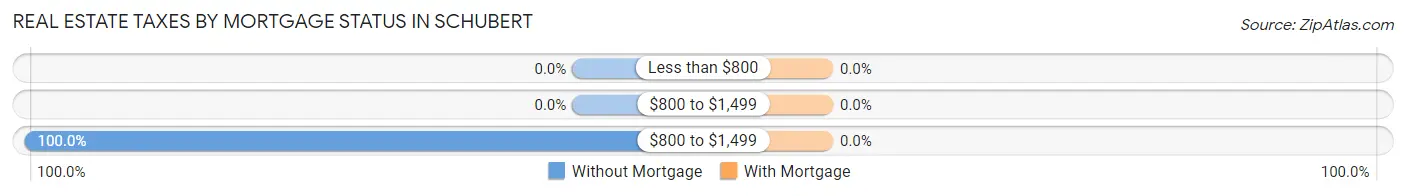
| Property Taxes | Without Mortgage | With Mortgage |
| Less than $800 | 0 (0.0%) | 0 (0.0%) |
| $800 to $1,499 | 0 (0.0%) | 0 (0.0%) |
| $800 to $1,499 | 11 (100.0%) | 0 (0.0%) |
| Total | 11 (100.0%) | 9 (100.0%) |
Health & Disability in Schubert
Health Insurance Coverage by Age in Schubert
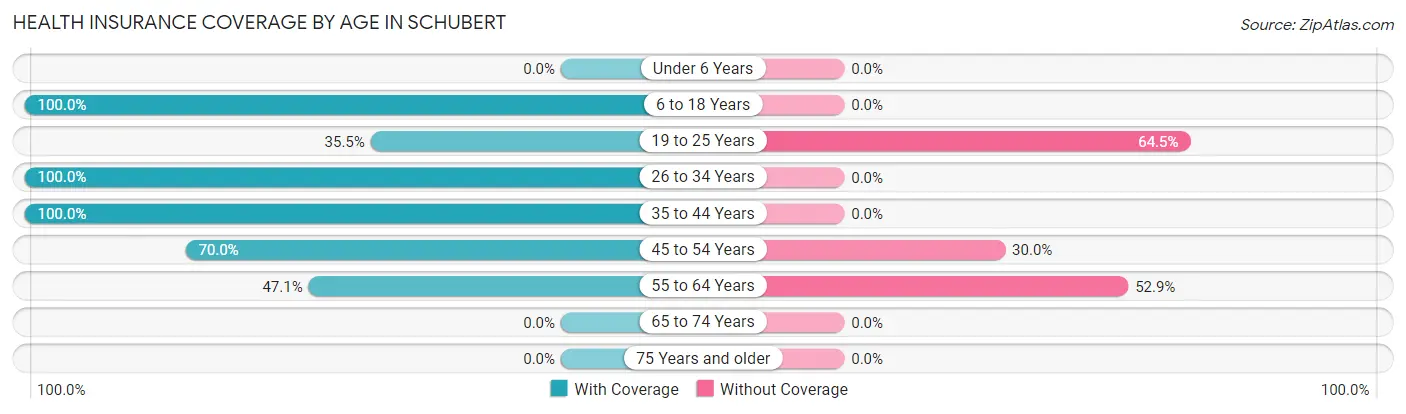
| Age Bracket | With Coverage | Without Coverage |
| Under 6 Years | 0 (0.0%) | 0 (0.0%) |
| 6 to 18 Years | 10 (100.0%) | 0 (0.0%) |
| 19 to 25 Years | 11 (35.5%) | 20 (64.5%) |
| 26 to 34 Years | 11 (100.0%) | 0 (0.0%) |
| 35 to 44 Years | 11 (100.0%) | 0 (0.0%) |
| 45 to 54 Years | 21 (70.0%) | 9 (30.0%) |
| 55 to 64 Years | 8 (47.1%) | 9 (52.9%) |
| 65 to 74 Years | 0 (0.0%) | 0 (0.0%) |
| 75 Years and older | 0 (0.0%) | 0 (0.0%) |
| Total | 72 (65.4%) | 38 (34.5%) |
Health Insurance Coverage by Citizenship Status in Schubert
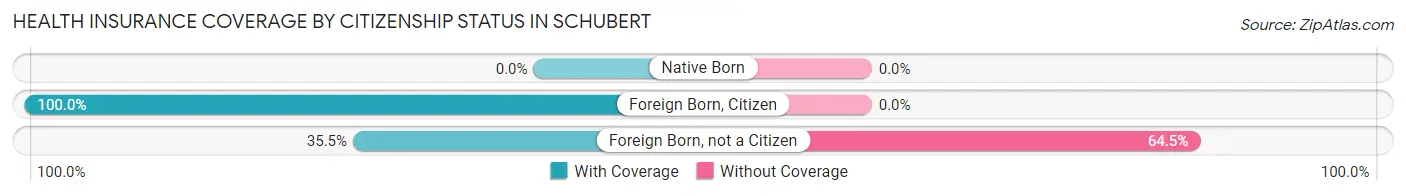
| Citizenship Status | With Coverage | Without Coverage |
| Native Born | 0 (0.0%) | 0 (0.0%) |
| Foreign Born, Citizen | 10 (100.0%) | 0 (0.0%) |
| Foreign Born, not a Citizen | 11 (35.5%) | 20 (64.5%) |
Health Insurance Coverage by Household Income in Schubert
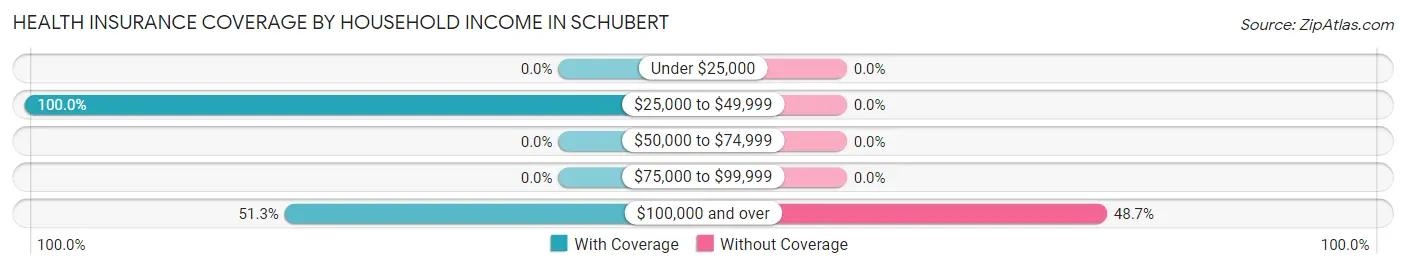
| Household Income | With Coverage | Without Coverage |
| Under $25,000 | 0 (0.0%) | 0 (0.0%) |
| $25,000 to $49,999 | 32 (100.0%) | 0 (0.0%) |
| $50,000 to $74,999 | 0 (0.0%) | 0 (0.0%) |
| $75,000 to $99,999 | 0 (0.0%) | 0 (0.0%) |
| $100,000 and over | 40 (51.3%) | 38 (48.7%) |
Public vs Private Health Insurance Coverage by Age in Schubert
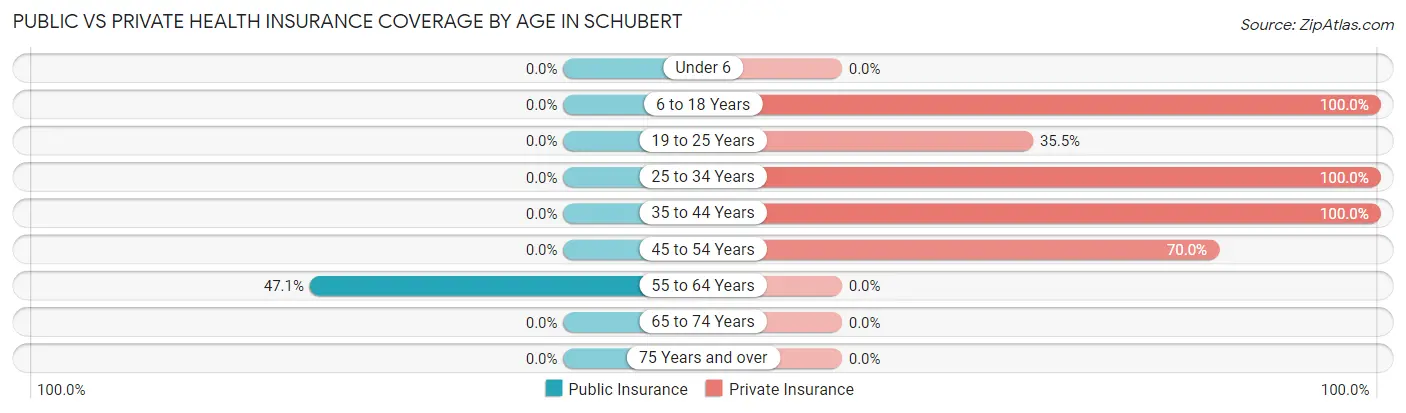
| Age Bracket | Public Insurance | Private Insurance |
| Under 6 | 0 (0.0%) | 0 (0.0%) |
| 6 to 18 Years | 0 (0.0%) | 10 (100.0%) |
| 19 to 25 Years | 0 (0.0%) | 11 (35.5%) |
| 25 to 34 Years | 0 (0.0%) | 11 (100.0%) |
| 35 to 44 Years | 0 (0.0%) | 11 (100.0%) |
| 45 to 54 Years | 0 (0.0%) | 21 (70.0%) |
| 55 to 64 Years | 8 (47.1%) | 0 (0.0%) |
| 65 to 74 Years | 0 (0.0%) | 0 (0.0%) |
| 75 Years and over | 0 (0.0%) | 0 (0.0%) |
| Total | 8 (7.3%) | 64 (58.2%) |
Disability Status by Sex by Age in Schubert
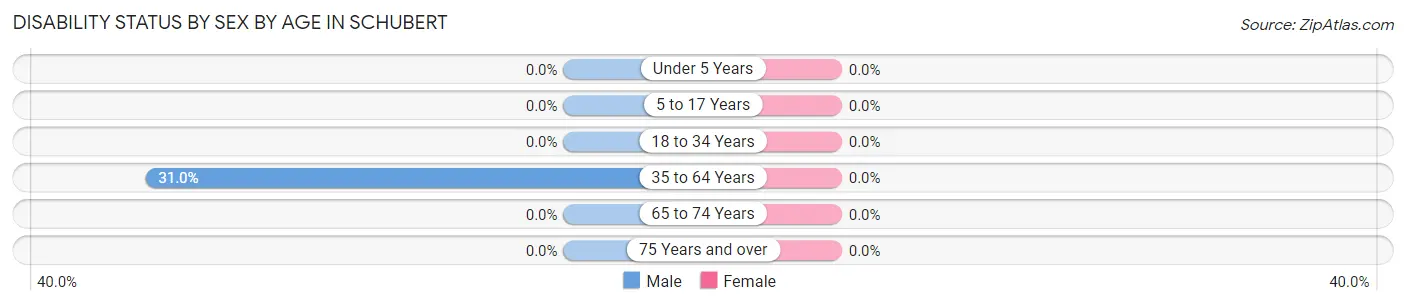
| Age Bracket | Male | Female |
| Under 5 Years | 0 (0.0%) | 0 (0.0%) |
| 5 to 17 Years | 0 (0.0%) | 0 (0.0%) |
| 18 to 34 Years | 0 (0.0%) | 0 (0.0%) |
| 35 to 64 Years | 9 (31.0%) | 0 (0.0%) |
| 65 to 74 Years | 0 (0.0%) | 0 (0.0%) |
| 75 Years and over | 0 (0.0%) | 0 (0.0%) |
Disability Class by Sex by Age in Schubert
Disability Class: Hearing Difficulty
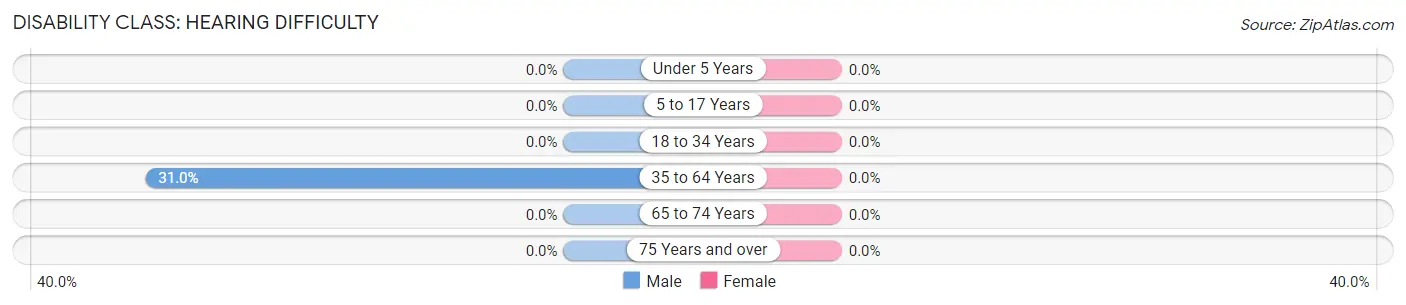
| Age Bracket | Male | Female |
| Under 5 Years | 0 (0.0%) | 0 (0.0%) |
| 5 to 17 Years | 0 (0.0%) | 0 (0.0%) |
| 18 to 34 Years | 0 (0.0%) | 0 (0.0%) |
| 35 to 64 Years | 9 (31.0%) | 0 (0.0%) |
| 65 to 74 Years | 0 (0.0%) | 0 (0.0%) |
| 75 Years and over | 0 (0.0%) | 0 (0.0%) |
Disability Class: Vision Difficulty
| Age Bracket | Male | Female |
| Under 5 Years | 0 (0.0%) | 0 (0.0%) |
| 5 to 17 Years | 0 (0.0%) | 0 (0.0%) |
| 18 to 34 Years | 0 (0.0%) | 0 (0.0%) |
| 35 to 64 Years | 0 (0.0%) | 0 (0.0%) |
| 65 to 74 Years | 0 (0.0%) | 0 (0.0%) |
| 75 Years and over | 0 (0.0%) | 0 (0.0%) |
Disability Class: Cognitive Difficulty
| Age Bracket | Male | Female |
| 5 to 17 Years | 0 (0.0%) | 0 (0.0%) |
| 18 to 34 Years | 0 (0.0%) | 0 (0.0%) |
| 35 to 64 Years | 0 (0.0%) | 0 (0.0%) |
| 65 to 74 Years | 0 (0.0%) | 0 (0.0%) |
| 75 Years and over | 0 (0.0%) | 0 (0.0%) |
Disability Class: Ambulatory Difficulty
| Age Bracket | Male | Female |
| 5 to 17 Years | 0 (0.0%) | 0 (0.0%) |
| 18 to 34 Years | 0 (0.0%) | 0 (0.0%) |
| 35 to 64 Years | 0 (0.0%) | 0 (0.0%) |
| 65 to 74 Years | 0 (0.0%) | 0 (0.0%) |
| 75 Years and over | 0 (0.0%) | 0 (0.0%) |
Disability Class: Self-Care Difficulty

| Age Bracket | Male | Female |
| 5 to 17 Years | 0 (0.0%) | 0 (0.0%) |
| 18 to 34 Years | 0 (0.0%) | 0 (0.0%) |
| 35 to 64 Years | 0 (0.0%) | 0 (0.0%) |
| 65 to 74 Years | 0 (0.0%) | 0 (0.0%) |
| 75 Years and over | 0 (0.0%) | 0 (0.0%) |
Technology Access in Schubert
Computing Device Access in Schubert
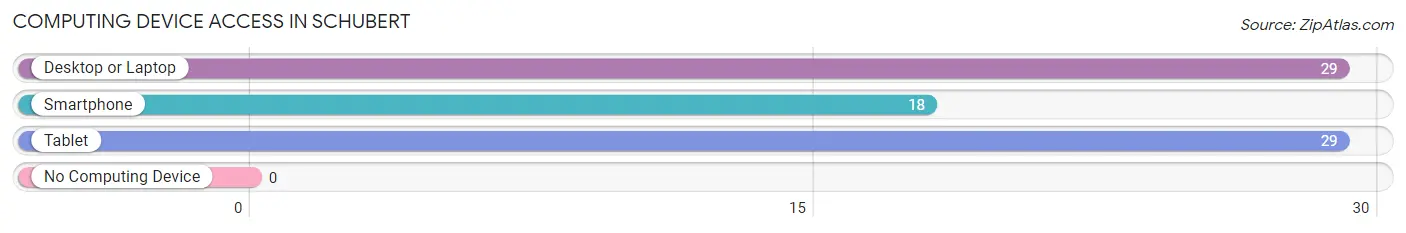
| Device Type | # Households | % Households |
| Desktop or Laptop | 29 | 100.0% |
| Smartphone | 18 | 62.1% |
| Tablet | 29 | 100.0% |
| No Computing Device | 0 | 0.0% |
| Total | 29 | 100.0% |
Internet Access in Schubert
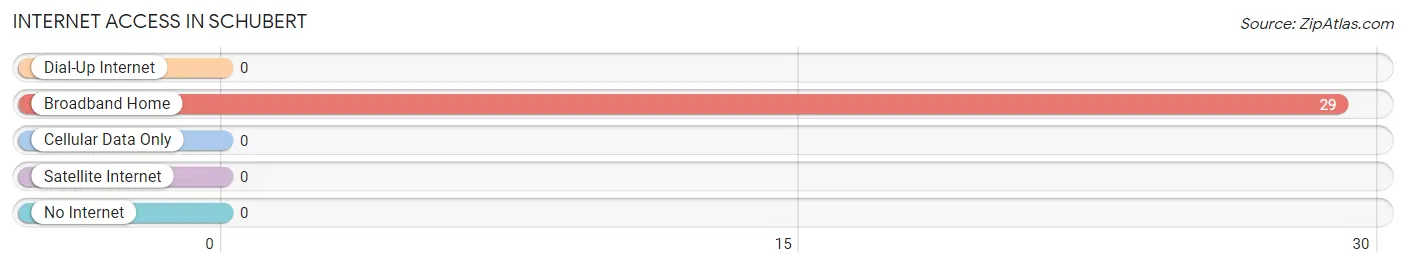
| Internet Type | # Households | % Households |
| Dial-Up Internet | 0 | 0.0% |
| Broadband Home | 29 | 100.0% |
| Cellular Data Only | 0 | 0.0% |
| Satellite Internet | 0 | 0.0% |
| No Internet | 0 | 0.0% |
| Total | 29 | 100.0% |
Schubert Summary
Schubert is a small town located in the state of Pennsylvania in the United States. It is situated in the southeastern corner of the state, near the border with Maryland and West Virginia. The town has a population of approximately 1,500 people and is part of the greater Philadelphia metropolitan area.
Geography
Schubert is located in the southeastern corner of Pennsylvania, near the border with Maryland and West Virginia. The town is situated in a rural area, surrounded by rolling hills and farmland. The town is located in the Appalachian Mountains, and the terrain is mostly hilly and wooded. The town is located in the Susquehanna River Valley, and the river is a major source of water for the area.
The climate in Schubert is temperate, with hot summers and cold winters. The average temperature in the summer is around 75 degrees Fahrenheit, and the average temperature in the winter is around 35 degrees Fahrenheit. The town receives an average of 40 inches of precipitation per year, with most of it falling in the form of snow in the winter months.
Economy
The economy of Schubert is largely based on agriculture and tourism. The town is home to several farms, which produce a variety of crops, including corn, soybeans, wheat, and hay. The town also has several small businesses, including restaurants, shops, and a few small manufacturing companies.
Tourism is an important part of the economy in Schubert. The town is home to several historic sites, including the Schubert House, which was built in 1790 and is listed on the National Register of Historic Places. The town also has several parks and recreational areas, including the Schubert Park, which offers hiking, biking, and fishing.
Demographics
As of the 2010 census, the population of Schubert was 1,500 people. The town is predominantly white, with about 95% of the population being Caucasian. The remaining 5% of the population is made up of African Americans, Hispanics, and other ethnicities. The median household income in Schubert is $45,000, and the median age is 40 years old.
The town is served by the Schubert School District, which includes two elementary schools, one middle school, and one high school. The town also has several churches, including the Schubert United Methodist Church and the Schubert Presbyterian Church.
Conclusion
Schubert is a small town located in the southeastern corner of Pennsylvania. The town has a population of approximately 1,500 people and is part of the greater Philadelphia metropolitan area. The economy of Schubert is largely based on agriculture and tourism, and the town is home to several historic sites and recreational areas. The population of Schubert is predominantly white, with a median household income of $45,000 and a median age of 40 years old. The town is served by the Schubert School District and has several churches.
Common Questions
What is Per Capita Income in Schubert?
Per Capita income in Schubert is $31,520.
What is Income or Wage Gap in Schubert?
Income or Wage Gap in Schubert is 34.8%.
Women in Schubert earn 65.2 cents for every dollar earned by a man.
What is Inequality or Gini Index in Schubert?
Inequality or Gini Index in Schubert is 0.28.
What is the Total Population of Schubert?
Total Population of Schubert is 110.
What is the Total Male Population of Schubert?
Total Male Population of Schubert is 50.
What is the Total Female Population of Schubert?
Total Female Population of Schubert is 60.
What is the Ratio of Males per 100 Females in Schubert?
There are 83.33 Males per 100 Females in Schubert.
What is the Ratio of Females per 100 Males in Schubert?
There are 120.00 Females per 100 Males in Schubert.
What is the Median Population Age in Schubert?
Median Population Age in Schubert is 43.3 Years.
What is the Average Family Size in Schubert
Average Family Size in Schubert is 3.1 People.
What is the Average Household Size in Schubert
Average Household Size in Schubert is 3.8 People.
How Large is the Labor Force in Schubert?
There are 92 People in the Labor Forcein in Schubert.
What is the Percentage of People in the Labor Force in Schubert?
92.0% of People are in the Labor Force in Schubert.
What is the Unemployment Rate in Schubert?
Unemployment Rate in Schubert is 12.0%.