Cities with the Highest Percentage of Population Employed in Production in Alabama
RELATED REPORTS & OPTIONS
Production
Alabama
Compare Cities
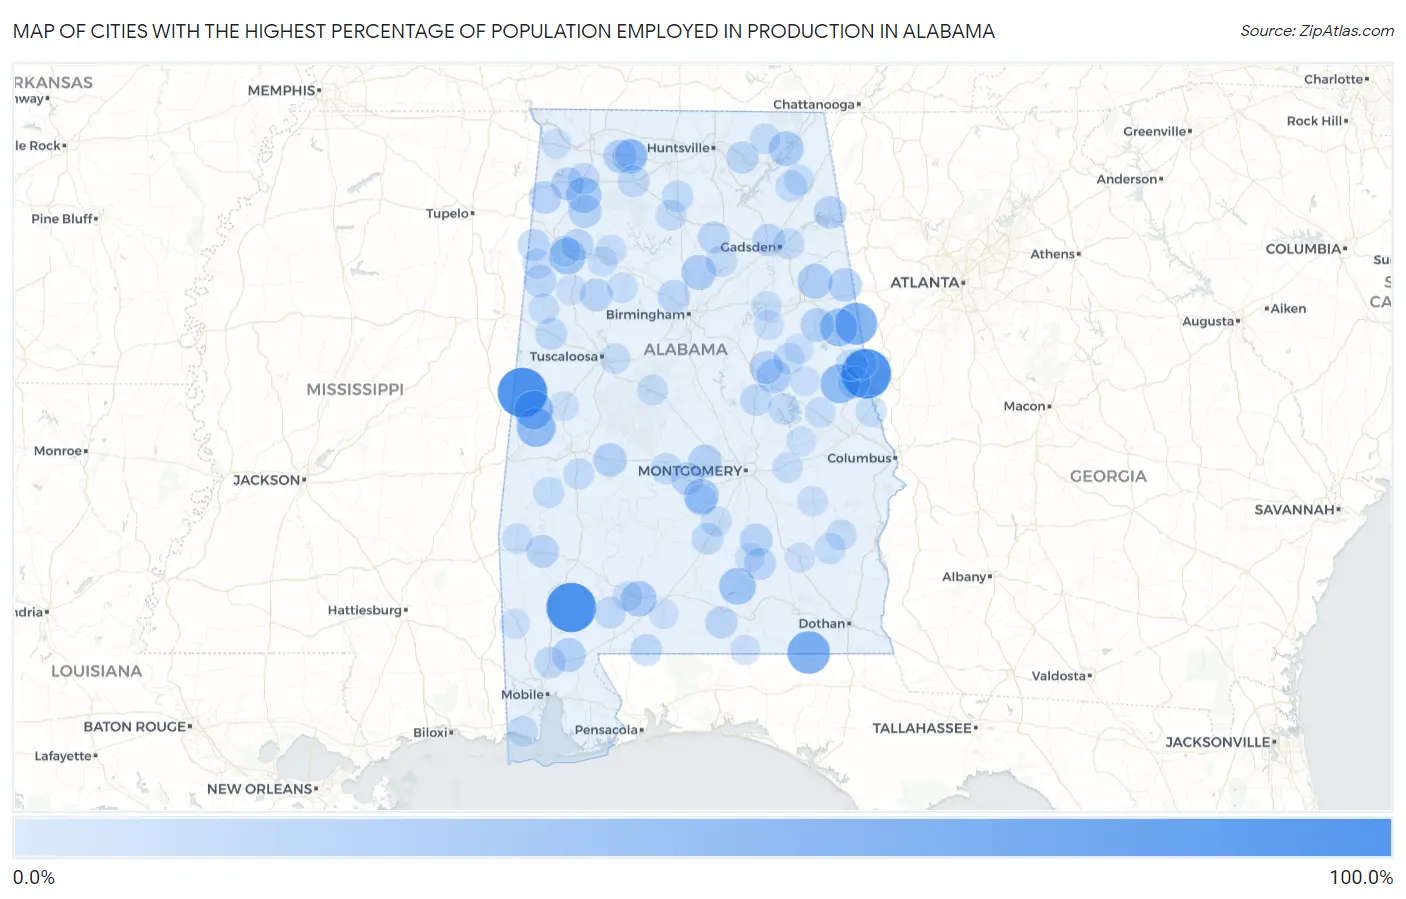
Map of Cities with the Highest Percentage of Population Employed in Production in Alabama
0.0%
100.0%
Cities with the Highest Percentage of Population Employed in Production in Alabama
| City | % Employed | vs State | vs National | |
| 1. | Panola | 100.0% | 8.6%(+91.4)#1 | 5.5%(+94.5)#14 |
| 2. | Standing Rock | 100.0% | 8.6%(+91.4)#2 | 5.5%(+94.5)#20 |
| 3. | Carlton | 100.0% | 8.6%(+91.4)#3 | 5.5%(+94.5)#23 |
| 4. | Black | 70.2% | 8.6%(+61.6)#4 | 5.5%(+64.8)#77 |
| 5. | Graham | 67.9% | 8.6%(+59.3)#5 | 5.5%(+62.4)#83 |
| 6. | Penton | 55.6% | 8.6%(+47.0)#6 | 5.5%(+50.1)#152 |
| 7. | Epes | 53.9% | 8.6%(+45.3)#7 | 5.5%(+48.5)#169 |
| 8. | Gainesville | 53.5% | 8.6%(+44.9)#8 | 5.5%(+48.1)#173 |
| 9. | Morrison Crossroads | 49.5% | 8.6%(+40.9)#9 | 5.5%(+44.0)#214 |
| 10. | Dozier | 46.2% | 8.6%(+37.6)#10 | 5.5%(+40.7)#252 |
| 11. | Gu Win | 45.1% | 8.6%(+36.5)#11 | 5.5%(+39.6)#265 |
| 12. | Repton | 40.8% | 8.6%(+32.2)#12 | 5.5%(+35.3)#341 |
| 13. | Spruce Pine | 40.6% | 8.6%(+32.0)#13 | 5.5%(+35.2)#345 |
| 14. | Mosses | 39.1% | 8.6%(+30.5)#14 | 5.5%(+33.6)#383 |
| 15. | White Plains | 38.0% | 8.6%(+29.4)#15 | 5.5%(+32.5)#408 |
| 16. | Hollywood | 37.9% | 8.6%(+29.3)#16 | 5.5%(+32.4)#416 |
| 17. | County Line | 37.9% | 8.6%(+29.3)#17 | 5.5%(+32.4)#418 |
| 18. | Courtland | 37.3% | 8.6%(+28.7)#18 | 5.5%(+31.8)#432 |
| 19. | Goodwater | 35.5% | 8.6%(+26.9)#19 | 5.5%(+30.1)#482 |
| 20. | Delta | 33.9% | 8.6%(+25.3)#20 | 5.5%(+28.4)#544 |
| 21. | Fruithurst | 33.3% | 8.6%(+24.7)#21 | 5.5%(+27.9)#563 |
| 22. | Stockton | 33.2% | 8.6%(+24.6)#22 | 5.5%(+27.7)#589 |
| 23. | Uniontown | 32.4% | 8.6%(+23.8)#23 | 5.5%(+26.9)#624 |
| 24. | Autaugaville | 31.6% | 8.6%(+23.0)#24 | 5.5%(+26.2)#662 |
| 25. | Town Creek | 31.6% | 8.6%(+23.0)#25 | 5.5%(+26.1)#666 |
| 26. | Bear Creek | 31.3% | 8.6%(+22.7)#26 | 5.5%(+25.8)#690 |
| 27. | Hollins | 30.9% | 8.6%(+22.3)#27 | 5.5%(+25.4)#716 |
| 28. | Belgreen | 30.0% | 8.6%(+21.4)#28 | 5.5%(+24.5)#766 |
| 29. | Berry | 29.9% | 8.6%(+21.3)#29 | 5.5%(+24.4)#777 |
| 30. | Coffeeville | 29.7% | 8.6%(+21.1)#30 | 5.5%(+24.3)#784 |
| 31. | Benton | 29.4% | 8.6%(+20.8)#31 | 5.5%(+23.9)#812 |
| 32. | Vina | 29.2% | 8.6%(+20.6)#32 | 5.5%(+23.7)#826 |
| 33. | Gaylesville | 29.0% | 8.6%(+20.4)#33 | 5.5%(+23.6)#836 |
| 34. | Petrey | 29.0% | 8.6%(+20.4)#34 | 5.5%(+23.6)#838 |
| 35. | Five Points | 28.6% | 8.6%(+20.0)#35 | 5.5%(+23.1)#873 |
| 36. | Cardiff | 28.6% | 8.6%(+20.0)#36 | 5.5%(+23.1)#882 |
| 37. | Vernon | 28.5% | 8.6%(+19.9)#37 | 5.5%(+23.1)#886 |
| 38. | Ridgeville | 28.3% | 8.6%(+19.7)#38 | 5.5%(+22.9)#902 |
| 39. | Glenwood | 27.5% | 8.6%(+18.9)#39 | 5.5%(+22.0)#978 |
| 40. | Carolina | 27.3% | 8.6%(+18.7)#40 | 5.5%(+21.8)#1,000 |
| 41. | Detroit | 27.2% | 8.6%(+18.6)#41 | 5.5%(+21.7)#1,012 |
| 42. | Paint Rock | 27.1% | 8.6%(+18.5)#42 | 5.5%(+21.6)#1,022 |
| 43. | Equality | 26.8% | 8.6%(+18.2)#43 | 5.5%(+21.4)#1,045 |
| 44. | Brilliant | 26.3% | 8.6%(+17.7)#44 | 5.5%(+20.8)#1,094 |
| 45. | Blountsville | 26.2% | 8.6%(+17.6)#45 | 5.5%(+20.8)#1,108 |
| 46. | Russellville | 26.1% | 8.6%(+17.5)#46 | 5.5%(+20.6)#1,117 |
| 47. | North Courtland | 26.1% | 8.6%(+17.5)#47 | 5.5%(+20.6)#1,119 |
| 48. | Pollard | 26.1% | 8.6%(+17.5)#48 | 5.5%(+20.6)#1,124 |
| 49. | Uriah | 26.1% | 8.6%(+17.5)#49 | 5.5%(+20.6)#1,128 |
| 50. | Reform | 26.0% | 8.6%(+17.4)#50 | 5.5%(+20.5)#1,135 |
| 51. | Greenville | 25.8% | 8.6%(+17.2)#51 | 5.5%(+20.3)#1,165 |
| 52. | Moulton | 25.4% | 8.6%(+16.8)#52 | 5.5%(+19.9)#1,209 |
| 53. | Rockford | 25.1% | 8.6%(+16.5)#53 | 5.5%(+19.7)#1,242 |
| 54. | Axis | 25.0% | 8.6%(+16.4)#54 | 5.5%(+19.5)#1,255 |
| 55. | Falkville | 24.8% | 8.6%(+16.2)#55 | 5.5%(+19.3)#1,306 |
| 56. | Millerville | 24.7% | 8.6%(+16.1)#56 | 5.5%(+19.2)#1,320 |
| 57. | Allgood | 24.6% | 8.6%(+16.0)#57 | 5.5%(+19.2)#1,330 |
| 58. | Roanoke | 24.5% | 8.6%(+15.9)#58 | 5.5%(+19.0)#1,348 |
| 59. | Fyffe | 24.5% | 8.6%(+15.9)#59 | 5.5%(+19.0)#1,350 |
| 60. | Our Town | 24.4% | 8.6%(+15.8)#60 | 5.5%(+18.9)#1,360 |
| 61. | Gordonville | 24.4% | 8.6%(+15.8)#61 | 5.5%(+18.9)#1,364 |
| 62. | Selmont West Selmont | 23.8% | 8.6%(+15.2)#62 | 5.5%(+18.3)#1,455 |
| 63. | Rock Mills | 23.4% | 8.6%(+14.8)#63 | 5.5%(+18.0)#1,513 |
| 64. | Louisville | 23.4% | 8.6%(+14.8)#64 | 5.5%(+17.9)#1,521 |
| 65. | Tidmore Bend | 22.8% | 8.6%(+14.2)#65 | 5.5%(+17.4)#1,621 |
| 66. | West Point | 22.6% | 8.6%(+14.0)#66 | 5.5%(+17.2)#1,652 |
| 67. | Guin | 22.6% | 8.6%(+14.0)#67 | 5.5%(+17.2)#1,654 |
| 68. | Valley | 22.5% | 8.6%(+13.9)#68 | 5.5%(+17.1)#1,670 |
| 69. | Providence | 22.2% | 8.6%(+13.6)#69 | 5.5%(+16.8)#1,730 |
| 70. | Pennington | 22.2% | 8.6%(+13.6)#70 | 5.5%(+16.7)#1,748 |
| 71. | Millport | 22.1% | 8.6%(+13.5)#71 | 5.5%(+16.6)#1,753 |
| 72. | Centreville | 22.0% | 8.6%(+13.4)#72 | 5.5%(+16.5)#1,781 |
| 73. | Shorter | 21.9% | 8.6%(+13.3)#73 | 5.5%(+16.4)#1,790 |
| 74. | Fort Deposit | 21.7% | 8.6%(+13.1)#74 | 5.5%(+16.3)#1,821 |
| 75. | Gilbertown | 21.7% | 8.6%(+13.1)#75 | 5.5%(+16.2)#1,833 |
| 76. | Bayou La Batre | 21.6% | 8.6%(+13.0)#76 | 5.5%(+16.1)#1,862 |
| 77. | Nauvoo | 21.6% | 8.6%(+13.0)#77 | 5.5%(+16.1)#1,868 |
| 78. | Cottondale | 21.4% | 8.6%(+12.8)#78 | 5.5%(+15.9)#1,902 |
| 79. | Oakman | 21.3% | 8.6%(+12.7)#79 | 5.5%(+15.8)#1,920 |
| 80. | Rainsville | 21.3% | 8.6%(+12.7)#80 | 5.5%(+15.8)#1,922 |
| 81. | Camp Hill | 21.2% | 8.6%(+12.6)#81 | 5.5%(+15.7)#1,959 |
| 82. | Clayton | 21.0% | 8.6%(+12.4)#82 | 5.5%(+15.5)#2,009 |
| 83. | Skyline | 20.9% | 8.6%(+12.3)#83 | 5.5%(+15.5)#2,013 |
| 84. | Fayette | 20.5% | 8.6%(+11.9)#84 | 5.5%(+15.1)#2,125 |
| 85. | Sulligent | 20.5% | 8.6%(+11.9)#85 | 5.5%(+15.0)#2,140 |
| 86. | Talladega | 20.3% | 8.6%(+11.7)#86 | 5.5%(+14.8)#2,192 |
| 87. | Union Springs | 19.9% | 8.6%(+11.3)#87 | 5.5%(+14.5)#2,288 |
| 88. | Brundidge | 19.9% | 8.6%(+11.3)#88 | 5.5%(+14.4)#2,307 |
| 89. | Lincoln | 19.6% | 8.6%(+11.0)#89 | 5.5%(+14.1)#2,382 |
| 90. | Kansas | 19.6% | 8.6%(+11.0)#90 | 5.5%(+14.1)#2,389 |
| 91. | Excel | 19.5% | 8.6%(+10.9)#91 | 5.5%(+14.1)#2,398 |
| 92. | Florala | 19.5% | 8.6%(+10.9)#92 | 5.5%(+14.0)#2,417 |
| 93. | Reeltown | 19.4% | 8.6%(+10.8)#93 | 5.5%(+13.9)#2,448 |
| 94. | Ashland | 19.3% | 8.6%(+10.7)#94 | 5.5%(+13.8)#2,458 |
| 95. | Castleberry | 19.2% | 8.6%(+10.6)#95 | 5.5%(+13.8)#2,474 |
| 96. | Luverne | 19.1% | 8.6%(+10.5)#96 | 5.5%(+13.7)#2,508 |
| 97. | Cherokee | 19.1% | 8.6%(+10.5)#97 | 5.5%(+13.7)#2,513 |
| 98. | Deer Park | 19.0% | 8.6%(+10.4)#98 | 5.5%(+13.6)#2,540 |
| 99. | Eutaw | 18.8% | 8.6%(+10.2)#99 | 5.5%(+13.3)#2,624 |
| 100. | New Site | 18.8% | 8.6%(+10.2)#100 | 5.5%(+13.3)#2,639 |
Common Questions
What are the Top 10 Cities with the Highest Percentage of Population Employed in Production in Alabama?
Top 10 Cities with the Highest Percentage of Population Employed in Production in Alabama are:
#1
100.0%
#2
100.0%
#3
100.0%
#4
70.2%
#5
67.9%
#6
55.6%
#7
53.9%
#8
53.5%
#9
49.5%
#10
46.2%
What city has the Highest Percentage of Population Employed in Production in Alabama?
Panola has the Highest Percentage of Population Employed in Production in Alabama with 100.0%.
What is the Percentage of Population Employed in Production in the State of Alabama?
Percentage of Population Employed in Production in Alabama is 8.6%.
What is the Percentage of Population Employed in Production in the United States?
Percentage of Population Employed in Production in the United States is 5.5%.