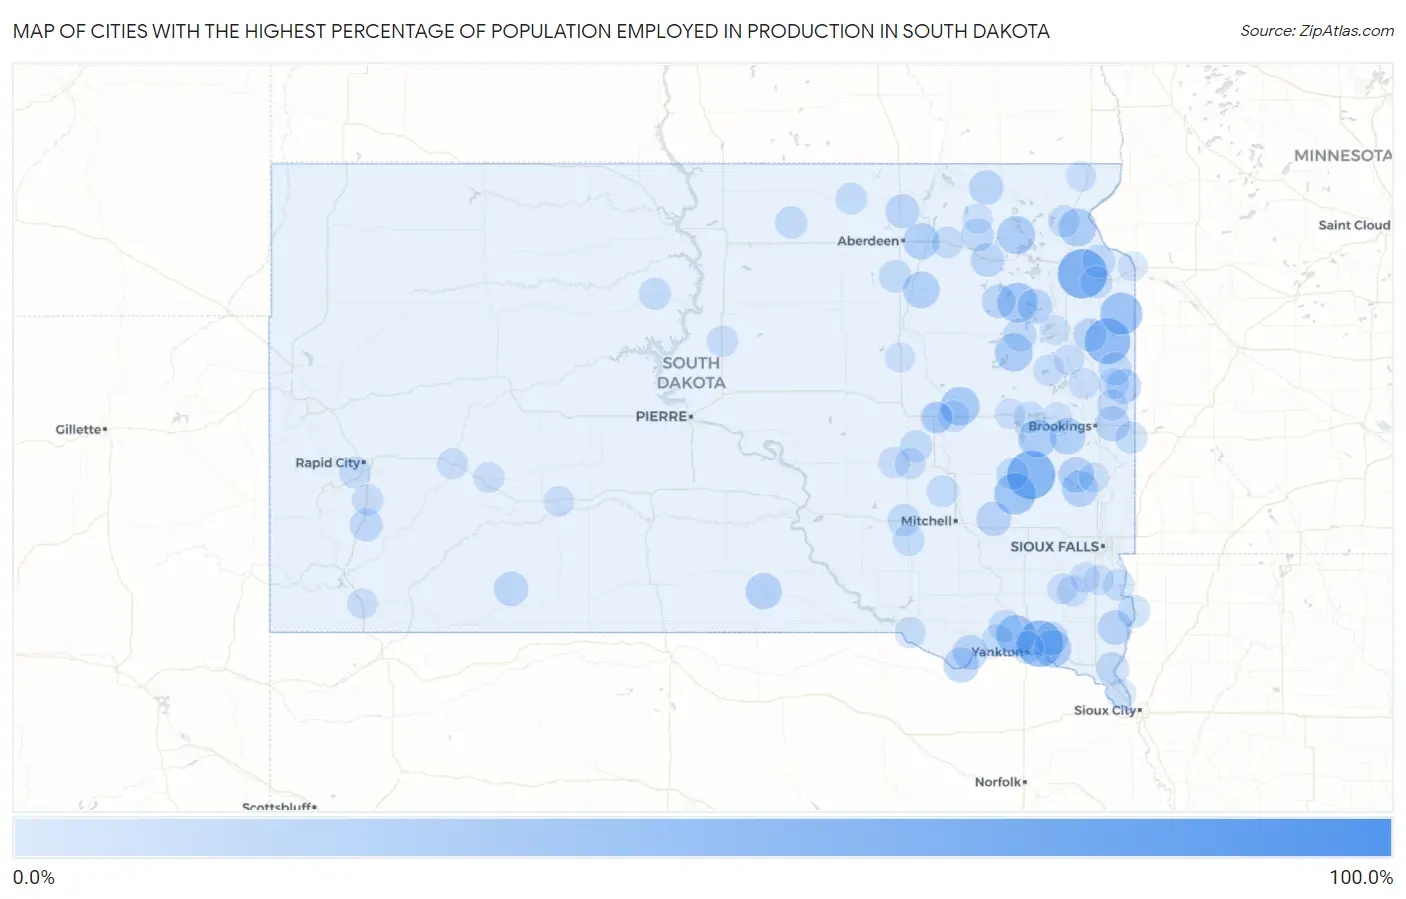
Cities with the Highest Percentage of Population Employed in Production in South Dakota
RELATED REPORTS & OPTIONS
Production
South Dakota
Compare Cities
Map of Cities with the Highest Percentage of Population Employed in Production in South Dakota
0.0%
100.0%
Cities with the Highest Percentage of Population Employed in Production in South Dakota
| City | % Employed | vs State | vs National | |
| 1. | Spink Colony | 100.0% | 6.4%(+93.6)#1 | 5.5%(+94.5)#26 |
| 2. | Shannon Colony | 100.0% | 6.4%(+93.6)#2 | 5.5%(+94.5)#35 |
| 3. | Marvin | 60.0% | 6.4%(+53.6)#3 | 5.5%(+54.5)#121 |
| 4. | Winfred | 56.5% | 6.4%(+50.2)#4 | 5.5%(+51.1)#147 |
| 5. | Mission Hill | 51.7% | 6.4%(+45.3)#5 | 5.5%(+46.2)#184 |
| 6. | Altamont | 50.0% | 6.4%(+43.6)#6 | 5.5%(+44.5)#204 |
| 7. | Glendale Colony | 42.5% | 6.4%(+36.1)#7 | 5.5%(+37.0)#303 |
| 8. | Revillo | 41.0% | 6.4%(+34.6)#8 | 5.5%(+35.5)#336 |
| 9. | Canova | 39.3% | 6.4%(+32.9)#9 | 5.5%(+33.8)#377 |
| 10. | Wallace | 35.7% | 6.4%(+29.4)#10 | 5.5%(+30.2)#476 |
| 11. | Utica | 35.5% | 6.4%(+29.1)#11 | 5.5%(+30.0)#484 |
| 12. | Burbank | 34.4% | 6.4%(+28.0)#12 | 5.5%(+28.9)#521 |
| 13. | Yale | 32.8% | 6.4%(+26.4)#13 | 5.5%(+27.3)#606 |
| 14. | Crook | 32.1% | 6.4%(+25.7)#14 | 5.5%(+26.6)#643 |
| 15. | Boulder Canyon | 31.3% | 6.4%(+24.9)#15 | 5.5%(+25.8)#689 |
| 16. | Naples | 30.8% | 6.4%(+24.4)#16 | 5.5%(+25.3)#725 |
| 17. | Roslyn | 30.6% | 6.4%(+24.2)#17 | 5.5%(+25.1)#734 |
| 18. | Oldham | 30.5% | 6.4%(+24.1)#18 | 5.5%(+25.0)#738 |
| 19. | Peever | 30.0% | 6.4%(+23.6)#19 | 5.5%(+24.5)#761 |
| 20. | Gayville | 30.0% | 6.4%(+23.6)#20 | 5.5%(+24.5)#770 |
| 21. | Rowena | 28.6% | 6.4%(+22.2)#21 | 5.5%(+23.1)#876 |
| 22. | Brentford | 26.8% | 6.4%(+20.5)#22 | 5.5%(+21.4)#1,049 |
| 23. | Bath Corner | 26.7% | 6.4%(+20.3)#23 | 5.5%(+21.2)#1,064 |
| 24. | Sinai | 26.5% | 6.4%(+20.1)#24 | 5.5%(+21.0)#1,078 |
| 25. | Brant Lake South | 25.9% | 6.4%(+19.6)#25 | 5.5%(+20.5)#1,142 |
| 26. | Colome | 25.7% | 6.4%(+19.4)#26 | 5.5%(+20.3)#1,168 |
| 27. | Wentworth | 25.0% | 6.4%(+18.6)#27 | 5.5%(+19.5)#1,261 |
| 28. | Running Water | 24.0% | 6.4%(+17.6)#28 | 5.5%(+18.5)#1,422 |
| 29. | Bushnell | 23.3% | 6.4%(+17.0)#29 | 5.5%(+17.9)#1,530 |
| 30. | Millerdale Colony | 23.2% | 6.4%(+16.9)#30 | 5.5%(+17.7)#1,558 |
| 31. | Springfield | 23.2% | 6.4%(+16.8)#31 | 5.5%(+17.7)#1,560 |
| 32. | Florence | 22.8% | 6.4%(+16.5)#32 | 5.5%(+17.4)#1,625 |
| 33. | Astoria | 22.2% | 6.4%(+15.9)#33 | 5.5%(+16.8)#1,727 |
| 34. | Clark Colony | 22.2% | 6.4%(+15.9)#35 | 5.5%(+16.8)#1,739 |
| 35. | Farmer | 22.2% | 6.4%(+15.9)#36 | 5.5%(+16.8)#1,740 |
| 36. | Alcester | 22.1% | 6.4%(+15.7)#37 | 5.5%(+16.6)#1,754 |
| 37. | Britton | 21.7% | 6.4%(+15.3)#38 | 5.5%(+16.2)#1,832 |
| 38. | Allen | 21.4% | 6.4%(+15.0)#39 | 5.5%(+15.9)#1,908 |
| 39. | Westport | 20.6% | 6.4%(+14.2)#40 | 5.5%(+15.1)#2,114 |
| 40. | Bristol | 20.0% | 6.4%(+13.6)#41 | 5.5%(+14.5)#2,250 |
| 41. | Bradley | 20.0% | 6.4%(+13.6)#42 | 5.5%(+14.5)#2,265 |
| 42. | Goodwin | 20.0% | 6.4%(+13.6)#43 | 5.5%(+14.5)#2,266 |
| 43. | Volin | 19.8% | 6.4%(+13.4)#44 | 5.5%(+14.3)#2,321 |
| 44. | Henry | 18.8% | 6.4%(+12.4)#45 | 5.5%(+13.3)#2,645 |
| 45. | Richland | 18.8% | 6.4%(+12.4)#46 | 5.5%(+13.3)#2,650 |
| 46. | Corona | 18.8% | 6.4%(+12.4)#47 | 5.5%(+13.3)#2,656 |
| 47. | Brandt | 18.3% | 6.4%(+12.0)#48 | 5.5%(+12.9)#2,793 |
| 48. | Pierpont | 18.1% | 6.4%(+11.7)#49 | 5.5%(+12.6)#2,916 |
| 49. | Yankton | 17.9% | 6.4%(+11.5)#50 | 5.5%(+12.4)#2,997 |
| 50. | Fairburn | 17.6% | 6.4%(+11.3)#51 | 5.5%(+12.2)#3,072 |
| 51. | Hudson | 17.5% | 6.4%(+11.2)#52 | 5.5%(+12.1)#3,118 |
| 52. | Spring Creek Colony | 17.1% | 6.4%(+10.7)#53 | 5.5%(+11.6)#3,316 |
| 53. | Plankinton | 17.1% | 6.4%(+10.7)#54 | 5.5%(+11.6)#3,327 |
| 54. | Mansfield | 17.1% | 6.4%(+10.7)#55 | 5.5%(+11.6)#3,336 |
| 55. | Lesterville | 16.9% | 6.4%(+10.5)#56 | 5.5%(+11.4)#3,409 |
| 56. | Alpena | 16.5% | 6.4%(+10.1)#57 | 5.5%(+11.0)#3,614 |
| 57. | Hosmer | 16.1% | 6.4%(+9.77)#58 | 5.5%(+10.7)#3,796 |
| 58. | Howard | 16.1% | 6.4%(+9.76)#59 | 5.5%(+10.7)#3,805 |
| 59. | La Plant | 15.9% | 6.4%(+9.55)#60 | 5.5%(+10.4)#3,906 |
| 60. | Elkton | 15.9% | 6.4%(+9.54)#61 | 5.5%(+10.4)#3,920 |
| 61. | Huron | 15.9% | 6.4%(+9.49)#62 | 5.5%(+10.4)#3,948 |
| 62. | Twin Brooks | 15.8% | 6.4%(+9.43)#63 | 5.5%(+10.3)#3,988 |
| 63. | Agency Village | 15.4% | 6.4%(+9.09)#64 | 5.5%(+9.98)#4,129 |
| 64. | Canton | 15.2% | 6.4%(+8.81)#65 | 5.5%(+9.70)#4,299 |
| 65. | Letcher | 15.1% | 6.4%(+8.76)#66 | 5.5%(+9.65)#4,329 |
| 66. | Stickney | 15.0% | 6.4%(+8.59)#67 | 5.5%(+9.48)#4,440 |
| 67. | Leola | 14.9% | 6.4%(+8.56)#68 | 5.5%(+9.46)#4,458 |
| 68. | Groton | 14.9% | 6.4%(+8.50)#69 | 5.5%(+9.39)#4,499 |
| 69. | Tabor | 14.8% | 6.4%(+8.47)#70 | 5.5%(+9.36)#4,516 |
| 70. | Cavour | 14.8% | 6.4%(+8.45)#71 | 5.5%(+9.35)#4,525 |
| 71. | Colonial Pine Hills | 14.7% | 6.4%(+8.37)#72 | 5.5%(+9.26)#4,590 |
| 72. | Lake Preston | 14.6% | 6.4%(+8.26)#73 | 5.5%(+9.16)#4,657 |
| 73. | Davis | 14.0% | 6.4%(+7.59)#74 | 5.5%(+8.48)#5,037 |
| 74. | White | 13.9% | 6.4%(+7.54)#75 | 5.5%(+8.43)#5,076 |
| 75. | Hermosa | 13.8% | 6.4%(+7.47)#76 | 5.5%(+8.36)#5,121 |
| 76. | Marty | 13.8% | 6.4%(+7.43)#77 | 5.5%(+8.32)#5,138 |
| 77. | Wessington Springs | 13.8% | 6.4%(+7.42)#78 | 5.5%(+8.31)#5,144 |
| 78. | Agar | 13.5% | 6.4%(+7.10)#79 | 5.5%(+7.99)#5,402 |
| 79. | Hayti | 13.4% | 6.4%(+7.06)#80 | 5.5%(+7.95)#5,432 |
| 80. | Lane | 13.3% | 6.4%(+6.97)#81 | 5.5%(+7.86)#5,515 |
| 81. | Estelline | 13.0% | 6.4%(+6.64)#82 | 5.5%(+7.53)#5,775 |
| 82. | Toronto | 12.9% | 6.4%(+6.59)#83 | 5.5%(+7.48)#5,801 |
| 83. | Quinn | 12.9% | 6.4%(+6.54)#84 | 5.5%(+7.43)#5,856 |
| 84. | Wasta | 12.9% | 6.4%(+6.54)#85 | 5.5%(+7.43)#5,859 |
| 85. | Morningside | 12.5% | 6.4%(+6.14)#86 | 5.5%(+7.03)#6,193 |
| 86. | Castlewood | 12.1% | 6.4%(+5.69)#87 | 5.5%(+6.59)#6,571 |
| 87. | Hurley | 11.9% | 6.4%(+5.54)#88 | 5.5%(+6.44)#6,725 |
| 88. | Lennox | 11.8% | 6.4%(+5.44)#89 | 5.5%(+6.33)#6,824 |
| 89. | Oelrichs | 11.8% | 6.4%(+5.40)#90 | 5.5%(+6.30)#6,861 |
| 90. | New Effington | 11.8% | 6.4%(+5.40)#91 | 5.5%(+6.30)#6,862 |
| 91. | De Smet | 11.7% | 6.4%(+5.34)#92 | 5.5%(+6.23)#6,941 |
| 92. | Kadoka | 11.6% | 6.4%(+5.28)#93 | 5.5%(+6.18)#6,992 |
| 93. | Arlington | 11.5% | 6.4%(+5.14)#94 | 5.5%(+6.03)#7,127 |
| 94. | Langford | 11.4% | 6.4%(+5.03)#95 | 5.5%(+5.92)#7,236 |
| 95. | Colman | 11.3% | 6.4%(+4.94)#96 | 5.5%(+5.83)#7,323 |
| 96. | Worthing | 11.2% | 6.4%(+4.84)#97 | 5.5%(+5.73)#7,436 |
| 97. | Jefferson | 11.1% | 6.4%(+4.75)#98 | 5.5%(+5.64)#7,503 |
| 98. | Watertown | 11.0% | 6.4%(+4.65)#99 | 5.5%(+5.54)#7,645 |
| 99. | Tulare | 11.0% | 6.4%(+4.61)#100 | 5.5%(+5.51)#7,681 |
| 100. | Big Stone City | 10.9% | 6.4%(+4.53)#101 | 5.5%(+5.42)#7,768 |
Common Questions
What are the Top 10 Cities with the Highest Percentage of Population Employed in Production in South Dakota?
Top 10 Cities with the Highest Percentage of Population Employed in Production in South Dakota are:
What city has the Highest Percentage of Population Employed in Production in South Dakota?
Marvin has the Highest Percentage of Population Employed in Production in South Dakota with 60.0%.
What is the Percentage of Population Employed in Production in the State of South Dakota?
Percentage of Population Employed in Production in South Dakota is 6.4%.
What is the Percentage of Population Employed in Production in the United States?
Percentage of Population Employed in Production in the United States is 5.5%.