Cities with the Highest Percentage of Population Employed in Production in Colorado
RELATED REPORTS & OPTIONS
Production
Colorado
Compare Cities
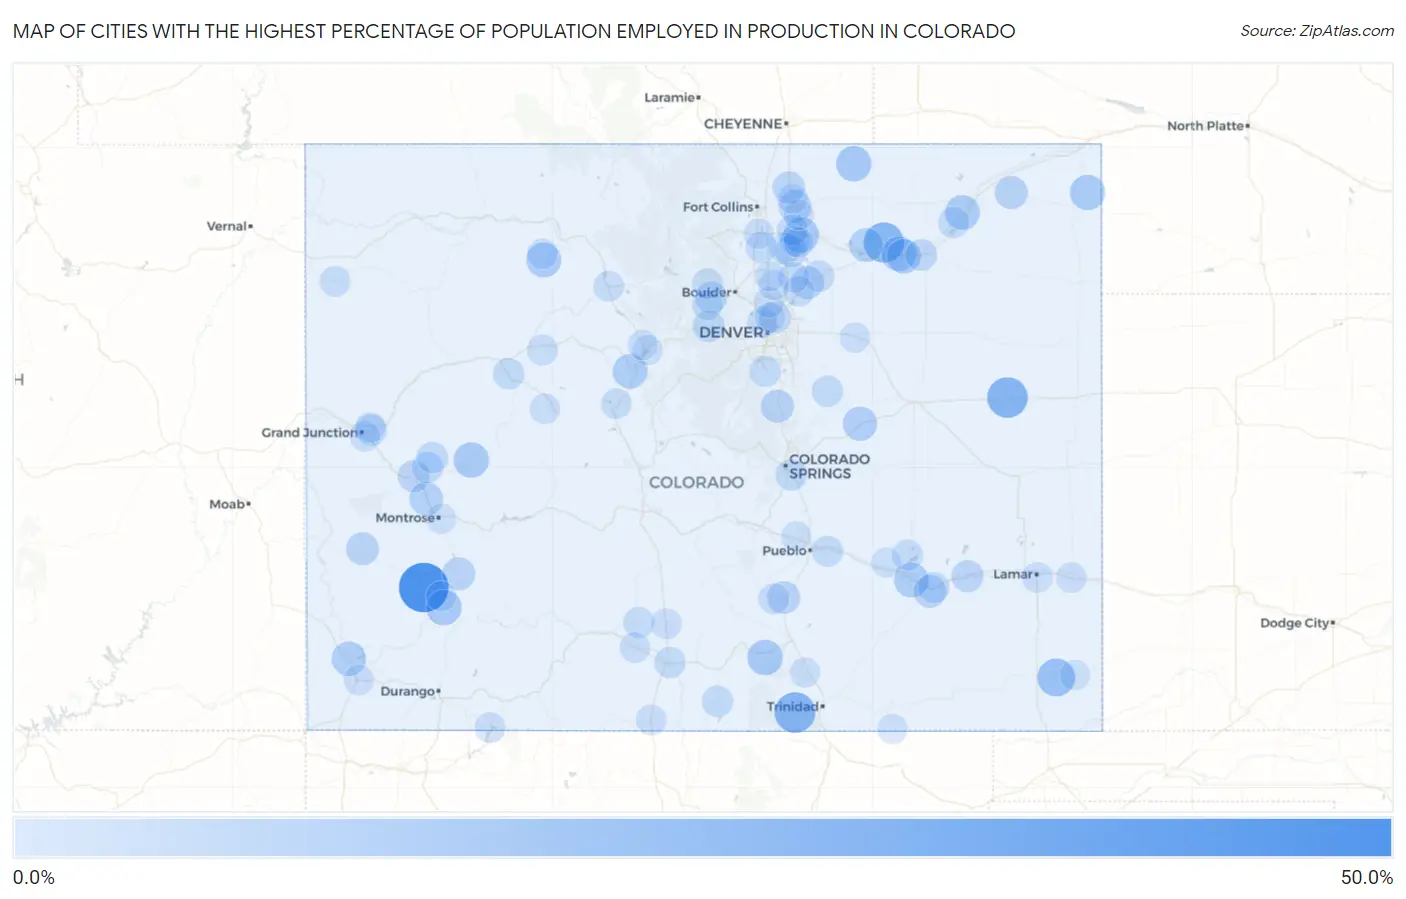
Map of Cities with the Highest Percentage of Population Employed in Production in Colorado
0.0%
50.0%
Cities with the Highest Percentage of Population Employed in Production in Colorado
| City | % Employed | vs State | vs National | |
| 1. | Sawpit | 50.0% | 3.6%(+46.4)#1 | 5.5%(+44.5)#210 |
| 2. | Lazear | 43.5% | 3.6%(+39.9)#2 | 5.5%(+38.0)#285 |
| 3. | Segundo | 29.2% | 3.6%(+25.7)#3 | 5.5%(+23.8)#821 |
| 4. | Seibert | 29.2% | 3.6%(+25.6)#4 | 5.5%(+23.7)#827 |
| 5. | Weldona | 28.4% | 3.6%(+24.8)#5 | 5.5%(+22.9)#897 |
| 6. | Vilas | 22.9% | 3.6%(+19.4)#6 | 5.5%(+17.4)#1,609 |
| 7. | Mcclave | 18.3% | 3.6%(+14.7)#7 | 5.5%(+12.8)#2,805 |
| 8. | Garden City | 17.8% | 3.6%(+14.2)#8 | 5.5%(+12.3)#3,020 |
| 9. | Ophir | 17.5% | 3.6%(+13.9)#9 | 5.5%(+12.0)#3,140 |
| 10. | Grover | 17.4% | 3.6%(+13.8)#10 | 5.5%(+11.9)#3,170 |
| 11. | La Veta | 17.4% | 3.6%(+13.8)#11 | 5.5%(+11.9)#3,188 |
| 12. | Paonia | 17.2% | 3.6%(+13.6)#12 | 5.5%(+11.7)#3,281 |
| 13. | Amherst | 16.9% | 3.6%(+13.3)#13 | 5.5%(+11.4)#3,410 |
| 14. | Marvel | 16.7% | 3.6%(+13.1)#14 | 5.5%(+11.2)#3,520 |
| 15. | Phippsburg | 15.9% | 3.6%(+12.4)#15 | 5.5%(+10.5)#3,893 |
| 16. | Atwood | 15.9% | 3.6%(+12.3)#16 | 5.5%(+10.4)#3,911 |
| 17. | Rocky Ford | 15.9% | 3.6%(+12.3)#17 | 5.5%(+10.4)#3,925 |
| 18. | Log Lane Village | 15.9% | 3.6%(+12.3)#18 | 5.5%(+10.4)#3,933 |
| 19. | Copper Mountain | 15.6% | 3.6%(+12.0)#19 | 5.5%(+10.1)#4,061 |
| 20. | Fort Morgan | 15.3% | 3.6%(+11.7)#20 | 5.5%(+9.81)#4,240 |
| 21. | Lewis | 14.8% | 3.6%(+11.2)#21 | 5.5%(+9.29)#4,577 |
| 22. | Ramah | 14.7% | 3.6%(+11.1)#22 | 5.5%(+9.24)#4,611 |
| 23. | Orchard | 13.9% | 3.6%(+10.3)#23 | 5.5%(+8.42)#5,089 |
| 24. | Olathe | 13.2% | 3.6%(+9.61)#24 | 5.5%(+7.70)#5,619 |
| 25. | Pine Valley | 13.0% | 3.6%(+9.40)#25 | 5.5%(+7.49)#5,796 |
| 26. | Larkspur | 12.4% | 3.6%(+8.81)#26 | 5.5%(+6.90)#6,300 |
| 27. | Fleming | 12.2% | 3.6%(+8.68)#27 | 5.5%(+6.78)#6,411 |
| 28. | Hudson | 12.1% | 3.6%(+8.50)#28 | 5.5%(+6.59)#6,569 |
| 29. | Ault | 12.0% | 3.6%(+8.46)#29 | 5.5%(+6.56)#6,599 |
| 30. | Colorado City | 12.0% | 3.6%(+8.43)#30 | 5.5%(+6.52)#6,643 |
| 31. | La Junta | 11.8% | 3.6%(+8.26)#31 | 5.5%(+6.36)#6,803 |
| 32. | Portland | 11.8% | 3.6%(+8.20)#32 | 5.5%(+6.30)#6,870 |
| 33. | Nucla | 11.7% | 3.6%(+8.11)#33 | 5.5%(+6.21)#6,964 |
| 34. | Brook Forest | 11.3% | 3.6%(+7.75)#34 | 5.5%(+5.85)#7,309 |
| 35. | Nunn | 11.0% | 3.6%(+7.40)#35 | 5.5%(+5.49)#7,692 |
| 36. | Las Animas | 10.2% | 3.6%(+6.65)#36 | 5.5%(+4.75)#8,460 |
| 37. | Delta | 10.0% | 3.6%(+6.43)#37 | 5.5%(+4.52)#8,776 |
| 38. | Bonanza Mountain Estates | 9.8% | 3.6%(+6.21)#38 | 5.5%(+4.31)#9,024 |
| 39. | Derby | 9.6% | 3.6%(+6.05)#39 | 5.5%(+4.15)#9,200 |
| 40. | Gilcrest | 9.6% | 3.6%(+6.00)#40 | 5.5%(+4.10)#9,250 |
| 41. | Central City | 9.4% | 3.6%(+5.86)#41 | 5.5%(+3.96)#9,439 |
| 42. | Brush | 9.2% | 3.6%(+5.66)#42 | 5.5%(+3.76)#9,671 |
| 43. | Milliken | 9.0% | 3.6%(+5.41)#43 | 5.5%(+3.50)#10,007 |
| 44. | Kiowa | 9.0% | 3.6%(+5.41)#44 | 5.5%(+3.50)#10,012 |
| 45. | Orchard City | 8.8% | 3.6%(+5.26)#45 | 5.5%(+3.36)#10,192 |
| 46. | Stratmoor | 8.7% | 3.6%(+5.14)#46 | 5.5%(+3.23)#10,357 |
| 47. | Cedaredge | 8.6% | 3.6%(+5.03)#47 | 5.5%(+3.12)#10,509 |
| 48. | Cattle Creek | 8.6% | 3.6%(+5.00)#48 | 5.5%(+3.09)#10,558 |
| 49. | San Luis | 8.5% | 3.6%(+4.96)#49 | 5.5%(+3.06)#10,601 |
| 50. | Keenesburg | 8.5% | 3.6%(+4.96)#50 | 5.5%(+3.05)#10,615 |
| 51. | Merino | 8.4% | 3.6%(+4.82)#51 | 5.5%(+2.91)#10,814 |
| 52. | Louviers | 8.3% | 3.6%(+4.77)#52 | 5.5%(+2.86)#10,889 |
| 53. | Alamosa East | 8.3% | 3.6%(+4.75)#53 | 5.5%(+2.84)#10,935 |
| 54. | Clifton | 8.3% | 3.6%(+4.74)#54 | 5.5%(+2.83)#10,944 |
| 55. | North La Junta | 8.3% | 3.6%(+4.70)#55 | 5.5%(+2.80)#10,988 |
| 56. | Berthoud | 8.1% | 3.6%(+4.58)#56 | 5.5%(+2.68)#11,145 |
| 57. | Greeley | 8.1% | 3.6%(+4.53)#57 | 5.5%(+2.63)#11,221 |
| 58. | Center | 7.9% | 3.6%(+4.35)#58 | 5.5%(+2.45)#11,482 |
| 59. | Vineland | 7.8% | 3.6%(+4.21)#59 | 5.5%(+2.30)#11,721 |
| 60. | Ordway | 7.7% | 3.6%(+4.16)#60 | 5.5%(+2.26)#11,777 |
| 61. | Ward | 7.7% | 3.6%(+4.13)#61 | 5.5%(+2.22)#11,851 |
| 62. | Rangely | 7.4% | 3.6%(+3.83)#62 | 5.5%(+1.93)#12,321 |
| 63. | Rye | 7.3% | 3.6%(+3.75)#63 | 5.5%(+1.85)#12,454 |
| 64. | Gypsum | 7.2% | 3.6%(+3.63)#64 | 5.5%(+1.72)#12,655 |
| 65. | Lochbuie | 7.2% | 3.6%(+3.59)#65 | 5.5%(+1.69)#12,706 |
| 66. | Kremmling | 7.2% | 3.6%(+3.59)#66 | 5.5%(+1.68)#12,711 |
| 67. | Leadville North | 7.1% | 3.6%(+3.59)#67 | 5.5%(+1.68)#12,713 |
| 68. | Berkley | 7.1% | 3.6%(+3.50)#68 | 5.5%(+1.59)#12,883 |
| 69. | Monte Vista | 7.0% | 3.6%(+3.42)#69 | 5.5%(+1.51)#13,015 |
| 70. | Hooper | 7.0% | 3.6%(+3.41)#70 | 5.5%(+1.51)#13,027 |
| 71. | Lamar | 6.9% | 3.6%(+3.36)#71 | 5.5%(+1.45)#13,116 |
| 72. | Aristocrat Ranchettes | 6.9% | 3.6%(+3.35)#72 | 5.5%(+1.45)#13,122 |
| 73. | Granada | 6.9% | 3.6%(+3.35)#73 | 5.5%(+1.44)#13,135 |
| 74. | Evans | 6.9% | 3.6%(+3.33)#74 | 5.5%(+1.43)#13,153 |
| 75. | Rollinsville | 6.9% | 3.6%(+3.31)#75 | 5.5%(+1.41)#13,197 |
| 76. | Antonito | 6.8% | 3.6%(+3.22)#76 | 5.5%(+1.32)#13,337 |
| 77. | La Salle | 6.7% | 3.6%(+3.13)#77 | 5.5%(+1.22)#13,505 |
| 78. | Arboles | 6.7% | 3.6%(+3.10)#78 | 5.5%(+1.20)#13,554 |
| 79. | Oak Creek | 6.6% | 3.6%(+3.07)#79 | 5.5%(+1.16)#13,621 |
| 80. | Cortez | 6.6% | 3.6%(+3.06)#80 | 5.5%(+1.15)#13,638 |
| 81. | Orchard Mesa | 6.6% | 3.6%(+3.02)#81 | 5.5%(+1.11)#13,708 |
| 82. | Loveland | 6.6% | 3.6%(+3.00)#82 | 5.5%(+1.09)#13,737 |
| 83. | Northglenn | 6.6% | 3.6%(+2.99)#83 | 5.5%(+1.08)#13,756 |
| 84. | Snowmass Village | 6.5% | 3.6%(+2.98)#84 | 5.5%(+1.08)#13,764 |
| 85. | Byers | 6.5% | 3.6%(+2.94)#85 | 5.5%(+1.03)#13,843 |
| 86. | Fruitvale | 6.3% | 3.6%(+2.73)#86 | 5.5%(+0.828)#14,192 |
| 87. | Dillon | 6.3% | 3.6%(+2.73)#87 | 5.5%(+0.821)#14,206 |
| 88. | Dacono | 6.3% | 3.6%(+2.72)#88 | 5.5%(+0.818)#14,211 |
| 89. | Frederick | 6.3% | 3.6%(+2.70)#89 | 5.5%(+0.796)#14,251 |
| 90. | Olney Springs | 6.2% | 3.6%(+2.69)#90 | 5.5%(+0.781)#14,270 |
| 91. | Walsh | 6.2% | 3.6%(+2.65)#91 | 5.5%(+0.743)#14,348 |
| 92. | Eaton | 6.2% | 3.6%(+2.65)#92 | 5.5%(+0.741)#14,352 |
| 93. | Welby | 6.2% | 3.6%(+2.64)#93 | 5.5%(+0.738)#14,363 |
| 94. | Pueblo West | 6.2% | 3.6%(+2.59)#94 | 5.5%(+0.688)#14,455 |
| 95. | Pierce | 6.1% | 3.6%(+2.58)#95 | 5.5%(+0.679)#14,472 |
| 96. | Aguilar | 6.0% | 3.6%(+2.44)#96 | 5.5%(+0.531)#14,717 |
| 97. | Mountain Village | 6.0% | 3.6%(+2.42)#97 | 5.5%(+0.518)#14,749 |
| 98. | Silverthorne | 5.9% | 3.6%(+2.36)#98 | 5.5%(+0.457)#14,866 |
| 99. | Montrose | 5.9% | 3.6%(+2.32)#99 | 5.5%(+0.414)#14,926 |
| 100. | Branson | 5.9% | 3.6%(+2.32)#100 | 5.5%(+0.414)#14,953 |
Common Questions
What are the Top 10 Cities with the Highest Percentage of Population Employed in Production in Colorado?
Top 10 Cities with the Highest Percentage of Population Employed in Production in Colorado are:
What city has the Highest Percentage of Population Employed in Production in Colorado?
Sawpit has the Highest Percentage of Population Employed in Production in Colorado with 50.0%.
What is the Percentage of Population Employed in Production in the State of Colorado?
Percentage of Population Employed in Production in Colorado is 3.6%.
What is the Percentage of Population Employed in Production in the United States?
Percentage of Population Employed in Production in the United States is 5.5%.