Cities with the Highest Percentage of Population Employed in Production in North Carolina
RELATED REPORTS & OPTIONS
Production
North Carolina
Compare Cities
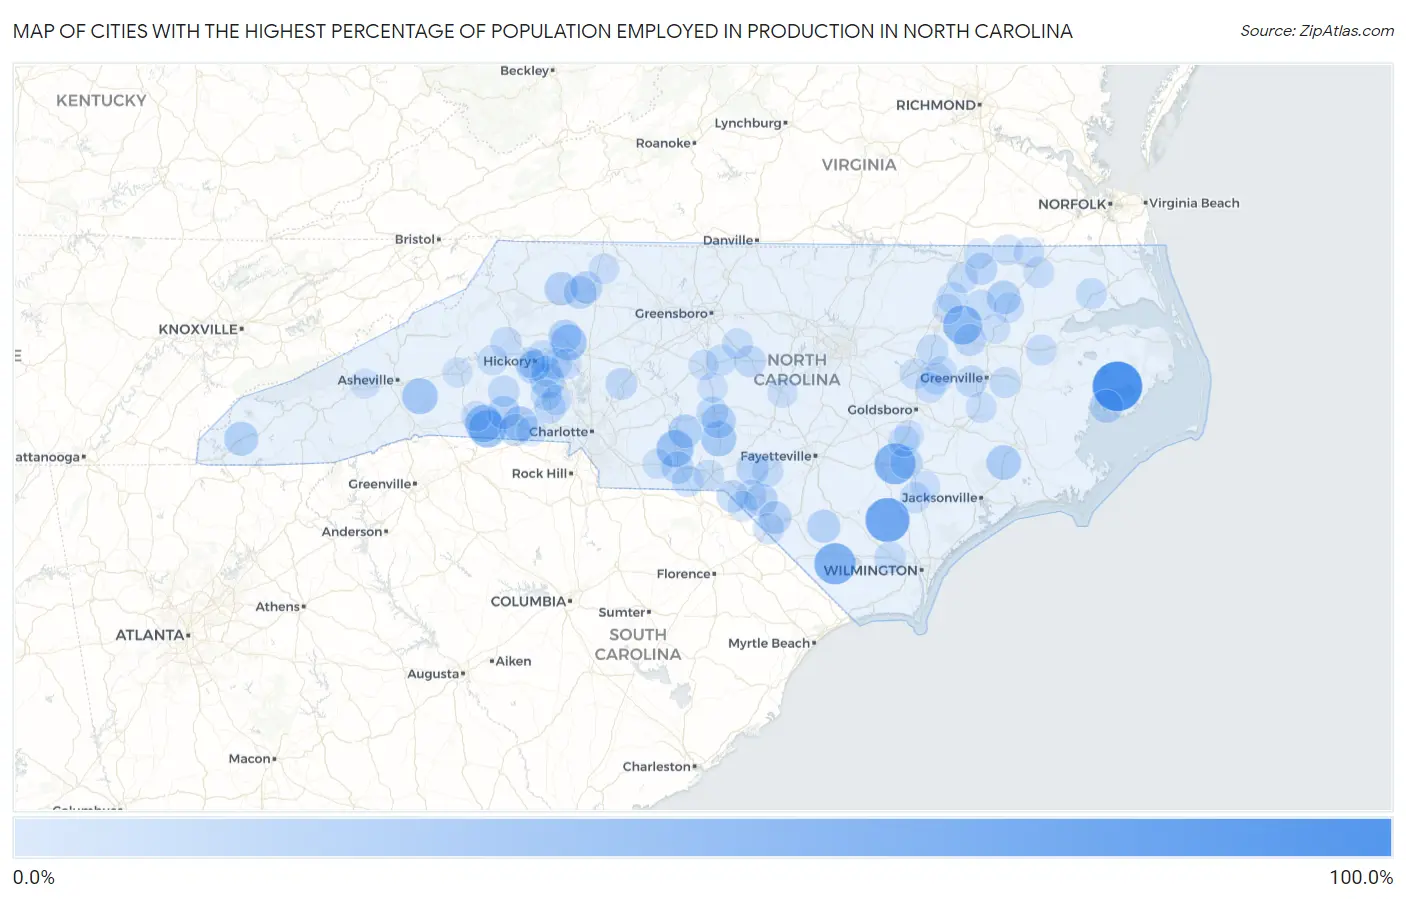
Map of Cities with the Highest Percentage of Population Employed in Production in North Carolina
0.0%
100.0%
Cities with the Highest Percentage of Population Employed in Production in North Carolina
| City | % Employed | vs State | vs National | |
| 1. | Fairfield | 97.2% | 6.6%(+90.6)#1 | 5.5%(+91.8)#49 |
| 2. | Ivanhoe | 74.2% | 6.6%(+67.6)#2 | 5.5%(+68.8)#72 |
| 3. | Brunswick | 62.5% | 6.6%(+55.9)#3 | 5.5%(+57.0)#104 |
| 4. | Turkey | 60.8% | 6.6%(+54.2)#4 | 5.5%(+55.3)#113 |
| 5. | Leggett | 52.9% | 6.6%(+46.4)#5 | 5.5%(+47.5)#177 |
| 6. | Cliffside | 47.1% | 6.6%(+40.5)#6 | 5.5%(+41.7)#238 |
| 7. | Caroleen | 46.4% | 6.6%(+39.9)#7 | 5.5%(+41.0)#249 |
| 8. | Ansonville | 44.7% | 6.6%(+38.1)#8 | 5.5%(+39.2)#269 |
| 9. | Stony Point | 39.9% | 6.6%(+33.3)#9 | 5.5%(+34.4)#361 |
| 10. | Gerton | 39.6% | 6.6%(+33.0)#10 | 5.5%(+34.1)#370 |
| 11. | Norman | 37.0% | 6.6%(+30.4)#11 | 5.5%(+31.6)#440 |
| 12. | Light Oak | 36.0% | 6.6%(+29.4)#12 | 5.5%(+30.5)#466 |
| 13. | Pollocksville | 34.8% | 6.6%(+28.2)#13 | 5.5%(+29.4)#510 |
| 14. | Maiden | 33.7% | 6.6%(+27.1)#14 | 5.5%(+28.3)#552 |
| 15. | Candor | 32.1% | 6.6%(+25.6)#15 | 5.5%(+26.7)#637 |
| 16. | Marble | 31.8% | 6.6%(+25.2)#16 | 5.5%(+26.3)#649 |
| 17. | Nebo | 31.8% | 6.6%(+25.2)#17 | 5.5%(+26.3)#655 |
| 18. | Mount Gilead | 31.1% | 6.6%(+24.5)#18 | 5.5%(+25.6)#701 |
| 19. | Kelford | 31.0% | 6.6%(+24.4)#19 | 5.5%(+25.6)#704 |
| 20. | Milwaukee | 30.3% | 6.6%(+23.7)#20 | 5.5%(+24.8)#748 |
| 21. | Hays | 29.8% | 6.6%(+23.2)#21 | 5.5%(+24.4)#780 |
| 22. | Swan Quarter | 29.6% | 6.6%(+23.0)#22 | 5.5%(+24.1)#793 |
| 23. | Bladenboro | 28.9% | 6.6%(+22.3)#23 | 5.5%(+23.4)#846 |
| 24. | Hiddenite | 28.9% | 6.6%(+22.3)#24 | 5.5%(+23.4)#847 |
| 25. | Kingstown | 28.6% | 6.6%(+22.0)#25 | 5.5%(+23.1)#869 |
| 26. | Ronda | 27.8% | 6.6%(+21.2)#26 | 5.5%(+22.3)#956 |
| 27. | Glenwood | 27.6% | 6.6%(+21.0)#27 | 5.5%(+22.1)#966 |
| 28. | Maxton | 27.4% | 6.6%(+20.8)#28 | 5.5%(+22.0)#982 |
| 29. | Elrod | 27.2% | 6.6%(+20.6)#29 | 5.5%(+21.7)#1,016 |
| 30. | Deercroft | 26.3% | 6.6%(+19.7)#30 | 5.5%(+20.8)#1,096 |
| 31. | Wadesboro | 26.1% | 6.6%(+19.6)#31 | 5.5%(+20.7)#1,113 |
| 32. | Warsaw | 26.0% | 6.6%(+19.4)#32 | 5.5%(+20.5)#1,139 |
| 33. | Pleasant Hill | 25.8% | 6.6%(+19.2)#33 | 5.5%(+20.3)#1,167 |
| 34. | Gibson | 25.1% | 6.6%(+18.5)#34 | 5.5%(+19.6)#1,243 |
| 35. | Patterson Springs | 24.8% | 6.6%(+18.3)#35 | 5.5%(+19.4)#1,301 |
| 36. | Jackson | 24.8% | 6.6%(+18.2)#36 | 5.5%(+19.4)#1,304 |
| 37. | Princeville | 24.8% | 6.6%(+18.2)#37 | 5.5%(+19.3)#1,308 |
| 38. | Mountain View | 24.8% | 6.6%(+18.2)#38 | 5.5%(+19.3)#1,311 |
| 39. | Biscoe | 24.0% | 6.6%(+17.4)#39 | 5.5%(+18.5)#1,430 |
| 40. | Gold Hill | 23.8% | 6.6%(+17.2)#40 | 5.5%(+18.3)#1,461 |
| 41. | China Grove | 23.5% | 6.6%(+16.9)#41 | 5.5%(+18.0)#1,511 |
| 42. | Bell Arthur | 23.3% | 6.6%(+16.7)#42 | 5.5%(+17.8)#1,548 |
| 43. | Siler City | 23.2% | 6.6%(+16.6)#43 | 5.5%(+17.7)#1,561 |
| 44. | High Shoals | 23.0% | 6.6%(+16.4)#44 | 5.5%(+17.5)#1,592 |
| 45. | Delco | 22.9% | 6.6%(+16.3)#45 | 5.5%(+17.4)#1,619 |
| 46. | Casar | 22.8% | 6.6%(+16.2)#46 | 5.5%(+17.4)#1,624 |
| 47. | Stantonsburg | 22.6% | 6.6%(+16.0)#47 | 5.5%(+17.1)#1,658 |
| 48. | Morven | 22.6% | 6.6%(+16.0)#48 | 5.5%(+17.1)#1,660 |
| 49. | St Stephens | 22.4% | 6.6%(+15.8)#49 | 5.5%(+17.0)#1,684 |
| 50. | Bowmore | 22.0% | 6.6%(+15.4)#50 | 5.5%(+16.5)#1,773 |
| 51. | Calypso | 21.8% | 6.6%(+15.2)#51 | 5.5%(+16.4)#1,807 |
| 52. | Brookford | 21.6% | 6.6%(+15.0)#52 | 5.5%(+16.2)#1,847 |
| 53. | Gamewell | 21.5% | 6.6%(+15.0)#53 | 5.5%(+16.1)#1,874 |
| 54. | Enfield | 21.5% | 6.6%(+14.9)#54 | 5.5%(+16.0)#1,880 |
| 55. | Rowland | 21.3% | 6.6%(+14.7)#55 | 5.5%(+15.9)#1,913 |
| 56. | Elm City | 21.3% | 6.6%(+14.7)#56 | 5.5%(+15.9)#1,915 |
| 57. | Claremont | 21.2% | 6.6%(+14.6)#57 | 5.5%(+15.7)#1,956 |
| 58. | Winfall | 21.0% | 6.6%(+14.4)#58 | 5.5%(+15.5)#2,010 |
| 59. | Newton | 20.9% | 6.6%(+14.3)#59 | 5.5%(+15.4)#2,034 |
| 60. | Lincolnton | 20.8% | 6.6%(+14.2)#60 | 5.5%(+15.3)#2,069 |
| 61. | Franklinville | 20.5% | 6.6%(+13.9)#61 | 5.5%(+15.0)#2,136 |
| 62. | East Laurinburg | 20.4% | 6.6%(+13.8)#62 | 5.5%(+15.0)#2,152 |
| 63. | Grimesland | 20.4% | 6.6%(+13.8)#63 | 5.5%(+15.0)#2,153 |
| 64. | Jackson Springs | 20.4% | 6.6%(+13.8)#64 | 5.5%(+14.9)#2,167 |
| 65. | Wallace | 20.4% | 6.6%(+13.8)#65 | 5.5%(+14.9)#2,173 |
| 66. | Halifax | 20.2% | 6.6%(+13.6)#66 | 5.5%(+14.8)#2,203 |
| 67. | Scotland Neck | 20.1% | 6.6%(+13.5)#67 | 5.5%(+14.7)#2,223 |
| 68. | Liberty | 20.1% | 6.6%(+13.5)#68 | 5.5%(+14.7)#2,227 |
| 69. | Cofield | 20.0% | 6.6%(+13.4)#69 | 5.5%(+14.5)#2,248 |
| 70. | Long View | 19.9% | 6.6%(+13.4)#70 | 5.5%(+14.5)#2,286 |
| 71. | Grifton | 19.9% | 6.6%(+13.3)#71 | 5.5%(+14.4)#2,295 |
| 72. | Lucama | 19.9% | 6.6%(+13.3)#72 | 5.5%(+14.4)#2,305 |
| 73. | Jamesville | 19.7% | 6.6%(+13.1)#73 | 5.5%(+14.2)#2,345 |
| 74. | Farmington | 19.6% | 6.6%(+13.1)#74 | 5.5%(+14.2)#2,365 |
| 75. | Severn | 19.6% | 6.6%(+13.0)#75 | 5.5%(+14.1)#2,386 |
| 76. | Como | 19.6% | 6.6%(+13.0)#76 | 5.5%(+14.1)#2,390 |
| 77. | New Hope | 19.4% | 6.6%(+12.8)#77 | 5.5%(+13.9)#2,447 |
| 78. | Iron Station | 19.1% | 6.6%(+12.5)#78 | 5.5%(+13.6)#2,523 |
| 79. | Cordova | 19.0% | 6.6%(+12.4)#79 | 5.5%(+13.5)#2,574 |
| 80. | Lewiston Woodville | 19.0% | 6.6%(+12.4)#80 | 5.5%(+13.5)#2,577 |
| 81. | Emma | 18.9% | 6.6%(+12.3)#81 | 5.5%(+13.5)#2,583 |
| 82. | Forest City | 18.9% | 6.6%(+12.3)#82 | 5.5%(+13.4)#2,590 |
| 83. | Morganton | 18.9% | 6.6%(+12.3)#83 | 5.5%(+13.4)#2,607 |
| 84. | Catawba | 18.8% | 6.6%(+12.2)#84 | 5.5%(+13.3)#2,641 |
| 85. | Scotch Meadows | 18.7% | 6.6%(+12.1)#85 | 5.5%(+13.2)#2,667 |
| 86. | Dobson | 18.4% | 6.6%(+11.8)#86 | 5.5%(+12.9)#2,774 |
| 87. | Asheboro | 18.3% | 6.6%(+11.7)#87 | 5.5%(+12.8)#2,806 |
| 88. | Greenevers | 18.3% | 6.6%(+11.7)#88 | 5.5%(+12.8)#2,812 |
| 89. | Saratoga | 18.3% | 6.6%(+11.7)#89 | 5.5%(+12.8)#2,820 |
| 90. | Whitakers | 18.2% | 6.6%(+11.6)#90 | 5.5%(+12.7)#2,857 |
| 91. | Eureka | 18.1% | 6.6%(+11.5)#91 | 5.5%(+12.6)#2,903 |
| 92. | Sanford | 17.9% | 6.6%(+11.3)#92 | 5.5%(+12.4)#2,996 |
| 93. | Peachland | 17.8% | 6.6%(+11.2)#93 | 5.5%(+12.4)#3,012 |
| 94. | Oak City | 17.3% | 6.6%(+10.7)#94 | 5.5%(+11.8)#3,216 |
| 95. | Canton | 17.2% | 6.6%(+10.6)#95 | 5.5%(+11.8)#3,248 |
| 96. | Mount Olive | 17.2% | 6.6%(+10.6)#96 | 5.5%(+11.7)#3,277 |
| 97. | Seaboard | 17.1% | 6.6%(+10.6)#97 | 5.5%(+11.7)#3,286 |
| 98. | Seagrove | 17.0% | 6.6%(+10.4)#98 | 5.5%(+11.6)#3,349 |
| 99. | Kings Mountain | 17.0% | 6.6%(+10.4)#99 | 5.5%(+11.5)#3,371 |
| 100. | West Marion | 17.0% | 6.6%(+10.4)#100 | 5.5%(+11.5)#3,378 |
Common Questions
What are the Top 10 Cities with the Highest Percentage of Population Employed in Production in North Carolina?
Top 10 Cities with the Highest Percentage of Population Employed in Production in North Carolina are:
#1
97.2%
#2
74.2%
#3
62.5%
#4
60.8%
#5
52.9%
#6
47.1%
#7
46.4%
#8
44.7%
#9
39.9%
#10
39.6%
What city has the Highest Percentage of Population Employed in Production in North Carolina?
Fairfield has the Highest Percentage of Population Employed in Production in North Carolina with 97.2%.
What is the Percentage of Population Employed in Production in the State of North Carolina?
Percentage of Population Employed in Production in North Carolina is 6.6%.
What is the Percentage of Population Employed in Production in the United States?
Percentage of Population Employed in Production in the United States is 5.5%.