Cities with the Highest Percentage of Population Employed in Production in Minnesota
RELATED REPORTS & OPTIONS
Production
Minnesota
Compare Cities
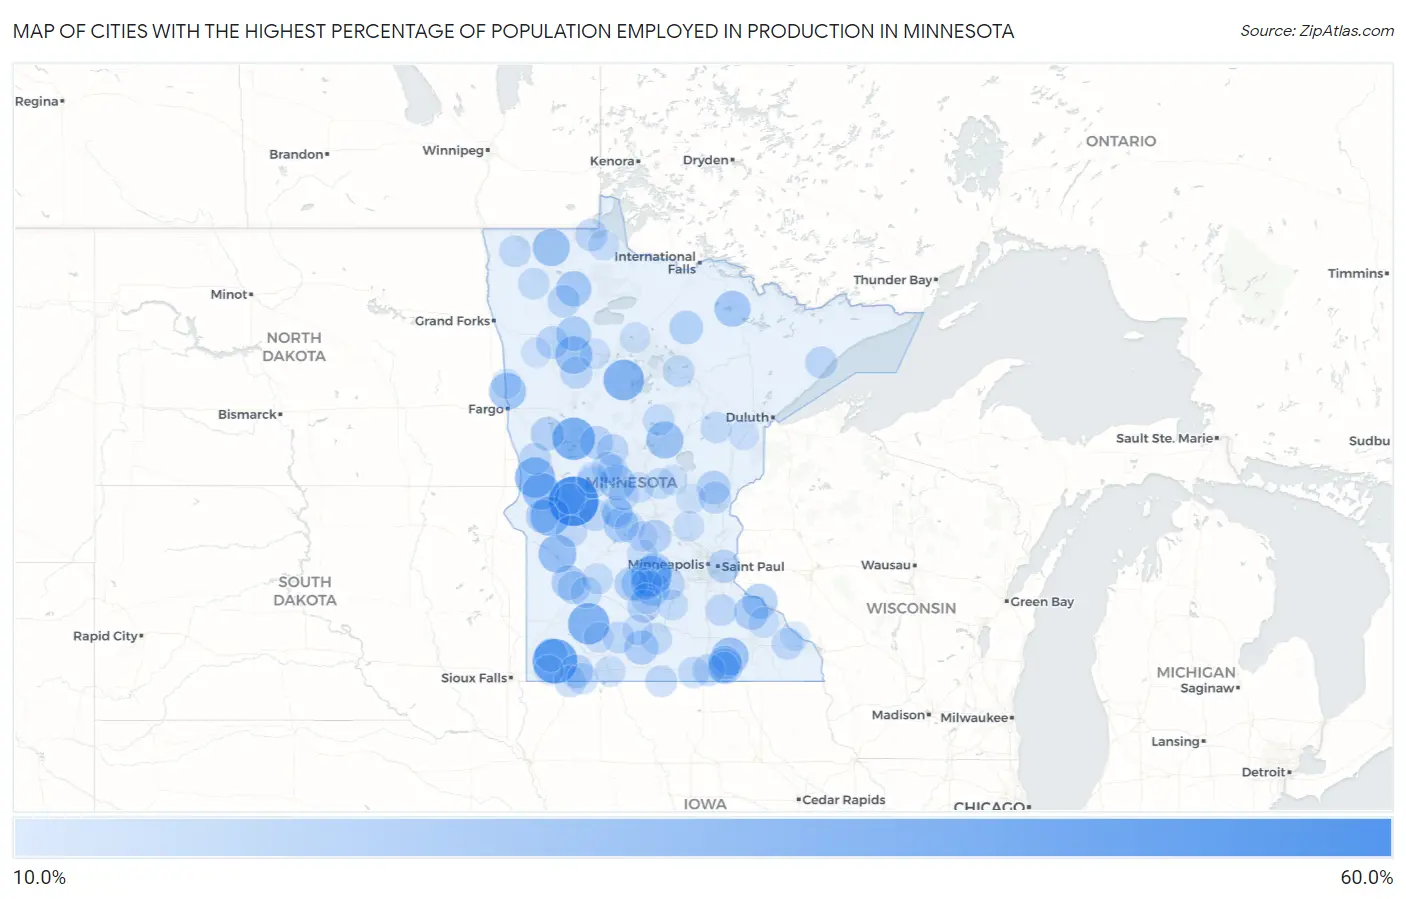
Map of Cities with the Highest Percentage of Population Employed in Production in Minnesota
0.0%
60.0%
Cities with the Highest Percentage of Population Employed in Production in Minnesota
| City | % Employed | vs State | vs National | |
| 1. | Farwell | 57.1% | 6.8%(+50.4)#1 | 5.5%(+51.7)#141 |
| 2. | Lismore | 47.0% | 6.8%(+40.2)#2 | 5.5%(+41.5)#241 |
| 3. | Richville | 42.1% | 6.8%(+35.3)#3 | 5.5%(+36.6)#313 |
| 4. | Revere | 40.0% | 6.8%(+33.2)#4 | 5.5%(+34.5)#353 |
| 5. | Laporte | 38.5% | 6.8%(+31.7)#5 | 5.5%(+33.0)#400 |
| 6. | Biscay | 38.0% | 6.8%(+31.2)#6 | 5.5%(+32.5)#411 |
| 7. | Nashua | 37.5% | 6.8%(+30.7)#7 | 5.5%(+32.0)#430 |
| 8. | Alberta | 35.7% | 6.8%(+28.9)#8 | 5.5%(+30.2)#475 |
| 9. | Milan | 32.9% | 6.8%(+26.1)#9 | 5.5%(+27.5)#598 |
| 10. | Norcross | 32.0% | 6.8%(+25.2)#10 | 5.5%(+26.5)#644 |
| 11. | Waltham | 31.6% | 6.8%(+24.8)#11 | 5.5%(+26.1)#667 |
| 12. | Lengby | 31.6% | 6.8%(+24.8)#12 | 5.5%(+26.1)#673 |
| 13. | Badger | 31.4% | 6.8%(+24.6)#13 | 5.5%(+25.9)#685 |
| 14. | Trommald | 31.1% | 6.8%(+24.3)#14 | 5.5%(+25.6)#700 |
| 15. | Georgetown | 30.8% | 6.8%(+24.0)#15 | 5.5%(+25.3)#726 |
| 16. | Orr | 28.8% | 6.8%(+22.0)#16 | 5.5%(+23.3)#855 |
| 17. | Long Prairie | 28.7% | 6.8%(+21.9)#17 | 5.5%(+23.3)#863 |
| 18. | Mapleview | 27.8% | 6.8%(+21.0)#18 | 5.5%(+22.3)#953 |
| 19. | Grygla | 27.7% | 6.8%(+20.9)#19 | 5.5%(+22.3)#957 |
| 20. | Lake Henry | 26.8% | 6.8%(+20.0)#20 | 5.5%(+21.3)#1,051 |
| 21. | Frontenac | 26.8% | 6.8%(+20.0)#21 | 5.5%(+21.3)#1,053 |
| 22. | Gully | 26.7% | 6.8%(+19.9)#22 | 5.5%(+21.2)#1,066 |
| 23. | Hazel Run | 25.9% | 6.8%(+19.1)#23 | 5.5%(+20.5)#1,144 |
| 24. | Bellechester | 25.8% | 6.8%(+19.1)#24 | 5.5%(+20.4)#1,153 |
| 25. | New Auburn | 25.8% | 6.8%(+19.0)#25 | 5.5%(+20.3)#1,164 |
| 26. | Lewisville | 25.5% | 6.8%(+18.7)#26 | 5.5%(+20.0)#1,197 |
| 27. | Stewart | 25.3% | 6.8%(+18.6)#27 | 5.5%(+19.9)#1,217 |
| 28. | Silver Lake | 25.2% | 6.8%(+18.4)#28 | 5.5%(+19.7)#1,238 |
| 29. | Lansing | 24.5% | 6.8%(+17.7)#29 | 5.5%(+19.1)#1,344 |
| 30. | Effie | 24.5% | 6.8%(+17.7)#30 | 5.5%(+19.0)#1,354 |
| 31. | Buffalo Lake | 24.4% | 6.8%(+17.6)#31 | 5.5%(+18.9)#1,365 |
| 32. | Quamba | 24.2% | 6.8%(+17.5)#32 | 5.5%(+18.8)#1,382 |
| 33. | Leota | 24.1% | 6.8%(+17.3)#33 | 5.5%(+18.6)#1,405 |
| 34. | Worthington | 24.0% | 6.8%(+17.2)#34 | 5.5%(+18.5)#1,426 |
| 35. | Pelican Rapids | 24.0% | 6.8%(+17.2)#35 | 5.5%(+18.5)#1,429 |
| 36. | Chokio | 23.7% | 6.8%(+16.9)#36 | 5.5%(+18.2)#1,479 |
| 37. | Bluffton | 23.3% | 6.8%(+16.5)#37 | 5.5%(+17.8)#1,545 |
| 38. | Landfall | 23.3% | 6.8%(+16.5)#38 | 5.5%(+17.8)#1,551 |
| 39. | Fairhaven | 23.0% | 6.8%(+16.2)#39 | 5.5%(+17.6)#1,591 |
| 40. | Lafayette | 22.6% | 6.8%(+15.8)#40 | 5.5%(+17.1)#1,664 |
| 41. | Hanley Falls | 22.5% | 6.8%(+15.7)#41 | 5.5%(+17.0)#1,680 |
| 42. | Goodridge | 22.2% | 6.8%(+15.4)#42 | 5.5%(+16.8)#1,735 |
| 43. | West Roy Lake | 22.2% | 6.8%(+15.4)#43 | 5.5%(+16.8)#1,742 |
| 44. | Warroad | 22.2% | 6.8%(+15.4)#44 | 5.5%(+16.7)#1,745 |
| 45. | Erskine | 22.0% | 6.8%(+15.2)#45 | 5.5%(+16.6)#1,767 |
| 46. | Grasston | 21.4% | 6.8%(+14.6)#46 | 5.5%(+16.0)#1,896 |
| 47. | Hamburg | 21.4% | 6.8%(+14.6)#47 | 5.5%(+15.9)#1,901 |
| 48. | Hayward | 21.4% | 6.8%(+14.6)#48 | 5.5%(+15.9)#1,910 |
| 49. | Finland | 21.2% | 6.8%(+14.4)#49 | 5.5%(+15.7)#1,946 |
| 50. | Foxhome | 21.1% | 6.8%(+14.3)#50 | 5.5%(+15.6)#1,990 |
| 51. | Aldrich | 21.1% | 6.8%(+14.3)#51 | 5.5%(+15.6)#1,994 |
| 52. | Sedan | 21.1% | 6.8%(+14.3)#52 | 5.5%(+15.6)#1,995 |
| 53. | Brownton | 20.9% | 6.8%(+14.1)#53 | 5.5%(+15.4)#2,037 |
| 54. | Carlos | 20.7% | 6.8%(+13.9)#54 | 5.5%(+15.2)#2,077 |
| 55. | Lewiston | 20.7% | 6.8%(+13.9)#55 | 5.5%(+15.2)#2,086 |
| 56. | Zemple | 20.6% | 6.8%(+13.9)#56 | 5.5%(+15.2)#2,096 |
| 57. | Lake Bronson | 20.6% | 6.8%(+13.8)#57 | 5.5%(+15.1)#2,111 |
| 58. | Bigelow | 20.5% | 6.8%(+13.7)#58 | 5.5%(+15.0)#2,138 |
| 59. | Elmore | 20.5% | 6.8%(+13.7)#59 | 5.5%(+15.0)#2,141 |
| 60. | Clontarf | 20.5% | 6.8%(+13.7)#60 | 5.5%(+15.0)#2,148 |
| 61. | Dennison | 20.4% | 6.8%(+13.6)#61 | 5.5%(+14.9)#2,157 |
| 62. | Darfur | 20.4% | 6.8%(+13.6)#62 | 5.5%(+14.9)#2,159 |
| 63. | Garden City | 20.2% | 6.8%(+13.4)#63 | 5.5%(+14.7)#2,215 |
| 64. | Eagle Bend | 20.1% | 6.8%(+13.3)#64 | 5.5%(+14.6)#2,233 |
| 65. | Meire Grove | 20.0% | 6.8%(+13.2)#65 | 5.5%(+14.5)#2,258 |
| 66. | Tamarack | 20.0% | 6.8%(+13.2)#66 | 5.5%(+14.5)#2,269 |
| 67. | Manhattan Beach | 20.0% | 6.8%(+13.2)#67 | 5.5%(+14.5)#2,278 |
| 68. | Austin | 20.0% | 6.8%(+13.2)#68 | 5.5%(+14.5)#2,281 |
| 69. | Newfolden | 19.9% | 6.8%(+13.1)#69 | 5.5%(+14.4)#2,292 |
| 70. | Echo | 19.8% | 6.8%(+13.1)#70 | 5.5%(+14.4)#2,313 |
| 71. | Conger | 19.7% | 6.8%(+12.9)#71 | 5.5%(+14.2)#2,357 |
| 72. | Round Lake | 19.6% | 6.8%(+12.8)#72 | 5.5%(+14.1)#2,376 |
| 73. | Greenwald | 19.5% | 6.8%(+12.7)#73 | 5.5%(+14.0)#2,412 |
| 74. | Le Sueur | 19.2% | 6.8%(+12.4)#74 | 5.5%(+13.7)#2,493 |
| 75. | Genola | 19.1% | 6.8%(+12.4)#75 | 5.5%(+13.7)#2,507 |
| 76. | Renville | 19.1% | 6.8%(+12.4)#76 | 5.5%(+13.7)#2,510 |
| 77. | Winthrop | 19.0% | 6.8%(+12.2)#77 | 5.5%(+13.5)#2,550 |
| 78. | Kensington | 19.0% | 6.8%(+12.2)#78 | 5.5%(+13.5)#2,575 |
| 79. | Clarissa | 18.9% | 6.8%(+12.1)#79 | 5.5%(+13.4)#2,595 |
| 80. | Sobieski | 18.9% | 6.8%(+12.1)#80 | 5.5%(+13.4)#2,602 |
| 81. | Roosevelt | 18.8% | 6.8%(+12.0)#81 | 5.5%(+13.3)#2,622 |
| 82. | Darwin | 18.7% | 6.8%(+11.9)#82 | 5.5%(+13.2)#2,664 |
| 83. | Grey Eagle | 18.6% | 6.8%(+11.8)#83 | 5.5%(+13.2)#2,692 |
| 84. | Jackson | 18.6% | 6.8%(+11.8)#84 | 5.5%(+13.1)#2,706 |
| 85. | Zimmerman | 18.5% | 6.8%(+11.7)#85 | 5.5%(+13.0)#2,747 |
| 86. | Millville | 18.4% | 6.8%(+11.6)#86 | 5.5%(+12.9)#2,782 |
| 87. | Mahtowa | 18.3% | 6.8%(+11.5)#87 | 5.5%(+12.8)#2,810 |
| 88. | Hanska | 18.3% | 6.8%(+11.5)#88 | 5.5%(+12.8)#2,815 |
| 89. | Shevlin | 18.3% | 6.8%(+11.5)#89 | 5.5%(+12.8)#2,818 |
| 90. | Jeffers | 18.2% | 6.8%(+11.5)#90 | 5.5%(+12.8)#2,831 |
| 91. | Roscoe | 18.2% | 6.8%(+11.4)#91 | 5.5%(+12.7)#2,865 |
| 92. | Hillman | 18.2% | 6.8%(+11.4)#92 | 5.5%(+12.7)#2,877 |
| 93. | Miltona | 18.1% | 6.8%(+11.4)#93 | 5.5%(+12.7)#2,884 |
| 94. | Blackduck | 18.0% | 6.8%(+11.2)#94 | 5.5%(+12.5)#2,938 |
| 95. | Watkins | 18.0% | 6.8%(+11.2)#95 | 5.5%(+12.5)#2,943 |
| 96. | Magnolia | 17.6% | 6.8%(+10.9)#96 | 5.5%(+12.2)#3,068 |
| 97. | Fertile | 17.5% | 6.8%(+10.8)#97 | 5.5%(+12.1)#3,106 |
| 98. | Perley | 17.5% | 6.8%(+10.8)#98 | 5.5%(+12.1)#3,110 |
| 99. | Bock | 17.4% | 6.8%(+10.6)#99 | 5.5%(+11.9)#3,175 |
| 100. | Goodview | 17.3% | 6.8%(+10.5)#100 | 5.5%(+11.9)#3,205 |
Common Questions
What are the Top 10 Cities with the Highest Percentage of Population Employed in Production in Minnesota?
Top 10 Cities with the Highest Percentage of Population Employed in Production in Minnesota are:
What city has the Highest Percentage of Population Employed in Production in Minnesota?
Farwell has the Highest Percentage of Population Employed in Production in Minnesota with 57.1%.
What is the Percentage of Population Employed in Production in the State of Minnesota?
Percentage of Population Employed in Production in Minnesota is 6.8%.
What is the Percentage of Population Employed in Production in the United States?
Percentage of Population Employed in Production in the United States is 5.5%.