Cities with the Highest Percentage of Population Employed in Production in Georgia
RELATED REPORTS & OPTIONS
Production
Georgia
Compare Cities
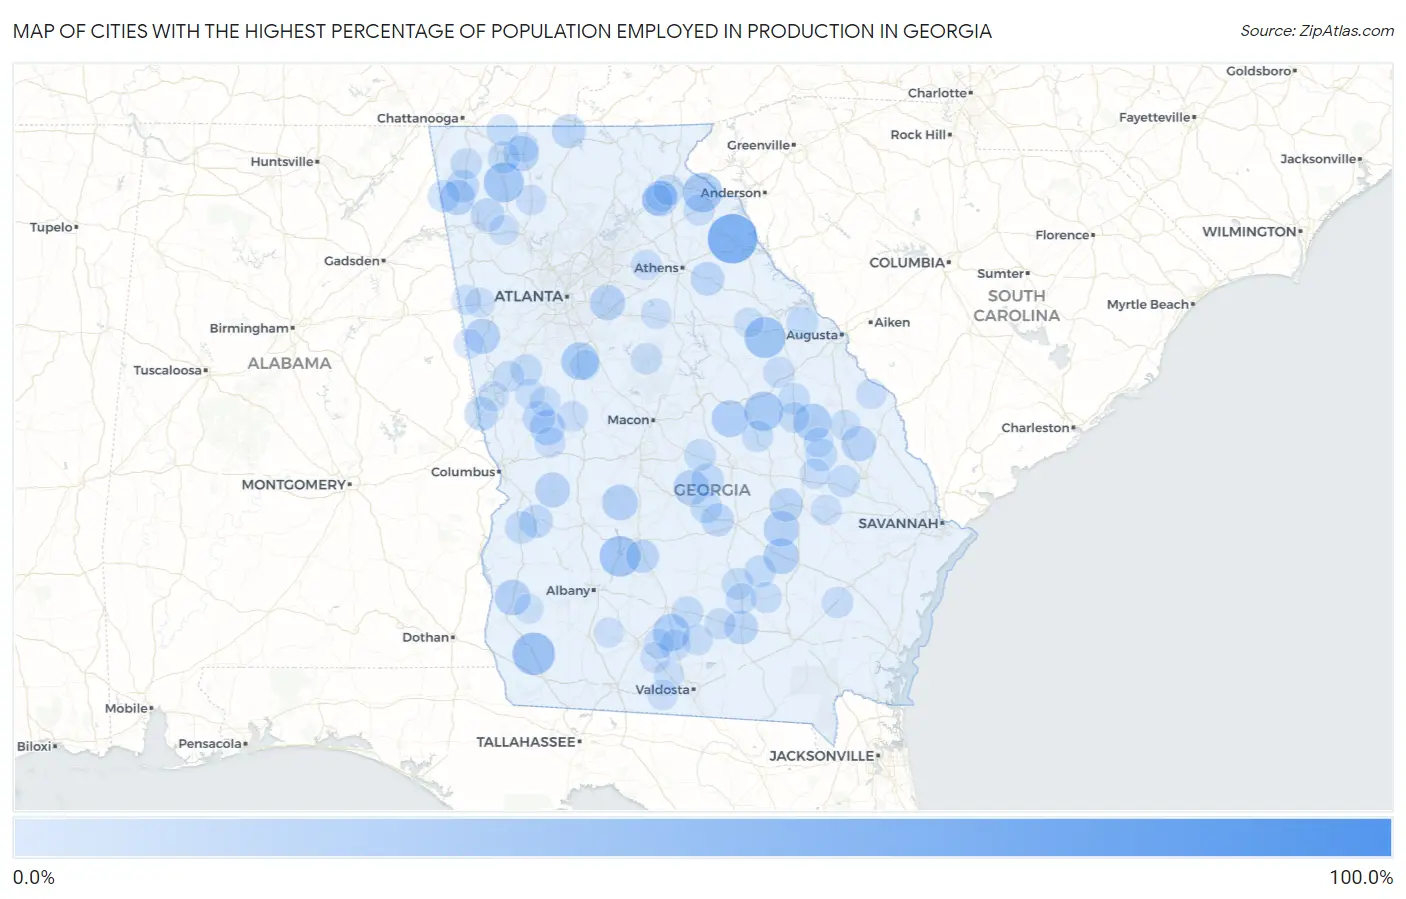
Map of Cities with the Highest Percentage of Population Employed in Production in Georgia
0.0%
100.0%
Cities with the Highest Percentage of Population Employed in Production in Georgia
| City | % Employed | vs State | vs National | |
| 1. | Dixie Union | 100.0% | 5.8%(+94.2)#1 | 5.5%(+94.5)#25 |
| 2. | Dewy Rose | 63.6% | 5.8%(+57.8)#2 | 5.5%(+58.2)#98 |
| 3. | Clyattville | 54.0% | 5.8%(+48.2)#3 | 5.5%(+48.5)#168 |
| 4. | Boykin | 46.2% | 5.8%(+40.3)#4 | 5.5%(+40.7)#256 |
| 5. | Camak | 42.5% | 5.8%(+36.7)#5 | 5.5%(+37.1)#302 |
| 6. | Warwick | 41.9% | 5.8%(+36.1)#6 | 5.5%(+36.4)#316 |
| 7. | Resaca | 39.8% | 5.8%(+34.0)#7 | 5.5%(+34.3)#364 |
| 8. | Avalon | 39.1% | 5.8%(+33.3)#8 | 5.5%(+33.7)#382 |
| 9. | Gardi | 37.9% | 5.8%(+32.1)#9 | 5.5%(+32.5)#414 |
| 10. | Riddleville | 37.9% | 5.8%(+32.0)#10 | 5.5%(+32.4)#420 |
| 11. | Experiment | 34.3% | 5.8%(+28.4)#11 | 5.5%(+28.8)#525 |
| 12. | Midville | 34.1% | 5.8%(+28.2)#12 | 5.5%(+28.6)#536 |
| 13. | Lenox | 33.3% | 5.8%(+27.4)#13 | 5.5%(+27.8)#586 |
| 14. | Oconee | 32.5% | 5.8%(+26.6)#14 | 5.5%(+27.0)#620 |
| 15. | Musella | 30.3% | 5.8%(+24.5)#15 | 5.5%(+24.8)#750 |
| 16. | Dooling | 30.0% | 5.8%(+24.2)#16 | 5.5%(+24.5)#764 |
| 17. | Graham | 29.8% | 5.8%(+24.0)#17 | 5.5%(+24.4)#778 |
| 18. | Bluffton | 29.7% | 5.8%(+23.9)#18 | 5.5%(+24.3)#783 |
| 19. | Uvalda | 29.4% | 5.8%(+23.6)#19 | 5.5%(+24.0)#805 |
| 20. | Alto | 29.1% | 5.8%(+23.3)#20 | 5.5%(+23.7)#831 |
| 21. | Empire | 29.1% | 5.8%(+23.2)#21 | 5.5%(+23.6)#834 |
| 22. | Lakeview Estates | 28.6% | 5.8%(+22.8)#22 | 5.5%(+23.2)#867 |
| 23. | Roopville | 28.6% | 5.8%(+22.7)#23 | 5.5%(+23.1)#870 |
| 24. | Chatsworth | 28.4% | 5.8%(+22.6)#24 | 5.5%(+22.9)#894 |
| 25. | Summerville | 28.2% | 5.8%(+22.4)#25 | 5.5%(+22.7)#917 |
| 26. | Woodland | 28.1% | 5.8%(+22.3)#26 | 5.5%(+22.6)#927 |
| 27. | Rocky Ford | 28.0% | 5.8%(+22.2)#27 | 5.5%(+22.6)#929 |
| 28. | Buena Vista | 27.7% | 5.8%(+21.8)#28 | 5.5%(+22.2)#962 |
| 29. | Box Springs | 27.5% | 5.8%(+21.7)#29 | 5.5%(+22.0)#977 |
| 30. | Waresboro | 27.1% | 5.8%(+21.2)#30 | 5.5%(+21.6)#1,026 |
| 31. | Epworth | 25.4% | 5.8%(+19.6)#31 | 5.5%(+19.9)#1,211 |
| 32. | Pearson | 25.3% | 5.8%(+19.4)#32 | 5.5%(+19.8)#1,223 |
| 33. | Crawford | 25.2% | 5.8%(+19.3)#33 | 5.5%(+19.7)#1,237 |
| 34. | Shannon | 24.7% | 5.8%(+18.9)#34 | 5.5%(+19.2)#1,321 |
| 35. | West Point | 24.7% | 5.8%(+18.9)#35 | 5.5%(+19.2)#1,322 |
| 36. | Higgston | 24.7% | 5.8%(+18.8)#36 | 5.5%(+19.2)#1,325 |
| 37. | Arabi | 24.0% | 5.8%(+18.2)#37 | 5.5%(+18.6)#1,413 |
| 38. | Richland | 23.8% | 5.8%(+17.9)#38 | 5.5%(+18.3)#1,457 |
| 39. | Trion | 23.5% | 5.8%(+17.6)#39 | 5.5%(+18.0)#1,508 |
| 40. | Chauncey | 23.3% | 5.8%(+17.5)#40 | 5.5%(+17.8)#1,541 |
| 41. | Manchester | 23.1% | 5.8%(+17.3)#41 | 5.5%(+17.6)#1,571 |
| 42. | Chester | 22.9% | 5.8%(+17.1)#42 | 5.5%(+17.4)#1,611 |
| 43. | Lumpkin | 22.2% | 5.8%(+16.4)#43 | 5.5%(+16.8)#1,718 |
| 44. | Naylor | 22.2% | 5.8%(+16.4)#44 | 5.5%(+16.8)#1,743 |
| 45. | Pulaski | 21.7% | 5.8%(+15.9)#45 | 5.5%(+16.3)#1,826 |
| 46. | Menlo | 21.4% | 5.8%(+15.5)#46 | 5.5%(+15.9)#1,906 |
| 47. | Twin City | 21.3% | 5.8%(+15.5)#47 | 5.5%(+15.9)#1,917 |
| 48. | Dalton | 21.1% | 5.8%(+15.2)#48 | 5.5%(+15.6)#1,984 |
| 49. | Allentown | 21.0% | 5.8%(+15.1)#49 | 5.5%(+15.5)#2,011 |
| 50. | Appling | 20.9% | 5.8%(+15.0)#50 | 5.5%(+15.4)#2,038 |
| 51. | Eastman | 20.6% | 5.8%(+14.7)#51 | 5.5%(+15.1)#2,118 |
| 52. | Broxton | 20.5% | 5.8%(+14.7)#52 | 5.5%(+15.1)#2,127 |
| 53. | Louisville | 20.5% | 5.8%(+14.6)#53 | 5.5%(+15.0)#2,139 |
| 54. | Enigma | 20.4% | 5.8%(+14.6)#54 | 5.5%(+14.9)#2,161 |
| 55. | Denton | 20.3% | 5.8%(+14.5)#55 | 5.5%(+14.9)#2,179 |
| 56. | Wrightsville | 20.2% | 5.8%(+14.3)#56 | 5.5%(+14.7)#2,210 |
| 57. | Faceville | 20.0% | 5.8%(+14.2)#57 | 5.5%(+14.5)#2,255 |
| 58. | Luthersville | 19.9% | 5.8%(+14.0)#58 | 5.5%(+14.4)#2,297 |
| 59. | Cohutta | 19.9% | 5.8%(+14.0)#59 | 5.5%(+14.4)#2,302 |
| 60. | Screven | 19.5% | 5.8%(+13.7)#60 | 5.5%(+14.0)#2,405 |
| 61. | Avera | 19.5% | 5.8%(+13.7)#61 | 5.5%(+14.0)#2,411 |
| 62. | Monticello | 19.4% | 5.8%(+13.6)#62 | 5.5%(+13.9)#2,440 |
| 63. | Lafayette | 19.3% | 5.8%(+13.4)#63 | 5.5%(+13.8)#2,464 |
| 64. | Willacoochee | 19.2% | 5.8%(+13.4)#64 | 5.5%(+13.7)#2,483 |
| 65. | Hogansville | 19.2% | 5.8%(+13.3)#65 | 5.5%(+13.7)#2,504 |
| 66. | Sparks | 18.9% | 5.8%(+13.1)#66 | 5.5%(+13.4)#2,591 |
| 67. | Nicholls | 18.9% | 5.8%(+13.1)#67 | 5.5%(+13.4)#2,592 |
| 68. | Baldwin | 18.9% | 5.8%(+13.1)#68 | 5.5%(+13.4)#2,597 |
| 69. | Douglas | 18.8% | 5.8%(+13.0)#69 | 5.5%(+13.3)#2,627 |
| 70. | Raoul | 18.7% | 5.8%(+12.8)#70 | 5.5%(+13.2)#2,673 |
| 71. | Wadley | 18.6% | 5.8%(+12.8)#71 | 5.5%(+13.2)#2,682 |
| 72. | Carnesville | 18.5% | 5.8%(+12.7)#72 | 5.5%(+13.1)#2,725 |
| 73. | Mount Airy | 18.5% | 5.8%(+12.6)#73 | 5.5%(+13.0)#2,746 |
| 74. | Lincoln Park | 18.3% | 5.8%(+12.5)#74 | 5.5%(+12.9)#2,794 |
| 75. | Rutledge | 18.1% | 5.8%(+12.3)#75 | 5.5%(+12.7)#2,892 |
| 76. | Millen | 18.0% | 5.8%(+12.2)#76 | 5.5%(+12.5)#2,931 |
| 77. | Talbotton | 18.0% | 5.8%(+12.2)#77 | 5.5%(+12.5)#2,932 |
| 78. | Nashville | 18.0% | 5.8%(+12.2)#78 | 5.5%(+12.5)#2,934 |
| 79. | Collins | 17.9% | 5.8%(+12.1)#79 | 5.5%(+12.5)#2,968 |
| 80. | Russell | 17.8% | 5.8%(+12.0)#80 | 5.5%(+12.4)#3,011 |
| 81. | Fairmount | 17.7% | 5.8%(+11.9)#81 | 5.5%(+12.2)#3,047 |
| 82. | Woodbury | 17.6% | 5.8%(+11.8)#82 | 5.5%(+12.2)#3,074 |
| 83. | Berlin | 17.5% | 5.8%(+11.6)#83 | 5.5%(+12.0)#3,142 |
| 84. | Stillmore | 17.4% | 5.8%(+11.6)#84 | 5.5%(+11.9)#3,162 |
| 85. | Girard | 17.4% | 5.8%(+11.6)#85 | 5.5%(+11.9)#3,165 |
| 86. | Kingston | 17.2% | 5.8%(+11.4)#86 | 5.5%(+11.8)#3,247 |
| 87. | Lagrange | 17.0% | 5.8%(+11.2)#87 | 5.5%(+11.5)#3,357 |
| 88. | Quitman | 16.9% | 5.8%(+11.1)#88 | 5.5%(+11.5)#3,389 |
| 89. | Morven | 16.9% | 5.8%(+11.1)#89 | 5.5%(+11.4)#3,404 |
| 90. | Ellenton | 16.8% | 5.8%(+11.0)#90 | 5.5%(+11.3)#3,454 |
| 91. | East Griffin | 16.7% | 5.8%(+10.9)#91 | 5.5%(+11.3)#3,472 |
| 92. | Ephesus | 16.7% | 5.8%(+10.8)#92 | 5.5%(+11.2)#3,501 |
| 93. | Sharon | 16.7% | 5.8%(+10.8)#93 | 5.5%(+11.2)#3,531 |
| 94. | Eton | 16.6% | 5.8%(+10.8)#94 | 5.5%(+11.2)#3,552 |
| 95. | Greenville | 16.6% | 5.8%(+10.8)#95 | 5.5%(+11.2)#3,555 |
| 96. | Tallapoosa | 16.5% | 5.8%(+10.7)#96 | 5.5%(+11.0)#3,612 |
| 97. | Bremen | 16.5% | 5.8%(+10.6)#97 | 5.5%(+11.0)#3,619 |
| 98. | Sale City | 16.5% | 5.8%(+10.6)#98 | 5.5%(+11.0)#3,634 |
| 99. | Arlington | 16.4% | 5.8%(+10.6)#99 | 5.5%(+10.9)#3,659 |
| 100. | Canoochee | 16.3% | 5.8%(+10.5)#100 | 5.5%(+10.9)#3,694 |
Common Questions
What are the Top 10 Cities with the Highest Percentage of Population Employed in Production in Georgia?
Top 10 Cities with the Highest Percentage of Population Employed in Production in Georgia are:
#1
63.6%
#2
46.2%
#3
42.5%
#4
41.9%
#5
39.8%
#6
39.1%
#7
37.9%
#8
34.3%
#9
34.1%
#10
33.3%
What city has the Highest Percentage of Population Employed in Production in Georgia?
Dewy Rose has the Highest Percentage of Population Employed in Production in Georgia with 63.6%.
What is the Percentage of Population Employed in Production in the State of Georgia?
Percentage of Population Employed in Production in Georgia is 5.8%.
What is the Percentage of Population Employed in Production in the United States?
Percentage of Population Employed in Production in the United States is 5.5%.