Cities with the Highest Percentage of Population Employed in Production in Iowa
RELATED REPORTS & OPTIONS
Production
Iowa
Compare Cities
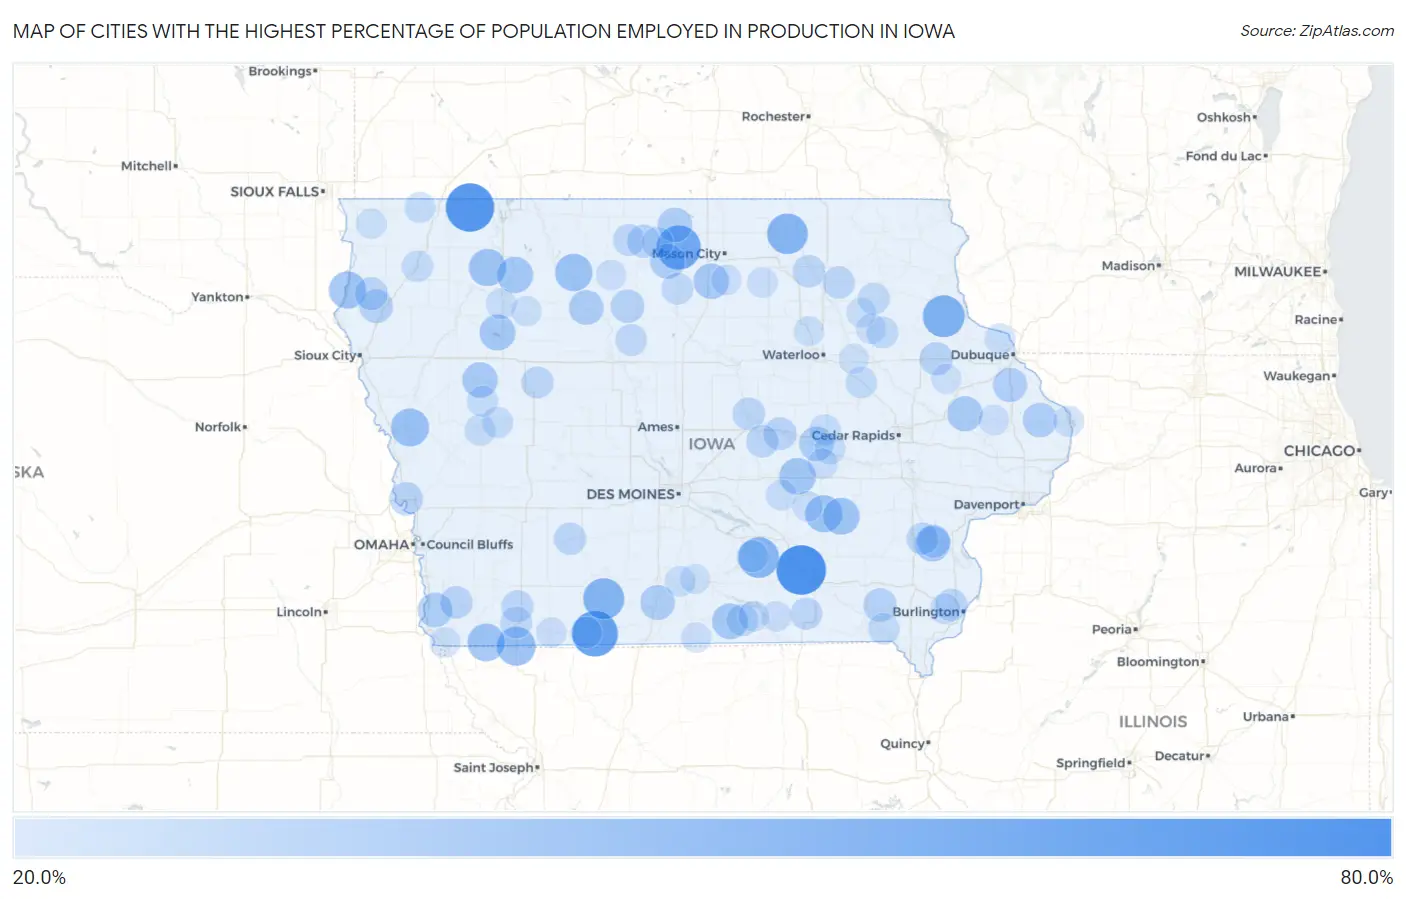
Map of Cities with the Highest Percentage of Population Employed in Production in Iowa
0.0%
80.0%
Cities with the Highest Percentage of Population Employed in Production in Iowa
| City | % Employed | vs State | vs National | |
| 1. | Chillicothe | 70.0% | 8.3%(+61.7)#1 | 5.5%(+64.5)#78 |
| 2. | Harris | 66.9% | 8.3%(+58.7)#2 | 5.5%(+61.5)#86 |
| 3. | Yarmouth | 64.8% | 8.3%(+56.5)#3 | 5.5%(+59.3)#92 |
| 4. | Montpelier | 62.2% | 8.3%(+53.9)#4 | 5.5%(+56.7)#107 |
| 5. | Delphos | 60.0% | 8.3%(+51.7)#5 | 5.5%(+54.5)#119 |
| 6. | Miller | 56.0% | 8.3%(+47.7)#6 | 5.5%(+50.5)#149 |
| 7. | Elkport | 50.0% | 8.3%(+41.7)#7 | 5.5%(+44.5)#208 |
| 8. | Shannon City | 47.9% | 8.3%(+39.7)#8 | 5.5%(+42.4)#228 |
| 9. | Hamilton | 46.9% | 8.3%(+38.6)#9 | 5.5%(+41.4)#244 |
| 10. | New Haven | 46.7% | 8.3%(+38.4)#10 | 5.5%(+41.2)#248 |
| 11. | Moscow | 46.4% | 8.3%(+38.1)#11 | 5.5%(+40.9)#250 |
| 12. | Braddyville | 41.8% | 8.3%(+33.6)#12 | 5.5%(+36.4)#321 |
| 13. | Kingston | 40.0% | 8.3%(+31.7)#13 | 5.5%(+34.5)#357 |
| 14. | Turin | 39.8% | 8.3%(+31.5)#14 | 5.5%(+34.3)#366 |
| 15. | Northboro | 39.0% | 8.3%(+30.7)#15 | 5.5%(+33.5)#385 |
| 16. | Rodman | 38.5% | 8.3%(+30.2)#16 | 5.5%(+33.0)#401 |
| 17. | Royal | 37.9% | 8.3%(+29.6)#17 | 5.5%(+32.4)#421 |
| 18. | Chatsworth | 37.8% | 8.3%(+29.6)#18 | 5.5%(+32.4)#423 |
| 19. | Thornburg | 37.5% | 8.3%(+29.2)#19 | 5.5%(+32.0)#429 |
| 20. | Webster | 37.1% | 8.3%(+28.8)#20 | 5.5%(+31.6)#438 |
| 21. | Malcom | 36.4% | 8.3%(+28.1)#21 | 5.5%(+30.9)#456 |
| 22. | Gillett Grove | 35.3% | 8.3%(+27.0)#22 | 5.5%(+29.8)#490 |
| 23. | Storm Lake | 34.6% | 8.3%(+26.3)#23 | 5.5%(+29.1)#515 |
| 24. | Promise City | 34.5% | 8.3%(+26.2)#24 | 5.5%(+29.0)#517 |
| 25. | Swaledale | 34.0% | 8.3%(+25.7)#25 | 5.5%(+28.5)#541 |
| 26. | Columbus City | 33.6% | 8.3%(+25.3)#26 | 5.5%(+28.1)#558 |
| 27. | Arthur | 33.3% | 8.3%(+25.1)#27 | 5.5%(+27.9)#565 |
| 28. | Center Junction | 32.5% | 8.3%(+24.2)#28 | 5.5%(+27.0)#619 |
| 29. | Van Wert | 32.2% | 8.3%(+23.9)#29 | 5.5%(+26.7)#634 |
| 30. | Duncan | 32.1% | 8.3%(+23.9)#30 | 5.5%(+26.7)#640 |
| 31. | Thurman | 31.6% | 8.3%(+23.4)#31 | 5.5%(+26.2)#664 |
| 32. | Bradgate | 31.6% | 8.3%(+23.3)#32 | 5.5%(+26.1)#671 |
| 33. | Leland | 31.5% | 8.3%(+23.2)#33 | 5.5%(+26.0)#676 |
| 34. | Chelsea | 31.1% | 8.3%(+22.8)#34 | 5.5%(+25.6)#703 |
| 35. | Spragueville | 30.8% | 8.3%(+22.5)#35 | 5.5%(+25.3)#722 |
| 36. | Zwingle | 30.4% | 8.3%(+22.2)#36 | 5.5%(+25.0)#741 |
| 37. | Brunsville | 29.0% | 8.3%(+20.7)#37 | 5.5%(+23.5)#841 |
| 38. | Hardy | 28.6% | 8.3%(+20.3)#38 | 5.5%(+23.1)#883 |
| 39. | Stockport | 28.4% | 8.3%(+20.1)#39 | 5.5%(+22.9)#895 |
| 40. | California Junction | 28.3% | 8.3%(+20.0)#40 | 5.5%(+22.8)#913 |
| 41. | Woden | 28.0% | 8.3%(+19.8)#41 | 5.5%(+22.6)#930 |
| 42. | Delaware | 27.8% | 8.3%(+19.6)#42 | 5.5%(+22.4)#945 |
| 43. | Columbus Junction | 27.5% | 8.3%(+19.3)#43 | 5.5%(+22.1)#974 |
| 44. | Montour | 27.0% | 8.3%(+18.8)#44 | 5.5%(+21.6)#1,028 |
| 45. | Craig | 26.8% | 8.3%(+18.6)#45 | 5.5%(+21.4)#1,048 |
| 46. | Randolph | 26.7% | 8.3%(+18.4)#46 | 5.5%(+21.2)#1,061 |
| 47. | Albion | 26.5% | 8.3%(+18.3)#47 | 5.5%(+21.1)#1,076 |
| 48. | Ferguson | 26.3% | 8.3%(+18.1)#48 | 5.5%(+20.8)#1,100 |
| 49. | Beaverdale | 26.2% | 8.3%(+17.9)#49 | 5.5%(+20.7)#1,109 |
| 50. | Ionia | 26.1% | 8.3%(+17.8)#50 | 5.5%(+20.6)#1,127 |
| 51. | Fontanelle | 25.8% | 8.3%(+17.6)#51 | 5.5%(+20.3)#1,156 |
| 52. | Fredericksburg | 25.6% | 8.3%(+17.3)#52 | 5.5%(+20.1)#1,184 |
| 53. | Drakesville | 25.0% | 8.3%(+16.7)#53 | 5.5%(+19.5)#1,264 |
| 54. | Plano | 25.0% | 8.3%(+16.7)#54 | 5.5%(+19.5)#1,275 |
| 55. | Cotter | 25.0% | 8.3%(+16.7)#55 | 5.5%(+19.5)#1,282 |
| 56. | Yetter | 25.0% | 8.3%(+16.7)#56 | 5.5%(+19.5)#1,284 |
| 57. | Hepburn | 25.0% | 8.3%(+16.7)#57 | 5.5%(+19.5)#1,285 |
| 58. | Titonka | 24.9% | 8.3%(+16.6)#58 | 5.5%(+19.4)#1,292 |
| 59. | Clarinda | 24.8% | 8.3%(+16.5)#59 | 5.5%(+19.3)#1,309 |
| 60. | Goodell | 24.7% | 8.3%(+16.5)#60 | 5.5%(+19.3)#1,315 |
| 61. | Vincent | 24.7% | 8.3%(+16.4)#61 | 5.5%(+19.2)#1,327 |
| 62. | Stanley | 24.3% | 8.3%(+16.1)#62 | 5.5%(+18.9)#1,373 |
| 63. | Randalia | 24.1% | 8.3%(+15.9)#63 | 5.5%(+18.7)#1,396 |
| 64. | Marysville | 24.0% | 8.3%(+15.7)#64 | 5.5%(+18.5)#1,423 |
| 65. | Maloy | 23.7% | 8.3%(+15.4)#65 | 5.5%(+18.2)#1,478 |
| 66. | Bonaparte | 23.6% | 8.3%(+15.4)#66 | 5.5%(+18.2)#1,485 |
| 67. | Hospers | 23.6% | 8.3%(+15.3)#67 | 5.5%(+18.1)#1,488 |
| 68. | Crystal Lake | 23.5% | 8.3%(+15.3)#68 | 5.5%(+18.1)#1,498 |
| 69. | Brandon | 23.3% | 8.3%(+15.1)#69 | 5.5%(+17.8)#1,536 |
| 70. | Elberon | 23.1% | 8.3%(+14.8)#70 | 5.5%(+17.6)#1,580 |
| 71. | Little Rock | 22.9% | 8.3%(+14.7)#71 | 5.5%(+17.5)#1,599 |
| 72. | Denison | 22.9% | 8.3%(+14.6)#72 | 5.5%(+17.4)#1,610 |
| 73. | Vail | 22.7% | 8.3%(+14.4)#73 | 5.5%(+17.2)#1,641 |
| 74. | Kiron | 22.6% | 8.3%(+14.3)#74 | 5.5%(+17.1)#1,661 |
| 75. | Belle Plaine | 22.5% | 8.3%(+14.3)#75 | 5.5%(+17.1)#1,672 |
| 76. | Searsboro | 22.4% | 8.3%(+14.1)#76 | 5.5%(+16.9)#1,695 |
| 77. | Sabula | 22.3% | 8.3%(+14.0)#77 | 5.5%(+16.8)#1,713 |
| 78. | Sherrill | 22.1% | 8.3%(+13.9)#78 | 5.5%(+16.7)#1,751 |
| 79. | Woodburn | 21.7% | 8.3%(+13.4)#79 | 5.5%(+16.2)#1,839 |
| 80. | Rembrandt | 21.6% | 8.3%(+13.4)#80 | 5.5%(+16.2)#1,844 |
| 81. | Hartwick | 21.6% | 8.3%(+13.3)#81 | 5.5%(+16.1)#1,869 |
| 82. | Middletown | 21.6% | 8.3%(+13.3)#82 | 5.5%(+16.1)#1,872 |
| 83. | Marble Rock | 21.5% | 8.3%(+13.3)#83 | 5.5%(+16.1)#1,877 |
| 84. | Baldwin | 21.4% | 8.3%(+13.2)#84 | 5.5%(+16.0)#1,895 |
| 85. | Udell | 21.4% | 8.3%(+13.2)#85 | 5.5%(+16.0)#1,900 |
| 86. | Hamburg | 21.3% | 8.3%(+13.0)#86 | 5.5%(+15.8)#1,924 |
| 87. | Oelwein | 21.2% | 8.3%(+13.0)#87 | 5.5%(+15.7)#1,940 |
| 88. | Irvington | 21.2% | 8.3%(+13.0)#88 | 5.5%(+15.7)#1,950 |
| 89. | Mystic | 21.2% | 8.3%(+12.9)#89 | 5.5%(+15.7)#1,957 |
| 90. | Barnes City | 21.2% | 8.3%(+12.9)#90 | 5.5%(+15.7)#1,963 |
| 91. | Bedford | 21.1% | 8.3%(+12.8)#91 | 5.5%(+15.6)#1,983 |
| 92. | Clio | 21.1% | 8.3%(+12.8)#92 | 5.5%(+15.6)#1,993 |
| 93. | Rockwell | 20.9% | 8.3%(+12.7)#93 | 5.5%(+15.5)#2,015 |
| 94. | Janesville | 20.9% | 8.3%(+12.7)#94 | 5.5%(+15.4)#2,025 |
| 95. | Albert City | 20.9% | 8.3%(+12.6)#95 | 5.5%(+15.4)#2,026 |
| 96. | Alvord | 20.9% | 8.3%(+12.6)#96 | 5.5%(+15.4)#2,039 |
| 97. | Hopkinton | 20.8% | 8.3%(+12.6)#97 | 5.5%(+15.4)#2,057 |
| 98. | Westgate | 20.6% | 8.3%(+12.3)#98 | 5.5%(+15.1)#2,110 |
| 99. | Lucas | 20.5% | 8.3%(+12.2)#99 | 5.5%(+15.0)#2,146 |
| 100. | Jesup | 20.4% | 8.3%(+12.2)#100 | 5.5%(+14.9)#2,155 |
Common Questions
What are the Top 10 Cities with the Highest Percentage of Population Employed in Production in Iowa?
Top 10 Cities with the Highest Percentage of Population Employed in Production in Iowa are:
#1
70.0%
#2
66.9%
#3
60.0%
#4
56.0%
#5
50.0%
#6
47.9%
#7
46.9%
#8
46.7%
#9
41.8%
#10
39.8%
What city has the Highest Percentage of Population Employed in Production in Iowa?
Chillicothe has the Highest Percentage of Population Employed in Production in Iowa with 70.0%.
What is the Percentage of Population Employed in Production in the State of Iowa?
Percentage of Population Employed in Production in Iowa is 8.3%.
What is the Percentage of Population Employed in Production in the United States?
Percentage of Population Employed in Production in the United States is 5.5%.