Cities with the Highest Percentage of Population Employed in Production in Indiana
RELATED REPORTS & OPTIONS
Production
Indiana
Compare Cities
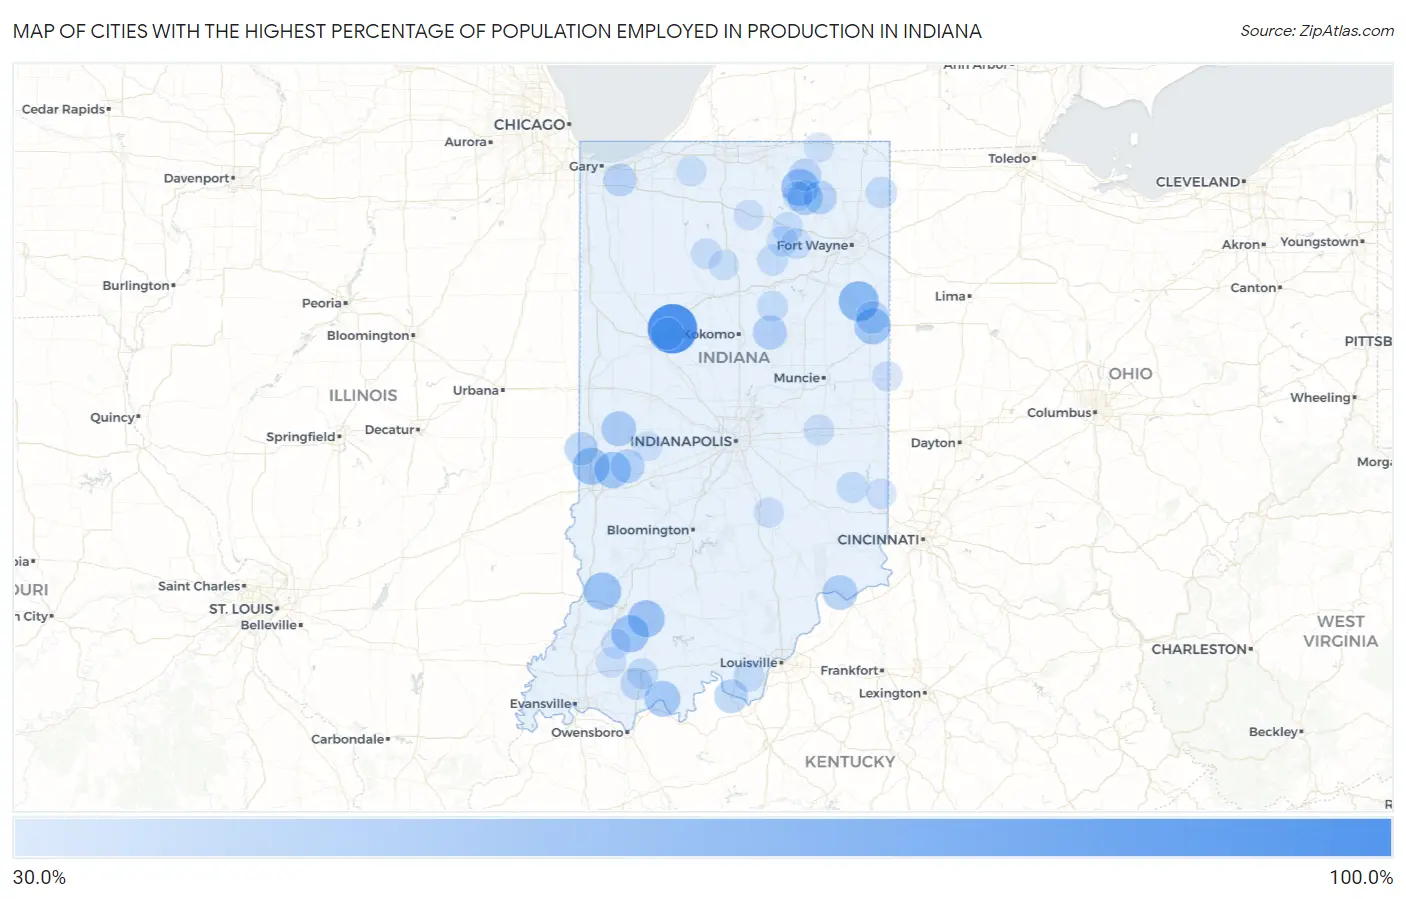
Map of Cities with the Highest Percentage of Population Employed in Production in Indiana
0.0%
100.0%
Cities with the Highest Percentage of Population Employed in Production in Indiana
| City | % Employed | vs State | vs National | |
| 1. | Boggstown | 100.0% | 10.1%(+89.9)#1 | 5.5%(+94.5)#1 |
| 2. | Cates | 100.0% | 10.1%(+89.9)#2 | 5.5%(+94.5)#7 |
| 3. | Heltonville | 100.0% | 10.1%(+89.9)#3 | 5.5%(+94.5)#10 |
| 4. | Burrows | 100.0% | 10.1%(+89.9)#4 | 5.5%(+94.5)#12 |
| 5. | Colburn | 100.0% | 10.1%(+89.9)#5 | 5.5%(+94.5)#18 |
| 6. | Vistula | 100.0% | 10.1%(+89.9)#6 | 5.5%(+94.5)#28 |
| 7. | Spartanburg | 100.0% | 10.1%(+89.9)#7 | 5.5%(+94.5)#29 |
| 8. | Helmer | 100.0% | 10.1%(+89.9)#8 | 5.5%(+94.5)#34 |
| 9. | Elrod | 100.0% | 10.1%(+89.9)#9 | 5.5%(+94.5)#43 |
| 10. | Wolflake | 80.6% | 10.1%(+70.5)#10 | 5.5%(+75.2)#58 |
| 11. | Eugene | 76.9% | 10.1%(+66.8)#11 | 5.5%(+71.5)#65 |
| 12. | Thayer | 75.6% | 10.1%(+65.5)#12 | 5.5%(+70.1)#67 |
| 13. | Holiday Woods | 74.1% | 10.1%(+64.0)#13 | 5.5%(+68.6)#73 |
| 14. | Ireland | 69.8% | 10.1%(+59.7)#14 | 5.5%(+64.4)#79 |
| 15. | South Milford | 67.4% | 10.1%(+57.3)#15 | 5.5%(+62.0)#85 |
| 16. | Vera Cruz | 64.7% | 10.1%(+54.6)#16 | 5.5%(+59.2)#93 |
| 17. | Leopold | 63.6% | 10.1%(+53.5)#17 | 5.5%(+58.2)#99 |
| 18. | Liberty Mills | 63.5% | 10.1%(+53.4)#18 | 5.5%(+58.0)#100 |
| 19. | Graysville | 63.2% | 10.1%(+53.0)#19 | 5.5%(+57.7)#102 |
| 20. | Tyner | 62.7% | 10.1%(+52.6)#20 | 5.5%(+57.2)#103 |
| 21. | Bear Lake | 61.5% | 10.1%(+51.4)#21 | 5.5%(+56.1)#110 |
| 22. | Burnett | 61.3% | 10.1%(+51.2)#22 | 5.5%(+55.8)#111 |
| 23. | Cass | 60.0% | 10.1%(+49.9)#23 | 5.5%(+54.5)#120 |
| 24. | Blooming Grove | 59.6% | 10.1%(+49.5)#24 | 5.5%(+54.1)#124 |
| 25. | Liberty Center | 59.3% | 10.1%(+49.1)#25 | 5.5%(+53.8)#126 |
| 26. | Coal | 59.1% | 10.1%(+49.0)#26 | 5.5%(+53.6)#128 |
| 27. | Jefferson | 58.2% | 10.1%(+48.1)#27 | 5.5%(+52.7)#133 |
| 28. | Grantsburg | 57.1% | 10.1%(+47.0)#28 | 5.5%(+51.7)#139 |
| 29. | Otwell | 55.7% | 10.1%(+45.6)#29 | 5.5%(+50.3)#151 |
| 30. | Ragsdale | 55.6% | 10.1%(+45.4)#30 | 5.5%(+50.1)#153 |
| 31. | Ligonier | 55.5% | 10.1%(+45.4)#31 | 5.5%(+50.0)#154 |
| 32. | Alfordsville | 54.5% | 10.1%(+44.4)#32 | 5.5%(+49.1)#163 |
| 33. | Shepardsville | 54.3% | 10.1%(+44.2)#33 | 5.5%(+48.9)#165 |
| 34. | Laud | 52.9% | 10.1%(+42.8)#34 | 5.5%(+47.5)#176 |
| 35. | Bryant | 52.2% | 10.1%(+42.1)#35 | 5.5%(+46.7)#182 |
| 36. | Fontanet | 51.9% | 10.1%(+41.8)#36 | 5.5%(+46.5)#183 |
| 37. | Troy | 49.7% | 10.1%(+39.6)#37 | 5.5%(+44.3)#211 |
| 38. | Center | 48.9% | 10.1%(+38.8)#38 | 5.5%(+43.4)#217 |
| 39. | Lewis | 48.7% | 10.1%(+38.6)#39 | 5.5%(+43.2)#219 |
| 40. | Stewartsville | 48.5% | 10.1%(+38.3)#40 | 5.5%(+43.0)#222 |
| 41. | Kimmell | 47.7% | 10.1%(+37.6)#41 | 5.5%(+42.3)#230 |
| 42. | Marshall | 47.2% | 10.1%(+37.1)#42 | 5.5%(+41.7)#237 |
| 43. | Brooksburg | 46.2% | 10.1%(+36.0)#43 | 5.5%(+40.7)#255 |
| 44. | Miami | 45.4% | 10.1%(+35.3)#44 | 5.5%(+39.9)#261 |
| 45. | Sims | 44.8% | 10.1%(+34.7)#45 | 5.5%(+39.4)#267 |
| 46. | Cassville | 44.6% | 10.1%(+34.4)#46 | 5.5%(+39.1)#271 |
| 47. | Morris | 44.4% | 10.1%(+34.3)#47 | 5.5%(+38.9)#275 |
| 48. | Carbon | 43.7% | 10.1%(+33.5)#48 | 5.5%(+38.2)#281 |
| 49. | Lucerne | 43.7% | 10.1%(+33.5)#49 | 5.5%(+38.2)#283 |
| 50. | Wildwood | 42.9% | 10.1%(+32.7)#50 | 5.5%(+37.4)#294 |
| 51. | Mauckport | 42.9% | 10.1%(+32.7)#51 | 5.5%(+37.4)#298 |
| 52. | Albion | 42.3% | 10.1%(+32.2)#52 | 5.5%(+36.9)#309 |
| 53. | St Bernice | 42.2% | 10.1%(+32.1)#53 | 5.5%(+36.8)#312 |
| 54. | Sardinia | 41.0% | 10.1%(+30.9)#54 | 5.5%(+35.6)#333 |
| 55. | Geneva | 40.5% | 10.1%(+30.4)#55 | 5.5%(+35.1)#346 |
| 56. | Petersville | 39.8% | 10.1%(+29.7)#56 | 5.5%(+34.3)#365 |
| 57. | Wheeler | 39.5% | 10.1%(+29.4)#57 | 5.5%(+34.0)#371 |
| 58. | Topeka | 39.4% | 10.1%(+29.3)#58 | 5.5%(+33.9)#374 |
| 59. | Leiters Ford | 39.4% | 10.1%(+29.2)#59 | 5.5%(+33.9)#375 |
| 60. | Needmore | 38.8% | 10.1%(+28.6)#60 | 5.5%(+33.3)#390 |
| 61. | Libertyville | 38.7% | 10.1%(+28.5)#61 | 5.5%(+33.2)#394 |
| 62. | Buck Creek | 38.6% | 10.1%(+28.5)#62 | 5.5%(+33.1)#395 |
| 63. | Bippus | 38.2% | 10.1%(+28.1)#63 | 5.5%(+32.7)#405 |
| 64. | Gentryville | 37.2% | 10.1%(+27.1)#64 | 5.5%(+31.8)#435 |
| 65. | Forest | 36.4% | 10.1%(+26.2)#65 | 5.5%(+30.9)#454 |
| 66. | Servia | 35.8% | 10.1%(+25.6)#66 | 5.5%(+30.3)#471 |
| 67. | Schnellville | 35.6% | 10.1%(+25.4)#67 | 5.5%(+30.1)#480 |
| 68. | Twelve Mile | 35.2% | 10.1%(+25.0)#68 | 5.5%(+29.7)#495 |
| 69. | Butler | 35.0% | 10.1%(+24.9)#69 | 5.5%(+29.5)#502 |
| 70. | Lake Everett | 34.8% | 10.1%(+24.7)#70 | 5.5%(+29.4)#509 |
| 71. | Hillisburg | 34.8% | 10.1%(+24.7)#71 | 5.5%(+29.3)#511 |
| 72. | Dale | 34.8% | 10.1%(+24.6)#72 | 5.5%(+29.3)#512 |
| 73. | Ontario | 34.3% | 10.1%(+24.2)#73 | 5.5%(+28.8)#524 |
| 74. | Metamora | 34.1% | 10.1%(+24.0)#74 | 5.5%(+28.7)#530 |
| 75. | Pierceton | 34.1% | 10.1%(+24.0)#75 | 5.5%(+28.7)#533 |
| 76. | Palestine | 33.7% | 10.1%(+23.6)#76 | 5.5%(+28.3)#551 |
| 77. | Somerset | 33.6% | 10.1%(+23.5)#77 | 5.5%(+28.2)#556 |
| 78. | Laketon | 33.5% | 10.1%(+23.4)#78 | 5.5%(+28.1)#559 |
| 79. | Fairbanks | 33.5% | 10.1%(+23.4)#79 | 5.5%(+28.0)#560 |
| 80. | New Middletown | 33.3% | 10.1%(+23.2)#80 | 5.5%(+27.9)#575 |
| 81. | Sidney | 33.3% | 10.1%(+23.2)#81 | 5.5%(+27.9)#576 |
| 82. | Millgrove | 33.3% | 10.1%(+23.2)#82 | 5.5%(+27.9)#579 |
| 83. | Kewanna | 33.2% | 10.1%(+23.1)#83 | 5.5%(+27.7)#588 |
| 84. | South Whitley | 32.7% | 10.1%(+22.6)#84 | 5.5%(+27.2)#610 |
| 85. | Spiceland | 32.7% | 10.1%(+22.5)#85 | 5.5%(+27.2)#613 |
| 86. | Mount Carmel | 31.8% | 10.1%(+21.7)#86 | 5.5%(+26.3)#653 |
| 87. | Enchanted Hills | 31.7% | 10.1%(+21.6)#87 | 5.5%(+26.3)#659 |
| 88. | Etna Green | 31.6% | 10.1%(+21.5)#88 | 5.5%(+26.2)#661 |
| 89. | Spurgeon | 31.6% | 10.1%(+21.5)#89 | 5.5%(+26.1)#669 |
| 90. | Union City | 31.5% | 10.1%(+21.3)#90 | 5.5%(+26.0)#677 |
| 91. | Clifford | 31.2% | 10.1%(+21.1)#91 | 5.5%(+25.8)#691 |
| 92. | Maples | 31.2% | 10.1%(+21.1)#92 | 5.5%(+25.8)#693 |
| 93. | Winslow | 31.2% | 10.1%(+21.1)#93 | 5.5%(+25.7)#696 |
| 94. | Fish Lake | 31.1% | 10.1%(+21.0)#94 | 5.5%(+25.6)#699 |
| 95. | Fulton | 31.0% | 10.1%(+20.8)#95 | 5.5%(+25.5)#710 |
| 96. | Cromwell | 30.9% | 10.1%(+20.8)#96 | 5.5%(+25.5)#712 |
| 97. | Reddington | 30.6% | 10.1%(+20.5)#97 | 5.5%(+25.1)#732 |
| 98. | Van Bibber Lake | 30.4% | 10.1%(+20.3)#98 | 5.5%(+24.9)#742 |
| 99. | Commiskey | 30.4% | 10.1%(+20.2)#99 | 5.5%(+24.9)#745 |
| 100. | Howe | 30.3% | 10.1%(+20.2)#100 | 5.5%(+24.9)#746 |
Common Questions
What are the Top 10 Cities with the Highest Percentage of Population Employed in Production in Indiana?
Top 10 Cities with the Highest Percentage of Population Employed in Production in Indiana are:
#1
100.0%
#2
64.7%
#3
55.7%
#4
55.6%
#5
55.5%
#6
54.5%
#7
54.3%
#8
52.2%
#9
51.9%
#10
49.7%
What city has the Highest Percentage of Population Employed in Production in Indiana?
Colburn has the Highest Percentage of Population Employed in Production in Indiana with 100.0%.
What is the Percentage of Population Employed in Production in the State of Indiana?
Percentage of Population Employed in Production in Indiana is 10.1%.
What is the Percentage of Population Employed in Production in the United States?
Percentage of Population Employed in Production in the United States is 5.5%.