Cities with the Highest Percentage of Population Employed in Production in Maine
RELATED REPORTS & OPTIONS
Production
Maine
Compare Cities
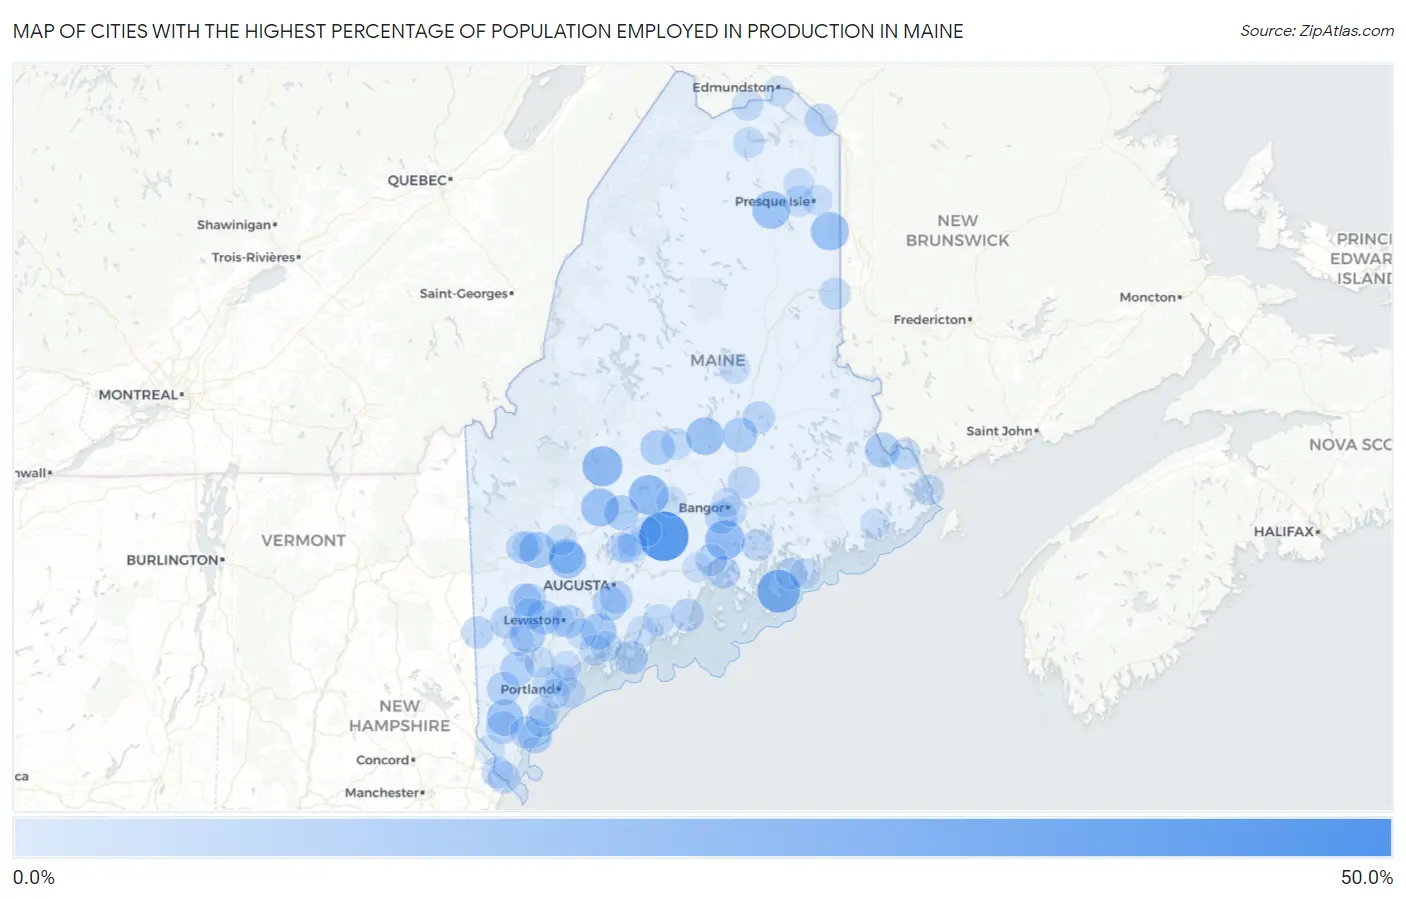
Map of Cities with the Highest Percentage of Population Employed in Production in Maine
0.0%
50.0%
Cities with the Highest Percentage of Population Employed in Production in Maine
| City | % Employed | vs State | vs National | |
| 1. | Milbridge | 40.7% | 5.4%(+35.3)#1 | 5.5%(+35.2)#344 |
| 2. | Unity | 37.1% | 5.4%(+31.7)#2 | 5.5%(+31.6)#439 |
| 3. | Sabattus | 30.9% | 5.4%(+25.5)#3 | 5.5%(+25.5)#713 |
| 4. | Southwest Harbor | 25.0% | 5.4%(+19.6)#4 | 5.5%(+19.5)#1,248 |
| 5. | Grand Isle | 21.1% | 5.4%(+15.7)#5 | 5.5%(+15.7)#1,971 |
| 6. | Bingham | 19.9% | 5.4%(+14.5)#6 | 5.5%(+14.5)#2,290 |
| 7. | Hartland | 19.6% | 5.4%(+14.2)#7 | 5.5%(+14.2)#2,370 |
| 8. | Bucksport | 19.0% | 5.4%(+13.6)#8 | 5.5%(+13.6)#2,547 |
| 9. | Blaine | 16.8% | 5.4%(+11.4)#9 | 5.5%(+11.3)#3,468 |
| 10. | Anson | 16.4% | 5.4%(+11.0)#10 | 5.5%(+10.9)#3,664 |
| 11. | Milo | 16.2% | 5.4%(+10.8)#11 | 5.5%(+10.7)#3,771 |
| 12. | Ashland | 16.0% | 5.4%(+10.6)#12 | 5.5%(+10.5)#3,857 |
| 13. | Livermore Falls | 14.8% | 5.4%(+9.35)#13 | 5.5%(+9.29)#4,567 |
| 14. | Alfred | 13.8% | 5.4%(+8.34)#14 | 5.5%(+8.28)#5,166 |
| 15. | Dixfield | 13.6% | 5.4%(+8.21)#15 | 5.5%(+8.15)#5,265 |
| 16. | Mattawamkeag | 13.1% | 5.4%(+7.69)#16 | 5.5%(+7.63)#5,685 |
| 17. | Bowdoinham | 12.3% | 5.4%(+6.89)#17 | 5.5%(+6.83)#6,371 |
| 18. | Casco | 12.0% | 5.4%(+6.57)#18 | 5.5%(+6.51)#6,652 |
| 19. | Chisholm | 11.5% | 5.4%(+6.08)#19 | 5.5%(+6.02)#7,150 |
| 20. | Woodland | 11.4% | 5.4%(+6.03)#20 | 5.5%(+5.97)#7,196 |
| 21. | Skowhegan | 11.1% | 5.4%(+5.72)#21 | 5.5%(+5.66)#7,492 |
| 22. | Howland | 11.1% | 5.4%(+5.65)#22 | 5.5%(+5.59)#7,593 |
| 23. | Guilford | 10.9% | 5.4%(+5.51)#23 | 5.5%(+5.45)#7,743 |
| 24. | South Berwick | 10.5% | 5.4%(+5.13)#24 | 5.5%(+5.07)#8,096 |
| 25. | Gardiner | 10.1% | 5.4%(+4.67)#25 | 5.5%(+4.61)#8,653 |
| 26. | Kennebunkport | 10.0% | 5.4%(+4.61)#26 | 5.5%(+4.55)#8,716 |
| 27. | Mechanic Falls | 10.0% | 5.4%(+4.57)#27 | 5.5%(+4.51)#8,783 |
| 28. | Steep Falls | 10.0% | 5.4%(+4.56)#28 | 5.5%(+4.50)#8,793 |
| 29. | Boothbay Harbor | 9.3% | 5.4%(+3.87)#29 | 5.5%(+3.81)#9,612 |
| 30. | Lake Arrowhead | 9.2% | 5.4%(+3.82)#30 | 5.5%(+3.76)#9,669 |
| 31. | Corinna | 8.8% | 5.4%(+3.44)#31 | 5.5%(+3.38)#10,173 |
| 32. | Randolph | 8.3% | 5.4%(+2.84)#32 | 5.5%(+2.78)#11,009 |
| 33. | Sanford | 8.1% | 5.4%(+2.65)#33 | 5.5%(+2.59)#11,275 |
| 34. | Hampden | 8.1% | 5.4%(+2.65)#34 | 5.5%(+2.59)#11,277 |
| 35. | South Paris | 8.1% | 5.4%(+2.64)#35 | 5.5%(+2.58)#11,287 |
| 36. | Norway | 8.0% | 5.4%(+2.59)#36 | 5.5%(+2.53)#11,371 |
| 37. | Lewiston | 7.9% | 5.4%(+2.45)#37 | 5.5%(+2.39)#11,569 |
| 38. | Van Buren | 7.8% | 5.4%(+2.40)#38 | 5.5%(+2.34)#11,659 |
| 39. | Rockland | 7.8% | 5.4%(+2.40)#39 | 5.5%(+2.34)#11,660 |
| 40. | Rumford | 7.3% | 5.4%(+1.90)#40 | 5.5%(+1.84)#12,472 |
| 41. | Lincoln | 7.2% | 5.4%(+1.77)#41 | 5.5%(+1.71)#12,675 |
| 42. | Kennebunk | 7.1% | 5.4%(+1.66)#42 | 5.5%(+1.60)#12,872 |
| 43. | Bethel | 7.0% | 5.4%(+1.57)#43 | 5.5%(+1.51)#13,023 |
| 44. | Castine | 6.9% | 5.4%(+1.53)#44 | 5.5%(+1.47)#13,088 |
| 45. | Fryeburg | 6.9% | 5.4%(+1.53)#45 | 5.5%(+1.47)#13,090 |
| 46. | Milford | 6.8% | 5.4%(+1.43)#46 | 5.5%(+1.37)#13,258 |
| 47. | Kittery | 6.8% | 5.4%(+1.38)#47 | 5.5%(+1.32)#13,339 |
| 48. | Bridgton | 6.6% | 5.4%(+1.22)#48 | 5.5%(+1.16)#13,620 |
| 49. | Ellsworth | 6.5% | 5.4%(+1.12)#49 | 5.5%(+1.05)#13,804 |
| 50. | Turner | 6.5% | 5.4%(+1.09)#50 | 5.5%(+1.03)#13,846 |
| 51. | Searsport | 6.4% | 5.4%(+1.03)#51 | 5.5%(+0.974)#13,936 |
| 52. | Houlton | 6.4% | 5.4%(+0.949)#52 | 5.5%(+0.889)#14,078 |
| 53. | Oxford | 6.2% | 5.4%(+0.782)#53 | 5.5%(+0.722)#14,388 |
| 54. | South Eliot | 6.1% | 5.4%(+0.664)#54 | 5.5%(+0.603)#14,592 |
| 55. | Calais | 5.9% | 5.4%(+0.501)#55 | 5.5%(+0.440)#14,890 |
| 56. | Waldoboro | 5.8% | 5.4%(+0.351)#56 | 5.5%(+0.291)#15,196 |
| 57. | Dover Foxcroft | 5.7% | 5.4%(+0.314)#57 | 5.5%(+0.254)#15,262 |
| 58. | Bar Harbor | 5.7% | 5.4%(+0.295)#58 | 5.5%(+0.235)#15,311 |
| 59. | Fort Kent | 5.4% | 5.4%(-0.033)#59 | 5.5%(-0.093)#15,957 |
| 60. | Biddeford | 5.2% | 5.4%(-0.201)#60 | 5.5%(-0.262)#16,275 |
| 61. | North Anson | 5.2% | 5.4%(-0.220)#61 | 5.5%(-0.280)#16,313 |
| 62. | Auburn | 5.2% | 5.4%(-0.227)#62 | 5.5%(-0.287)#16,328 |
| 63. | Kingfield | 5.1% | 5.4%(-0.289)#63 | 5.5%(-0.349)#16,434 |
| 64. | Mapleton | 5.1% | 5.4%(-0.328)#64 | 5.5%(-0.388)#16,505 |
| 65. | Falmouth | 5.0% | 5.4%(-0.437)#65 | 5.5%(-0.498)#16,713 |
| 66. | Saco | 4.9% | 5.4%(-0.462)#66 | 5.5%(-0.522)#16,764 |
| 67. | Eastport | 4.8% | 5.4%(-0.594)#67 | 5.5%(-0.655)#17,021 |
| 68. | Brunswick | 4.8% | 5.4%(-0.598)#68 | 5.5%(-0.658)#17,026 |
| 69. | Eagle Lake | 4.8% | 5.4%(-0.646)#69 | 5.5%(-0.707)#17,117 |
| 70. | Bath | 4.7% | 5.4%(-0.681)#70 | 5.5%(-0.742)#17,202 |
| 71. | Brewer | 4.7% | 5.4%(-0.706)#71 | 5.5%(-0.766)#17,252 |
| 72. | Wilton | 4.6% | 5.4%(-0.839)#72 | 5.5%(-0.899)#17,517 |
| 73. | Washburn | 4.3% | 5.4%(-1.09)#73 | 5.5%(-1.15)#18,058 |
| 74. | Portland | 4.3% | 5.4%(-1.11)#74 | 5.5%(-1.17)#18,100 |
| 75. | Oakland | 4.3% | 5.4%(-1.14)#75 | 5.5%(-1.20)#18,163 |
| 76. | Lisbon Falls | 4.2% | 5.4%(-1.18)#76 | 5.5%(-1.24)#18,249 |
| 77. | Winslow | 4.2% | 5.4%(-1.20)#77 | 5.5%(-1.26)#18,284 |
| 78. | Westbrook | 4.2% | 5.4%(-1.22)#78 | 5.5%(-1.28)#18,330 |
| 79. | North Windham | 4.2% | 5.4%(-1.25)#79 | 5.5%(-1.31)#18,392 |
| 80. | Greene | 4.1% | 5.4%(-1.36)#80 | 5.5%(-1.42)#18,632 |
| 81. | Madawaska | 4.0% | 5.4%(-1.46)#81 | 5.5%(-1.52)#18,827 |
| 82. | Yarmouth | 3.9% | 5.4%(-1.46)#82 | 5.5%(-1.52)#18,829 |
| 83. | Winter Harbor | 3.9% | 5.4%(-1.46)#83 | 5.5%(-1.52)#18,835 |
| 84. | Kezar Falls | 3.9% | 5.4%(-1.48)#84 | 5.5%(-1.54)#18,878 |
| 85. | Damariscotta | 3.9% | 5.4%(-1.50)#85 | 5.5%(-1.56)#18,924 |
| 86. | Presque Isle | 3.9% | 5.4%(-1.53)#86 | 5.5%(-1.59)#18,981 |
| 87. | Fairfield | 3.8% | 5.4%(-1.56)#87 | 5.5%(-1.62)#19,049 |
| 88. | Clinton | 3.7% | 5.4%(-1.69)#88 | 5.5%(-1.75)#19,319 |
| 89. | Jonesport | 3.7% | 5.4%(-1.69)#89 | 5.5%(-1.75)#19,328 |
| 90. | South Portland | 3.7% | 5.4%(-1.72)#90 | 5.5%(-1.78)#19,389 |
| 91. | Belfast | 3.6% | 5.4%(-1.80)#91 | 5.5%(-1.86)#19,547 |
| 92. | Millinocket | 3.6% | 5.4%(-1.82)#92 | 5.5%(-1.88)#19,610 |
| 93. | Mexico | 3.5% | 5.4%(-1.91)#93 | 5.5%(-1.97)#19,802 |
| 94. | Newport | 3.4% | 5.4%(-2.01)#94 | 5.5%(-2.07)#20,015 |
| 95. | Oakfield | 3.2% | 5.4%(-2.22)#95 | 5.5%(-2.28)#20,511 |
| 96. | Naples | 3.1% | 5.4%(-2.27)#96 | 5.5%(-2.33)#20,601 |
| 97. | Waterville | 3.0% | 5.4%(-2.36)#97 | 5.5%(-2.42)#20,786 |
| 98. | Bangor | 3.0% | 5.4%(-2.37)#98 | 5.5%(-2.44)#20,808 |
| 99. | Berwick | 3.0% | 5.4%(-2.38)#99 | 5.5%(-2.45)#20,843 |
| 100. | Machias | 3.0% | 5.4%(-2.41)#100 | 5.5%(-2.47)#20,875 |
1
2Common Questions
What are the Top 10 Cities with the Highest Percentage of Population Employed in Production in Maine?
Top 10 Cities with the Highest Percentage of Population Employed in Production in Maine are:
#1
37.1%
#2
25.0%
#3
19.9%
#4
19.6%
#5
19.0%
#6
16.8%
#7
16.4%
#8
16.2%
#9
16.0%
#10
14.8%
What city has the Highest Percentage of Population Employed in Production in Maine?
Unity has the Highest Percentage of Population Employed in Production in Maine with 37.1%.
What is the Percentage of Population Employed in Production in the State of Maine?
Percentage of Population Employed in Production in Maine is 5.4%.
What is the Percentage of Population Employed in Production in the United States?
Percentage of Population Employed in Production in the United States is 5.5%.