Cities with the Highest Percentage of Population Employed in Production in New Mexico
RELATED REPORTS & OPTIONS
Production
New Mexico
Compare Cities
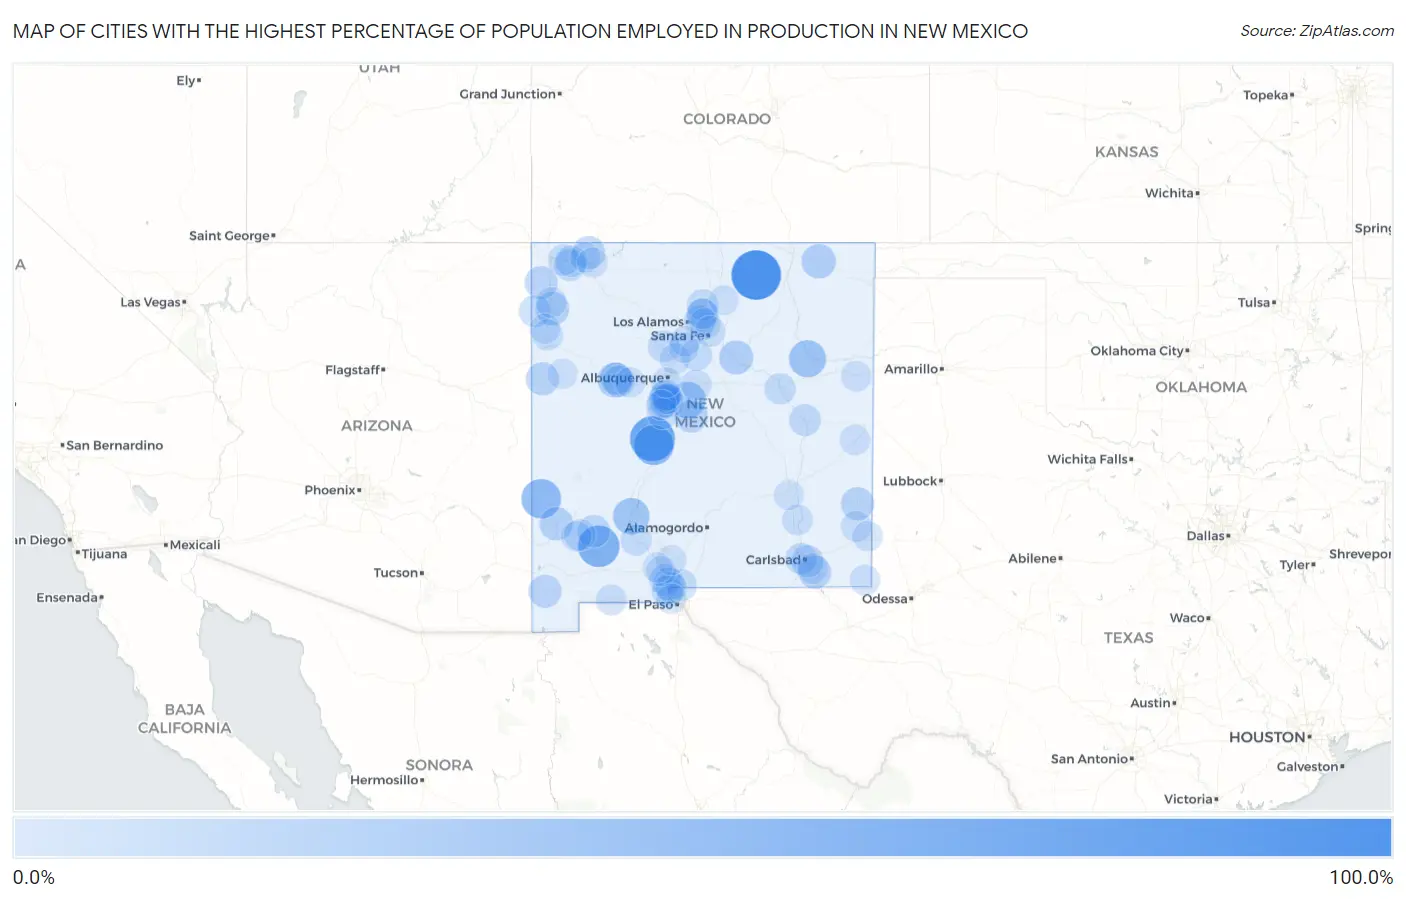
Map of Cities with the Highest Percentage of Population Employed in Production in New Mexico
0.0%
100.0%
Cities with the Highest Percentage of Population Employed in Production in New Mexico
| City | % Employed | vs State | vs National | |
| 1. | Ute Park | 100.0% | 3.4%(+96.6)#1 | 5.5%(+94.5)#11 |
| 2. | Purty Rock | 100.0% | 3.4%(+96.6)#2 | 5.5%(+94.5)#47 |
| 3. | Casas Adobes | 79.4% | 3.4%(+75.9)#3 | 5.5%(+73.9)#62 |
| 4. | Polvadera | 76.4% | 3.4%(+73.0)#4 | 5.5%(+70.9)#66 |
| 5. | Faywood | 60.0% | 3.4%(+56.6)#5 | 5.5%(+54.5)#118 |
| 6. | Ojo Sarco | 54.2% | 3.4%(+50.7)#6 | 5.5%(+48.7)#166 |
| 7. | Escondida | 52.9% | 3.4%(+49.5)#7 | 5.5%(+47.5)#178 |
| 8. | Glenwood | 50.0% | 3.4%(+46.6)#8 | 5.5%(+44.5)#199 |
| 9. | Conchas Dam | 37.9% | 3.4%(+34.5)#9 | 5.5%(+32.5)#413 |
| 10. | Tajique | 36.2% | 3.4%(+32.8)#10 | 5.5%(+30.8)#460 |
| 11. | Las Palomas | 35.4% | 3.4%(+32.0)#11 | 5.5%(+30.0)#485 |
| 12. | South Acomita Village | 27.8% | 3.4%(+24.3)#12 | 5.5%(+22.3)#952 |
| 13. | Dona Ana | 26.1% | 3.4%(+22.7)#13 | 5.5%(+20.7)#1,115 |
| 14. | Capulin | 25.0% | 3.4%(+21.6)#14 | 5.5%(+19.5)#1,278 |
| 15. | Ribera | 23.8% | 3.4%(+20.4)#15 | 5.5%(+18.3)#1,449 |
| 16. | Cliff | 21.2% | 3.4%(+17.7)#16 | 5.5%(+15.7)#1,961 |
| 17. | Naschitti | 21.1% | 3.4%(+17.6)#17 | 5.5%(+15.6)#1,987 |
| 18. | Monterey Park | 19.8% | 3.4%(+16.3)#18 | 5.5%(+14.3)#2,334 |
| 19. | Zuni Pueblo | 19.1% | 3.4%(+15.6)#19 | 5.5%(+13.6)#2,533 |
| 20. | Tatum | 19.0% | 3.4%(+15.6)#20 | 5.5%(+13.6)#2,548 |
| 21. | Sanostee | 18.6% | 3.4%(+15.2)#21 | 5.5%(+13.2)#2,679 |
| 22. | North Light Plant | 18.5% | 3.4%(+15.1)#22 | 5.5%(+13.0)#2,739 |
| 23. | Becenti | 18.2% | 3.4%(+14.7)#23 | 5.5%(+12.7)#2,861 |
| 24. | Mountainair | 18.0% | 3.4%(+14.6)#24 | 5.5%(+12.6)#2,923 |
| 25. | Animas | 18.0% | 3.4%(+14.6)#25 | 5.5%(+12.5)#2,940 |
| 26. | Malaga | 17.6% | 3.4%(+14.1)#26 | 5.5%(+12.1)#3,094 |
| 27. | Mimbres | 17.0% | 3.4%(+13.5)#27 | 5.5%(+11.5)#3,370 |
| 28. | Prewitt | 16.7% | 3.4%(+13.2)#28 | 5.5%(+11.2)#3,498 |
| 29. | North Acomita Village | 15.7% | 3.4%(+12.3)#29 | 5.5%(+10.2)#4,015 |
| 30. | Livingston Wheeler | 15.0% | 3.4%(+11.6)#30 | 5.5%(+9.53)#4,402 |
| 31. | Sombrillo | 15.0% | 3.4%(+11.6)#31 | 5.5%(+9.53)#4,413 |
| 32. | Tome | 14.6% | 3.4%(+11.2)#32 | 5.5%(+9.14)#4,664 |
| 33. | Berino | 14.3% | 3.4%(+10.8)#33 | 5.5%(+8.78)#4,872 |
| 34. | Fort Sumner | 14.0% | 3.4%(+10.6)#34 | 5.5%(+8.58)#4,976 |
| 35. | Crystal | 14.0% | 3.4%(+10.6)#35 | 5.5%(+8.53)#5,006 |
| 36. | Ojo Amarillo | 13.9% | 3.4%(+10.5)#36 | 5.5%(+8.42)#5,085 |
| 37. | Zia Pueblo | 13.4% | 3.4%(+9.91)#37 | 5.5%(+7.88)#5,485 |
| 38. | El Rancho | 13.2% | 3.4%(+9.81)#38 | 5.5%(+7.78)#5,565 |
| 39. | Happy Valley | 12.9% | 3.4%(+9.45)#39 | 5.5%(+7.42)#5,863 |
| 40. | San Jose Cdp Rio Arriba County | 12.8% | 3.4%(+9.41)#40 | 5.5%(+7.38)#5,901 |
| 41. | La Mesa | 12.7% | 3.4%(+9.29)#41 | 5.5%(+7.26)#5,993 |
| 42. | Angustura | 12.7% | 3.4%(+9.22)#42 | 5.5%(+7.19)#6,040 |
| 43. | Seama | 12.3% | 3.4%(+8.87)#43 | 5.5%(+6.84)#6,362 |
| 44. | Los Luceros | 11.9% | 3.4%(+8.45)#44 | 5.5%(+6.42)#6,749 |
| 45. | La Union | 11.9% | 3.4%(+8.42)#45 | 5.5%(+6.39)#6,774 |
| 46. | Madrid | 11.8% | 3.4%(+8.40)#46 | 5.5%(+6.37)#6,786 |
| 47. | Santa Rosa | 11.6% | 3.4%(+8.20)#47 | 5.5%(+6.17)#6,994 |
| 48. | Kirtland | 11.5% | 3.4%(+8.05)#48 | 5.5%(+6.02)#7,148 |
| 49. | Chaparral | 11.3% | 3.4%(+7.84)#49 | 5.5%(+5.81)#7,348 |
| 50. | Arenas Valley | 11.1% | 3.4%(+7.67)#50 | 5.5%(+5.64)#7,499 |
| 51. | Conejo | 10.9% | 3.4%(+7.49)#51 | 5.5%(+5.46)#7,726 |
| 52. | Barton | 10.9% | 3.4%(+7.49)#52 | 5.5%(+5.46)#7,731 |
| 53. | Waterflow | 10.9% | 3.4%(+7.48)#53 | 5.5%(+5.45)#7,739 |
| 54. | Cuyamungue Grant | 10.9% | 3.4%(+7.44)#54 | 5.5%(+5.41)#7,778 |
| 55. | Twin Lakes | 10.0% | 3.4%(+6.56)#55 | 5.5%(+4.53)#8,736 |
| 56. | Salem | 9.8% | 3.4%(+6.33)#56 | 5.5%(+4.30)#9,027 |
| 57. | El Cerro | 9.7% | 3.4%(+6.22)#57 | 5.5%(+4.19)#9,158 |
| 58. | Rio Rancho Estates | 9.3% | 3.4%(+5.84)#58 | 5.5%(+3.81)#9,614 |
| 59. | Valencia | 9.1% | 3.4%(+5.67)#59 | 5.5%(+3.64)#9,805 |
| 60. | Casa Colorada | 9.0% | 3.4%(+5.58)#60 | 5.5%(+3.55)#9,943 |
| 61. | Anthony | 8.9% | 3.4%(+5.47)#61 | 5.5%(+3.44)#10,088 |
| 62. | Pena Blanca | 8.8% | 3.4%(+5.41)#62 | 5.5%(+3.38)#10,171 |
| 63. | Santa Cruz | 8.8% | 3.4%(+5.35)#63 | 5.5%(+3.32)#10,239 |
| 64. | San Antonito Cdp Bernalillo County | 8.8% | 3.4%(+5.33)#64 | 5.5%(+3.30)#10,280 |
| 65. | Sunlit Hills | 8.3% | 3.4%(+4.90)#65 | 5.5%(+2.86)#10,871 |
| 66. | Lovington | 8.2% | 3.4%(+4.80)#66 | 5.5%(+2.77)#11,018 |
| 67. | Indian Hills | 8.2% | 3.4%(+4.80)#67 | 5.5%(+2.77)#11,022 |
| 68. | Peralta | 8.2% | 3.4%(+4.79)#68 | 5.5%(+2.76)#11,031 |
| 69. | Loving | 8.2% | 3.4%(+4.74)#69 | 5.5%(+2.71)#11,099 |
| 70. | Columbus | 8.1% | 3.4%(+4.63)#70 | 5.5%(+2.60)#11,257 |
| 71. | Lake Arthur | 8.0% | 3.4%(+4.56)#71 | 5.5%(+2.53)#11,351 |
| 72. | Sheep Springs | 7.9% | 3.4%(+4.48)#72 | 5.5%(+2.45)#11,473 |
| 73. | Santa Ana Pueblo | 7.7% | 3.4%(+4.30)#73 | 5.5%(+2.27)#11,763 |
| 74. | San Jon | 7.6% | 3.4%(+4.17)#74 | 5.5%(+2.14)#11,976 |
| 75. | Haystack | 7.5% | 3.4%(+4.06)#75 | 5.5%(+2.03)#12,157 |
| 76. | Tesuque | 7.4% | 3.4%(+3.92)#76 | 5.5%(+1.89)#12,367 |
| 77. | Cochiti | 7.3% | 3.4%(+3.89)#77 | 5.5%(+1.86)#12,433 |
| 78. | Jal | 7.3% | 3.4%(+3.89)#78 | 5.5%(+1.86)#12,438 |
| 79. | Santo Domingo Pueblo | 7.3% | 3.4%(+3.83)#79 | 5.5%(+1.80)#12,529 |
| 80. | Silver City | 7.2% | 3.4%(+3.77)#80 | 5.5%(+1.74)#12,625 |
| 81. | Portales | 7.1% | 3.4%(+3.69)#81 | 5.5%(+1.66)#12,769 |
| 82. | Mesita | 7.0% | 3.4%(+3.57)#82 | 5.5%(+1.54)#12,969 |
| 83. | El Cerro Mission | 6.9% | 3.4%(+3.46)#83 | 5.5%(+1.43)#13,154 |
| 84. | North Hobbs | 6.5% | 3.4%(+3.10)#84 | 5.5%(+1.07)#13,769 |
| 85. | South Valley | 6.4% | 3.4%(+2.98)#85 | 5.5%(+0.948)#13,984 |
| 86. | Flora Vista | 6.3% | 3.4%(+2.88)#86 | 5.5%(+0.848)#14,150 |
| 87. | Bloomfield | 6.2% | 3.4%(+2.80)#87 | 5.5%(+0.771)#14,299 |
| 88. | Ramah | 6.2% | 3.4%(+2.79)#88 | 5.5%(+0.759)#14,318 |
| 89. | Thunder Mountain | 6.1% | 3.4%(+2.64)#89 | 5.5%(+0.613)#14,577 |
| 90. | Vadito | 6.1% | 3.4%(+2.64)#90 | 5.5%(+0.613)#14,580 |
| 91. | Edith Enclave | 6.1% | 3.4%(+2.62)#91 | 5.5%(+0.592)#14,617 |
| 92. | Center Point | 6.0% | 3.4%(+2.56)#92 | 5.5%(+0.533)#14,713 |
| 93. | Organ | 6.0% | 3.4%(+2.51)#93 | 5.5%(+0.484)#14,824 |
| 94. | San Pablo | 5.9% | 3.4%(+2.50)#94 | 5.5%(+0.468)#14,848 |
| 95. | Little Walnut | 5.9% | 3.4%(+2.46)#95 | 5.5%(+0.430)#14,909 |
| 96. | Nakaibito | 5.9% | 3.4%(+2.44)#96 | 5.5%(+0.414)#14,940 |
| 97. | Sausal | 5.8% | 3.4%(+2.35)#97 | 5.5%(+0.321)#15,128 |
| 98. | Sunland Park | 5.7% | 3.4%(+2.30)#98 | 5.5%(+0.271)#15,231 |
| 99. | Roswell | 5.5% | 3.4%(+2.10)#99 | 5.5%(+0.071)#15,637 |
| 100. | Fairacres | 5.5% | 3.4%(+2.10)#100 | 5.5%(+0.067)#15,648 |
Common Questions
What are the Top 10 Cities with the Highest Percentage of Population Employed in Production in New Mexico?
Top 10 Cities with the Highest Percentage of Population Employed in Production in New Mexico are:
#1
100.0%
#2
76.4%
#3
60.0%
#4
52.9%
#5
50.0%
#6
37.9%
#7
36.2%
#8
35.4%
#9
27.8%
#10
25.0%
What city has the Highest Percentage of Population Employed in Production in New Mexico?
Ute Park has the Highest Percentage of Population Employed in Production in New Mexico with 100.0%.
What is the Percentage of Population Employed in Production in the State of New Mexico?
Percentage of Population Employed in Production in New Mexico is 3.4%.
What is the Percentage of Population Employed in Production in the United States?
Percentage of Population Employed in Production in the United States is 5.5%.