Cities with the Highest Percentage of Population Employed in Production in South Carolina
RELATED REPORTS & OPTIONS
Production
South Carolina
Compare Cities
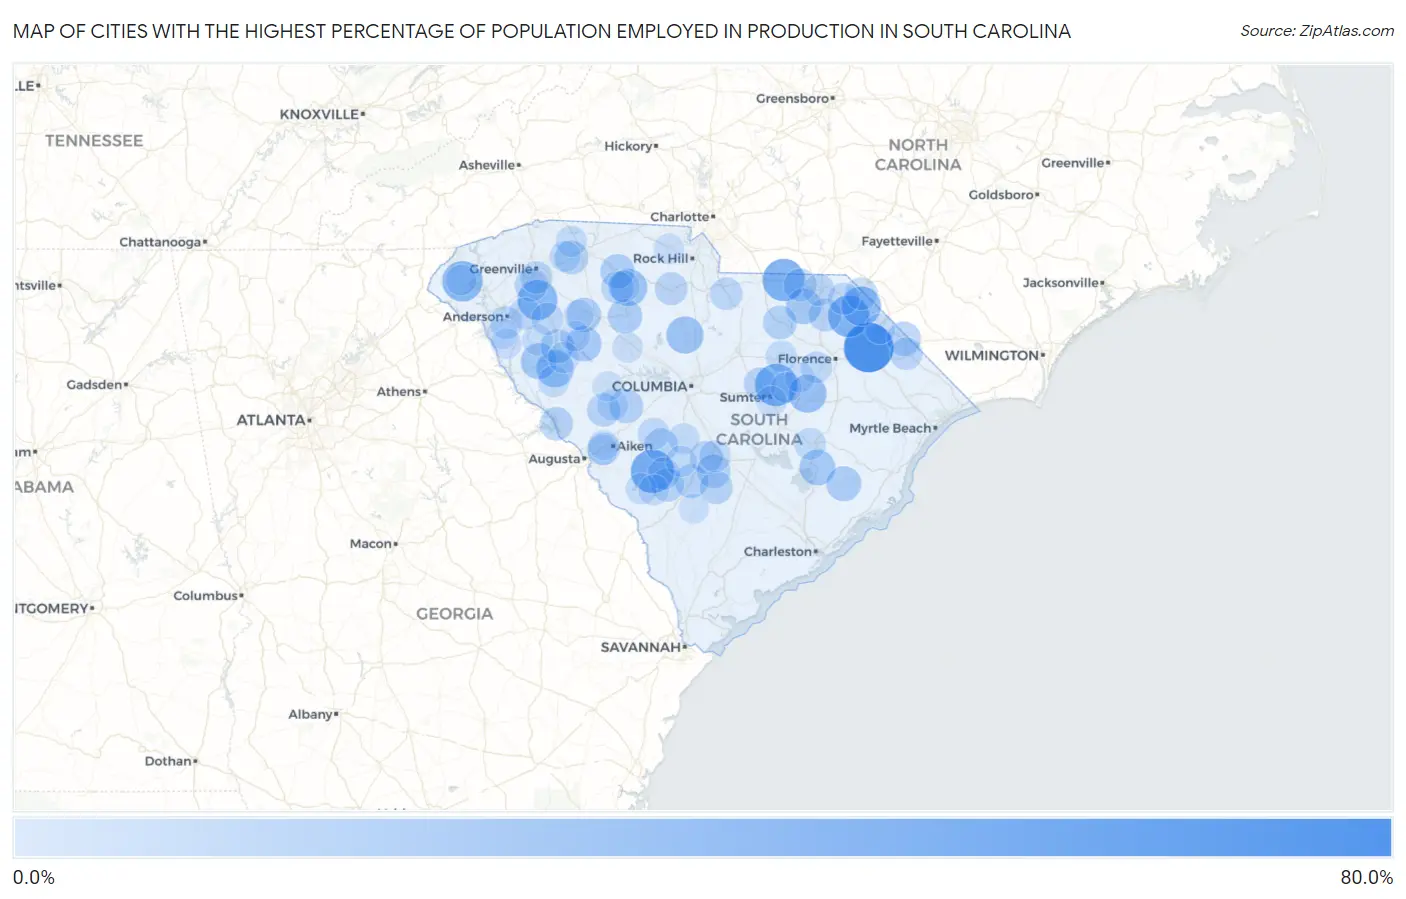
Map of Cities with the Highest Percentage of Population Employed in Production in South Carolina
0.0%
80.0%
Cities with the Highest Percentage of Population Employed in Production in South Carolina
| City | % Employed | vs State | vs National | |
| 1. | Sellers | 66.7% | 7.7%(+59.0)#1 | 5.5%(+61.2)#87 |
| 2. | Cash | 60.2% | 7.7%(+52.5)#2 | 5.5%(+54.7)#116 |
| 3. | Elliott | 58.3% | 7.7%(+50.6)#3 | 5.5%(+52.8)#132 |
| 4. | Elko | 50.0% | 7.7%(+42.3)#4 | 5.5%(+44.5)#192 |
| 5. | Oswego | 47.5% | 7.7%(+39.8)#5 | 5.5%(+42.1)#234 |
| 6. | Mount Croghan | 47.0% | 7.7%(+39.3)#6 | 5.5%(+41.5)#240 |
| 7. | Blenheim | 44.8% | 7.7%(+37.1)#7 | 5.5%(+39.4)#268 |
| 8. | Beech Island | 42.4% | 7.7%(+34.7)#8 | 5.5%(+37.0)#307 |
| 9. | West Union | 42.3% | 7.7%(+34.6)#9 | 5.5%(+36.9)#310 |
| 10. | South Union | 41.4% | 7.7%(+33.7)#10 | 5.5%(+35.9)#329 |
| 11. | Ware Place | 40.8% | 7.7%(+33.1)#11 | 5.5%(+35.3)#340 |
| 12. | Clio | 39.9% | 7.7%(+32.2)#12 | 5.5%(+34.4)#362 |
| 13. | Pauline | 36.6% | 7.7%(+28.9)#13 | 5.5%(+31.1)#450 |
| 14. | Shiloh | 35.7% | 7.7%(+28.0)#14 | 5.5%(+30.2)#474 |
| 15. | Promised Land | 34.0% | 7.7%(+26.4)#15 | 5.5%(+28.6)#537 |
| 16. | Danwood | 34.0% | 7.7%(+26.3)#16 | 5.5%(+28.6)#538 |
| 17. | Winnsboro | 33.7% | 7.7%(+26.0)#17 | 5.5%(+28.2)#553 |
| 18. | St. Charles | 33.3% | 7.7%(+25.6)#18 | 5.5%(+27.9)#577 |
| 19. | Monarch Mill | 33.1% | 7.7%(+25.4)#19 | 5.5%(+27.7)#591 |
| 20. | Wisacky | 32.8% | 7.7%(+25.1)#20 | 5.5%(+27.3)#608 |
| 21. | Abbeville | 30.5% | 7.7%(+22.8)#21 | 5.5%(+25.0)#737 |
| 22. | St Stephen | 29.9% | 7.7%(+22.2)#22 | 5.5%(+24.5)#771 |
| 23. | Patrick | 29.7% | 7.7%(+22.1)#23 | 5.5%(+24.3)#782 |
| 24. | Cross Hill | 29.0% | 7.7%(+21.3)#24 | 5.5%(+23.6)#835 |
| 25. | Jamestown | 27.7% | 7.7%(+20.0)#25 | 5.5%(+22.2)#963 |
| 26. | Manville | 27.6% | 7.7%(+19.9)#26 | 5.5%(+22.2)#964 |
| 27. | Watts Mills | 27.2% | 7.7%(+19.5)#27 | 5.5%(+21.7)#1,014 |
| 28. | Whitmire | 26.4% | 7.7%(+18.7)#28 | 5.5%(+20.9)#1,093 |
| 29. | Jonesville | 26.3% | 7.7%(+18.6)#29 | 5.5%(+20.8)#1,103 |
| 30. | Lake View | 25.8% | 7.7%(+18.1)#30 | 5.5%(+20.4)#1,155 |
| 31. | Cokesbury | 25.2% | 7.7%(+17.5)#31 | 5.5%(+19.7)#1,240 |
| 32. | Little Rock | 25.0% | 7.7%(+17.3)#32 | 5.5%(+19.5)#1,249 |
| 33. | Monetta | 25.0% | 7.7%(+17.3)#33 | 5.5%(+19.5)#1,259 |
| 34. | Mcbee | 24.9% | 7.7%(+17.2)#34 | 5.5%(+19.5)#1,288 |
| 35. | Startex | 24.9% | 7.7%(+17.2)#35 | 5.5%(+19.4)#1,294 |
| 36. | Bamberg | 24.7% | 7.7%(+17.0)#36 | 5.5%(+19.2)#1,328 |
| 37. | Rowesville | 24.3% | 7.7%(+16.6)#37 | 5.5%(+18.9)#1,371 |
| 38. | Salley | 24.3% | 7.7%(+16.6)#38 | 5.5%(+18.9)#1,372 |
| 39. | Modoc | 23.8% | 7.7%(+16.1)#39 | 5.5%(+18.3)#1,453 |
| 40. | Johnston | 23.7% | 7.7%(+16.0)#40 | 5.5%(+18.2)#1,472 |
| 41. | Hilda | 23.5% | 7.7%(+15.8)#41 | 5.5%(+18.0)#1,507 |
| 42. | Edisto | 23.3% | 7.7%(+15.6)#42 | 5.5%(+17.9)#1,526 |
| 43. | Branchville | 23.1% | 7.7%(+15.4)#43 | 5.5%(+17.6)#1,577 |
| 44. | Golden Grove | 23.0% | 7.7%(+15.4)#44 | 5.5%(+17.6)#1,587 |
| 45. | Society Hill | 22.9% | 7.7%(+15.2)#45 | 5.5%(+17.4)#1,614 |
| 46. | Chesterfield | 22.7% | 7.7%(+15.0)#46 | 5.5%(+17.2)#1,640 |
| 47. | Chester | 22.5% | 7.7%(+14.9)#47 | 5.5%(+17.1)#1,665 |
| 48. | Grover | 22.5% | 7.7%(+14.8)#48 | 5.5%(+17.1)#1,668 |
| 49. | Dalzell | 22.3% | 7.7%(+14.6)#49 | 5.5%(+16.8)#1,715 |
| 50. | Ben Avon | 21.9% | 7.7%(+14.2)#50 | 5.5%(+16.4)#1,792 |
| 51. | Mccoll | 21.9% | 7.7%(+14.2)#51 | 5.5%(+16.4)#1,793 |
| 52. | Homeland Park | 21.8% | 7.7%(+14.2)#52 | 5.5%(+16.4)#1,804 |
| 53. | Elgin | 21.8% | 7.7%(+14.1)#53 | 5.5%(+16.4)#1,808 |
| 54. | Buffalo | 21.7% | 7.7%(+14.0)#54 | 5.5%(+16.3)#1,822 |
| 55. | Warrenville | 21.6% | 7.7%(+13.9)#55 | 5.5%(+16.2)#1,849 |
| 56. | Gantt | 21.5% | 7.7%(+13.8)#56 | 5.5%(+16.1)#1,876 |
| 57. | Nichols | 21.4% | 7.7%(+13.7)#57 | 5.5%(+16.0)#1,894 |
| 58. | Blackville | 21.3% | 7.7%(+13.6)#58 | 5.5%(+15.8)#1,923 |
| 59. | Belton | 21.0% | 7.7%(+13.3)#59 | 5.5%(+15.5)#2,005 |
| 60. | Princeton | 20.8% | 7.7%(+13.1)#60 | 5.5%(+15.4)#2,054 |
| 61. | Cheraw | 20.4% | 7.7%(+12.7)#61 | 5.5%(+14.9)#2,164 |
| 62. | Bennettsville | 20.2% | 7.7%(+12.5)#62 | 5.5%(+14.8)#2,199 |
| 63. | Greeleyville | 20.0% | 7.7%(+12.3)#63 | 5.5%(+14.5)#2,246 |
| 64. | Ashwood | 20.0% | 7.7%(+12.3)#64 | 5.5%(+14.5)#2,271 |
| 65. | Timmonsville | 19.9% | 7.7%(+12.2)#65 | 5.5%(+14.4)#2,298 |
| 66. | Wagener | 19.7% | 7.7%(+12.0)#66 | 5.5%(+14.2)#2,342 |
| 67. | Wilkinson Heights | 19.5% | 7.7%(+11.8)#67 | 5.5%(+14.0)#2,418 |
| 68. | Union | 19.3% | 7.7%(+11.6)#68 | 5.5%(+13.9)#2,456 |
| 69. | Bradley | 18.8% | 7.7%(+11.1)#69 | 5.5%(+13.3)#2,651 |
| 70. | Tradesville | 18.8% | 7.7%(+11.1)#70 | 5.5%(+13.3)#2,657 |
| 71. | North | 18.6% | 7.7%(+10.9)#71 | 5.5%(+13.2)#2,684 |
| 72. | Greenwood | 18.6% | 7.7%(+10.9)#72 | 5.5%(+13.2)#2,687 |
| 73. | Inman | 18.6% | 7.7%(+10.9)#73 | 5.5%(+13.1)#2,719 |
| 74. | Norway | 18.3% | 7.7%(+10.6)#74 | 5.5%(+12.9)#2,797 |
| 75. | Fripp Island | 18.3% | 7.7%(+10.6)#75 | 5.5%(+12.8)#2,803 |
| 76. | Daviston | 18.3% | 7.7%(+10.6)#76 | 5.5%(+12.8)#2,822 |
| 77. | Unity | 18.2% | 7.7%(+10.5)#77 | 5.5%(+12.7)#2,855 |
| 78. | Ward | 18.2% | 7.7%(+10.5)#78 | 5.5%(+12.7)#2,863 |
| 79. | Snelling | 18.0% | 7.7%(+10.4)#79 | 5.5%(+12.6)#2,922 |
| 80. | Bishopville | 18.0% | 7.7%(+10.3)#80 | 5.5%(+12.5)#2,936 |
| 81. | Camp Croft | 18.0% | 7.7%(+10.3)#81 | 5.5%(+12.5)#2,948 |
| 82. | Duncan | 17.9% | 7.7%(+10.2)#82 | 5.5%(+12.5)#2,970 |
| 83. | Due West | 17.5% | 7.7%(+9.82)#83 | 5.5%(+12.0)#3,120 |
| 84. | Barnwell | 17.4% | 7.7%(+9.69)#84 | 5.5%(+11.9)#3,178 |
| 85. | Mayesville | 17.1% | 7.7%(+9.41)#85 | 5.5%(+11.6)#3,313 |
| 86. | Gloverville | 16.9% | 7.7%(+9.22)#86 | 5.5%(+11.4)#3,398 |
| 87. | Starr | 16.9% | 7.7%(+9.21)#87 | 5.5%(+11.4)#3,401 |
| 88. | Walhalla | 16.9% | 7.7%(+9.19)#88 | 5.5%(+11.4)#3,411 |
| 89. | Newberry | 16.8% | 7.7%(+9.12)#89 | 5.5%(+11.3)#3,446 |
| 90. | Dovesville | 16.8% | 7.7%(+9.11)#90 | 5.5%(+11.3)#3,451 |
| 91. | Iva | 16.7% | 7.7%(+8.97)#91 | 5.5%(+11.2)#3,495 |
| 92. | York | 16.6% | 7.7%(+8.93)#92 | 5.5%(+11.2)#3,558 |
| 93. | South Sumter | 16.5% | 7.7%(+8.80)#93 | 5.5%(+11.0)#3,613 |
| 94. | Waterloo | 16.3% | 7.7%(+8.56)#94 | 5.5%(+10.8)#3,738 |
| 95. | Dillon | 16.2% | 7.7%(+8.48)#95 | 5.5%(+10.7)#3,775 |
| 96. | Saluda | 16.0% | 7.7%(+8.34)#96 | 5.5%(+10.6)#3,847 |
| 97. | Graniteville | 16.0% | 7.7%(+8.34)#97 | 5.5%(+10.6)#3,848 |
| 98. | Laurens | 15.9% | 7.7%(+8.18)#98 | 5.5%(+10.4)#3,941 |
| 99. | Lynchburg | 15.8% | 7.7%(+8.10)#99 | 5.5%(+10.3)#3,981 |
| 100. | Ehrhardt | 15.7% | 7.7%(+7.97)#100 | 5.5%(+10.2)#4,038 |
Common Questions
What are the Top 10 Cities with the Highest Percentage of Population Employed in Production in South Carolina?
Top 10 Cities with the Highest Percentage of Population Employed in Production in South Carolina are:
#1
66.7%
#2
50.0%
#3
47.5%
#4
47.0%
#5
44.8%
#6
42.3%
#7
40.8%
#8
39.9%
#9
35.7%
#10
34.0%
What city has the Highest Percentage of Population Employed in Production in South Carolina?
Sellers has the Highest Percentage of Population Employed in Production in South Carolina with 66.7%.
What is the Percentage of Population Employed in Production in the State of South Carolina?
Percentage of Population Employed in Production in South Carolina is 7.7%.
What is the Percentage of Population Employed in Production in the United States?
Percentage of Population Employed in Production in the United States is 5.5%.