Cities with the Highest Percentage of Population Employed in Production in Michigan
RELATED REPORTS & OPTIONS
Production
Michigan
Compare Cities
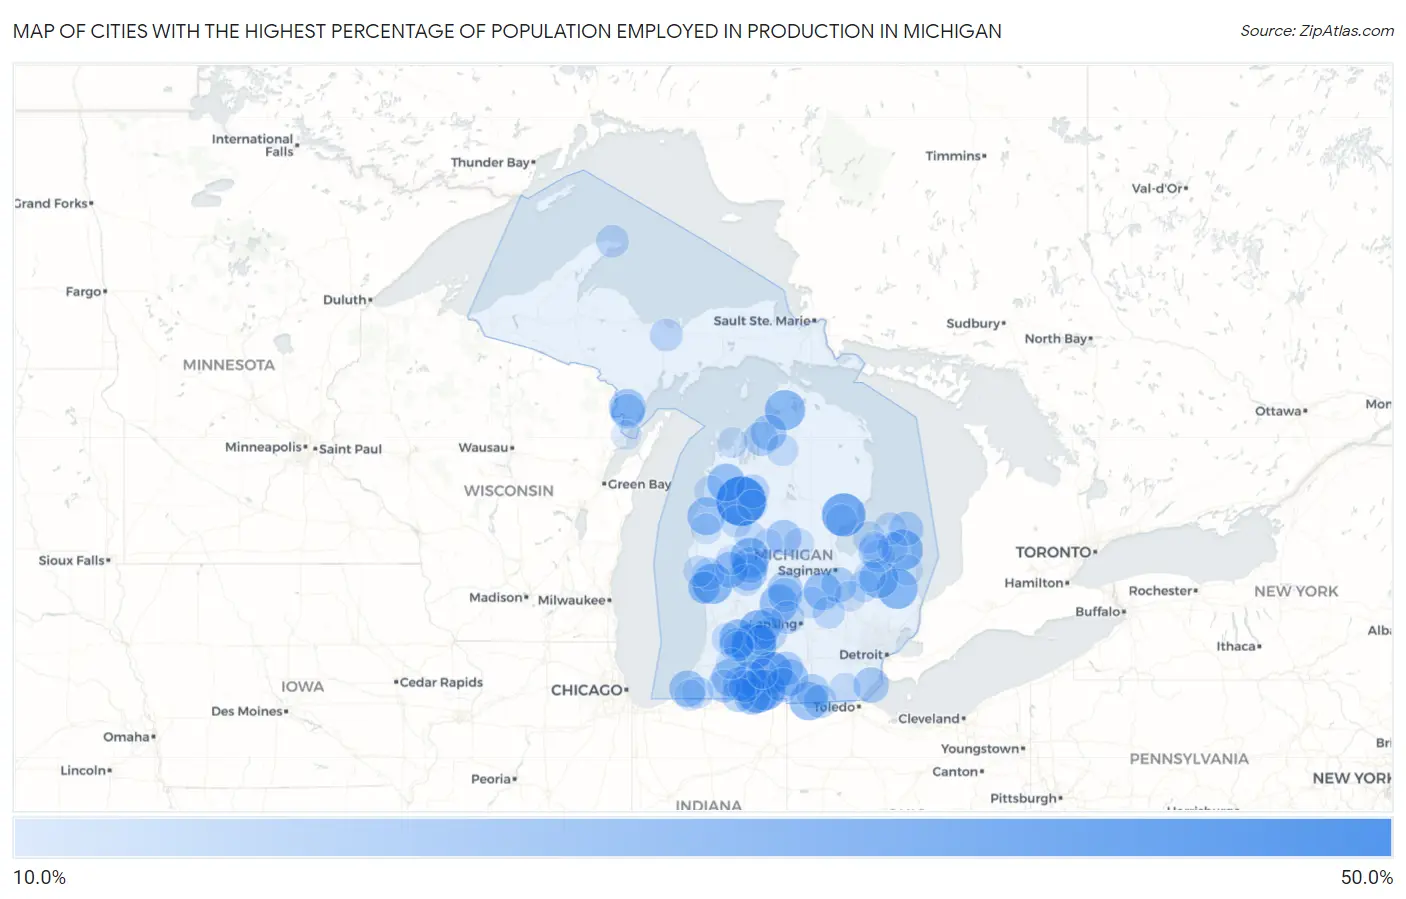
Map of Cities with the Highest Percentage of Population Employed in Production in Michigan
0.0%
50.0%
Cities with the Highest Percentage of Population Employed in Production in Michigan
| City | % Employed | vs State | vs National | |
| 1. | Boon | 43.5% | 8.9%(+34.6)#1 | 5.5%(+38.0)#286 |
| 2. | Scotts | 42.9% | 8.9%(+34.0)#2 | 5.5%(+37.4)#293 |
| 3. | Hickory Corners | 37.6% | 8.9%(+28.8)#3 | 5.5%(+32.2)#424 |
| 4. | Twining | 35.6% | 8.9%(+26.8)#4 | 5.5%(+30.1)#479 |
| 5. | Burr Oak | 35.1% | 8.9%(+26.3)#5 | 5.5%(+29.7)#499 |
| 6. | Barnes Lake | 34.5% | 8.9%(+25.6)#6 | 5.5%(+29.0)#516 |
| 7. | Burlington | 33.3% | 8.9%(+24.5)#7 | 5.5%(+27.9)#567 |
| 8. | Minden City | 32.3% | 8.9%(+23.4)#8 | 5.5%(+26.8)#630 |
| 9. | Bronson | 32.1% | 8.9%(+23.2)#9 | 5.5%(+26.6)#641 |
| 10. | Wolf Lake | 31.9% | 8.9%(+23.0)#10 | 5.5%(+26.4)#648 |
| 11. | Melvin | 31.6% | 8.9%(+22.7)#11 | 5.5%(+26.1)#668 |
| 12. | Oden | 31.4% | 8.9%(+22.6)#12 | 5.5%(+26.0)#680 |
| 13. | Hastings | 31.2% | 8.9%(+22.4)#13 | 5.5%(+25.8)#695 |
| 14. | Stanwood | 30.3% | 8.9%(+21.4)#14 | 5.5%(+24.8)#749 |
| 15. | Clifford | 30.2% | 8.9%(+21.3)#15 | 5.5%(+24.7)#756 |
| 16. | Martin | 29.5% | 8.9%(+20.6)#16 | 5.5%(+24.0)#798 |
| 17. | Waldron | 29.2% | 8.9%(+20.4)#17 | 5.5%(+23.8)#822 |
| 18. | Lyons | 29.1% | 8.9%(+20.2)#18 | 5.5%(+23.6)#832 |
| 19. | Free Soil | 28.6% | 8.9%(+19.7)#19 | 5.5%(+23.1)#877 |
| 20. | Nessen City | 28.6% | 8.9%(+19.7)#20 | 5.5%(+23.1)#879 |
| 21. | Oakley | 28.3% | 8.9%(+19.5)#21 | 5.5%(+22.9)#904 |
| 22. | Marcellus | 27.5% | 8.9%(+18.7)#22 | 5.5%(+22.0)#975 |
| 23. | Daggett | 27.3% | 8.9%(+18.4)#23 | 5.5%(+21.8)#1,002 |
| 24. | Tower | 27.2% | 8.9%(+18.3)#24 | 5.5%(+21.7)#1,010 |
| 25. | Sturgis | 27.1% | 8.9%(+18.3)#25 | 5.5%(+21.7)#1,019 |
| 26. | Howard City | 27.1% | 8.9%(+18.2)#26 | 5.5%(+21.6)#1,024 |
| 27. | Litchfield | 26.9% | 8.9%(+18.1)#27 | 5.5%(+21.5)#1,032 |
| 28. | Bruce Crossing | 26.9% | 8.9%(+18.1)#28 | 5.5%(+21.5)#1,035 |
| 29. | New Troy | 26.9% | 8.9%(+18.0)#29 | 5.5%(+21.4)#1,040 |
| 30. | Morley | 26.4% | 8.9%(+17.5)#30 | 5.5%(+20.9)#1,092 |
| 31. | Pelkie | 26.3% | 8.9%(+17.5)#31 | 5.5%(+20.8)#1,101 |
| 32. | Newaygo | 26.2% | 8.9%(+17.4)#32 | 5.5%(+20.8)#1,107 |
| 33. | East Jordan | 26.1% | 8.9%(+17.2)#33 | 5.5%(+20.6)#1,118 |
| 34. | Detroit Beach | 25.7% | 8.9%(+16.9)#34 | 5.5%(+20.3)#1,170 |
| 35. | Farwell | 25.5% | 8.9%(+16.7)#35 | 5.5%(+20.1)#1,193 |
| 36. | Burt | 25.4% | 8.9%(+16.5)#36 | 5.5%(+19.9)#1,213 |
| 37. | Carson City | 24.9% | 8.9%(+16.0)#37 | 5.5%(+19.4)#1,297 |
| 38. | Mendon | 24.6% | 8.9%(+15.7)#38 | 5.5%(+19.1)#1,340 |
| 39. | Stephenson | 24.5% | 8.9%(+15.6)#39 | 5.5%(+19.0)#1,351 |
| 40. | Port Hope | 24.4% | 8.9%(+15.5)#40 | 5.5%(+18.9)#1,366 |
| 41. | Three Rivers | 24.2% | 8.9%(+15.3)#41 | 5.5%(+18.7)#1,389 |
| 42. | White Pigeon | 24.1% | 8.9%(+15.3)#42 | 5.5%(+18.7)#1,397 |
| 43. | Central Lake | 24.1% | 8.9%(+15.3)#43 | 5.5%(+18.7)#1,398 |
| 44. | Homer | 24.1% | 8.9%(+15.3)#44 | 5.5%(+18.6)#1,399 |
| 45. | Hudson | 24.1% | 8.9%(+15.2)#45 | 5.5%(+18.6)#1,408 |
| 46. | Hubbardston | 24.0% | 8.9%(+15.1)#46 | 5.5%(+18.5)#1,428 |
| 47. | Quincy | 23.8% | 8.9%(+15.0)#47 | 5.5%(+18.4)#1,445 |
| 48. | Falmouth | 23.8% | 8.9%(+14.9)#48 | 5.5%(+18.3)#1,460 |
| 49. | Otsego | 23.6% | 8.9%(+14.7)#49 | 5.5%(+18.1)#1,490 |
| 50. | Gagetown | 23.5% | 8.9%(+14.7)#50 | 5.5%(+18.1)#1,495 |
| 51. | Manton | 23.3% | 8.9%(+14.4)#51 | 5.5%(+17.8)#1,546 |
| 52. | Morenci | 23.1% | 8.9%(+14.2)#52 | 5.5%(+17.6)#1,575 |
| 53. | Nashville | 22.9% | 8.9%(+14.1)#53 | 5.5%(+17.5)#1,604 |
| 54. | Vandalia | 22.7% | 8.9%(+13.9)#54 | 5.5%(+17.3)#1,635 |
| 55. | Muskegon Heights | 22.6% | 8.9%(+13.8)#55 | 5.5%(+17.2)#1,651 |
| 56. | Eagle | 22.6% | 8.9%(+13.7)#56 | 5.5%(+17.1)#1,662 |
| 57. | Pittsford | 22.4% | 8.9%(+13.5)#57 | 5.5%(+16.9)#1,701 |
| 58. | Chatham | 22.2% | 8.9%(+13.4)#58 | 5.5%(+16.8)#1,732 |
| 59. | Copper Harbor | 22.2% | 8.9%(+13.4)#59 | 5.5%(+16.8)#1,734 |
| 60. | Kinde | 22.2% | 8.9%(+13.3)#60 | 5.5%(+16.7)#1,750 |
| 61. | Cass City | 21.9% | 8.9%(+13.1)#61 | 5.5%(+16.4)#1,788 |
| 62. | Centreville | 21.8% | 8.9%(+13.0)#62 | 5.5%(+16.4)#1,803 |
| 63. | Twin Lake | 21.8% | 8.9%(+12.9)#63 | 5.5%(+16.3)#1,818 |
| 64. | Bay Port | 21.6% | 8.9%(+12.8)#64 | 5.5%(+16.1)#1,858 |
| 65. | Bancroft | 21.6% | 8.9%(+12.7)#65 | 5.5%(+16.1)#1,859 |
| 66. | Woodland | 21.4% | 8.9%(+12.5)#66 | 5.5%(+15.9)#1,903 |
| 67. | Luther | 21.3% | 8.9%(+12.4)#67 | 5.5%(+15.8)#1,927 |
| 68. | Lakes Of The North | 21.2% | 8.9%(+12.3)#68 | 5.5%(+15.7)#1,954 |
| 69. | Roosevelt Park | 21.2% | 8.9%(+12.3)#69 | 5.5%(+15.7)#1,960 |
| 70. | Dodgeville | 21.1% | 8.9%(+12.3)#70 | 5.5%(+15.7)#1,965 |
| 71. | Buchanan | 21.1% | 8.9%(+12.2)#71 | 5.5%(+15.6)#1,977 |
| 72. | Allegan | 21.1% | 8.9%(+12.2)#72 | 5.5%(+15.6)#1,982 |
| 73. | Deerfield | 21.1% | 8.9%(+12.2)#73 | 5.5%(+15.6)#1,985 |
| 74. | Sand Lake | 21.0% | 8.9%(+12.2)#74 | 5.5%(+15.6)#2,000 |
| 75. | Otter Lake | 20.9% | 8.9%(+12.0)#75 | 5.5%(+15.4)#2,028 |
| 76. | Ovid | 20.9% | 8.9%(+12.0)#76 | 5.5%(+15.4)#2,031 |
| 77. | Mayville | 20.9% | 8.9%(+12.0)#77 | 5.5%(+15.4)#2,036 |
| 78. | Omer | 20.8% | 8.9%(+12.0)#78 | 5.5%(+15.4)#2,049 |
| 79. | Bear Lake | 20.8% | 8.9%(+11.9)#79 | 5.5%(+15.3)#2,067 |
| 80. | Hersey | 20.6% | 8.9%(+11.7)#80 | 5.5%(+15.1)#2,116 |
| 81. | Montague | 20.5% | 8.9%(+11.7)#81 | 5.5%(+15.1)#2,121 |
| 82. | Carsonville | 20.5% | 8.9%(+11.6)#82 | 5.5%(+15.0)#2,142 |
| 83. | Covington | 20.4% | 8.9%(+11.5)#83 | 5.5%(+14.9)#2,158 |
| 84. | Galien | 20.4% | 8.9%(+11.5)#84 | 5.5%(+14.9)#2,163 |
| 85. | Mattawan | 20.4% | 8.9%(+11.5)#85 | 5.5%(+14.9)#2,172 |
| 86. | Coleman | 20.1% | 8.9%(+11.3)#86 | 5.5%(+14.7)#2,220 |
| 87. | Ubly | 20.0% | 8.9%(+11.1)#87 | 5.5%(+14.5)#2,243 |
| 88. | Leland | 19.8% | 8.9%(+11.0)#88 | 5.5%(+14.4)#2,314 |
| 89. | Custer | 19.7% | 8.9%(+10.9)#89 | 5.5%(+14.3)#2,339 |
| 90. | Dowling | 19.7% | 8.9%(+10.8)#90 | 5.5%(+14.2)#2,346 |
| 91. | Beecher | 19.7% | 8.9%(+10.8)#91 | 5.5%(+14.2)#2,347 |
| 92. | Barryton | 19.7% | 8.9%(+10.8)#92 | 5.5%(+14.2)#2,348 |
| 93. | Elm Hall | 19.7% | 8.9%(+10.8)#93 | 5.5%(+14.2)#2,356 |
| 94. | Cadillac | 19.6% | 8.9%(+10.7)#94 | 5.5%(+14.1)#2,396 |
| 95. | Athens | 19.4% | 8.9%(+10.5)#95 | 5.5%(+13.9)#2,442 |
| 96. | White Cloud | 19.4% | 8.9%(+10.5)#96 | 5.5%(+13.9)#2,449 |
| 97. | Three Lakes | 19.2% | 8.9%(+10.3)#97 | 5.5%(+13.7)#2,491 |
| 98. | Menominee | 19.1% | 8.9%(+10.3)#98 | 5.5%(+13.7)#2,509 |
| 99. | Owendale | 19.1% | 8.9%(+10.3)#99 | 5.5%(+13.7)#2,512 |
| 100. | Plainwell | 19.1% | 8.9%(+10.2)#100 | 5.5%(+13.6)#2,519 |
Common Questions
What are the Top 10 Cities with the Highest Percentage of Population Employed in Production in Michigan?
Top 10 Cities with the Highest Percentage of Population Employed in Production in Michigan are:
#1
43.5%
#2
37.6%
#3
35.6%
#4
35.1%
#5
33.3%
#6
32.3%
#7
32.1%
#8
31.9%
#9
31.6%
#10
31.4%
What city has the Highest Percentage of Population Employed in Production in Michigan?
Boon has the Highest Percentage of Population Employed in Production in Michigan with 43.5%.
What is the Percentage of Population Employed in Production in the State of Michigan?
Percentage of Population Employed in Production in Michigan is 8.9%.
What is the Percentage of Population Employed in Production in the United States?
Percentage of Population Employed in Production in the United States is 5.5%.