Cities with the Highest Percentage of Population Employed in Production in Maryland
RELATED REPORTS & OPTIONS
Production
Maryland
Compare Cities
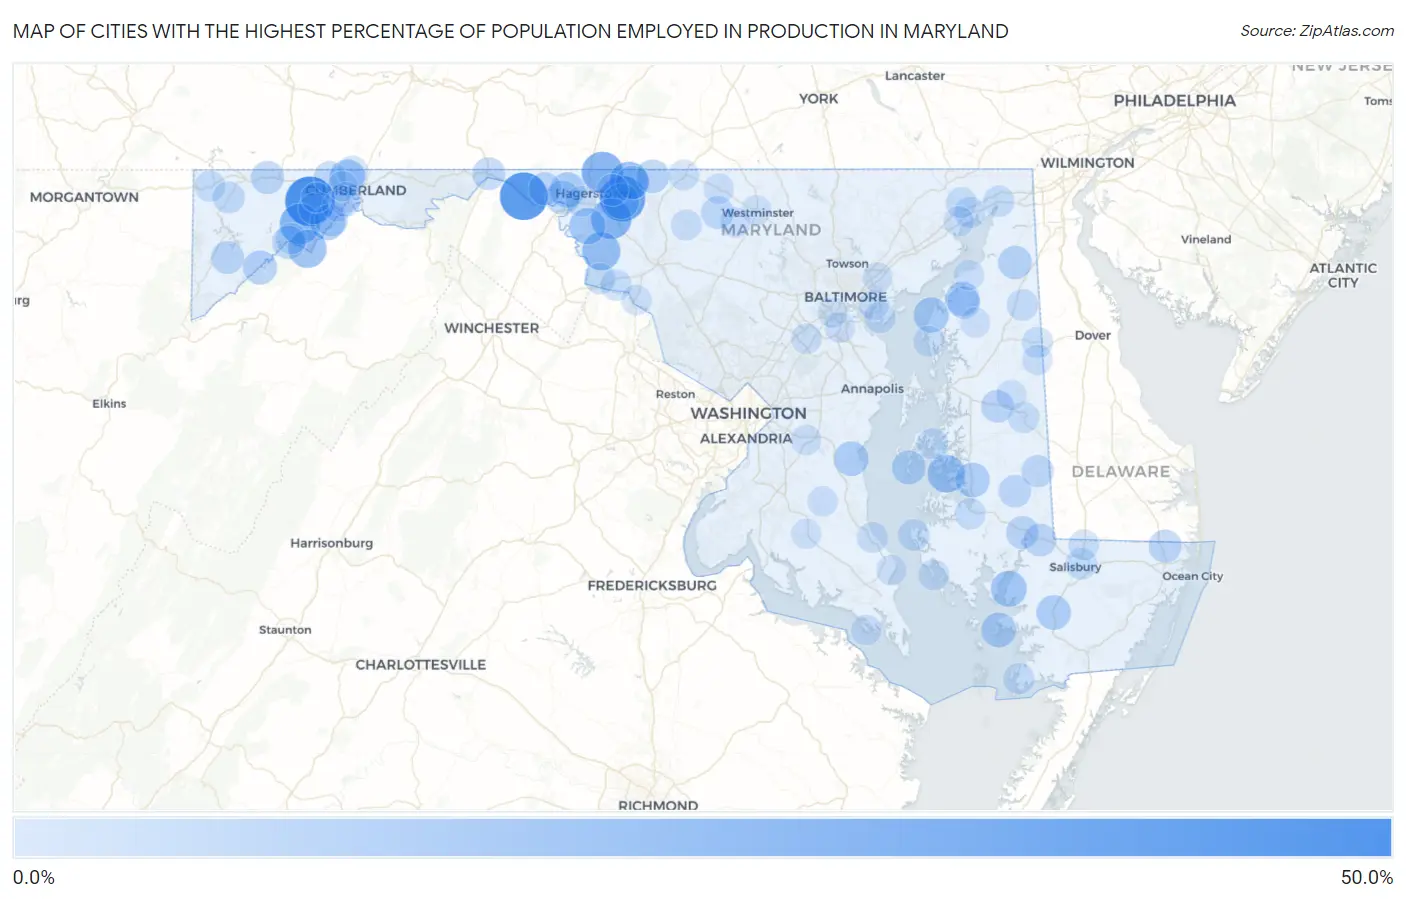
Map of Cities with the Highest Percentage of Population Employed in Production in Maryland
0.0%
50.0%
Cities with the Highest Percentage of Population Employed in Production in Maryland
| City | % Employed | vs State | vs National | |
| 1. | Klondike | 49.3% | 2.7%(+46.5)#1 | 5.5%(+43.8)#216 |
| 2. | Ernstville | 45.0% | 2.7%(+42.3)#2 | 5.5%(+39.5)#266 |
| 3. | Pondsville | 39.7% | 2.7%(+37.0)#3 | 5.5%(+34.2)#368 |
| 4. | Reid | 30.6% | 2.7%(+27.8)#4 | 5.5%(+25.1)#735 |
| 5. | San Mar | 28.4% | 2.7%(+25.7)#5 | 5.5%(+23.0)#893 |
| 6. | Moscow | 28.3% | 2.7%(+25.6)#6 | 5.5%(+22.8)#911 |
| 7. | Greensburg | 25.0% | 2.7%(+22.3)#7 | 5.5%(+19.5)#1,268 |
| 8. | Mount Briar | 23.4% | 2.7%(+20.7)#8 | 5.5%(+18.0)#1,515 |
| 9. | Mccoole | 22.8% | 2.7%(+20.0)#9 | 5.5%(+17.3)#1,630 |
| 10. | Oxford | 21.5% | 2.7%(+18.8)#10 | 5.5%(+16.0)#1,881 |
| 11. | Tilghmanton | 18.6% | 2.7%(+15.8)#11 | 5.5%(+13.1)#2,714 |
| 12. | Corriganville | 18.2% | 2.7%(+15.5)#12 | 5.5%(+12.7)#2,853 |
| 13. | Jesterville | 18.1% | 2.7%(+15.3)#13 | 5.5%(+12.6)#2,918 |
| 14. | Jugtown | 16.9% | 2.7%(+14.2)#14 | 5.5%(+11.4)#3,408 |
| 15. | Wilson Conococheague | 16.2% | 2.7%(+13.5)#15 | 5.5%(+10.7)#3,761 |
| 16. | Rawlings | 16.1% | 2.7%(+13.4)#16 | 5.5%(+10.7)#3,785 |
| 17. | Tolchester | 16.0% | 2.7%(+13.3)#17 | 5.5%(+10.5)#3,869 |
| 18. | Deal Island | 15.5% | 2.7%(+12.8)#18 | 5.5%(+10.0)#4,116 |
| 19. | Princess Anne | 15.0% | 2.7%(+12.2)#19 | 5.5%(+9.49)#4,436 |
| 20. | Friendship | 14.8% | 2.7%(+12.0)#20 | 5.5%(+9.29)#4,574 |
| 21. | Trappe | 14.6% | 2.7%(+11.9)#21 | 5.5%(+9.16)#4,656 |
| 22. | Kitzmiller | 13.6% | 2.7%(+10.9)#22 | 5.5%(+8.17)#5,246 |
| 23. | Butlertown | 13.6% | 2.7%(+10.9)#23 | 5.5%(+8.11)#5,305 |
| 24. | Pinesburg | 13.6% | 2.7%(+10.9)#24 | 5.5%(+8.11)#5,306 |
| 25. | Tilghman Island | 13.3% | 2.7%(+10.5)#25 | 5.5%(+7.79)#5,556 |
| 26. | Cecilton | 12.7% | 2.7%(+9.97)#26 | 5.5%(+7.23)#6,019 |
| 27. | Edgemont | 12.3% | 2.7%(+9.60)#27 | 5.5%(+6.86)#6,342 |
| 28. | Sabillasville | 12.2% | 2.7%(+9.44)#28 | 5.5%(+6.69)#6,470 |
| 29. | Luke | 11.9% | 2.7%(+9.18)#29 | 5.5%(+6.44)#6,730 |
| 30. | Grantsville | 11.7% | 2.7%(+8.98)#30 | 5.5%(+6.23)#6,933 |
| 31. | Deer Park | 11.3% | 2.7%(+8.61)#31 | 5.5%(+5.86)#7,287 |
| 32. | Clear Spring | 11.3% | 2.7%(+8.59)#32 | 5.5%(+5.84)#7,310 |
| 33. | Bishopville | 11.2% | 2.7%(+8.50)#33 | 5.5%(+5.76)#7,400 |
| 34. | Mardela Springs | 11.2% | 2.7%(+8.43)#34 | 5.5%(+5.69)#7,469 |
| 35. | Bier | 11.0% | 2.7%(+8.27)#35 | 5.5%(+5.52)#7,667 |
| 36. | Vienna | 10.8% | 2.7%(+8.11)#36 | 5.5%(+5.37)#7,821 |
| 37. | Hancock | 10.8% | 2.7%(+8.08)#37 | 5.5%(+5.33)#7,851 |
| 38. | Hillsboro | 10.8% | 2.7%(+8.03)#38 | 5.5%(+5.28)#7,900 |
| 39. | Union Bridge | 10.5% | 2.7%(+7.73)#39 | 5.5%(+4.99)#8,208 |
| 40. | Worton | 10.3% | 2.7%(+7.59)#40 | 5.5%(+4.84)#8,360 |
| 41. | Mount Savage | 10.2% | 2.7%(+7.51)#41 | 5.5%(+4.77)#8,437 |
| 42. | Hurlock | 10.1% | 2.7%(+7.40)#42 | 5.5%(+4.65)#8,615 |
| 43. | Federalsburg | 9.5% | 2.7%(+6.79)#43 | 5.5%(+4.05)#9,327 |
| 44. | Chewsville | 9.1% | 2.7%(+6.37)#44 | 5.5%(+3.62)#9,846 |
| 45. | Accident | 8.7% | 2.7%(+6.01)#45 | 5.5%(+3.27)#10,314 |
| 46. | Taylors Island | 8.3% | 2.7%(+5.61)#46 | 5.5%(+2.86)#10,907 |
| 47. | Salisbury | 8.1% | 2.7%(+5.38)#47 | 5.5%(+2.64)#11,194 |
| 48. | Millington | 7.8% | 2.7%(+5.11)#48 | 5.5%(+2.37)#11,604 |
| 49. | Graceham | 7.8% | 2.7%(+5.09)#49 | 5.5%(+2.34)#11,649 |
| 50. | North East | 7.6% | 2.7%(+4.90)#50 | 5.5%(+2.16)#11,939 |
| 51. | Denton | 7.4% | 2.7%(+4.66)#51 | 5.5%(+1.92)#12,339 |
| 52. | Rosemont | 7.3% | 2.7%(+4.53)#52 | 5.5%(+1.79)#12,549 |
| 53. | Edgemere | 7.2% | 2.7%(+4.52)#53 | 5.5%(+1.77)#12,579 |
| 54. | Garretts Mill | 7.2% | 2.7%(+4.46)#54 | 5.5%(+1.72)#12,662 |
| 55. | Friendsville | 7.2% | 2.7%(+4.46)#55 | 5.5%(+1.71)#12,673 |
| 56. | Westernport | 7.1% | 2.7%(+4.41)#56 | 5.5%(+1.67)#12,766 |
| 57. | St Michaels | 7.1% | 2.7%(+4.39)#57 | 5.5%(+1.64)#12,804 |
| 58. | Ten Mile Creek | 7.0% | 2.7%(+4.31)#58 | 5.5%(+1.56)#12,936 |
| 59. | Crisfield | 7.0% | 2.7%(+4.30)#59 | 5.5%(+1.55)#12,948 |
| 60. | Cambridge | 6.9% | 2.7%(+4.22)#60 | 5.5%(+1.48)#13,068 |
| 61. | Templeville | 6.9% | 2.7%(+4.22)#61 | 5.5%(+1.48)#13,077 |
| 62. | Perryville | 6.9% | 2.7%(+4.19)#62 | 5.5%(+1.45)#13,118 |
| 63. | Ellerslie | 6.8% | 2.7%(+4.09)#63 | 5.5%(+1.35)#13,281 |
| 64. | Port Deposit | 6.8% | 2.7%(+4.08)#64 | 5.5%(+1.33)#13,309 |
| 65. | Rock Hall | 6.8% | 2.7%(+4.06)#65 | 5.5%(+1.31)#13,346 |
| 66. | Delmar | 6.8% | 2.7%(+4.05)#66 | 5.5%(+1.31)#13,356 |
| 67. | St Leonard | 6.6% | 2.7%(+3.93)#67 | 5.5%(+1.18)#13,597 |
| 68. | Cresaptown | 6.6% | 2.7%(+3.92)#68 | 5.5%(+1.17)#13,608 |
| 69. | Bowling Green | 6.5% | 2.7%(+3.77)#69 | 5.5%(+1.02)#13,861 |
| 70. | Halfway | 6.4% | 2.7%(+3.72)#70 | 5.5%(+0.975)#13,934 |
| 71. | Woodsboro | 6.4% | 2.7%(+3.71)#71 | 5.5%(+0.970)#13,942 |
| 72. | Fishing Creek | 6.4% | 2.7%(+3.66)#72 | 5.5%(+0.914)#14,031 |
| 73. | Emmitsburg | 6.4% | 2.7%(+3.65)#73 | 5.5%(+0.904)#14,050 |
| 74. | Midland | 6.2% | 2.7%(+3.48)#74 | 5.5%(+0.738)#14,362 |
| 75. | Jessup | 6.2% | 2.7%(+3.45)#75 | 5.5%(+0.708)#14,414 |
| 76. | Crumpton | 6.1% | 2.7%(+3.36)#76 | 5.5%(+0.613)#14,581 |
| 77. | Flower Hill | 6.0% | 2.7%(+3.26)#77 | 5.5%(+0.520)#14,745 |
| 78. | New Windsor | 6.0% | 2.7%(+3.25)#78 | 5.5%(+0.504)#14,783 |
| 79. | Ferndale | 5.9% | 2.7%(+3.20)#79 | 5.5%(+0.451)#14,872 |
| 80. | Romancoke | 5.9% | 2.7%(+3.19)#80 | 5.5%(+0.443)#14,884 |
| 81. | Taneytown | 5.9% | 2.7%(+3.18)#81 | 5.5%(+0.436)#14,900 |
| 82. | Betterton | 5.8% | 2.7%(+3.11)#82 | 5.5%(+0.365)#15,038 |
| 83. | Queensland | 5.8% | 2.7%(+3.07)#83 | 5.5%(+0.321)#15,127 |
| 84. | Piney Point | 5.8% | 2.7%(+3.06)#84 | 5.5%(+0.315)#15,149 |
| 85. | Henderson | 5.7% | 2.7%(+2.99)#85 | 5.5%(+0.246)#15,290 |
| 86. | Potomac Park | 5.7% | 2.7%(+2.97)#86 | 5.5%(+0.226)#15,330 |
| 87. | Havre De Grace | 5.7% | 2.7%(+2.97)#87 | 5.5%(+0.226)#15,331 |
| 88. | Point Of Rocks | 5.7% | 2.7%(+2.96)#88 | 5.5%(+0.219)#15,348 |
| 89. | Aquasco | 5.7% | 2.7%(+2.95)#89 | 5.5%(+0.210)#15,369 |
| 90. | Dundalk | 5.6% | 2.7%(+2.90)#90 | 5.5%(+0.160)#15,473 |
| 91. | Rossville | 5.4% | 2.7%(+2.72)#91 | 5.5%(-0.025)#15,816 |
| 92. | Lewistown | 5.4% | 2.7%(+2.72)#92 | 5.5%(-0.026)#15,819 |
| 93. | Lansdowne | 5.3% | 2.7%(+2.55)#93 | 5.5%(-0.196)#16,138 |
| 94. | Charlotte Hall | 5.3% | 2.7%(+2.53)#94 | 5.5%(-0.216)#16,203 |
| 95. | Ridgely | 5.3% | 2.7%(+2.53)#95 | 5.5%(-0.218)#16,205 |
| 96. | Chesapeake Ranch Estates | 5.2% | 2.7%(+2.49)#96 | 5.5%(-0.255)#16,266 |
| 97. | Shaft | 5.2% | 2.7%(+2.47)#97 | 5.5%(-0.274)#16,299 |
| 98. | Kingstown | 5.2% | 2.7%(+2.47)#98 | 5.5%(-0.275)#16,305 |
| 99. | Westminster | 5.1% | 2.7%(+2.36)#99 | 5.5%(-0.384)#16,496 |
| 100. | La Vale | 5.1% | 2.7%(+2.35)#100 | 5.5%(-0.397)#16,519 |
Common Questions
What are the Top 10 Cities with the Highest Percentage of Population Employed in Production in Maryland?
Top 10 Cities with the Highest Percentage of Population Employed in Production in Maryland are:
#1
49.3%
#2
45.0%
#3
39.7%
#4
30.6%
#5
28.4%
#6
28.3%
#7
25.0%
#8
23.4%
#9
22.8%
#10
21.5%
What city has the Highest Percentage of Population Employed in Production in Maryland?
Klondike has the Highest Percentage of Population Employed in Production in Maryland with 49.3%.
What is the Percentage of Population Employed in Production in the State of Maryland?
Percentage of Population Employed in Production in Maryland is 2.7%.
What is the Percentage of Population Employed in Production in the United States?
Percentage of Population Employed in Production in the United States is 5.5%.