Cities with the Highest Percentage of Population Employed in Production in Oklahoma
RELATED REPORTS & OPTIONS
Production
Oklahoma
Compare Cities
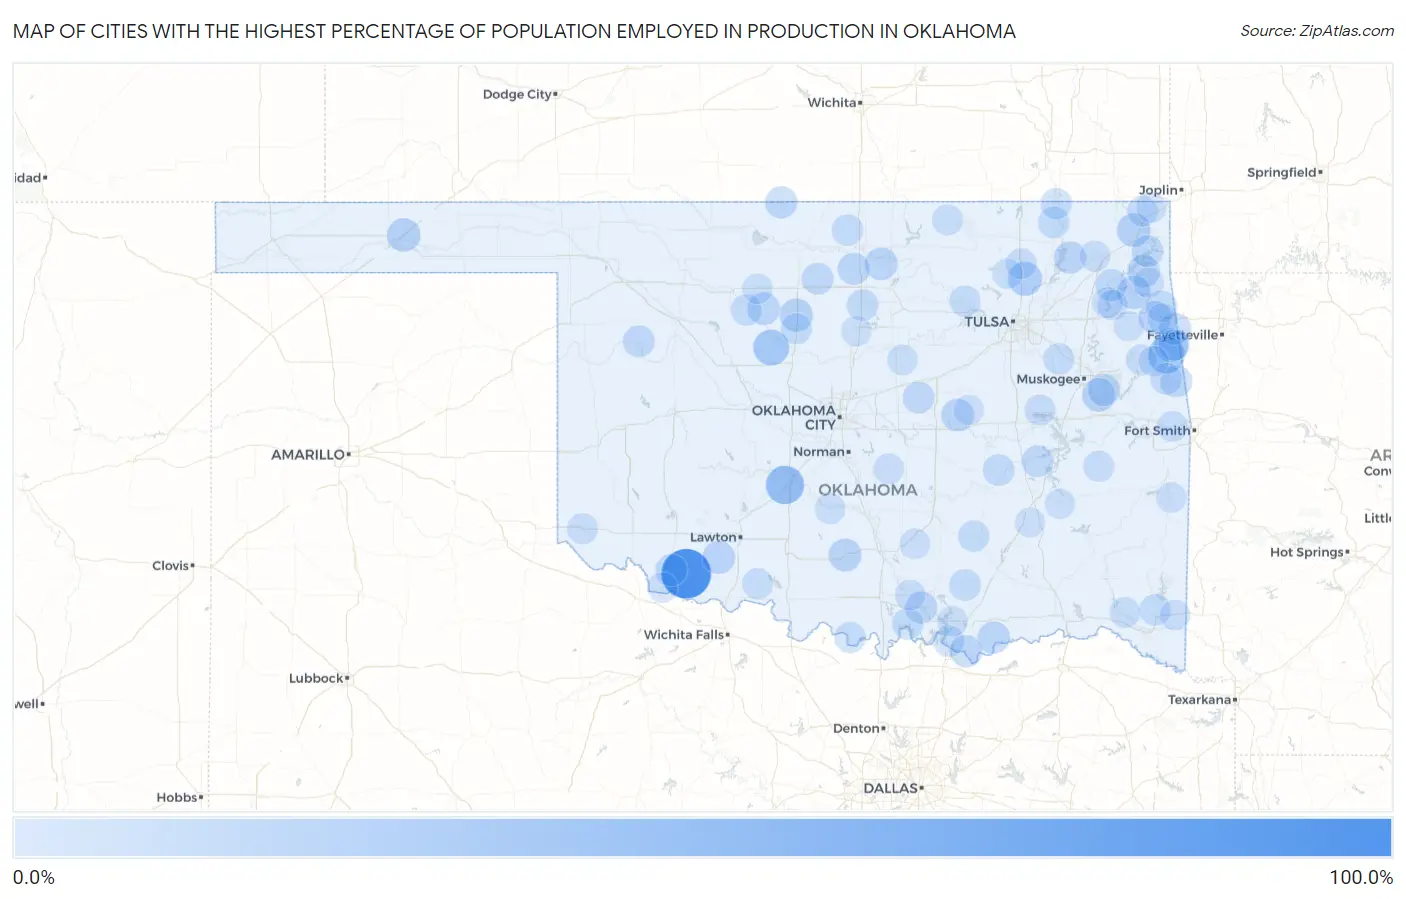
Map of Cities with the Highest Percentage of Population Employed in Production in Oklahoma
0.0%
100.0%
Cities with the Highest Percentage of Population Employed in Production in Oklahoma
| City | % Employed | vs State | vs National | |
| 1. | Hollister | 100.0% | 6.4%(+93.6)#1 | 5.5%(+94.5)#30 |
| 2. | Norge | 50.0% | 6.4%(+43.6)#2 | 5.5%(+44.5)#193 |
| 3. | Sumner | 50.0% | 6.4%(+43.6)#3 | 5.5%(+44.5)#209 |
| 4. | Washita | 48.9% | 6.4%(+42.5)#4 | 5.5%(+43.4)#218 |
| 5. | West Peavine | 43.7% | 6.4%(+37.3)#5 | 5.5%(+38.2)#282 |
| 6. | Emet | 41.7% | 6.4%(+35.3)#6 | 5.5%(+36.2)#325 |
| 7. | Loyal | 38.7% | 6.4%(+32.3)#7 | 5.5%(+33.2)#391 |
| 8. | Little | 38.5% | 6.4%(+32.1)#8 | 5.5%(+33.0)#399 |
| 9. | Bunch | 33.3% | 6.4%(+27.0)#9 | 5.5%(+27.9)#581 |
| 10. | Old Green | 32.7% | 6.4%(+26.4)#10 | 5.5%(+27.3)#609 |
| 11. | Vera | 31.8% | 6.4%(+25.4)#11 | 5.5%(+26.3)#654 |
| 12. | Oak Hill-Piney | 30.6% | 6.4%(+24.3)#12 | 5.5%(+25.2)#729 |
| 13. | Narcissa | 30.0% | 6.4%(+23.6)#13 | 5.5%(+24.5)#762 |
| 14. | Optima | 28.8% | 6.4%(+22.4)#14 | 5.5%(+23.3)#851 |
| 15. | Old Eucha | 28.6% | 6.4%(+22.2)#15 | 5.5%(+23.1)#884 |
| 16. | River Bottom | 28.4% | 6.4%(+22.0)#16 | 5.5%(+22.9)#896 |
| 17. | Bison | 27.8% | 6.4%(+21.4)#17 | 5.5%(+22.3)#954 |
| 18. | Whitehorn Cove | 27.0% | 6.4%(+20.7)#18 | 5.5%(+21.6)#1,030 |
| 19. | Tatums | 26.8% | 6.4%(+20.5)#19 | 5.5%(+21.4)#1,043 |
| 20. | Earl | 26.8% | 6.4%(+20.5)#20 | 5.5%(+21.4)#1,047 |
| 21. | Honey Hill | 26.1% | 6.4%(+19.7)#21 | 5.5%(+20.6)#1,122 |
| 22. | Faxon | 25.9% | 6.4%(+19.6)#22 | 5.5%(+20.5)#1,145 |
| 23. | Flint Creek | 25.9% | 6.4%(+19.5)#23 | 5.5%(+20.4)#1,149 |
| 24. | Boley | 25.8% | 6.4%(+19.4)#24 | 5.5%(+20.3)#1,157 |
| 25. | Lone Chimney | 25.6% | 6.4%(+19.3)#25 | 5.5%(+20.2)#1,178 |
| 26. | Ames | 25.5% | 6.4%(+19.2)#26 | 5.5%(+20.1)#1,190 |
| 27. | Marland | 25.3% | 6.4%(+19.0)#27 | 5.5%(+19.9)#1,218 |
| 28. | Zena | 25.0% | 6.4%(+18.6)#28 | 5.5%(+19.5)#1,262 |
| 29. | Albany | 24.0% | 6.4%(+17.6)#29 | 5.5%(+18.5)#1,420 |
| 30. | Braggs | 23.9% | 6.4%(+17.5)#30 | 5.5%(+18.4)#1,435 |
| 31. | New Alluwe | 23.8% | 6.4%(+17.4)#31 | 5.5%(+18.3)#1,452 |
| 32. | Watts | 23.7% | 6.4%(+17.3)#32 | 5.5%(+18.2)#1,474 |
| 33. | Billings | 23.7% | 6.4%(+17.3)#33 | 5.5%(+18.2)#1,481 |
| 34. | Manchester | 23.3% | 6.4%(+16.9)#34 | 5.5%(+17.8)#1,550 |
| 35. | Oakland | 23.1% | 6.4%(+16.7)#35 | 5.5%(+17.6)#1,578 |
| 36. | Hendrix | 23.1% | 6.4%(+16.7)#36 | 5.5%(+17.6)#1,583 |
| 37. | Frederick | 22.7% | 6.4%(+16.3)#37 | 5.5%(+17.2)#1,643 |
| 38. | Camargo | 22.5% | 6.4%(+16.2)#38 | 5.5%(+17.1)#1,669 |
| 39. | Bell | 22.4% | 6.4%(+16.1)#39 | 5.5%(+17.0)#1,681 |
| 40. | Copeland | 22.4% | 6.4%(+16.0)#40 | 5.5%(+16.9)#1,699 |
| 41. | Strang | 22.2% | 6.4%(+15.9)#41 | 5.5%(+16.8)#1,737 |
| 42. | Breckenridge | 21.9% | 6.4%(+15.5)#42 | 5.5%(+16.4)#1,796 |
| 43. | Sparks | 21.8% | 6.4%(+15.5)#43 | 5.5%(+16.3)#1,810 |
| 44. | White Eagle | 21.7% | 6.4%(+15.3)#44 | 5.5%(+16.2)#1,837 |
| 45. | Indianola | 21.6% | 6.4%(+15.3)#45 | 5.5%(+16.2)#1,854 |
| 46. | Cherry Tree | 21.4% | 6.4%(+15.0)#46 | 5.5%(+15.9)#1,905 |
| 47. | Lamar | 21.2% | 6.4%(+14.8)#47 | 5.5%(+15.7)#1,944 |
| 48. | Cumberland | 21.2% | 6.4%(+14.8)#48 | 5.5%(+15.7)#1,958 |
| 49. | Coleman | 21.0% | 6.4%(+14.7)#49 | 5.5%(+15.6)#2,001 |
| 50. | Perry | 20.8% | 6.4%(+14.5)#50 | 5.5%(+15.4)#2,045 |
| 51. | Lenapah | 20.7% | 6.4%(+14.3)#51 | 5.5%(+15.2)#2,081 |
| 52. | Colcord | 20.4% | 6.4%(+14.1)#52 | 5.5%(+15.0)#2,149 |
| 53. | Lebanon | 20.2% | 6.4%(+13.8)#53 | 5.5%(+14.7)#2,206 |
| 54. | Nardin | 20.0% | 6.4%(+13.6)#54 | 5.5%(+14.5)#2,264 |
| 55. | Osage | 20.0% | 6.4%(+13.6)#55 | 5.5%(+14.5)#2,268 |
| 56. | Centrahoma | 20.0% | 6.4%(+13.6)#56 | 5.5%(+14.5)#2,272 |
| 57. | Fox | 20.0% | 6.4%(+13.6)#57 | 5.5%(+14.5)#2,273 |
| 58. | Broken Bow | 19.9% | 6.4%(+13.6)#58 | 5.5%(+14.5)#2,287 |
| 59. | South Coffeyville | 19.6% | 6.4%(+13.3)#59 | 5.5%(+14.2)#2,372 |
| 60. | Isabella | 19.4% | 6.4%(+13.0)#60 | 5.5%(+13.9)#2,451 |
| 61. | Hennessey | 19.2% | 6.4%(+12.8)#61 | 5.5%(+13.7)#2,485 |
| 62. | Cartwright | 19.1% | 6.4%(+12.7)#62 | 5.5%(+13.6)#2,526 |
| 63. | Leon | 19.0% | 6.4%(+12.7)#63 | 5.5%(+13.6)#2,539 |
| 64. | Redbird | 18.9% | 6.4%(+12.5)#64 | 5.5%(+13.4)#2,604 |
| 65. | Westville | 18.7% | 6.4%(+12.3)#65 | 5.5%(+13.2)#2,677 |
| 66. | Gould | 18.4% | 6.4%(+12.1)#66 | 5.5%(+13.0)#2,760 |
| 67. | Ramona | 18.4% | 6.4%(+12.0)#67 | 5.5%(+12.9)#2,779 |
| 68. | White Oak | 18.3% | 6.4%(+11.9)#68 | 5.5%(+12.8)#2,804 |
| 69. | Temple | 18.3% | 6.4%(+11.9)#69 | 5.5%(+12.8)#2,814 |
| 70. | Hitchita | 18.2% | 6.4%(+11.8)#70 | 5.5%(+12.7)#2,875 |
| 71. | Foraker | 18.2% | 6.4%(+11.8)#71 | 5.5%(+12.7)#2,878 |
| 72. | Kinta | 18.0% | 6.4%(+11.6)#72 | 5.5%(+12.5)#2,950 |
| 73. | Wright City | 17.8% | 6.4%(+11.4)#73 | 5.5%(+12.3)#3,018 |
| 74. | Welling | 17.8% | 6.4%(+11.4)#74 | 5.5%(+12.3)#3,023 |
| 75. | Salina | 17.7% | 6.4%(+11.3)#75 | 5.5%(+12.2)#3,048 |
| 76. | Commerce | 17.6% | 6.4%(+11.2)#76 | 5.5%(+12.1)#3,098 |
| 77. | Muldrow | 17.4% | 6.4%(+11.0)#77 | 5.5%(+11.9)#3,159 |
| 78. | Dripping Springs | 17.4% | 6.4%(+11.0)#78 | 5.5%(+11.9)#3,173 |
| 79. | Erin Springs | 17.3% | 6.4%(+10.9)#79 | 5.5%(+11.8)#3,214 |
| 80. | Tryon | 17.2% | 6.4%(+10.9)#80 | 5.5%(+11.8)#3,250 |
| 81. | Eagletown | 17.2% | 6.4%(+10.8)#81 | 5.5%(+11.7)#3,278 |
| 82. | Tribbey | 17.1% | 6.4%(+10.7)#82 | 5.5%(+11.6)#3,339 |
| 83. | Mannsville | 17.0% | 6.4%(+10.6)#83 | 5.5%(+11.5)#3,367 |
| 84. | Hickory | 16.7% | 6.4%(+10.3)#84 | 5.5%(+11.2)#3,517 |
| 85. | Mead | 16.4% | 6.4%(+10.0)#85 | 5.5%(+10.9)#3,677 |
| 86. | Avant | 16.3% | 6.4%(+9.94)#86 | 5.5%(+10.8)#3,704 |
| 87. | Pump Back | 16.3% | 6.4%(+9.91)#87 | 5.5%(+10.8)#3,719 |
| 88. | Jay | 16.3% | 6.4%(+9.90)#88 | 5.5%(+10.8)#3,727 |
| 89. | Ringwood | 16.2% | 6.4%(+9.88)#89 | 5.5%(+10.8)#3,744 |
| 90. | Wauhillau | 16.2% | 6.4%(+9.87)#90 | 5.5%(+10.8)#3,745 |
| 91. | Davidson | 16.2% | 6.4%(+9.80)#91 | 5.5%(+10.7)#3,777 |
| 92. | Heavener | 16.1% | 6.4%(+9.72)#92 | 5.5%(+10.6)#3,818 |
| 93. | Haileyville | 15.9% | 6.4%(+9.58)#93 | 5.5%(+10.5)#3,888 |
| 94. | Mulhall | 15.8% | 6.4%(+9.45)#94 | 5.5%(+10.4)#3,967 |
| 95. | Teresita | 15.4% | 6.4%(+9.02)#95 | 5.5%(+9.92)#4,169 |
| 96. | Whippoorwill | 15.4% | 6.4%(+9.02)#96 | 5.5%(+9.92)#4,182 |
| 97. | Ixl | 15.4% | 6.4%(+9.02)#97 | 5.5%(+9.92)#4,185 |
| 98. | Dixon | 15.3% | 6.4%(+8.93)#98 | 5.5%(+9.83)#4,233 |
| 99. | Pittsburg | 15.3% | 6.4%(+8.89)#99 | 5.5%(+9.79)#4,246 |
| 100. | Quapaw | 15.2% | 6.4%(+8.88)#100 | 5.5%(+9.78)#4,251 |
Common Questions
What are the Top 10 Cities with the Highest Percentage of Population Employed in Production in Oklahoma?
Top 10 Cities with the Highest Percentage of Population Employed in Production in Oklahoma are:
#1
100.0%
#2
50.0%
#3
43.7%
#4
38.7%
#5
32.7%
#6
31.8%
#7
30.0%
#8
28.8%
#9
28.6%
#10
28.4%
What city has the Highest Percentage of Population Employed in Production in Oklahoma?
Hollister has the Highest Percentage of Population Employed in Production in Oklahoma with 100.0%.
What is the Percentage of Population Employed in Production in the State of Oklahoma?
Percentage of Population Employed in Production in Oklahoma is 6.4%.
What is the Percentage of Population Employed in Production in the United States?
Percentage of Population Employed in Production in the United States is 5.5%.