Crenshaw, PA Map & Demographics
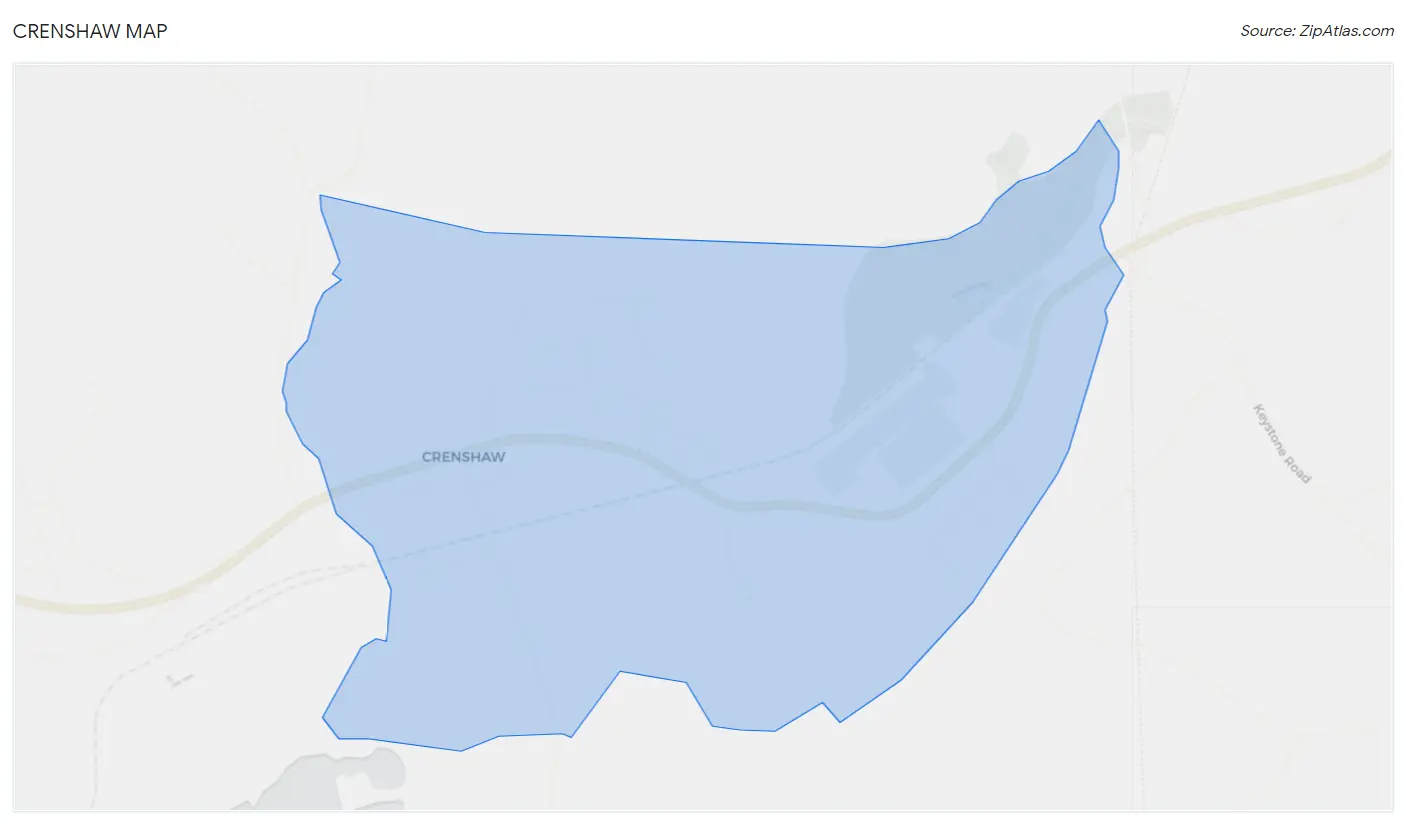
Crenshaw Map
Crenshaw Overview
$38,694
PER CAPITA INCOME
$75,074
AVG HOUSEHOLD INCOME
0.27
INEQUALITY / GINI INDEX
306
TOTAL POPULATION
154
MALE POPULATION
152
FEMALE POPULATION
101.32
MALES / 100 FEMALES
98.70
FEMALES / 100 MALES
52.2
MEDIAN AGE
2.9
AVG FAMILY SIZE
2.2
AVG HOUSEHOLD SIZE
142
LABOR FORCE [ PEOPLE ]
50.5%
PERCENT IN LABOR FORCE
12.0%
UNEMPLOYMENT RATE
Income in Crenshaw
Income Overview in Crenshaw
| Characteristic | Number | Measure |
| Per Capita Income | 306 | $38,694 |
| Median Family Income | 76 | $0 |
| Mean Family Income | 76 | $85,009 |
| Median Household Income | 139 | $75,074 |
| Mean Household Income | 139 | $78,319 |
| Income Deficit | 76 | $0 |
| Wage / Income Gap (%) | 306 | 0.00% |
| Wage / Income Gap ($) | 306 | 100.00¢ per $1 |
| Gini / Inequality Index | 306 | 0.27 |
Earnings by Sex in Crenshaw
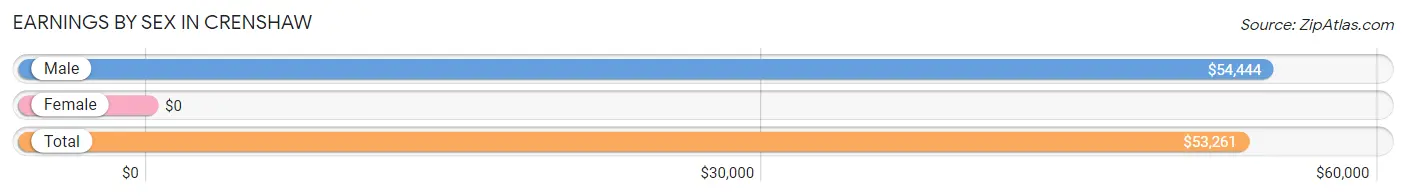
| Sex | Number | Average Earnings |
| Male | 86 (60.6%) | $54,444 |
| Female | 56 (39.4%) | $0 |
| Total | 142 (100.0%) | $53,261 |
Earnings by Sex by Income Bracket in Crenshaw
The most common earnings brackets in Crenshaw are $75,000 to $99,999 for men (22 | 25.6%) and $12,500 to $14,999 for women (17 | 30.4%).
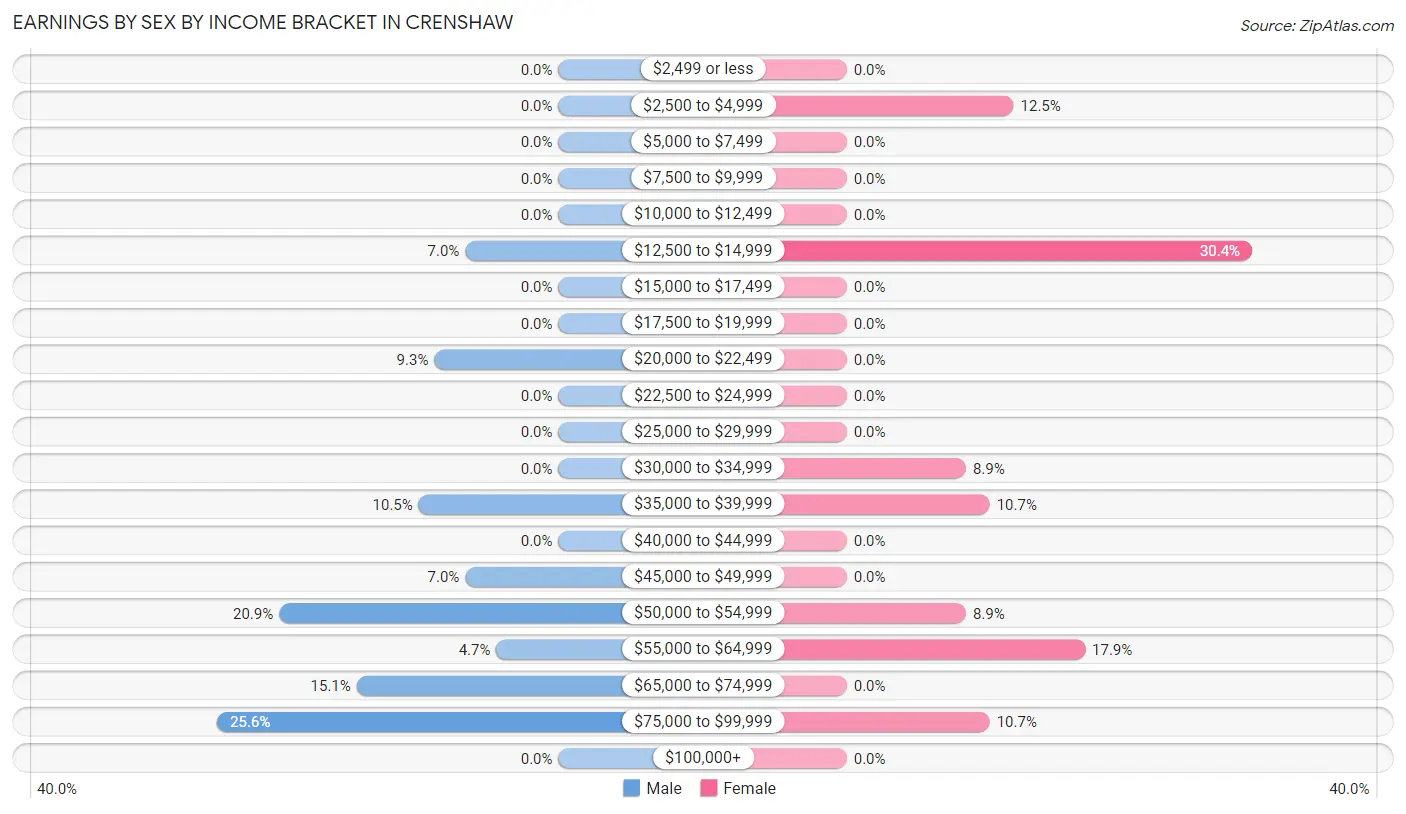
| Income | Male | Female |
| $2,499 or less | 0 (0.0%) | 0 (0.0%) |
| $2,500 to $4,999 | 0 (0.0%) | 7 (12.5%) |
| $5,000 to $7,499 | 0 (0.0%) | 0 (0.0%) |
| $7,500 to $9,999 | 0 (0.0%) | 0 (0.0%) |
| $10,000 to $12,499 | 0 (0.0%) | 0 (0.0%) |
| $12,500 to $14,999 | 6 (7.0%) | 17 (30.4%) |
| $15,000 to $17,499 | 0 (0.0%) | 0 (0.0%) |
| $17,500 to $19,999 | 0 (0.0%) | 0 (0.0%) |
| $20,000 to $22,499 | 8 (9.3%) | 0 (0.0%) |
| $22,500 to $24,999 | 0 (0.0%) | 0 (0.0%) |
| $25,000 to $29,999 | 0 (0.0%) | 0 (0.0%) |
| $30,000 to $34,999 | 0 (0.0%) | 5 (8.9%) |
| $35,000 to $39,999 | 9 (10.5%) | 6 (10.7%) |
| $40,000 to $44,999 | 0 (0.0%) | 0 (0.0%) |
| $45,000 to $49,999 | 6 (7.0%) | 0 (0.0%) |
| $50,000 to $54,999 | 18 (20.9%) | 5 (8.9%) |
| $55,000 to $64,999 | 4 (4.6%) | 10 (17.9%) |
| $65,000 to $74,999 | 13 (15.1%) | 0 (0.0%) |
| $75,000 to $99,999 | 22 (25.6%) | 6 (10.7%) |
| $100,000+ | 0 (0.0%) | 0 (0.0%) |
| Total | 86 (100.0%) | 56 (100.0%) |
Earnings by Sex by Educational Attainment in Crenshaw
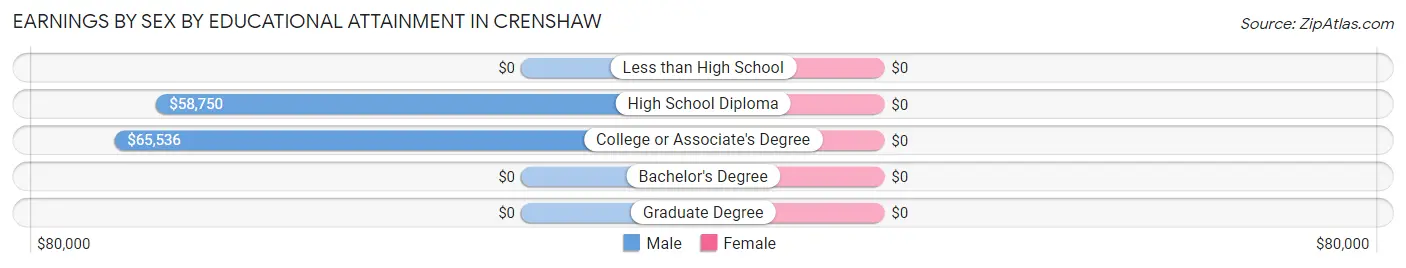
| Educational Attainment | Male Income | Female Income |
| Less than High School | - | - |
| High School Diploma | $58,750 | $0 |
| College or Associate's Degree | $65,536 | $0 |
| Bachelor's Degree | - | - |
| Graduate Degree | - | - |
| Total | $54,444 | $0 |
Family Income in Crenshaw
Family Income Brackets in Crenshaw
According to the Crenshaw family income data, there are 35 families falling into the $100,000 to $149,999 income range, which is the most common income bracket and makes up 46.1% of all families.
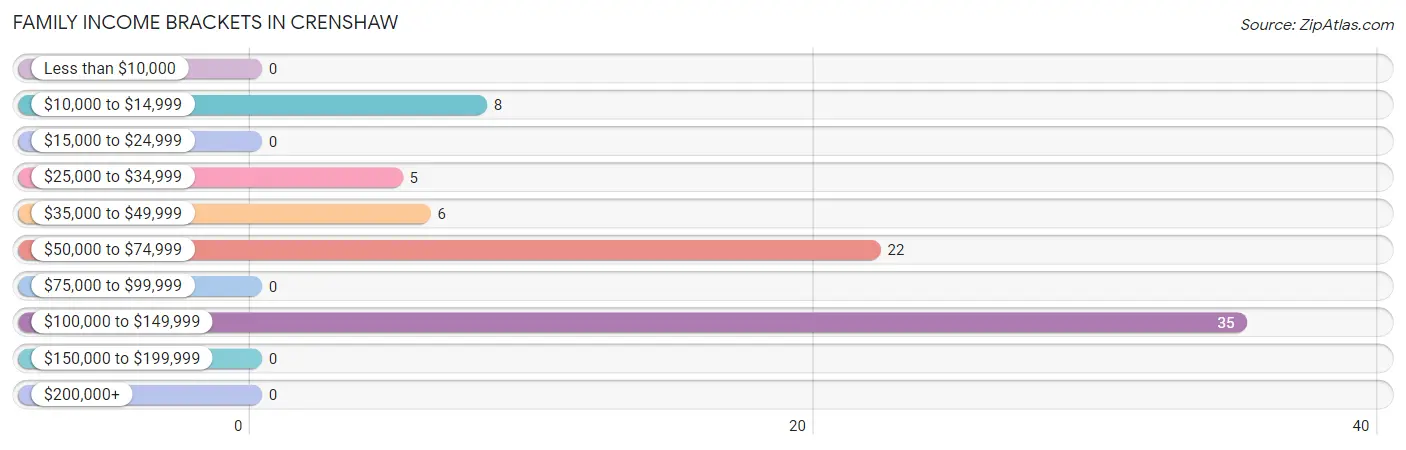
| Income Bracket | # Families | % Families |
| Less than $10,000 | 0 | 0.0% |
| $10,000 to $14,999 | 8 | 10.5% |
| $15,000 to $24,999 | 0 | 0.0% |
| $25,000 to $34,999 | 5 | 6.6% |
| $35,000 to $49,999 | 6 | 7.9% |
| $50,000 to $74,999 | 22 | 28.9% |
| $75,000 to $99,999 | 0 | 0.0% |
| $100,000 to $149,999 | 35 | 46.1% |
| $150,000 to $199,999 | 0 | 0.0% |
| $200,000+ | 0 | 0.0% |
Family Income by Famaliy Size in Crenshaw
2-person families (56 | 73.7%) account for the highest median family income in Crenshaw with $68,409 per family, while 2-person families (56 | 73.7%) have the highest median income of $34,204 per family member.
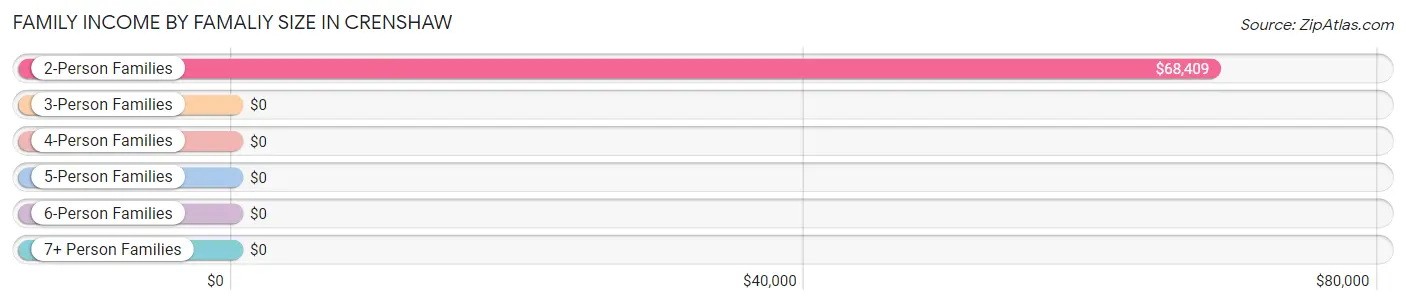
| Income Bracket | # Families | Median Income |
| 2-Person Families | 56 (73.7%) | $68,409 |
| 3-Person Families | 10 (13.2%) | $0 |
| 4-Person Families | 4 (5.3%) | $0 |
| 5-Person Families | 6 (7.9%) | $0 |
| 6-Person Families | 0 (0.0%) | $0 |
| 7+ Person Families | 0 (0.0%) | $0 |
| Total | 76 (100.0%) | $0 |
Family Income by Number of Earners in Crenshaw
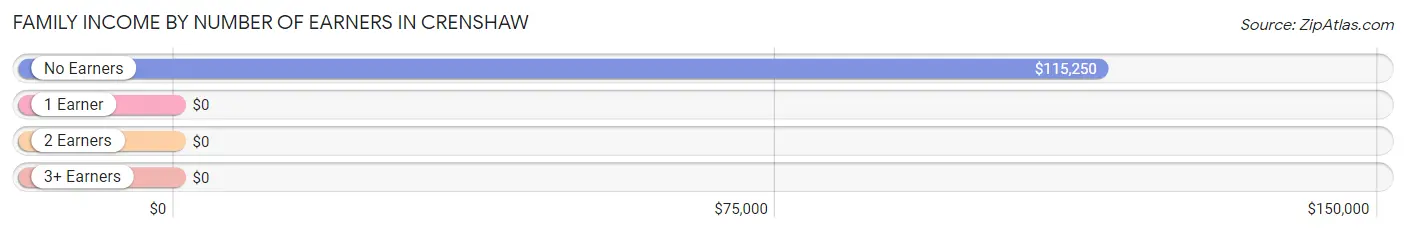
| Number of Earners | # Families | Median Income |
| No Earners | 39 (51.3%) | $115,250 |
| 1 Earner | 5 (6.6%) | $0 |
| 2 Earners | 32 (42.1%) | $0 |
| 3+ Earners | 0 (0.0%) | $0 |
| Total | 76 (100.0%) | $0 |
Household Income in Crenshaw
Household Income Brackets in Crenshaw
With 42 households falling in the category, the $100,000 to $149,999 income range is the most frequent in Crenshaw, accounting for 30.2% of all households.
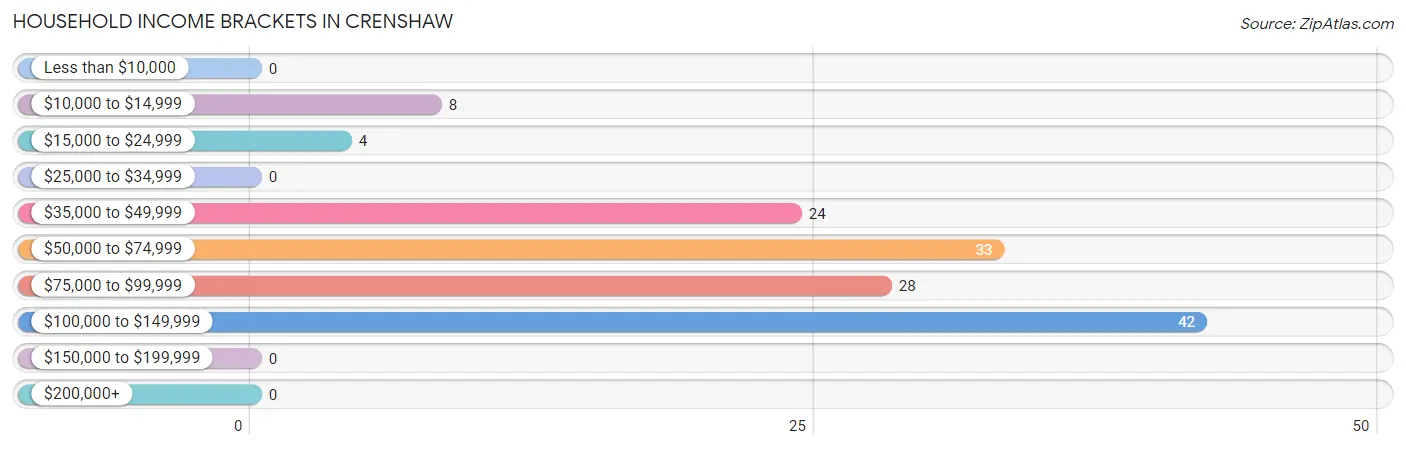
| Income Bracket | # Households | % Households |
| Less than $10,000 | 0 | 0.0% |
| $10,000 to $14,999 | 8 | 5.8% |
| $15,000 to $24,999 | 4 | 2.9% |
| $25,000 to $34,999 | 0 | 0.0% |
| $35,000 to $49,999 | 24 | 17.3% |
| $50,000 to $74,999 | 33 | 23.7% |
| $75,000 to $99,999 | 28 | 20.1% |
| $100,000 to $149,999 | 42 | 30.2% |
| $150,000 to $199,999 | 0 | 0.0% |
| $200,000+ | 0 | 0.0% |
Household Income by Householder Age in Crenshaw
The median household income in Crenshaw is $75,074, with the highest median household income of $85,208 found in the 25 to 44 years age bracket for the primary householder. A total of 33 households (23.7%) fall into this category.
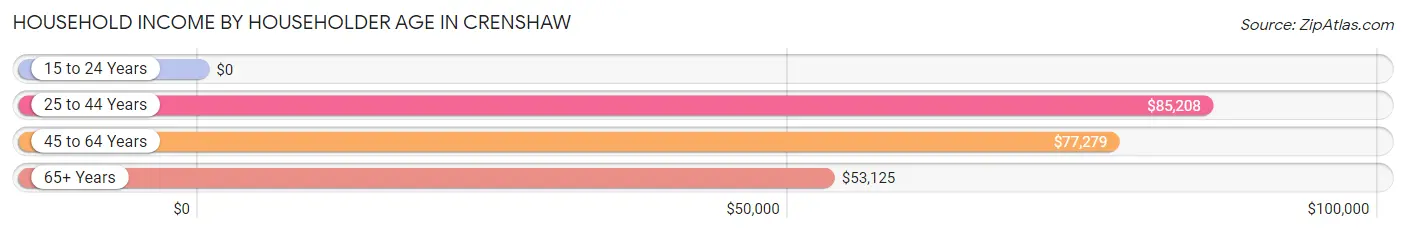
| Income Bracket | # Households | Median Income |
| 15 to 24 Years | 0 (0.0%) | $0 |
| 25 to 44 Years | 33 (23.7%) | $85,208 |
| 45 to 64 Years | 45 (32.4%) | $77,279 |
| 65+ Years | 61 (43.9%) | $53,125 |
| Total | 139 (100.0%) | $75,074 |
Poverty in Crenshaw
Income Below Poverty by Sex and Age in Crenshaw
With 9.7% poverty level for males and 9.2% for females among the residents of Crenshaw, 18 to 24 year old males and 75 year old and over females are the most vulnerable to poverty, with 15 males (100.0%) and 6 females (30.0%) in their respective age groups living below the poverty level.
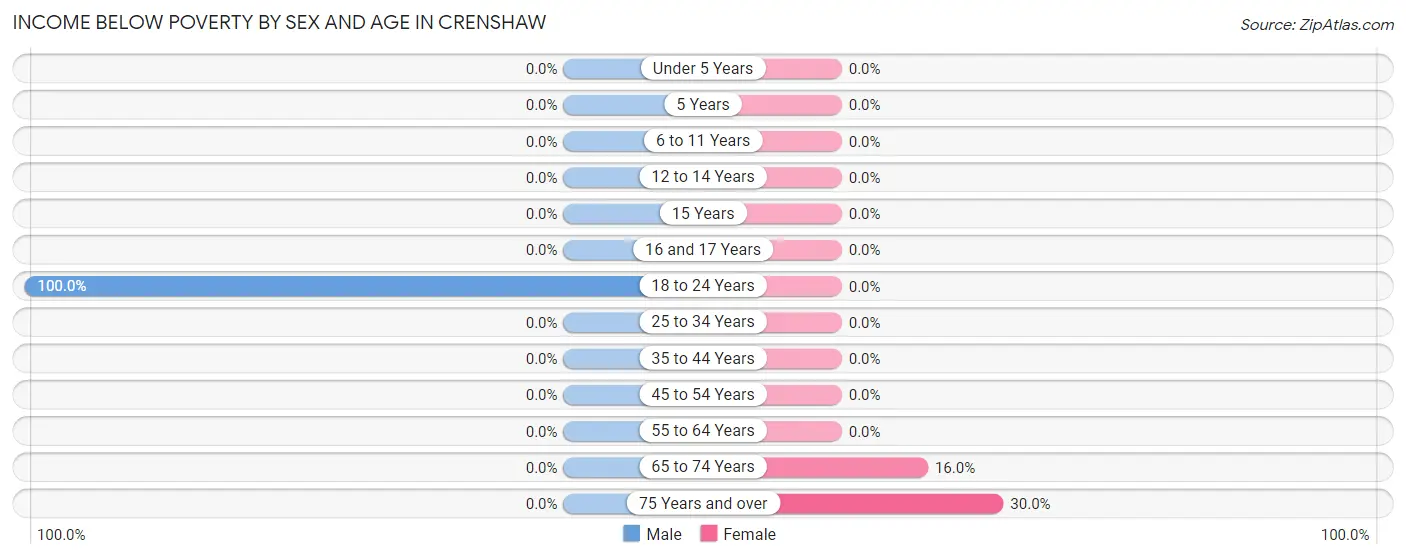
| Age Bracket | Male | Female |
| Under 5 Years | 0 (0.0%) | 0 (0.0%) |
| 5 Years | 0 (0.0%) | 0 (0.0%) |
| 6 to 11 Years | 0 (0.0%) | 0 (0.0%) |
| 12 to 14 Years | 0 (0.0%) | 0 (0.0%) |
| 15 Years | 0 (0.0%) | 0 (0.0%) |
| 16 and 17 Years | 0 (0.0%) | 0 (0.0%) |
| 18 to 24 Years | 15 (100.0%) | 0 (0.0%) |
| 25 to 34 Years | 0 (0.0%) | 0 (0.0%) |
| 35 to 44 Years | 0 (0.0%) | 0 (0.0%) |
| 45 to 54 Years | 0 (0.0%) | 0 (0.0%) |
| 55 to 64 Years | 0 (0.0%) | 0 (0.0%) |
| 65 to 74 Years | 0 (0.0%) | 8 (16.0%) |
| 75 Years and over | 0 (0.0%) | 6 (30.0%) |
| Total | 15 (9.7%) | 14 (9.2%) |
Income Above Poverty by Sex and Age in Crenshaw
According to the poverty statistics in Crenshaw, males aged 6 to 11 years and females aged 6 to 11 years are the age groups that are most secure financially, with 100.0% of males and 100.0% of females in these age groups living above the poverty line.
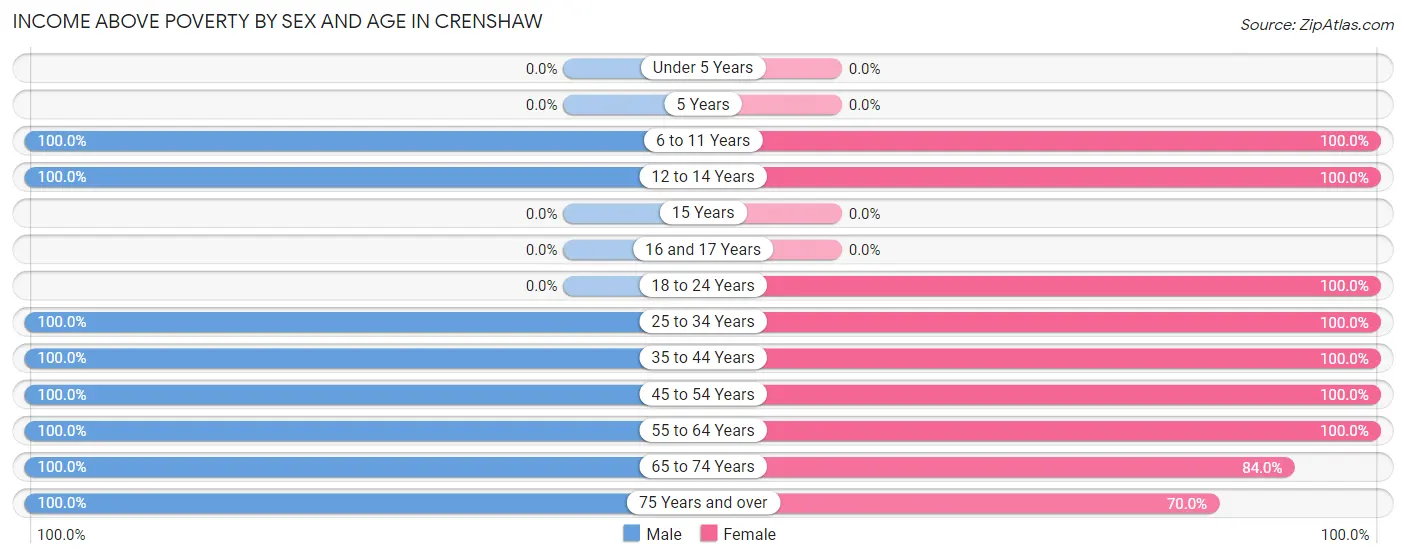
| Age Bracket | Male | Female |
| Under 5 Years | 0 (0.0%) | 0 (0.0%) |
| 5 Years | 0 (0.0%) | 0 (0.0%) |
| 6 to 11 Years | 4 (100.0%) | 4 (100.0%) |
| 12 to 14 Years | 7 (100.0%) | 10 (100.0%) |
| 15 Years | 0 (0.0%) | 0 (0.0%) |
| 16 and 17 Years | 0 (0.0%) | 0 (0.0%) |
| 18 to 24 Years | 0 (0.0%) | 5 (100.0%) |
| 25 to 34 Years | 26 (100.0%) | 28 (100.0%) |
| 35 to 44 Years | 19 (100.0%) | 5 (100.0%) |
| 45 to 54 Years | 29 (100.0%) | 13 (100.0%) |
| 55 to 64 Years | 11 (100.0%) | 17 (100.0%) |
| 65 to 74 Years | 37 (100.0%) | 42 (84.0%) |
| 75 Years and over | 6 (100.0%) | 14 (70.0%) |
| Total | 139 (90.3%) | 138 (90.8%) |
Income Below Poverty Among Married-Couple Families in Crenshaw
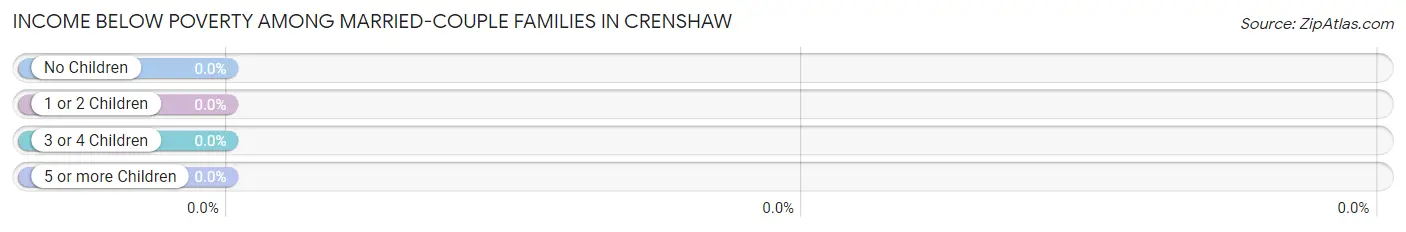
| Children | Above Poverty | Below Poverty |
| No Children | 32 (100.0%) | 0 (0.0%) |
| 1 or 2 Children | 4 (100.0%) | 0 (0.0%) |
| 3 or 4 Children | 0 (0.0%) | 0 (0.0%) |
| 5 or more Children | 0 (0.0%) | 0 (0.0%) |
| Total | 36 (100.0%) | 0 (0.0%) |
Income Below Poverty Among Single-Parent Households in Crenshaw
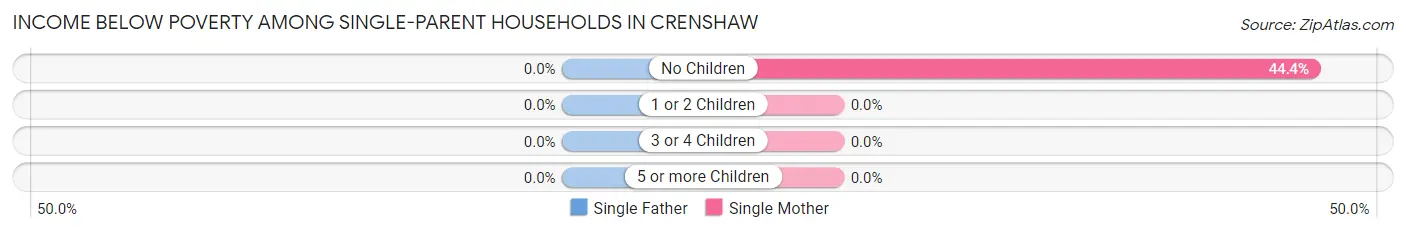
| Children | Single Father | Single Mother |
| No Children | 0 (0.0%) | 8 (44.4%) |
| 1 or 2 Children | 0 (0.0%) | 0 (0.0%) |
| 3 or 4 Children | 0 (0.0%) | 0 (0.0%) |
| 5 or more Children | 0 (0.0%) | 0 (0.0%) |
| Total | 0 (0.0%) | 8 (27.6%) |
Income Below Poverty Among Married-Couple vs Single-Parent Households in Crenshaw
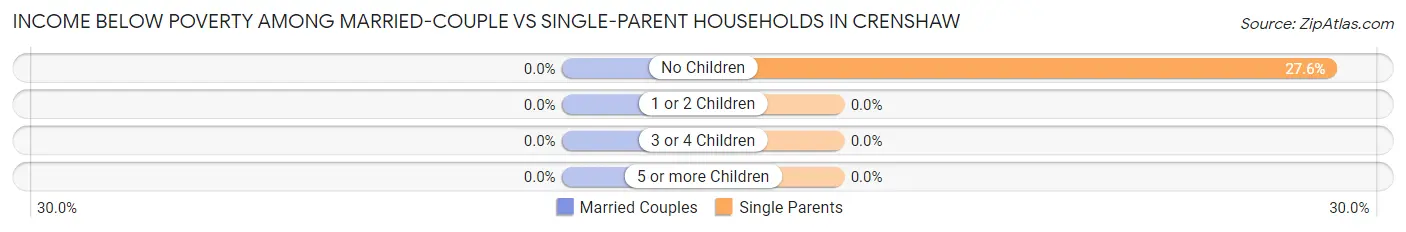
| Children | Married-Couple Families | Single-Parent Households |
| No Children | 0 (0.0%) | 8 (27.6%) |
| 1 or 2 Children | 0 (0.0%) | 0 (0.0%) |
| 3 or 4 Children | 0 (0.0%) | 0 (0.0%) |
| 5 or more Children | 0 (0.0%) | 0 (0.0%) |
| Total | 0 (0.0%) | 8 (20.0%) |
Race in Crenshaw
The most populous races in Crenshaw are , and White / Caucasian (306 | 100.0%).
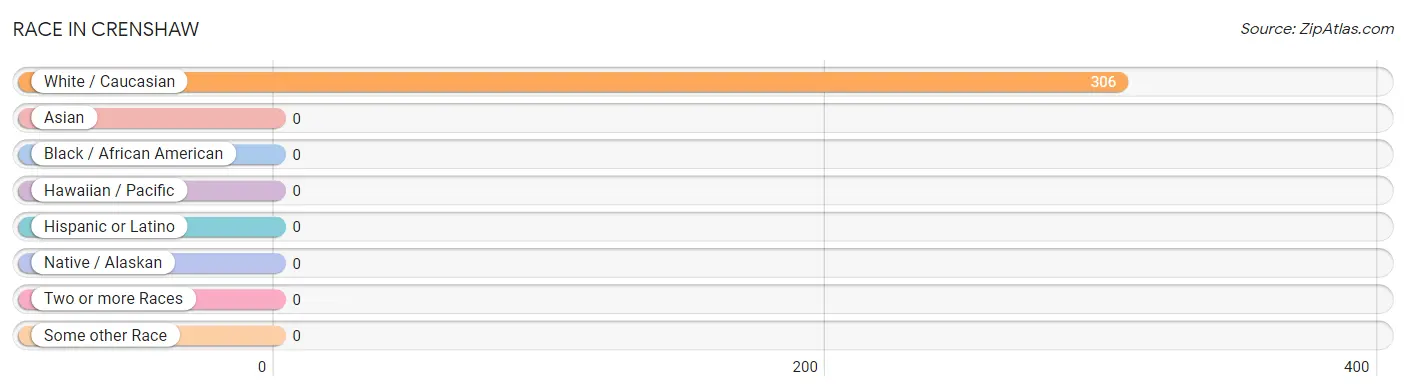
| Race | # Population | % Population |
| Asian | 0 | 0.0% |
| Black / African American | 0 | 0.0% |
| Hawaiian / Pacific | 0 | 0.0% |
| Hispanic or Latino | 0 | 0.0% |
| Native / Alaskan | 0 | 0.0% |
| White / Caucasian | 306 | 100.0% |
| Two or more Races | 0 | 0.0% |
| Some other Race | 0 | 0.0% |
| Total | 306 | 100.0% |
Ancestry in Crenshaw
The most populous ancestries reported in Crenshaw are German (118 | 38.6%), English (93 | 30.4%), Italian (74 | 24.2%), Czech (42 | 13.7%), and Irish (22 | 7.2%), together accounting for 114.1% of all Crenshaw residents.
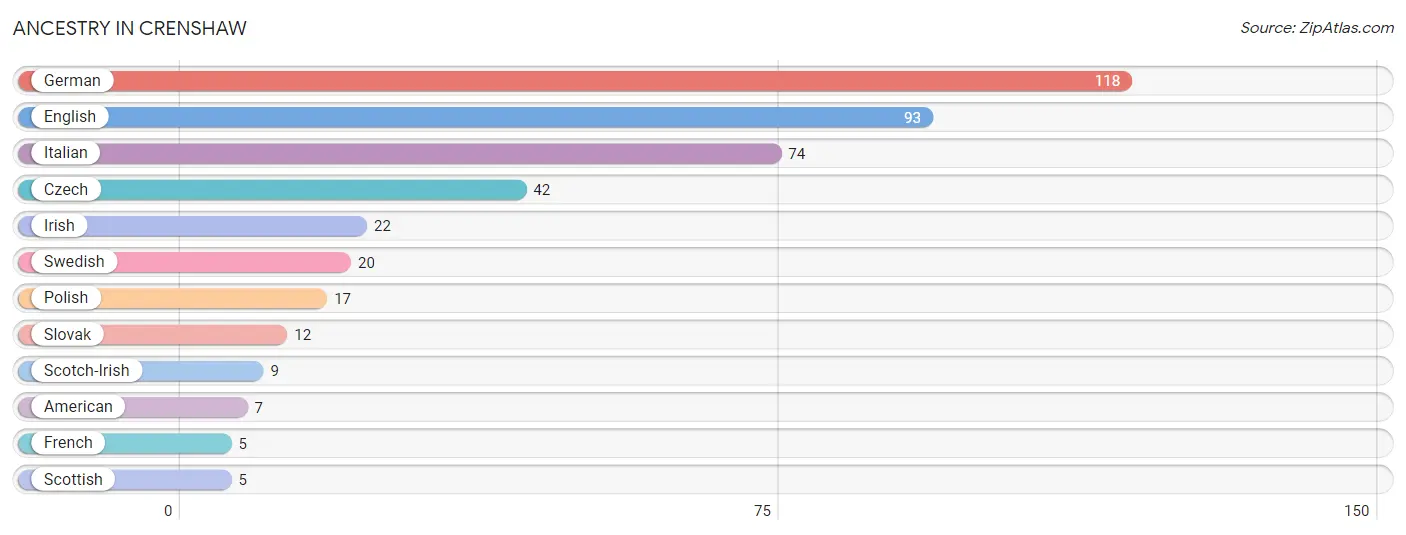
| Ancestry | # Population | % Population |
| American | 7 | 2.3% |
| Czech | 42 | 13.7% |
| English | 93 | 30.4% |
| French | 5 | 1.6% |
| German | 118 | 38.6% |
| Irish | 22 | 7.2% |
| Italian | 74 | 24.2% |
| Polish | 17 | 5.6% |
| Scotch-Irish | 9 | 2.9% |
| Scottish | 5 | 1.6% |
| Slovak | 12 | 3.9% |
| Swedish | 20 | 6.5% | View All 12 Rows |
Immigrants in Crenshaw

| Immigration Origin | # Population | % Population | View All 0 Rows |
Sex and Age in Crenshaw
Sex and Age in Crenshaw
The most populous age groups in Crenshaw are 50 to 54 Years (24 | 15.6%) for men and 70 to 74 Years (29 | 19.1%) for women.
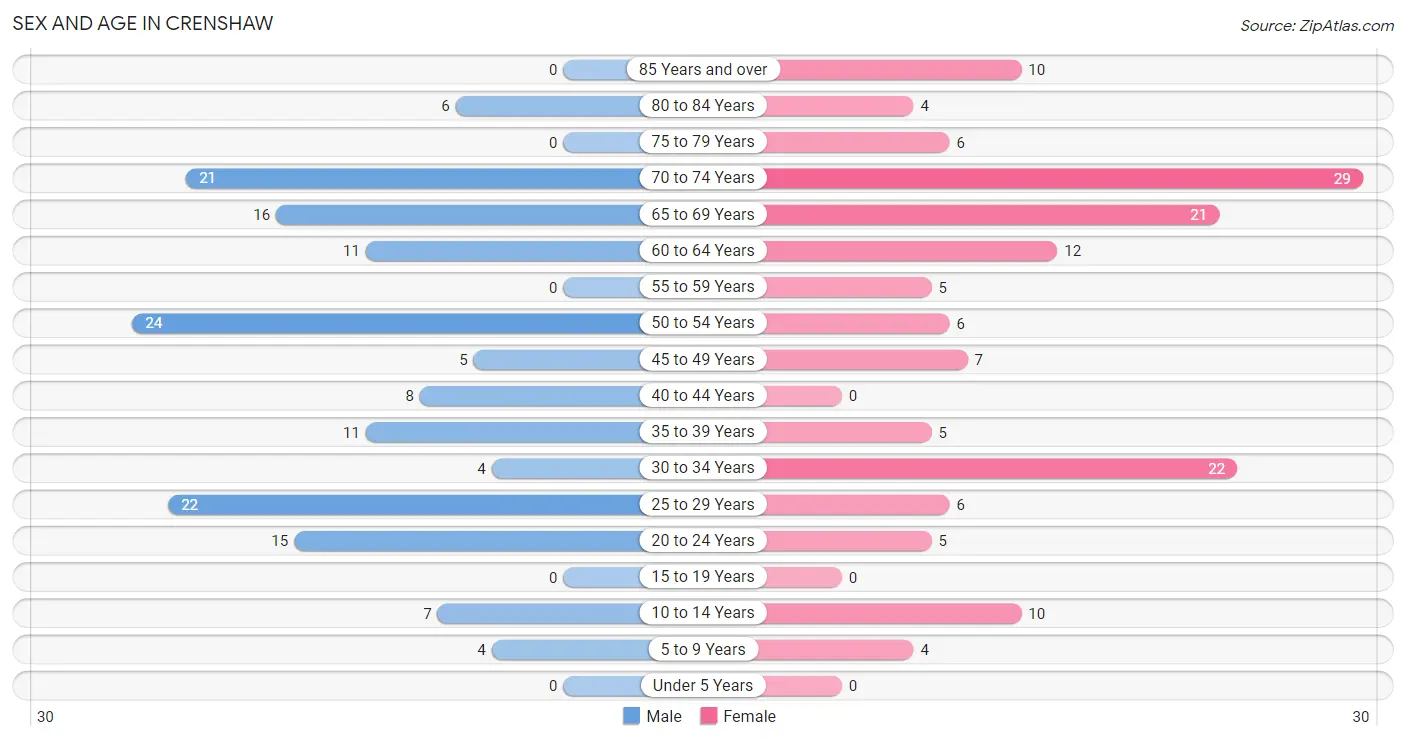
| Age Bracket | Male | Female |
| Under 5 Years | 0 (0.0%) | 0 (0.0%) |
| 5 to 9 Years | 4 (2.6%) | 4 (2.6%) |
| 10 to 14 Years | 7 (4.5%) | 10 (6.6%) |
| 15 to 19 Years | 0 (0.0%) | 0 (0.0%) |
| 20 to 24 Years | 15 (9.7%) | 5 (3.3%) |
| 25 to 29 Years | 22 (14.3%) | 6 (4.0%) |
| 30 to 34 Years | 4 (2.6%) | 22 (14.5%) |
| 35 to 39 Years | 11 (7.1%) | 5 (3.3%) |
| 40 to 44 Years | 8 (5.2%) | 0 (0.0%) |
| 45 to 49 Years | 5 (3.3%) | 7 (4.6%) |
| 50 to 54 Years | 24 (15.6%) | 6 (4.0%) |
| 55 to 59 Years | 0 (0.0%) | 5 (3.3%) |
| 60 to 64 Years | 11 (7.1%) | 12 (7.9%) |
| 65 to 69 Years | 16 (10.4%) | 21 (13.8%) |
| 70 to 74 Years | 21 (13.6%) | 29 (19.1%) |
| 75 to 79 Years | 0 (0.0%) | 6 (4.0%) |
| 80 to 84 Years | 6 (3.9%) | 4 (2.6%) |
| 85 Years and over | 0 (0.0%) | 10 (6.6%) |
| Total | 154 (100.0%) | 152 (100.0%) |
Families and Households in Crenshaw
Median Family Size in Crenshaw
The median family size in Crenshaw is 2.86 persons per family, with single female/mother families (29 | 38.2%) accounting for the largest median family size of 3.72 persons per family. On the other hand, married-couple families (36 | 47.4%) represent the smallest median family size with 2.25 persons per family.
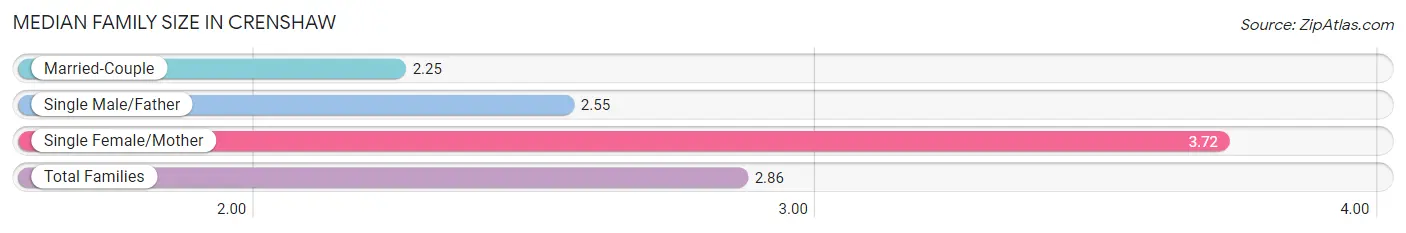
| Family Type | # Families | Family Size |
| Married-Couple | 36 (47.4%) | 2.25 |
| Single Male/Father | 11 (14.5%) | 2.55 |
| Single Female/Mother | 29 (38.2%) | 3.72 |
| Total Families | 76 (100.0%) | 2.86 |
Median Household Size in Crenshaw
The median household size in Crenshaw is 2.20 persons per household, with single female/mother households (29 | 20.9%) accounting for the largest median household size of 4.03 persons per household. non-family households (63 | 45.3%) represent the smallest median household size with 1.27 persons per household.
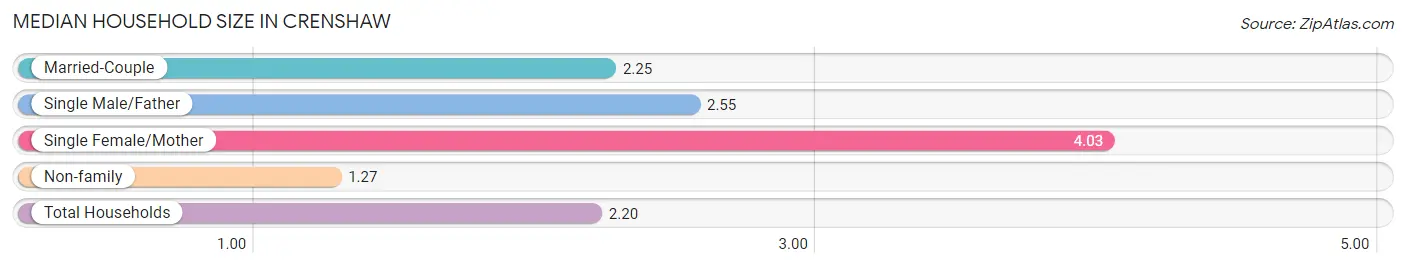
| Household Type | # Households | Household Size |
| Married-Couple | 36 (25.9%) | 2.25 |
| Single Male/Father | 11 (7.9%) | 2.55 |
| Single Female/Mother | 29 (20.9%) | 4.03 |
| Non-family | 63 (45.3%) | 1.27 |
| Total Households | 139 (100.0%) | 2.20 |
Household Size by Marriage Status in Crenshaw
Out of a total of 139 households in Crenshaw, 76 (54.7%) are family households, while 63 (45.3%) are nonfamily households. The most numerous type of family households are 2-person households, comprising 51, and the most common type of nonfamily households are 1-person households, comprising 44.
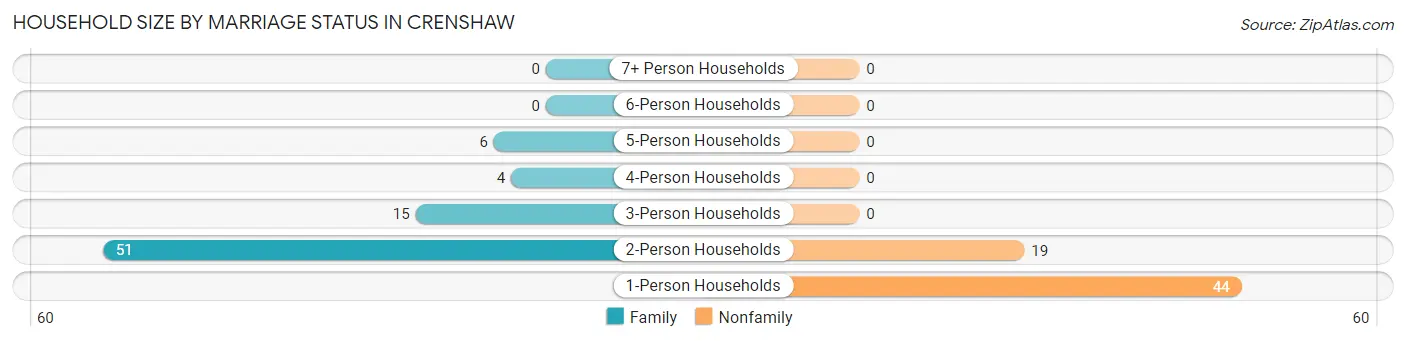
| Household Size | Family Households | Nonfamily Households |
| 1-Person Households | - | 44 (31.7%) |
| 2-Person Households | 51 (36.7%) | 19 (13.7%) |
| 3-Person Households | 15 (10.8%) | 0 (0.0%) |
| 4-Person Households | 4 (2.9%) | 0 (0.0%) |
| 5-Person Households | 6 (4.3%) | 0 (0.0%) |
| 6-Person Households | 0 (0.0%) | 0 (0.0%) |
| 7+ Person Households | 0 (0.0%) | 0 (0.0%) |
| Total | 76 (54.7%) | 63 (45.3%) |
Female Fertility in Crenshaw
Fertility by Age in Crenshaw
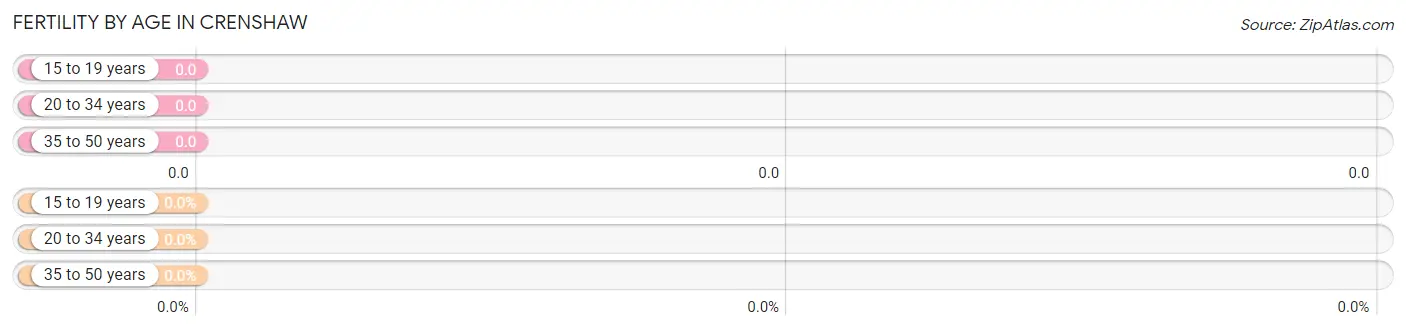
| Age Bracket | Women with Births | Births / 1,000 Women |
| 15 to 19 years | 0 (0.0%) | 0.0 |
| 20 to 34 years | 0 (0.0%) | 0.0 |
| 35 to 50 years | 0 (0.0%) | 0.0 |
| Total | 0 (0.0%) | 0.0 |
Fertility by Age by Marriage Status in Crenshaw
| Age Bracket | Married | Unmarried |
| 15 to 19 years | 0 (0.0%) | 0 (0.0%) |
| 20 to 34 years | 0 (0.0%) | 0 (0.0%) |
| 35 to 50 years | 0 (0.0%) | 0 (0.0%) |
| Total | 0 (0.0%) | 0 (0.0%) |
Fertility by Education in Crenshaw
| Educational Attainment | Women with Births | Births / 1,000 Women |
| Less than High School | 0 (0.0%) | 0.0 |
| High School Diploma | 0 (0.0%) | 0.0 |
| College or Associate's Degree | 0 (0.0%) | 0.0 |
| Bachelor's Degree | 0 (0.0%) | 0.0 |
| Graduate Degree | 0 (0.0%) | 0.0 |
| Total | 0 (0.0%) | 0.0 |
Fertility by Education by Marriage Status in Crenshaw
| Educational Attainment | Married | Unmarried |
| Less than High School | 0 (0.0%) | 0 (0.0%) |
| High School Diploma | 0 (0.0%) | 0 (0.0%) |
| College or Associate's Degree | 0 (0.0%) | 0 (0.0%) |
| Bachelor's Degree | 0 (0.0%) | 0 (0.0%) |
| Graduate Degree | 0 (0.0%) | 0 (0.0%) |
| Total | 0 (0.0%) | 0 (0.0%) |
Employment Characteristics in Crenshaw
Employment by Class of Employer in Crenshaw
Among the 119 employed individuals in Crenshaw, private company employees (97 | 81.5%), self-employed (not incorporated) (12 | 10.1%), and not-for-profit organizations (5 | 4.2%) make up the most common classes of employment.
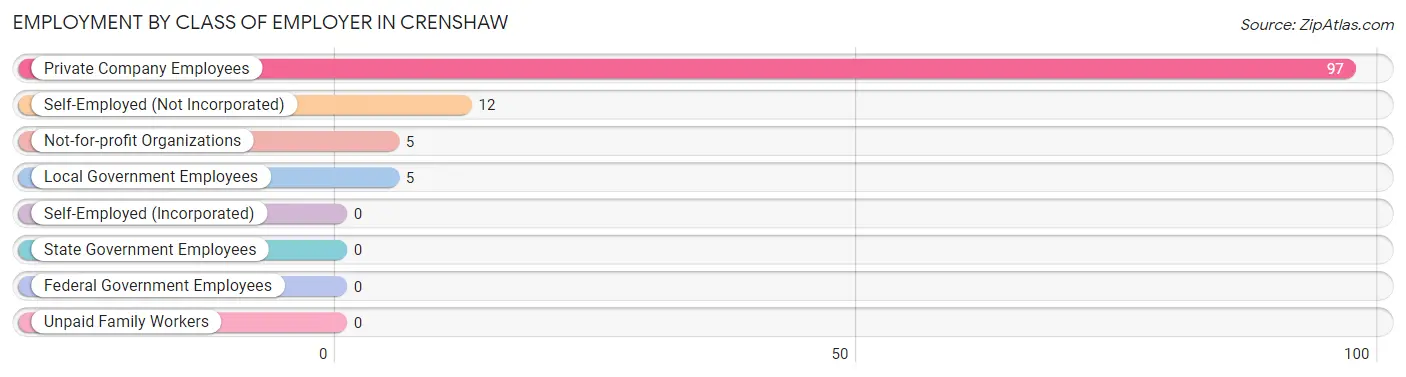
| Employer Class | # Employees | % Employees |
| Private Company Employees | 97 | 81.5% |
| Self-Employed (Incorporated) | 0 | 0.0% |
| Self-Employed (Not Incorporated) | 12 | 10.1% |
| Not-for-profit Organizations | 5 | 4.2% |
| Local Government Employees | 5 | 4.2% |
| State Government Employees | 0 | 0.0% |
| Federal Government Employees | 0 | 0.0% |
| Unpaid Family Workers | 0 | 0.0% |
| Total | 119 | 100.0% |
Employment Status by Age in Crenshaw
According to the labor force statistics for Crenshaw, out of the total population over 16 years of age (281), 50.5% or 142 individuals are in the labor force, with 12.0% or 17 of them unemployed. The age group with the highest labor force participation rate is 25 to 29 years, with 100.0% or 28 individuals in the labor force. Within the labor force, the 45 to 54 years age range has the highest percentage of unemployed individuals, with 40.5% or 17 of them being unemployed.
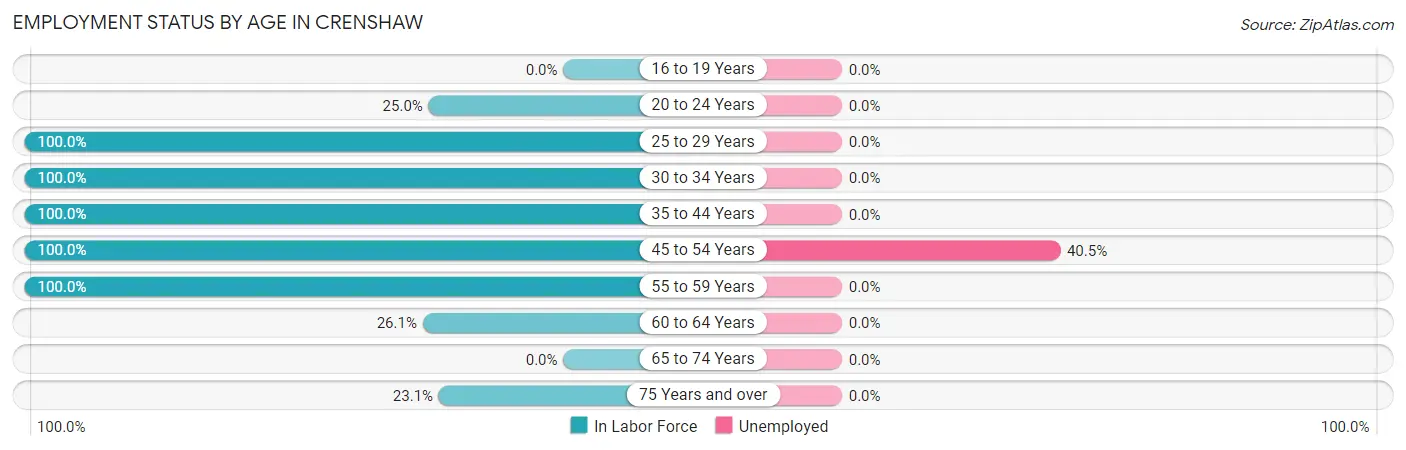
| Age Bracket | In Labor Force | Unemployed |
| 16 to 19 Years | 0 (0.0%) | 0 (0.0%) |
| 20 to 24 Years | 5 (25.0%) | 0 (0.0%) |
| 25 to 29 Years | 28 (100.0%) | 0 (0.0%) |
| 30 to 34 Years | 26 (100.0%) | 0 (0.0%) |
| 35 to 44 Years | 24 (100.0%) | 0 (0.0%) |
| 45 to 54 Years | 42 (100.0%) | 17 (40.5%) |
| 55 to 59 Years | 5 (100.0%) | 0 (0.0%) |
| 60 to 64 Years | 6 (26.1%) | 0 (0.0%) |
| 65 to 74 Years | 0 (0.0%) | 0 (0.0%) |
| 75 Years and over | 6 (23.1%) | 0 (0.0%) |
| Total | 142 (50.5%) | 17 (12.0%) |
Employment Status by Educational Attainment in Crenshaw
According to labor force statistics for Crenshaw, 88.5% of individuals (131) out of the total population between 25 and 64 years of age (148) are in the labor force, with 13.0% or 17 of them being unemployed. The group with the highest labor force participation rate are those with the educational attainment of bachelor's degree or higher, with 100.0% or 18 individuals in the labor force. Within the labor force, individuals with high school diploma education have the highest percentage of unemployment, with 21.3% or 17 of them being unemployed.
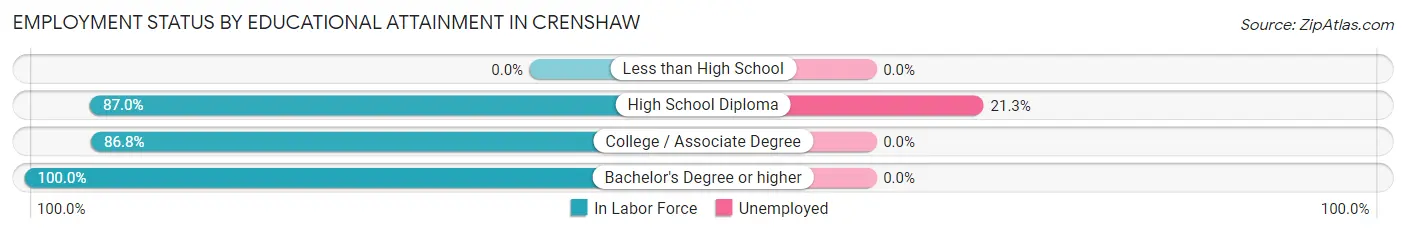
| Educational Attainment | In Labor Force | Unemployed |
| Less than High School | 0 (0.0%) | 0 (0.0%) |
| High School Diploma | 80 (87.0%) | 20 (21.3%) |
| College / Associate Degree | 33 (86.8%) | 0 (0.0%) |
| Bachelor's Degree or higher | 18 (100.0%) | 0 (0.0%) |
| Total | 131 (88.5%) | 19 (13.0%) |
Employment Occupations by Sex in Crenshaw
Management, Business, Science and Arts Occupations
The most common Management, Business, Science and Arts occupations in Crenshaw are Health Diagnosing & Treating (11 | 8.8%), Computers, Engineering & Science (9 | 7.2%), Architecture & Engineering (9 | 7.2%), and Health Technologists (5 | 4.0%).
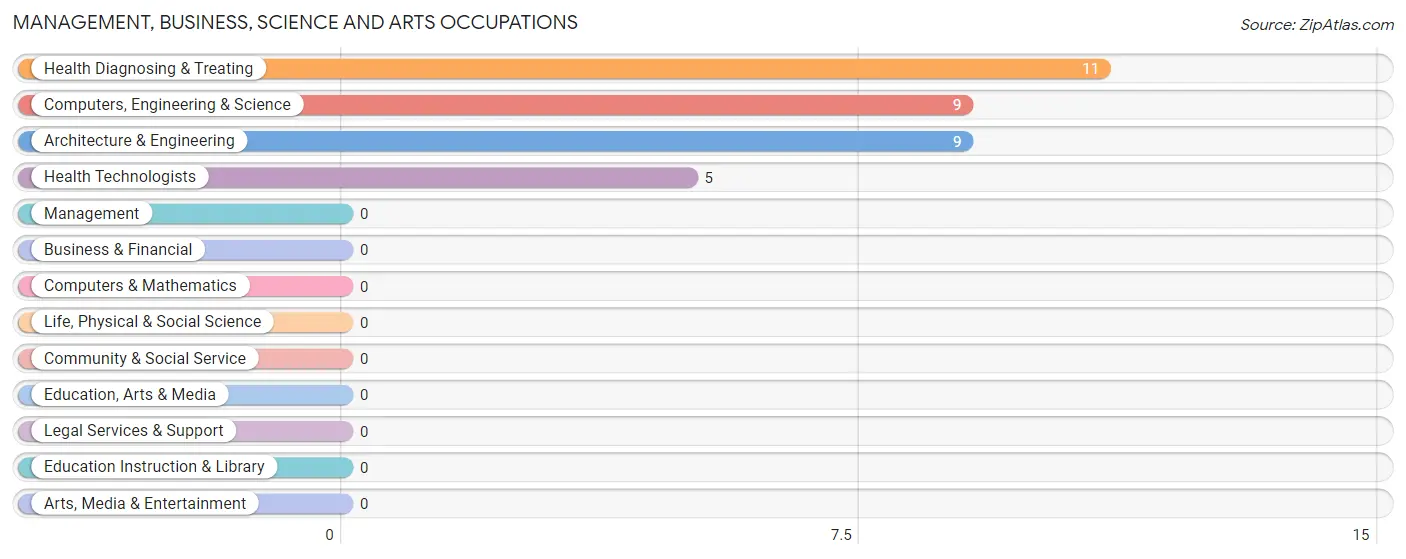
Management, Business, Science and Arts Occupations by Sex
Within the Management, Business, Science and Arts occupations in Crenshaw, the most male-oriented occupations are Computers, Engineering & Science (100.0%), and Architecture & Engineering (100.0%), while the most female-oriented occupations are Health Diagnosing & Treating (100.0%), and Health Technologists (100.0%).
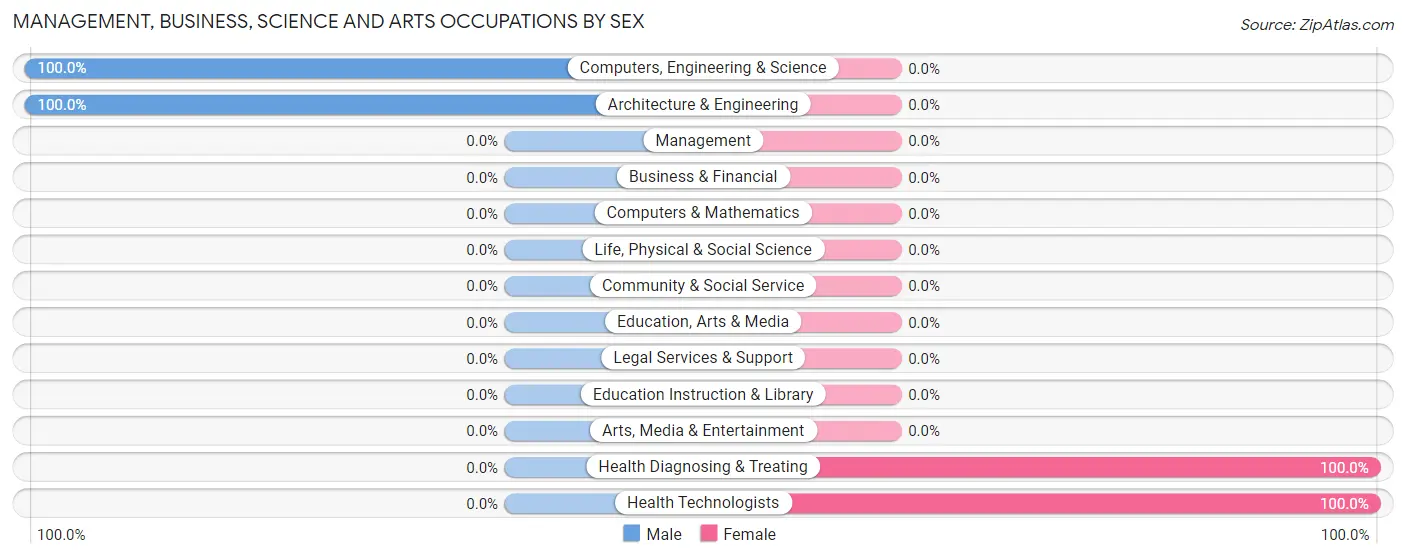
| Occupation | Male | Female |
| Management | 0 (0.0%) | 0 (0.0%) |
| Business & Financial | 0 (0.0%) | 0 (0.0%) |
| Computers, Engineering & Science | 9 (100.0%) | 0 (0.0%) |
| Computers & Mathematics | 0 (0.0%) | 0 (0.0%) |
| Architecture & Engineering | 9 (100.0%) | 0 (0.0%) |
| Life, Physical & Social Science | 0 (0.0%) | 0 (0.0%) |
| Community & Social Service | 0 (0.0%) | 0 (0.0%) |
| Education, Arts & Media | 0 (0.0%) | 0 (0.0%) |
| Legal Services & Support | 0 (0.0%) | 0 (0.0%) |
| Education Instruction & Library | 0 (0.0%) | 0 (0.0%) |
| Arts, Media & Entertainment | 0 (0.0%) | 0 (0.0%) |
| Health Diagnosing & Treating | 0 (0.0%) | 11 (100.0%) |
| Health Technologists | 0 (0.0%) | 5 (100.0%) |
| Total (Category) | 9 (45.0%) | 11 (55.0%) |
| Total (Overall) | 69 (55.2%) | 56 (44.8%) |
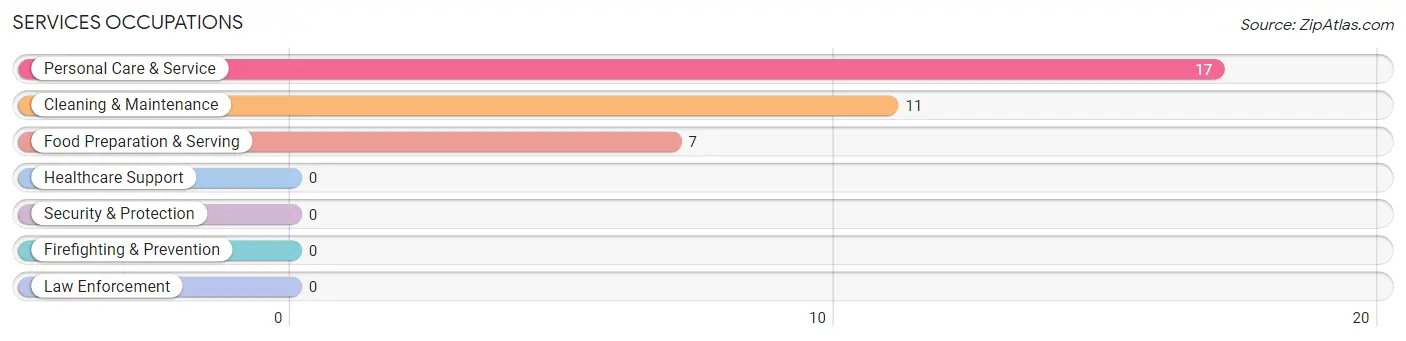
Services Occupations
The most common Services occupations in Crenshaw are Personal Care & Service (17 | 13.6%), Cleaning & Maintenance (11 | 8.8%), and Food Preparation & Serving (7 | 5.6%).
Services Occupations by Sex
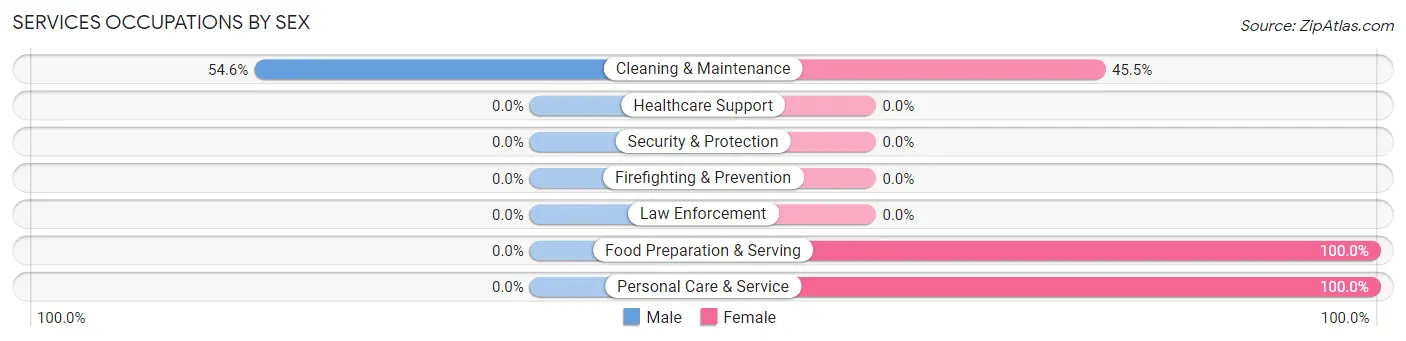
| Occupation | Male | Female |
| Healthcare Support | 0 (0.0%) | 0 (0.0%) |
| Security & Protection | 0 (0.0%) | 0 (0.0%) |
| Firefighting & Prevention | 0 (0.0%) | 0 (0.0%) |
| Law Enforcement | 0 (0.0%) | 0 (0.0%) |
| Food Preparation & Serving | 0 (0.0%) | 7 (100.0%) |
| Cleaning & Maintenance | 6 (54.5%) | 5 (45.5%) |
| Personal Care & Service | 0 (0.0%) | 17 (100.0%) |
| Total (Category) | 6 (17.1%) | 29 (82.9%) |
| Total (Overall) | 69 (55.2%) | 56 (44.8%) |
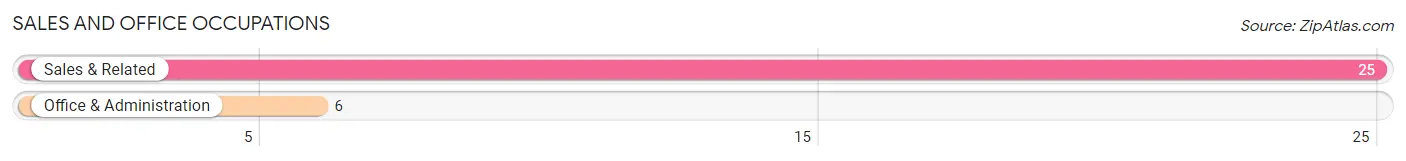
Sales and Office Occupations
The most common Sales and Office occupations in Crenshaw are Sales & Related (25 | 20.0%), and Office & Administration (6 | 4.8%).
Sales and Office Occupations by Sex
| Occupation | Male | Female |
| Sales & Related | 14 (56.0%) | 11 (44.0%) |
| Office & Administration | 6 (100.0%) | 0 (0.0%) |
| Total (Category) | 20 (64.5%) | 11 (35.5%) |
| Total (Overall) | 69 (55.2%) | 56 (44.8%) |
Natural Resources, Construction and Maintenance Occupations
The most common Natural Resources, Construction and Maintenance occupations in Crenshaw are Construction & Extraction (5 | 4.0%), and Installation, Maintenance & Repair (4 | 3.2%).
Natural Resources, Construction and Maintenance Occupations by Sex
| Occupation | Male | Female |
| Farming, Fishing & Forestry | 0 (0.0%) | 0 (0.0%) |
| Construction & Extraction | 5 (100.0%) | 0 (0.0%) |
| Installation, Maintenance & Repair | 4 (100.0%) | 0 (0.0%) |
| Total (Category) | 9 (100.0%) | 0 (0.0%) |
| Total (Overall) | 69 (55.2%) | 56 (44.8%) |
Production, Transportation and Moving Occupations
The most common Production, Transportation and Moving occupations in Crenshaw are , and Production (30 | 24.0%).
Production, Transportation and Moving Occupations by Sex
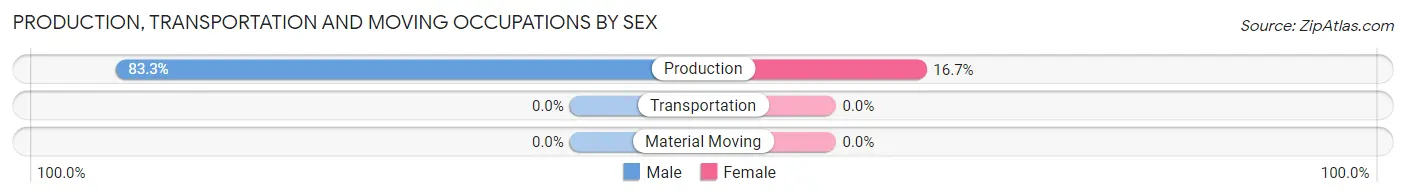
| Occupation | Male | Female |
| Production | 25 (83.3%) | 5 (16.7%) |
| Transportation | 0 (0.0%) | 0 (0.0%) |
| Material Moving | 0 (0.0%) | 0 (0.0%) |
| Total (Category) | 25 (83.3%) | 5 (16.7%) |
| Total (Overall) | 69 (55.2%) | 56 (44.8%) |
Employment Industries by Sex in Crenshaw
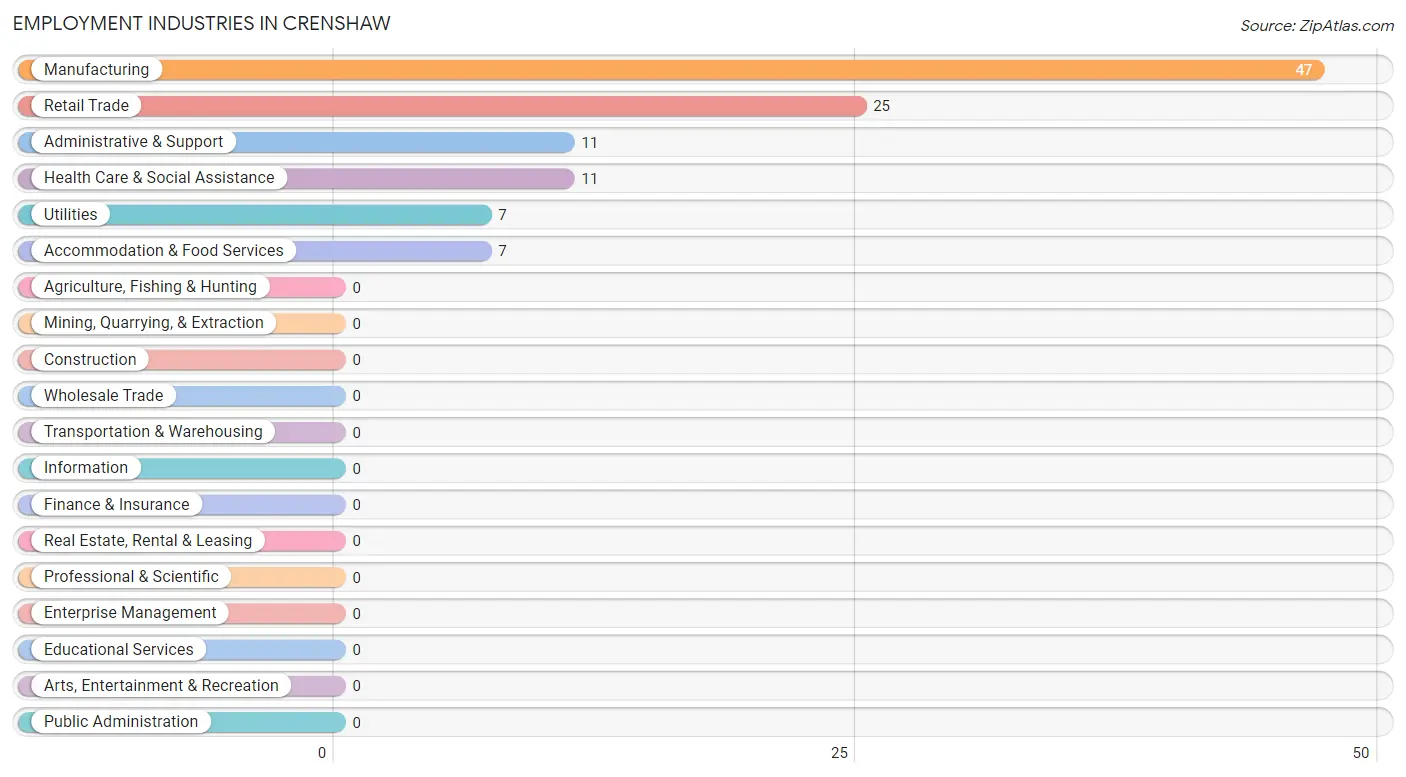
Employment Industries in Crenshaw
The major employment industries in Crenshaw include Manufacturing (47 | 37.6%), Retail Trade (25 | 20.0%), Administrative & Support (11 | 8.8%), Health Care & Social Assistance (11 | 8.8%), and Utilities (7 | 5.6%).
Employment Industries by Sex in Crenshaw
The Crenshaw industries that see more men than women are Utilities (100.0%), Manufacturing (89.4%), and Retail Trade (56.0%), whereas the industries that tend to have a higher number of women are Health Care & Social Assistance (100.0%), Accommodation & Food Services (100.0%), and Administrative & Support (45.5%).
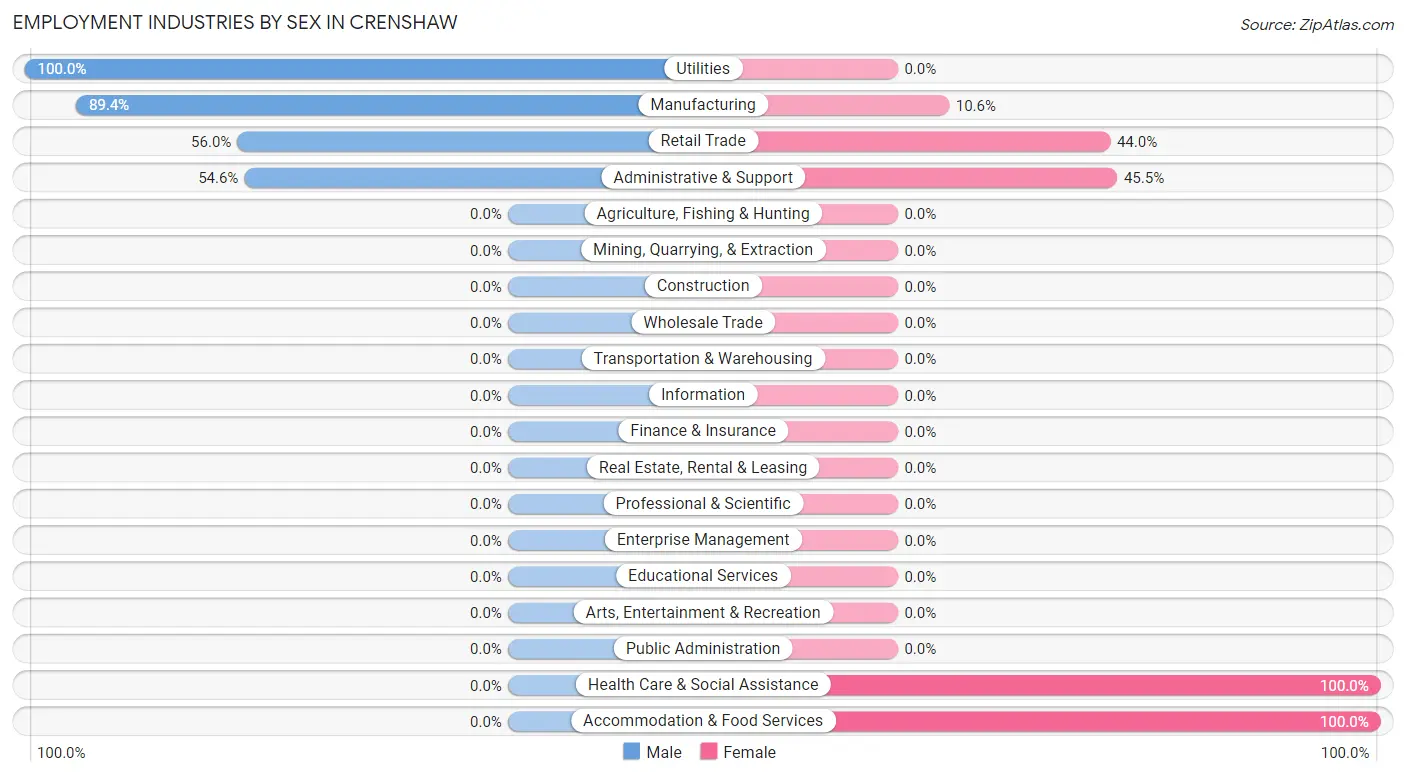
| Industry | Male | Female |
| Agriculture, Fishing & Hunting | 0 (0.0%) | 0 (0.0%) |
| Mining, Quarrying, & Extraction | 0 (0.0%) | 0 (0.0%) |
| Construction | 0 (0.0%) | 0 (0.0%) |
| Manufacturing | 42 (89.4%) | 5 (10.6%) |
| Wholesale Trade | 0 (0.0%) | 0 (0.0%) |
| Retail Trade | 14 (56.0%) | 11 (44.0%) |
| Transportation & Warehousing | 0 (0.0%) | 0 (0.0%) |
| Utilities | 7 (100.0%) | 0 (0.0%) |
| Information | 0 (0.0%) | 0 (0.0%) |
| Finance & Insurance | 0 (0.0%) | 0 (0.0%) |
| Real Estate, Rental & Leasing | 0 (0.0%) | 0 (0.0%) |
| Professional & Scientific | 0 (0.0%) | 0 (0.0%) |
| Enterprise Management | 0 (0.0%) | 0 (0.0%) |
| Administrative & Support | 6 (54.5%) | 5 (45.5%) |
| Educational Services | 0 (0.0%) | 0 (0.0%) |
| Health Care & Social Assistance | 0 (0.0%) | 11 (100.0%) |
| Arts, Entertainment & Recreation | 0 (0.0%) | 0 (0.0%) |
| Accommodation & Food Services | 0 (0.0%) | 7 (100.0%) |
| Public Administration | 0 (0.0%) | 0 (0.0%) |
| Total | 69 (55.2%) | 56 (44.8%) |
Education in Crenshaw
School Enrollment in Crenshaw
The most common levels of schooling among the 25 students in Crenshaw are middle school (17 | 68.0%), and elementary school (8 | 32.0%).
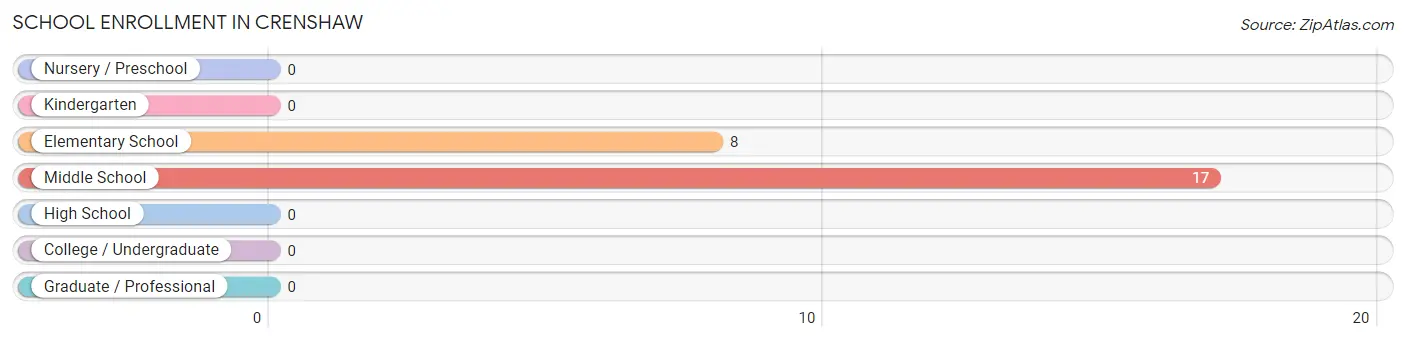
| School Level | # Students | % Students |
| Nursery / Preschool | 0 | 0.0% |
| Kindergarten | 0 | 0.0% |
| Elementary School | 8 | 32.0% |
| Middle School | 17 | 68.0% |
| High School | 0 | 0.0% |
| College / Undergraduate | 0 | 0.0% |
| Graduate / Professional | 0 | 0.0% |
| Total | 25 | 100.0% |
School Enrollment by Age by Funding Source in Crenshaw
Out of a total of 25 students who are enrolled in schools in Crenshaw, 7 (28.0%) attend a private institution, while the remaining 18 (72.0%) are enrolled in public schools. The age group of 10 to 14 year olds has the highest likelihood of being enrolled in private schools, with 7 (41.2% in the age bracket) enrolled. Conversely, the age group of 5 to 9 year old has the lowest likelihood of being enrolled in a private school, with 8 (100.0% in the age bracket) attending a public institution.
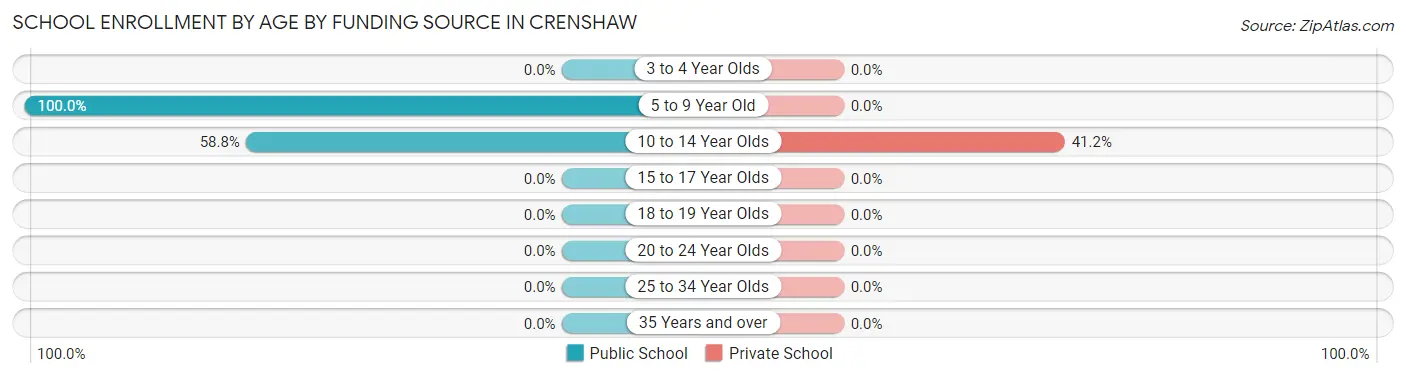
| Age Bracket | Public School | Private School |
| 3 to 4 Year Olds | 0 (0.0%) | 0 (0.0%) |
| 5 to 9 Year Old | 8 (100.0%) | 0 (0.0%) |
| 10 to 14 Year Olds | 10 (58.8%) | 7 (41.2%) |
| 15 to 17 Year Olds | 0 (0.0%) | 0 (0.0%) |
| 18 to 19 Year Olds | 0 (0.0%) | 0 (0.0%) |
| 20 to 24 Year Olds | 0 (0.0%) | 0 (0.0%) |
| 25 to 34 Year Olds | 0 (0.0%) | 0 (0.0%) |
| 35 Years and over | 0 (0.0%) | 0 (0.0%) |
| Total | 18 (72.0%) | 7 (28.0%) |
Educational Attainment by Field of Study in Crenshaw
Education (21 | 43.8%), business (11 | 22.9%), psychology (7 | 14.6%), science & technology (5 | 10.4%), and bio, nature & agricultural (4 | 8.3%) are the most common fields of study among 48 individuals in Crenshaw who have obtained a bachelor's degree or higher.
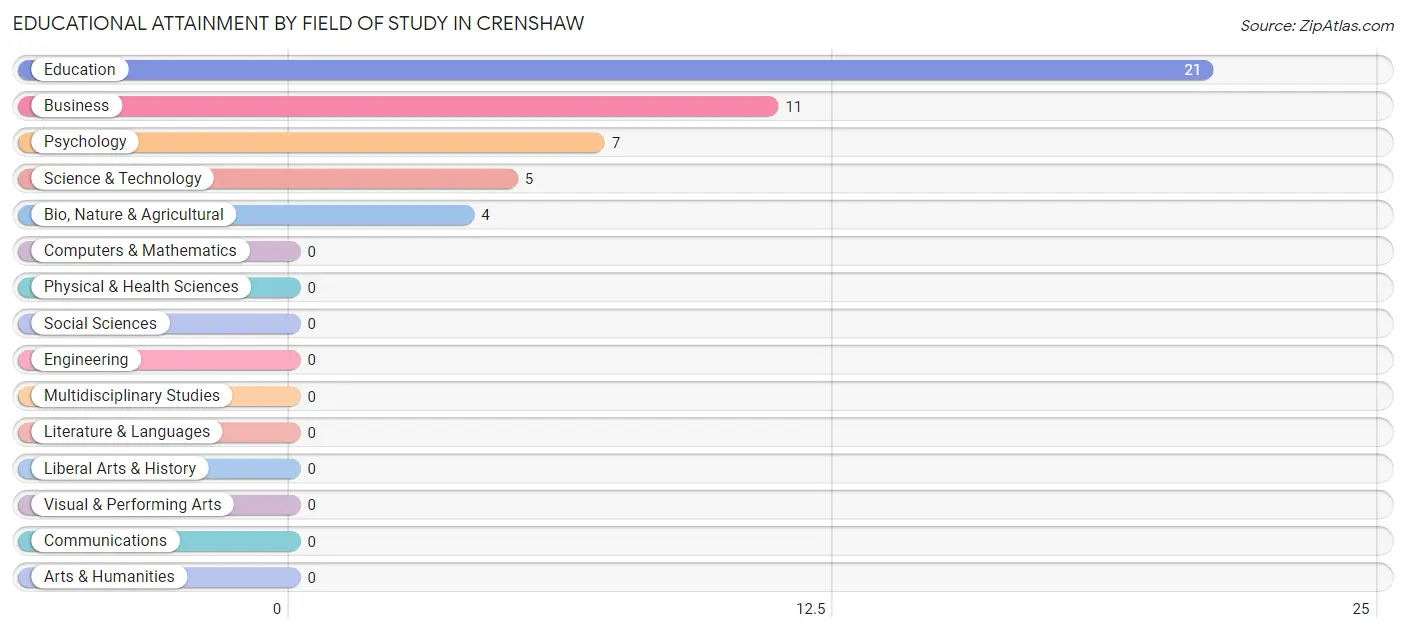
| Field of Study | # Graduates | % Graduates |
| Computers & Mathematics | 0 | 0.0% |
| Bio, Nature & Agricultural | 4 | 8.3% |
| Physical & Health Sciences | 0 | 0.0% |
| Psychology | 7 | 14.6% |
| Social Sciences | 0 | 0.0% |
| Engineering | 0 | 0.0% |
| Multidisciplinary Studies | 0 | 0.0% |
| Science & Technology | 5 | 10.4% |
| Business | 11 | 22.9% |
| Education | 21 | 43.8% |
| Literature & Languages | 0 | 0.0% |
| Liberal Arts & History | 0 | 0.0% |
| Visual & Performing Arts | 0 | 0.0% |
| Communications | 0 | 0.0% |
| Arts & Humanities | 0 | 0.0% |
| Total | 48 | 100.0% |
Transportation & Commute in Crenshaw
Vehicle Availability by Sex in Crenshaw
The most prevalent vehicle ownership categories in Crenshaw are males with 2 vehicles (46, accounting for 73.0%) and females with 2 vehicles (44, making up 82.1%).
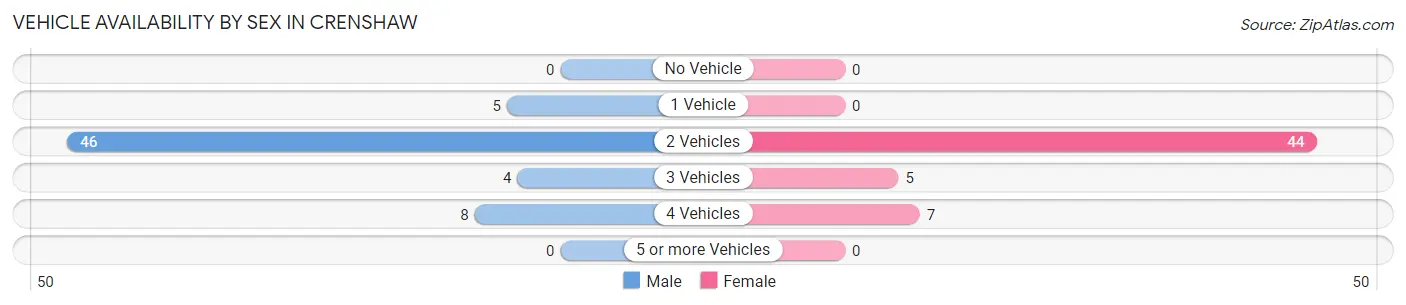
| Vehicles Available | Male | Female |
| No Vehicle | 0 (0.0%) | 0 (0.0%) |
| 1 Vehicle | 5 (7.9%) | 0 (0.0%) |
| 2 Vehicles | 46 (73.0%) | 44 (78.6%) |
| 3 Vehicles | 4 (6.4%) | 5 (8.9%) |
| 4 Vehicles | 8 (12.7%) | 7 (12.5%) |
| 5 or more Vehicles | 0 (0.0%) | 0 (0.0%) |
| Total | 63 (100.0%) | 56 (100.0%) |
Commute Time in Crenshaw
The most frequently occuring commute durations in Crenshaw are 20 to 24 minutes (41 commuters, 34.4%), 45 to 59 minutes (20 commuters, 16.8%), and less than 5 minutes (16 commuters, 13.5%).
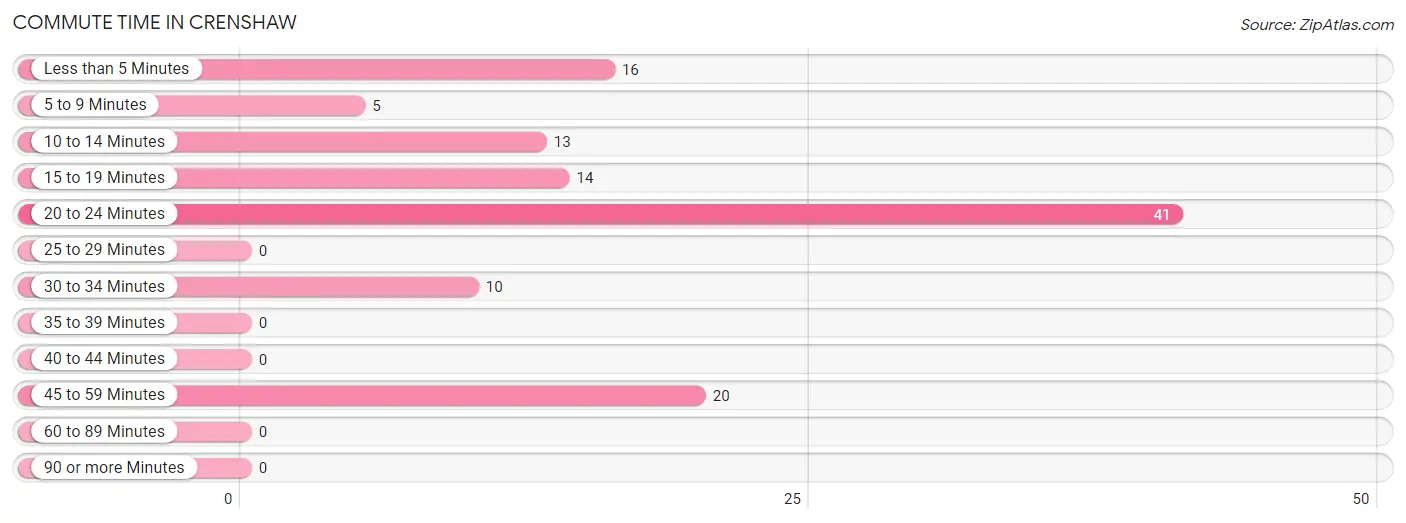
| Commute Time | # Commuters | % Commuters |
| Less than 5 Minutes | 16 | 13.5% |
| 5 to 9 Minutes | 5 | 4.2% |
| 10 to 14 Minutes | 13 | 10.9% |
| 15 to 19 Minutes | 14 | 11.8% |
| 20 to 24 Minutes | 41 | 34.4% |
| 25 to 29 Minutes | 0 | 0.0% |
| 30 to 34 Minutes | 10 | 8.4% |
| 35 to 39 Minutes | 0 | 0.0% |
| 40 to 44 Minutes | 0 | 0.0% |
| 45 to 59 Minutes | 20 | 16.8% |
| 60 to 89 Minutes | 0 | 0.0% |
| 90 or more Minutes | 0 | 0.0% |
Commute Time by Sex in Crenshaw
The most common commute times in Crenshaw are 45 to 59 minutes (20 commuters, 31.8%) for males and 20 to 24 minutes (22 commuters, 39.3%) for females.
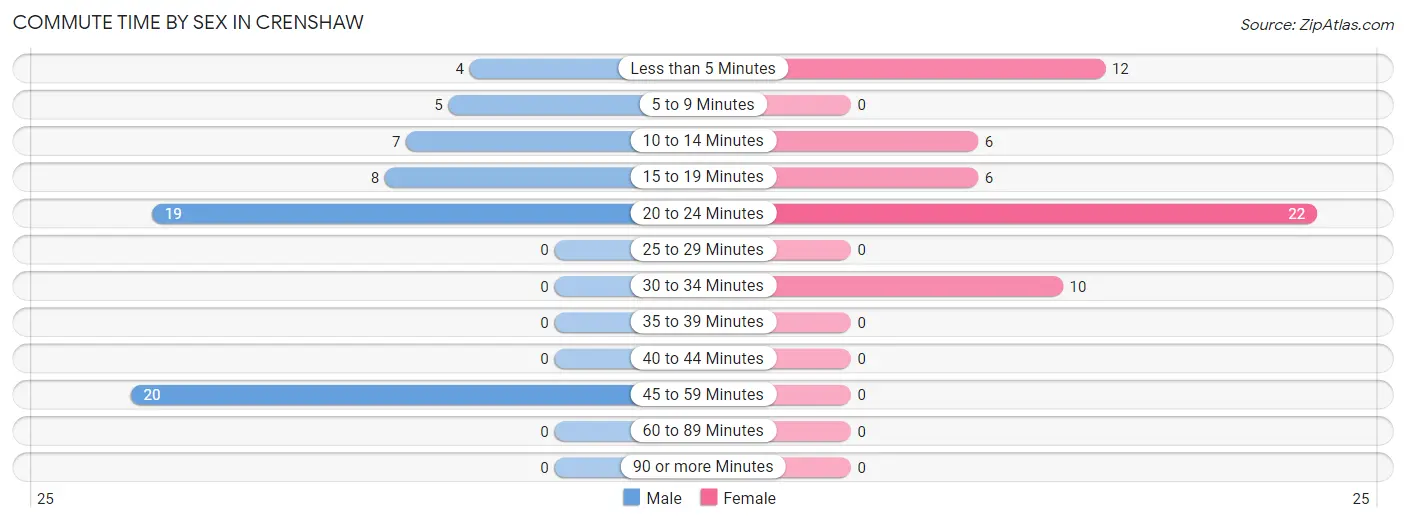
| Commute Time | Male | Female |
| Less than 5 Minutes | 4 (6.4%) | 12 (21.4%) |
| 5 to 9 Minutes | 5 (7.9%) | 0 (0.0%) |
| 10 to 14 Minutes | 7 (11.1%) | 6 (10.7%) |
| 15 to 19 Minutes | 8 (12.7%) | 6 (10.7%) |
| 20 to 24 Minutes | 19 (30.2%) | 22 (39.3%) |
| 25 to 29 Minutes | 0 (0.0%) | 0 (0.0%) |
| 30 to 34 Minutes | 0 (0.0%) | 10 (17.9%) |
| 35 to 39 Minutes | 0 (0.0%) | 0 (0.0%) |
| 40 to 44 Minutes | 0 (0.0%) | 0 (0.0%) |
| 45 to 59 Minutes | 20 (31.8%) | 0 (0.0%) |
| 60 to 89 Minutes | 0 (0.0%) | 0 (0.0%) |
| 90 or more Minutes | 0 (0.0%) | 0 (0.0%) |
Time of Departure to Work by Sex in Crenshaw
The most frequent times of departure to work in Crenshaw are 12:00 PM to 3:59 PM (16, 25.4%) for males and 9:00 AM to 9:59 AM (17, 30.4%) for females.
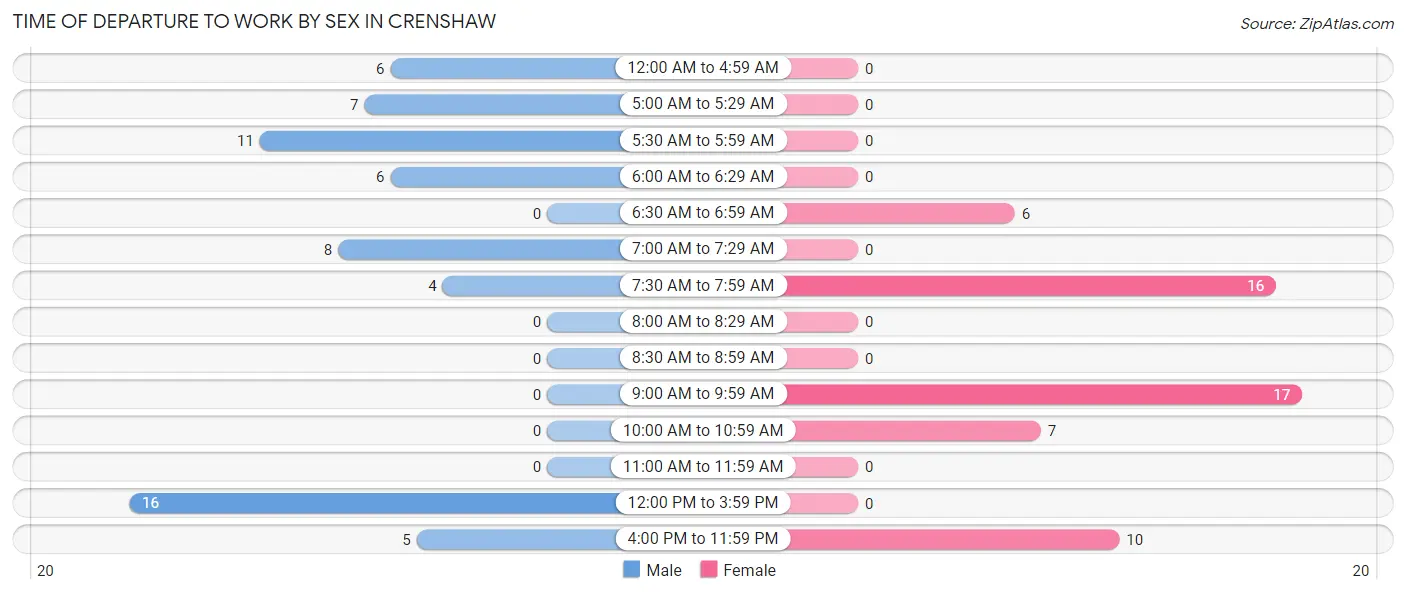
| Time of Departure | Male | Female |
| 12:00 AM to 4:59 AM | 6 (9.5%) | 0 (0.0%) |
| 5:00 AM to 5:29 AM | 7 (11.1%) | 0 (0.0%) |
| 5:30 AM to 5:59 AM | 11 (17.5%) | 0 (0.0%) |
| 6:00 AM to 6:29 AM | 6 (9.5%) | 0 (0.0%) |
| 6:30 AM to 6:59 AM | 0 (0.0%) | 6 (10.7%) |
| 7:00 AM to 7:29 AM | 8 (12.7%) | 0 (0.0%) |
| 7:30 AM to 7:59 AM | 4 (6.4%) | 16 (28.6%) |
| 8:00 AM to 8:29 AM | 0 (0.0%) | 0 (0.0%) |
| 8:30 AM to 8:59 AM | 0 (0.0%) | 0 (0.0%) |
| 9:00 AM to 9:59 AM | 0 (0.0%) | 17 (30.4%) |
| 10:00 AM to 10:59 AM | 0 (0.0%) | 7 (12.5%) |
| 11:00 AM to 11:59 AM | 0 (0.0%) | 0 (0.0%) |
| 12:00 PM to 3:59 PM | 16 (25.4%) | 0 (0.0%) |
| 4:00 PM to 11:59 PM | 5 (7.9%) | 10 (17.9%) |
| Total | 63 (100.0%) | 56 (100.0%) |
Housing Occupancy in Crenshaw
Occupancy by Ownership in Crenshaw
Of the total 139 dwellings in Crenshaw, owner-occupied units account for 98 (70.5%), while renter-occupied units make up 41 (29.5%).
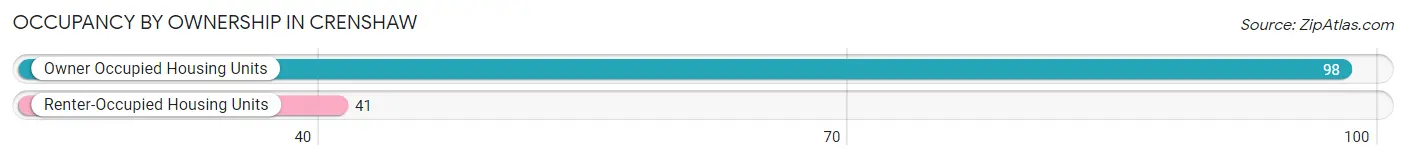
| Occupancy | # Housing Units | % Housing Units |
| Owner Occupied Housing Units | 98 | 70.5% |
| Renter-Occupied Housing Units | 41 | 29.5% |
| Total Occupied Housing Units | 139 | 100.0% |
Occupancy by Household Size in Crenshaw
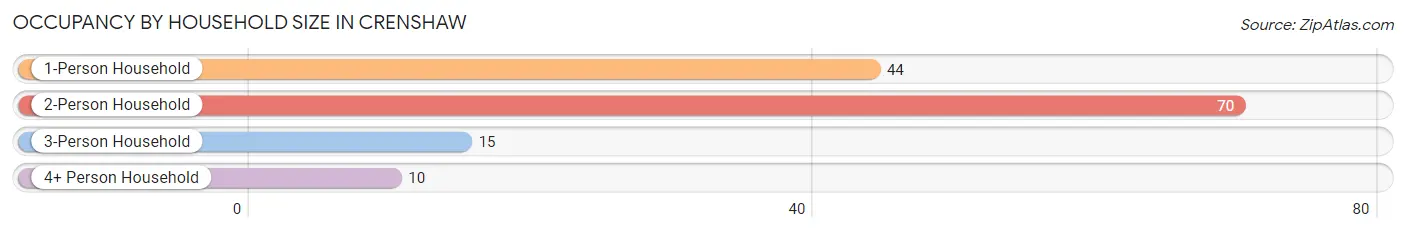
| Household Size | # Housing Units | % Housing Units |
| 1-Person Household | 44 | 31.7% |
| 2-Person Household | 70 | 50.4% |
| 3-Person Household | 15 | 10.8% |
| 4+ Person Household | 10 | 7.2% |
| Total Housing Units | 139 | 100.0% |
Occupancy by Ownership by Household Size in Crenshaw
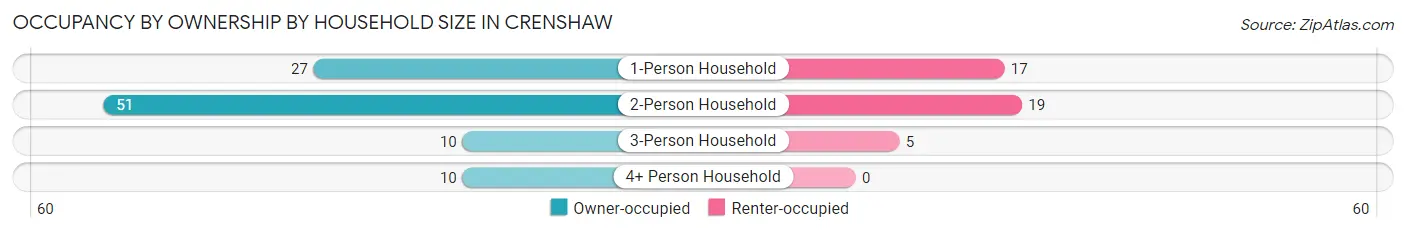
| Household Size | Owner-occupied | Renter-occupied |
| 1-Person Household | 27 (61.4%) | 17 (38.6%) |
| 2-Person Household | 51 (72.9%) | 19 (27.1%) |
| 3-Person Household | 10 (66.7%) | 5 (33.3%) |
| 4+ Person Household | 10 (100.0%) | 0 (0.0%) |
| Total Housing Units | 98 (70.5%) | 41 (29.5%) |
Occupancy by Educational Attainment in Crenshaw
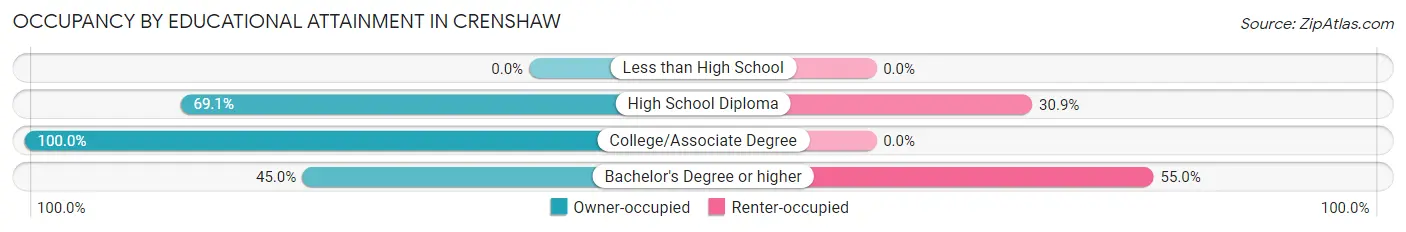
| Household Size | Owner-occupied | Renter-occupied |
| Less than High School | 0 (0.0%) | 0 (0.0%) |
| High School Diploma | 67 (69.1%) | 30 (30.9%) |
| College/Associate Degree | 22 (100.0%) | 0 (0.0%) |
| Bachelor's Degree or higher | 9 (45.0%) | 11 (55.0%) |
Occupancy by Age of Householder in Crenshaw
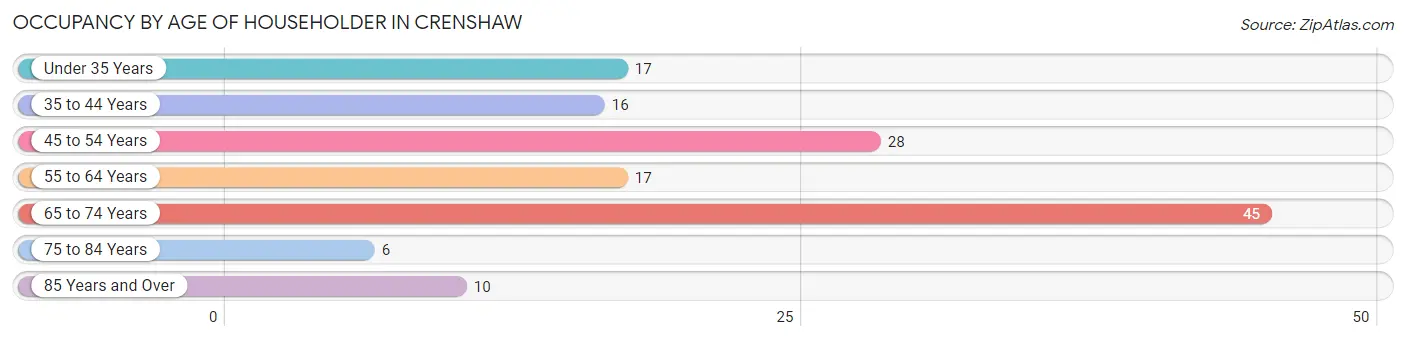
| Age Bracket | # Households | % Households |
| Under 35 Years | 17 | 12.2% |
| 35 to 44 Years | 16 | 11.5% |
| 45 to 54 Years | 28 | 20.1% |
| 55 to 64 Years | 17 | 12.2% |
| 65 to 74 Years | 45 | 32.4% |
| 75 to 84 Years | 6 | 4.3% |
| 85 Years and Over | 10 | 7.2% |
| Total | 139 | 100.0% |
Housing Finances in Crenshaw
Median Income by Occupancy in Crenshaw
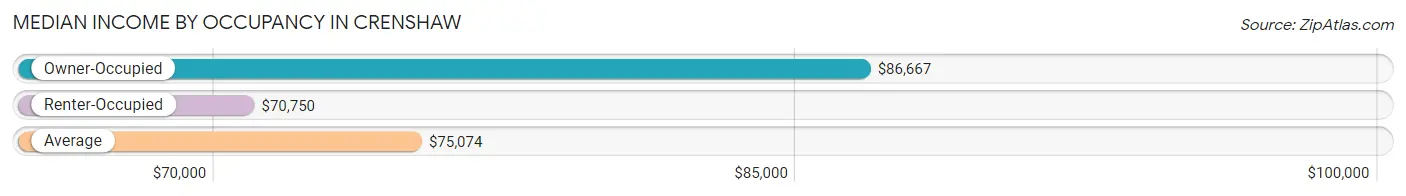
| Occupancy Type | # Households | Median Income |
| Owner-Occupied | 98 (70.5%) | $86,667 |
| Renter-Occupied | 41 (29.5%) | $70,750 |
| Average | 139 (100.0%) | $75,074 |
Occupancy by Householder Income Bracket in Crenshaw
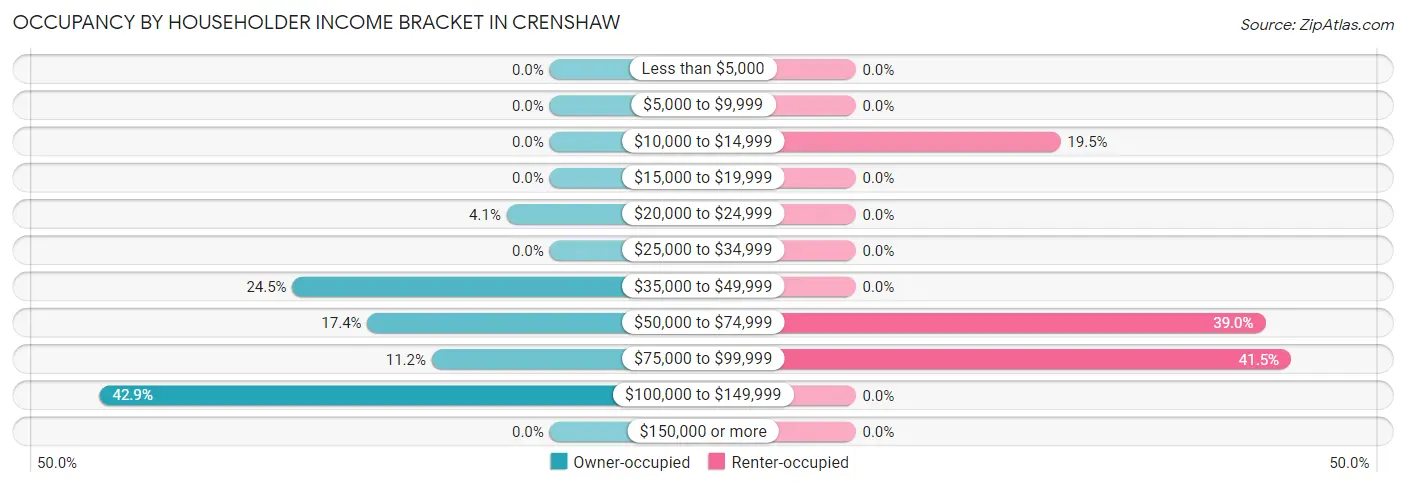
| Income Bracket | Owner-occupied | Renter-occupied |
| Less than $5,000 | 0 (0.0%) | 0 (0.0%) |
| $5,000 to $9,999 | 0 (0.0%) | 0 (0.0%) |
| $10,000 to $14,999 | 0 (0.0%) | 8 (19.5%) |
| $15,000 to $19,999 | 0 (0.0%) | 0 (0.0%) |
| $20,000 to $24,999 | 4 (4.1%) | 0 (0.0%) |
| $25,000 to $34,999 | 0 (0.0%) | 0 (0.0%) |
| $35,000 to $49,999 | 24 (24.5%) | 0 (0.0%) |
| $50,000 to $74,999 | 17 (17.3%) | 16 (39.0%) |
| $75,000 to $99,999 | 11 (11.2%) | 17 (41.5%) |
| $100,000 to $149,999 | 42 (42.9%) | 0 (0.0%) |
| $150,000 or more | 0 (0.0%) | 0 (0.0%) |
| Total | 98 (100.0%) | 41 (100.0%) |
Monthly Housing Cost Tiers in Crenshaw
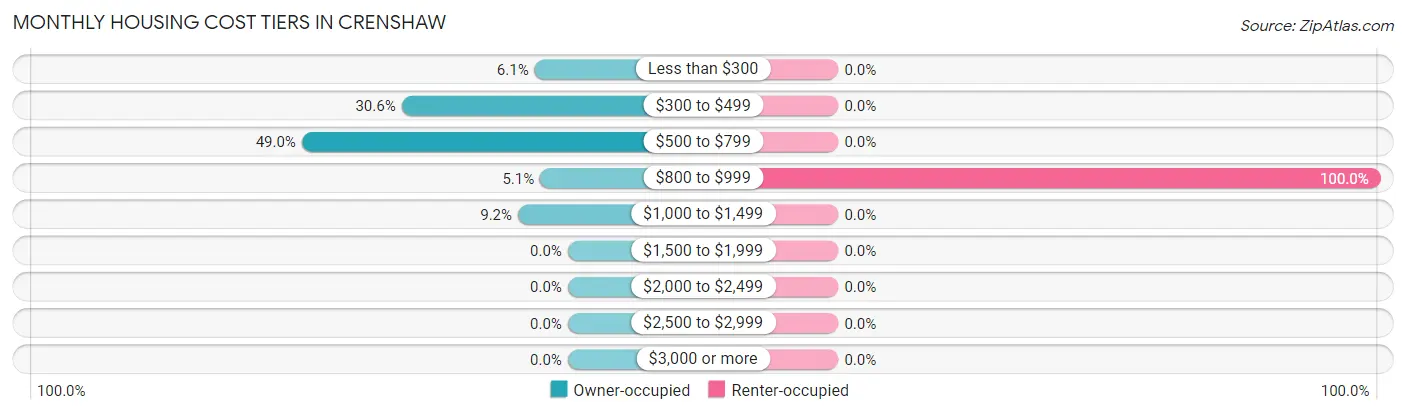
| Monthly Cost | Owner-occupied | Renter-occupied |
| Less than $300 | 6 (6.1%) | 0 (0.0%) |
| $300 to $499 | 30 (30.6%) | 0 (0.0%) |
| $500 to $799 | 48 (49.0%) | 0 (0.0%) |
| $800 to $999 | 5 (5.1%) | 41 (100.0%) |
| $1,000 to $1,499 | 9 (9.2%) | 0 (0.0%) |
| $1,500 to $1,999 | 0 (0.0%) | 0 (0.0%) |
| $2,000 to $2,499 | 0 (0.0%) | 0 (0.0%) |
| $2,500 to $2,999 | 0 (0.0%) | 0 (0.0%) |
| $3,000 or more | 0 (0.0%) | 0 (0.0%) |
| Total | 98 (100.0%) | 41 (100.0%) |
Physical Housing Characteristics in Crenshaw
Housing Structures in Crenshaw
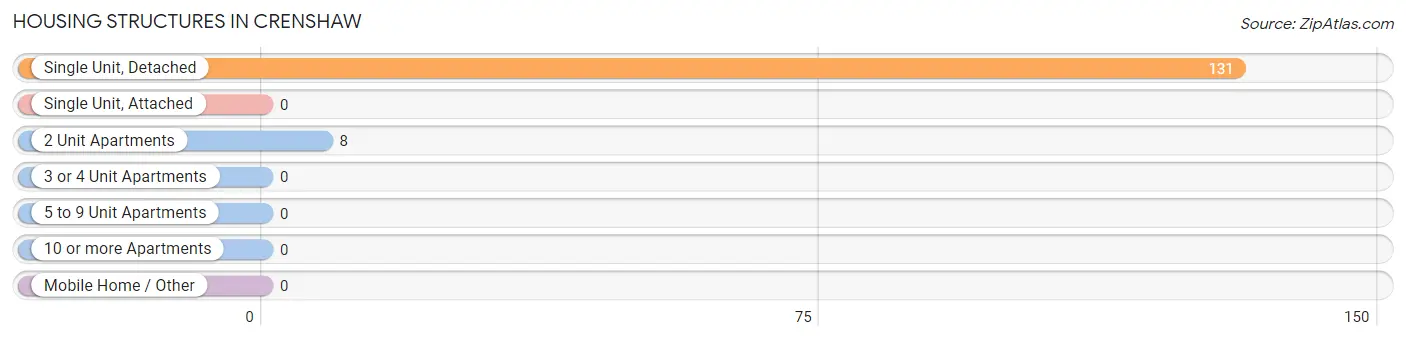
| Structure Type | # Housing Units | % Housing Units |
| Single Unit, Detached | 131 | 94.2% |
| Single Unit, Attached | 0 | 0.0% |
| 2 Unit Apartments | 8 | 5.8% |
| 3 or 4 Unit Apartments | 0 | 0.0% |
| 5 to 9 Unit Apartments | 0 | 0.0% |
| 10 or more Apartments | 0 | 0.0% |
| Mobile Home / Other | 0 | 0.0% |
| Total | 139 | 100.0% |
Housing Structures by Occupancy in Crenshaw
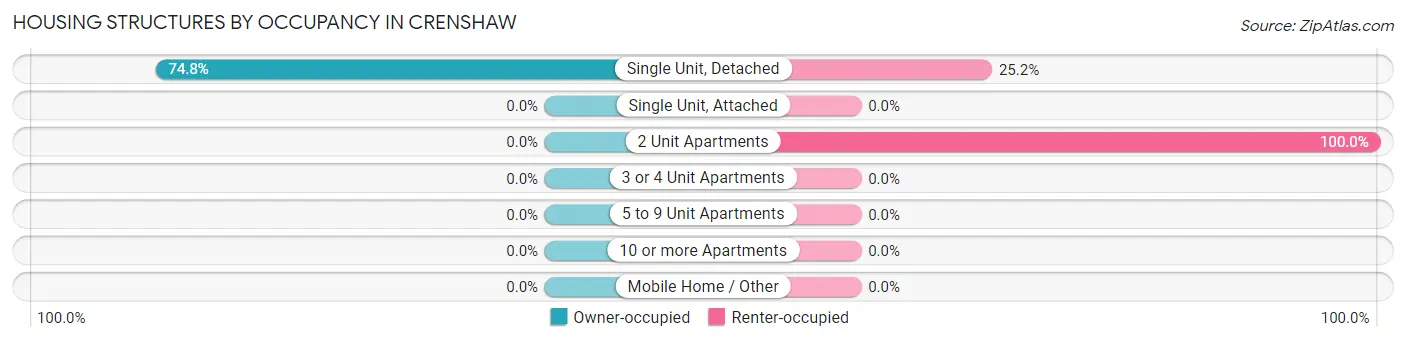
| Structure Type | Owner-occupied | Renter-occupied |
| Single Unit, Detached | 98 (74.8%) | 33 (25.2%) |
| Single Unit, Attached | 0 (0.0%) | 0 (0.0%) |
| 2 Unit Apartments | 0 (0.0%) | 8 (100.0%) |
| 3 or 4 Unit Apartments | 0 (0.0%) | 0 (0.0%) |
| 5 to 9 Unit Apartments | 0 (0.0%) | 0 (0.0%) |
| 10 or more Apartments | 0 (0.0%) | 0 (0.0%) |
| Mobile Home / Other | 0 (0.0%) | 0 (0.0%) |
| Total | 98 (70.5%) | 41 (29.5%) |
Housing Structures by Number of Rooms in Crenshaw
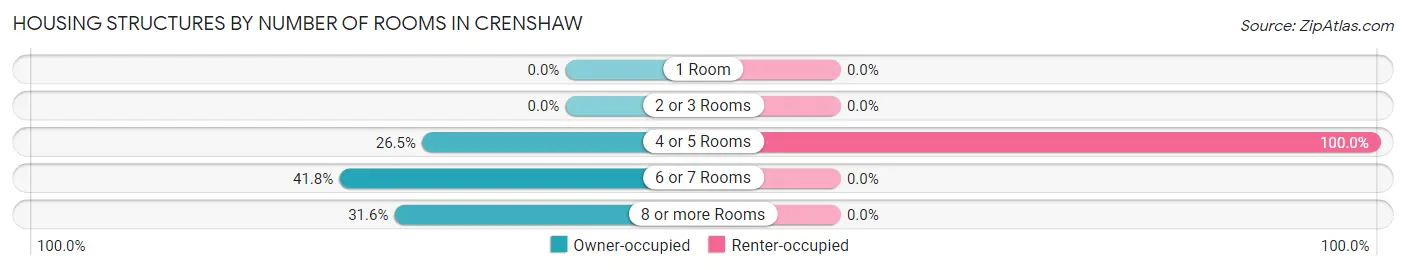
| Number of Rooms | Owner-occupied | Renter-occupied |
| 1 Room | 0 (0.0%) | 0 (0.0%) |
| 2 or 3 Rooms | 0 (0.0%) | 0 (0.0%) |
| 4 or 5 Rooms | 26 (26.5%) | 41 (100.0%) |
| 6 or 7 Rooms | 41 (41.8%) | 0 (0.0%) |
| 8 or more Rooms | 31 (31.6%) | 0 (0.0%) |
| Total | 98 (100.0%) | 41 (100.0%) |
Housing Structure by Heating Type in Crenshaw
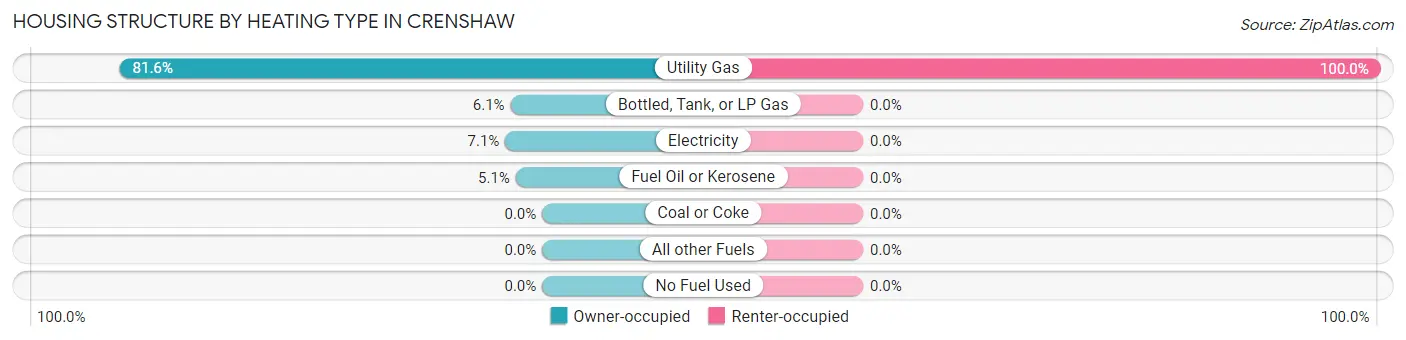
| Heating Type | Owner-occupied | Renter-occupied |
| Utility Gas | 80 (81.6%) | 41 (100.0%) |
| Bottled, Tank, or LP Gas | 6 (6.1%) | 0 (0.0%) |
| Electricity | 7 (7.1%) | 0 (0.0%) |
| Fuel Oil or Kerosene | 5 (5.1%) | 0 (0.0%) |
| Coal or Coke | 0 (0.0%) | 0 (0.0%) |
| All other Fuels | 0 (0.0%) | 0 (0.0%) |
| No Fuel Used | 0 (0.0%) | 0 (0.0%) |
| Total | 98 (100.0%) | 41 (100.0%) |
Household Vehicle Usage in Crenshaw
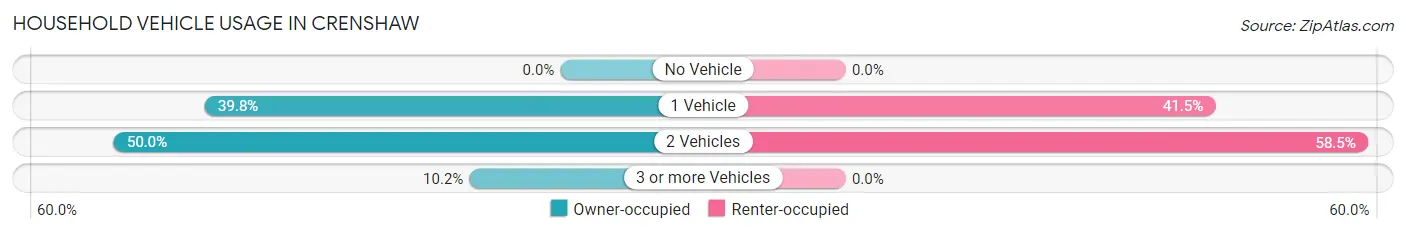
| Vehicles per Household | Owner-occupied | Renter-occupied |
| No Vehicle | 0 (0.0%) | 0 (0.0%) |
| 1 Vehicle | 39 (39.8%) | 17 (41.5%) |
| 2 Vehicles | 49 (50.0%) | 24 (58.5%) |
| 3 or more Vehicles | 10 (10.2%) | 0 (0.0%) |
| Total | 98 (100.0%) | 41 (100.0%) |
Real Estate & Mortgages in Crenshaw
Real Estate and Mortgage Overview in Crenshaw
| Characteristic | Without Mortgage | With Mortgage |
| Housing Units | 58 | 40 |
| Median Property Value | $240,000 | $134,100 |
| Median Household Income | $116,000 | $0 |
| Monthly Housing Costs | $467 | $0 |
| Real Estate Taxes | $2,150 | $0 |
Property Value by Mortgage Status in Crenshaw
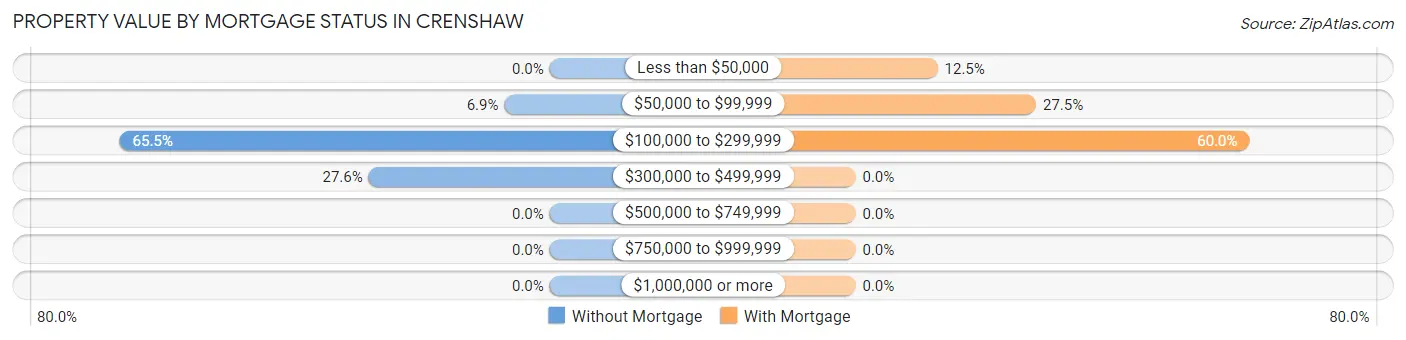
| Property Value | Without Mortgage | With Mortgage |
| Less than $50,000 | 0 (0.0%) | 5 (12.5%) |
| $50,000 to $99,999 | 4 (6.9%) | 11 (27.5%) |
| $100,000 to $299,999 | 38 (65.5%) | 24 (60.0%) |
| $300,000 to $499,999 | 16 (27.6%) | 0 (0.0%) |
| $500,000 to $749,999 | 0 (0.0%) | 0 (0.0%) |
| $750,000 to $999,999 | 0 (0.0%) | 0 (0.0%) |
| $1,000,000 or more | 0 (0.0%) | 0 (0.0%) |
| Total | 58 (100.0%) | 40 (100.0%) |
Household Income by Mortgage Status in Crenshaw
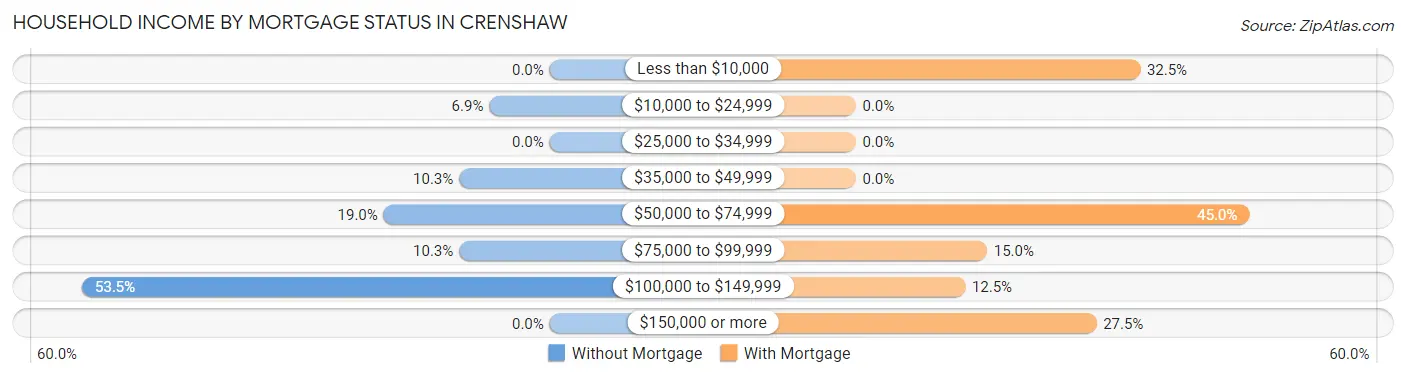
| Household Income | Without Mortgage | With Mortgage |
| Less than $10,000 | 0 (0.0%) | 13 (32.5%) |
| $10,000 to $24,999 | 4 (6.9%) | 0 (0.0%) |
| $25,000 to $34,999 | 0 (0.0%) | 0 (0.0%) |
| $35,000 to $49,999 | 6 (10.3%) | 0 (0.0%) |
| $50,000 to $74,999 | 11 (19.0%) | 18 (45.0%) |
| $75,000 to $99,999 | 6 (10.3%) | 6 (15.0%) |
| $100,000 to $149,999 | 31 (53.4%) | 5 (12.5%) |
| $150,000 or more | 0 (0.0%) | 11 (27.5%) |
| Total | 58 (100.0%) | 40 (100.0%) |
Property Value to Household Income Ratio in Crenshaw
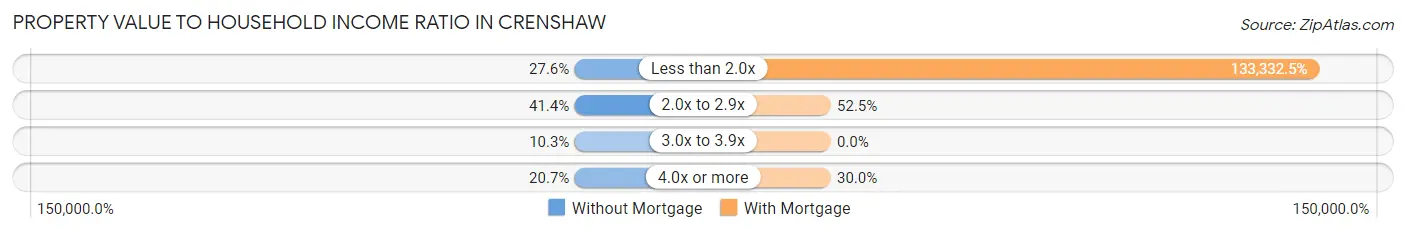
| Value-to-Income Ratio | Without Mortgage | With Mortgage |
| Less than 2.0x | 16 (27.6%) | 53,333 (133,332.5%) |
| 2.0x to 2.9x | 24 (41.4%) | 21 (52.5%) |
| 3.0x to 3.9x | 6 (10.3%) | 0 (0.0%) |
| 4.0x or more | 12 (20.7%) | 12 (30.0%) |
| Total | 58 (100.0%) | 40 (100.0%) |
Real Estate Taxes by Mortgage Status in Crenshaw
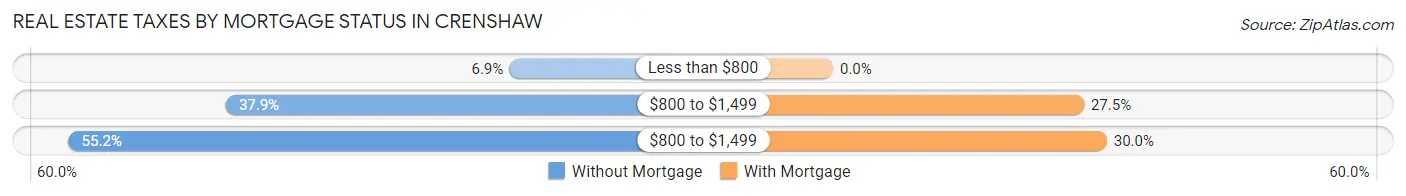
| Property Taxes | Without Mortgage | With Mortgage |
| Less than $800 | 4 (6.9%) | 0 (0.0%) |
| $800 to $1,499 | 22 (37.9%) | 11 (27.5%) |
| $800 to $1,499 | 32 (55.2%) | 12 (30.0%) |
| Total | 58 (100.0%) | 40 (100.0%) |
Health & Disability in Crenshaw
Health Insurance Coverage by Age in Crenshaw
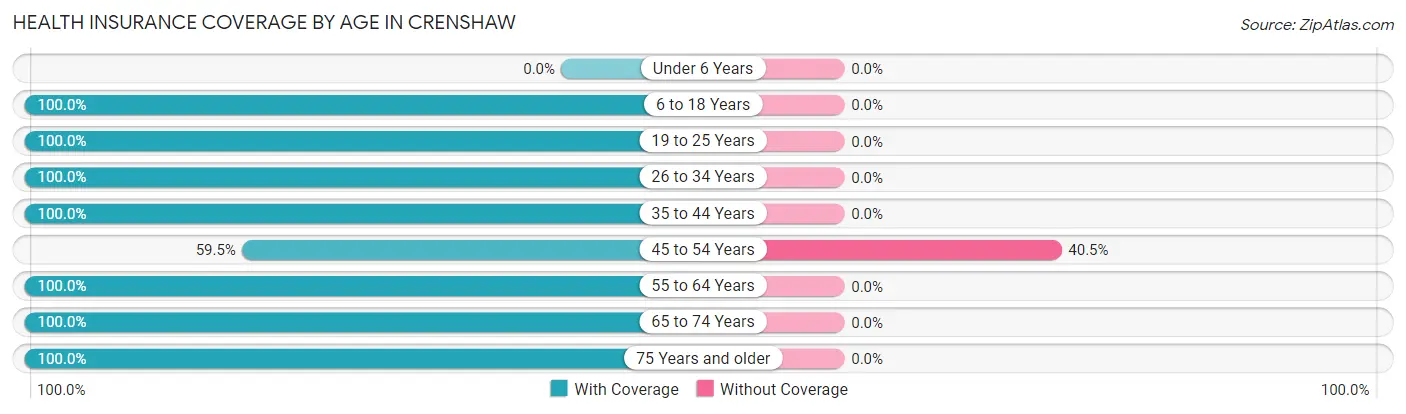
| Age Bracket | With Coverage | Without Coverage |
| Under 6 Years | 0 (0.0%) | 0 (0.0%) |
| 6 to 18 Years | 25 (100.0%) | 0 (0.0%) |
| 19 to 25 Years | 20 (100.0%) | 0 (0.0%) |
| 26 to 34 Years | 54 (100.0%) | 0 (0.0%) |
| 35 to 44 Years | 24 (100.0%) | 0 (0.0%) |
| 45 to 54 Years | 25 (59.5%) | 17 (40.5%) |
| 55 to 64 Years | 28 (100.0%) | 0 (0.0%) |
| 65 to 74 Years | 87 (100.0%) | 0 (0.0%) |
| 75 Years and older | 26 (100.0%) | 0 (0.0%) |
| Total | 289 (94.4%) | 17 (5.6%) |
Health Insurance Coverage by Citizenship Status in Crenshaw
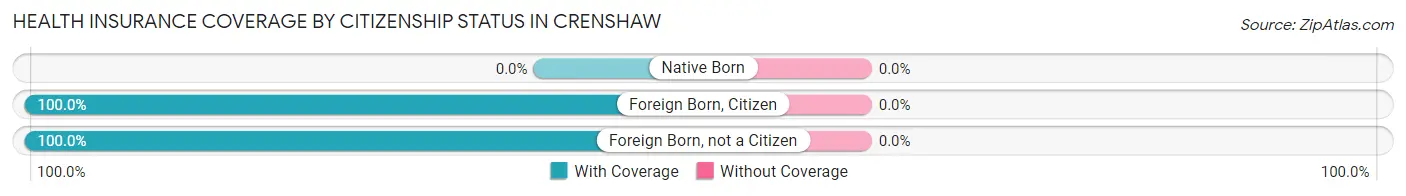
| Citizenship Status | With Coverage | Without Coverage |
| Native Born | 0 (0.0%) | 0 (0.0%) |
| Foreign Born, Citizen | 25 (100.0%) | 0 (0.0%) |
| Foreign Born, not a Citizen | 20 (100.0%) | 0 (0.0%) |
Health Insurance Coverage by Household Income in Crenshaw
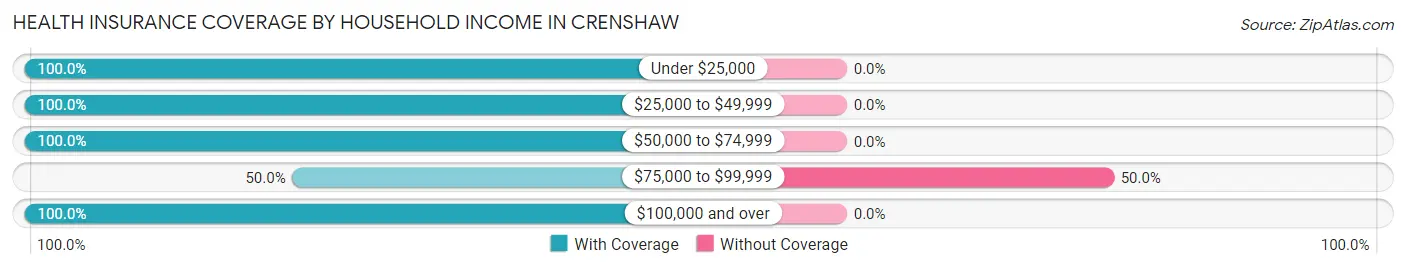
| Household Income | With Coverage | Without Coverage |
| Under $25,000 | 27 (100.0%) | 0 (0.0%) |
| $25,000 to $49,999 | 34 (100.0%) | 0 (0.0%) |
| $50,000 to $74,999 | 96 (100.0%) | 0 (0.0%) |
| $75,000 to $99,999 | 17 (50.0%) | 17 (50.0%) |
| $100,000 and over | 115 (100.0%) | 0 (0.0%) |
Public vs Private Health Insurance Coverage by Age in Crenshaw
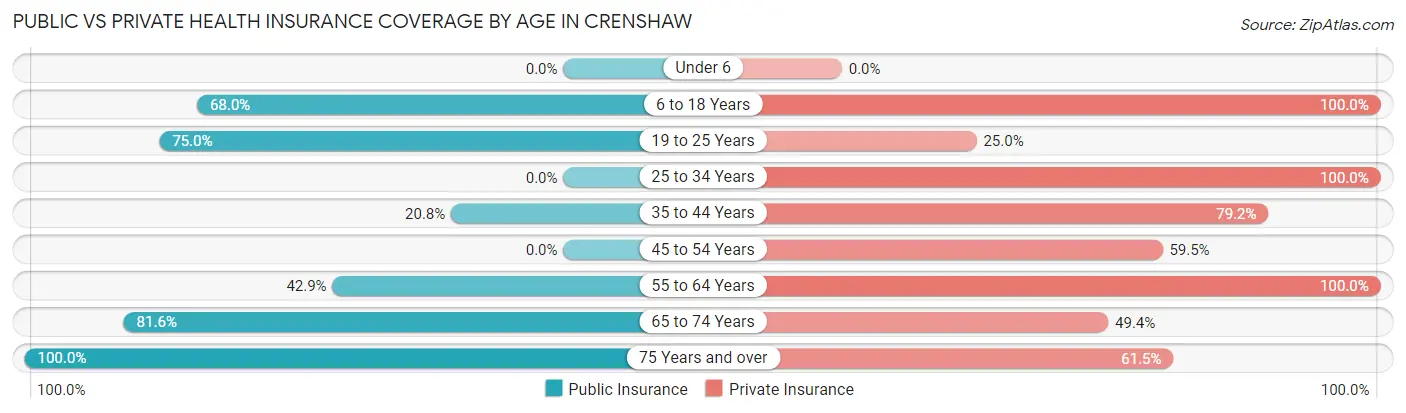
| Age Bracket | Public Insurance | Private Insurance |
| Under 6 | 0 (0.0%) | 0 (0.0%) |
| 6 to 18 Years | 17 (68.0%) | 25 (100.0%) |
| 19 to 25 Years | 15 (75.0%) | 5 (25.0%) |
| 25 to 34 Years | 0 (0.0%) | 54 (100.0%) |
| 35 to 44 Years | 5 (20.8%) | 19 (79.2%) |
| 45 to 54 Years | 0 (0.0%) | 25 (59.5%) |
| 55 to 64 Years | 12 (42.9%) | 28 (100.0%) |
| 65 to 74 Years | 71 (81.6%) | 43 (49.4%) |
| 75 Years and over | 26 (100.0%) | 16 (61.5%) |
| Total | 146 (47.7%) | 215 (70.3%) |
Disability Status by Sex by Age in Crenshaw
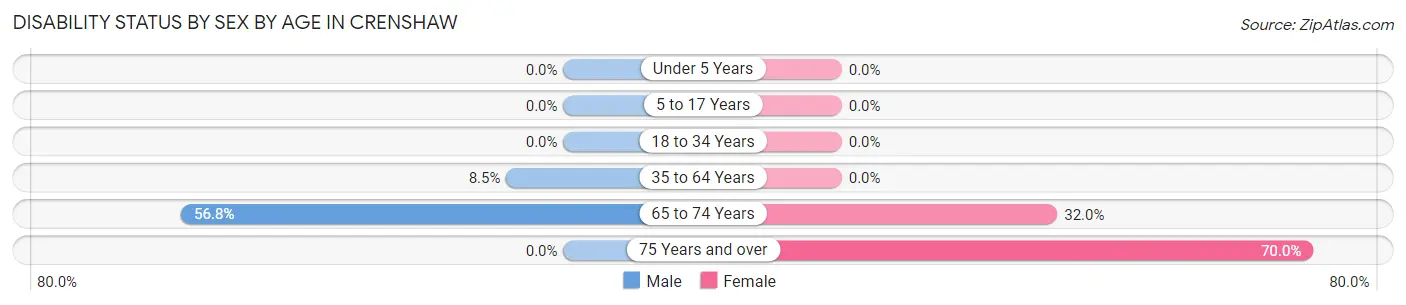
| Age Bracket | Male | Female |
| Under 5 Years | 0 (0.0%) | 0 (0.0%) |
| 5 to 17 Years | 0 (0.0%) | 0 (0.0%) |
| 18 to 34 Years | 0 (0.0%) | 0 (0.0%) |
| 35 to 64 Years | 5 (8.5%) | 0 (0.0%) |
| 65 to 74 Years | 21 (56.8%) | 16 (32.0%) |
| 75 Years and over | 0 (0.0%) | 14 (70.0%) |
Disability Class by Sex by Age in Crenshaw
Disability Class: Hearing Difficulty
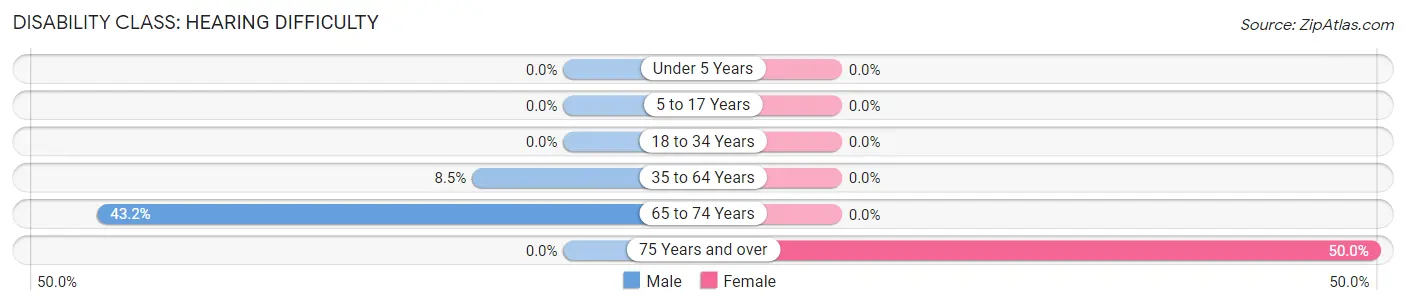
| Age Bracket | Male | Female |
| Under 5 Years | 0 (0.0%) | 0 (0.0%) |
| 5 to 17 Years | 0 (0.0%) | 0 (0.0%) |
| 18 to 34 Years | 0 (0.0%) | 0 (0.0%) |
| 35 to 64 Years | 5 (8.5%) | 0 (0.0%) |
| 65 to 74 Years | 16 (43.2%) | 0 (0.0%) |
| 75 Years and over | 0 (0.0%) | 10 (50.0%) |
Disability Class: Vision Difficulty
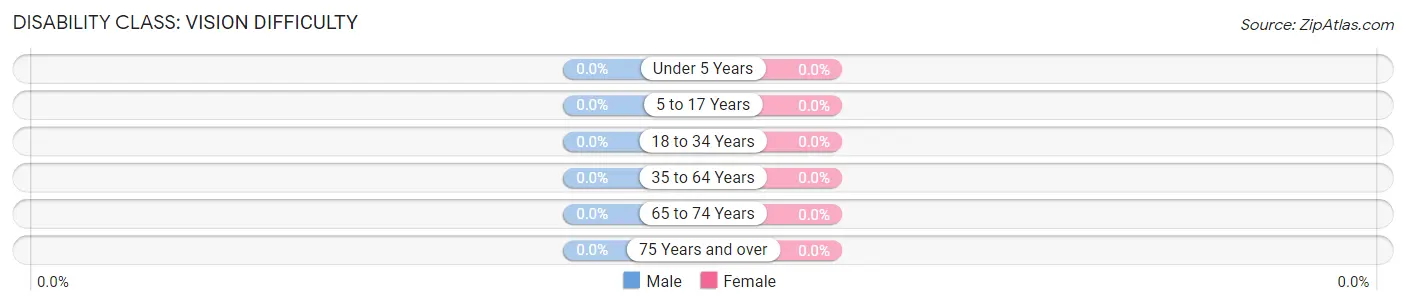
| Age Bracket | Male | Female |
| Under 5 Years | 0 (0.0%) | 0 (0.0%) |
| 5 to 17 Years | 0 (0.0%) | 0 (0.0%) |
| 18 to 34 Years | 0 (0.0%) | 0 (0.0%) |
| 35 to 64 Years | 0 (0.0%) | 0 (0.0%) |
| 65 to 74 Years | 0 (0.0%) | 0 (0.0%) |
| 75 Years and over | 0 (0.0%) | 0 (0.0%) |
Disability Class: Cognitive Difficulty
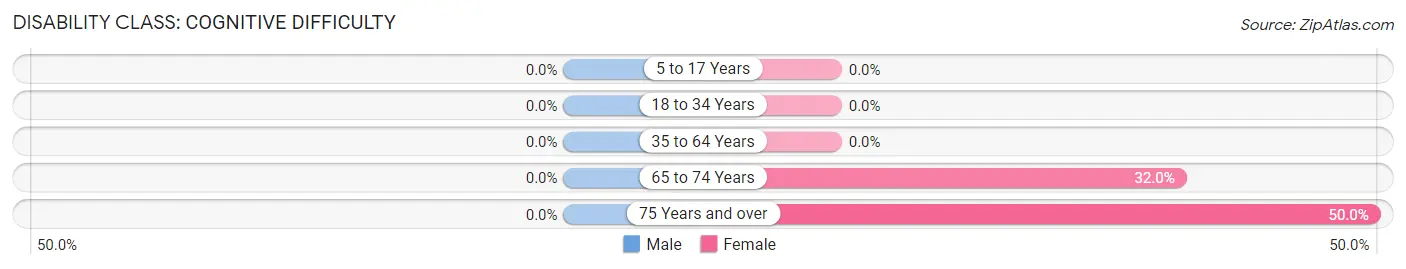
| Age Bracket | Male | Female |
| 5 to 17 Years | 0 (0.0%) | 0 (0.0%) |
| 18 to 34 Years | 0 (0.0%) | 0 (0.0%) |
| 35 to 64 Years | 0 (0.0%) | 0 (0.0%) |
| 65 to 74 Years | 0 (0.0%) | 16 (32.0%) |
| 75 Years and over | 0 (0.0%) | 10 (50.0%) |
Disability Class: Ambulatory Difficulty
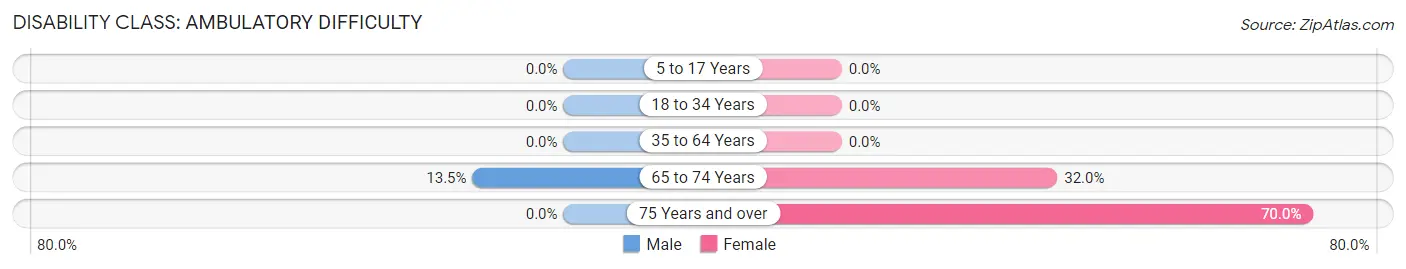
| Age Bracket | Male | Female |
| 5 to 17 Years | 0 (0.0%) | 0 (0.0%) |
| 18 to 34 Years | 0 (0.0%) | 0 (0.0%) |
| 35 to 64 Years | 0 (0.0%) | 0 (0.0%) |
| 65 to 74 Years | 5 (13.5%) | 16 (32.0%) |
| 75 Years and over | 0 (0.0%) | 14 (70.0%) |
Disability Class: Self-Care Difficulty
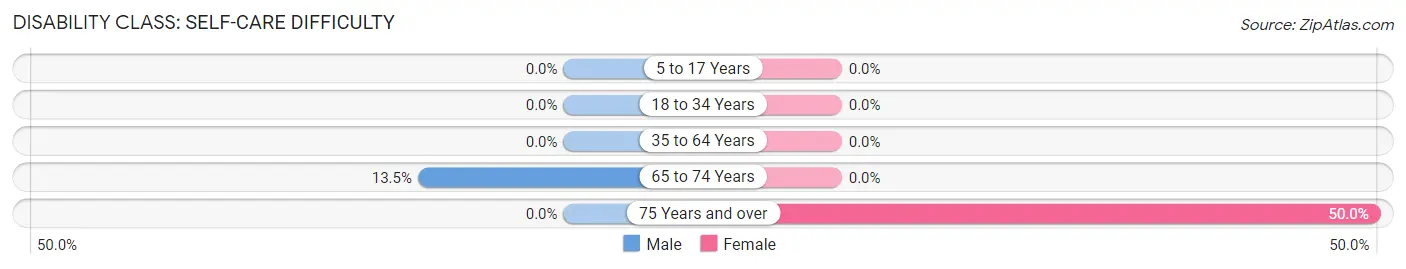
| Age Bracket | Male | Female |
| 5 to 17 Years | 0 (0.0%) | 0 (0.0%) |
| 18 to 34 Years | 0 (0.0%) | 0 (0.0%) |
| 35 to 64 Years | 0 (0.0%) | 0 (0.0%) |
| 65 to 74 Years | 5 (13.5%) | 0 (0.0%) |
| 75 Years and over | 0 (0.0%) | 10 (50.0%) |
Technology Access in Crenshaw
Computing Device Access in Crenshaw
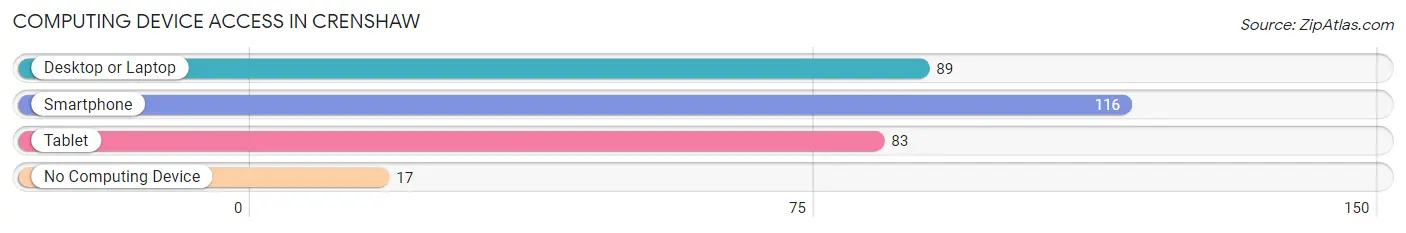
| Device Type | # Households | % Households |
| Desktop or Laptop | 89 | 64.0% |
| Smartphone | 116 | 83.5% |
| Tablet | 83 | 59.7% |
| No Computing Device | 17 | 12.2% |
| Total | 139 | 100.0% |
Internet Access in Crenshaw
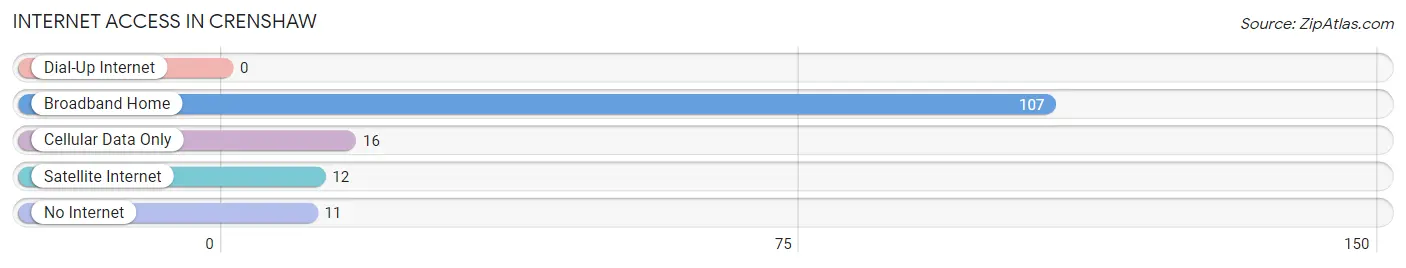
| Internet Type | # Households | % Households |
| Dial-Up Internet | 0 | 0.0% |
| Broadband Home | 107 | 77.0% |
| Cellular Data Only | 16 | 11.5% |
| Satellite Internet | 12 | 8.6% |
| No Internet | 11 | 7.9% |
| Total | 139 | 100.0% |
Crenshaw Summary
Crenshaw, Pennsylvania is a small borough located in the northwest corner of Luzerne County. It is situated in the foothills of the Pocono Mountains and is bordered by the Susquehanna River to the north and the Lackawanna River to the south. The borough is home to approximately 1,500 people and is part of the Wilkes-Barre–Scranton–Hazleton Metropolitan Statistical Area.
History
The area that is now Crenshaw was first settled in the late 1700s by a group of German immigrants. The town was originally known as “Crenshaw’s Settlement” and was named after the family of William Crenshaw, who was one of the first settlers. The town was officially incorporated in 1845 and was named Crenshaw in honor of the Crenshaw family.
In the late 1800s, Crenshaw was a thriving industrial center. The town was home to several coal mines, a brickyard, a tannery, and a sawmill. The coal mines provided employment for many of the town’s residents and helped to fuel the local economy.
Geography
Crenshaw is located in the northwest corner of Luzerne County, Pennsylvania. It is situated in the foothills of the Pocono Mountains and is bordered by the Susquehanna River to the north and the Lackawanna River to the south. The borough covers an area of 1.2 square miles and is home to approximately 1,500 people.
The terrain of Crenshaw is mostly hilly and is covered with forests and fields. The borough is located in the Appalachian Mountains and is part of the Appalachian Plateau. The climate of Crenshaw is humid continental, with cold winters and hot, humid summers.
Economy
The economy of Crenshaw is largely based on agriculture and tourism. The town is home to several farms, which produce a variety of crops, including corn, soybeans, and hay. The town is also home to several tourist attractions, including the Crenshaw Historical Society Museum, the Crenshaw Country Club, and the Crenshaw Golf Course.
The town is also home to several small businesses, including restaurants, retail stores, and service providers. The town is served by the Wilkes-Barre/Scranton International Airport, which is located just a few miles away.
Demographics
As of the 2010 census, the population of Crenshaw was 1,521. The racial makeup of the town was 97.3% White, 0.7% African American, 0.2% Native American, 0.2% Asian, 0.2% from other races, and 1.4% from two or more races. Hispanic or Latino of any race were 1.2% of the population.
The median household income in Crenshaw was $41,250, and the median family income was $50,000. The per capita income for the town was $20,945. About 11.2% of families and 13.2% of the population were below the poverty line, including 17.2% of those under age 18 and 8.3% of those age 65 or over.
Crenshaw is a small, rural town with a rich history and a strong sense of community. The town is home to a variety of businesses and attractions, and its economy is largely based on agriculture and tourism. The town is also home to a diverse population, with a variety of racial and ethnic backgrounds.
Common Questions
What is Per Capita Income in Crenshaw?
Per Capita income in Crenshaw is $38,694.
What is the Median Household income in Crenshaw?
Median Household Income in Crenshaw is $75,074.
What is Inequality or Gini Index in Crenshaw?
Inequality or Gini Index in Crenshaw is 0.27.
What is the Total Population of Crenshaw?
Total Population of Crenshaw is 306.
What is the Total Male Population of Crenshaw?
Total Male Population of Crenshaw is 154.
What is the Total Female Population of Crenshaw?
Total Female Population of Crenshaw is 152.
What is the Ratio of Males per 100 Females in Crenshaw?
There are 101.32 Males per 100 Females in Crenshaw.
What is the Ratio of Females per 100 Males in Crenshaw?
There are 98.70 Females per 100 Males in Crenshaw.
What is the Median Population Age in Crenshaw?
Median Population Age in Crenshaw is 52.2 Years.
What is the Average Family Size in Crenshaw
Average Family Size in Crenshaw is 2.9 People.
What is the Average Household Size in Crenshaw
Average Household Size in Crenshaw is 2.2 People.
How Large is the Labor Force in Crenshaw?
There are 142 People in the Labor Forcein in Crenshaw.
What is the Percentage of People in the Labor Force in Crenshaw?
50.5% of People are in the Labor Force in Crenshaw.
What is the Unemployment Rate in Crenshaw?
Unemployment Rate in Crenshaw is 12.0%.