Vienna Center, OH Map & Demographics
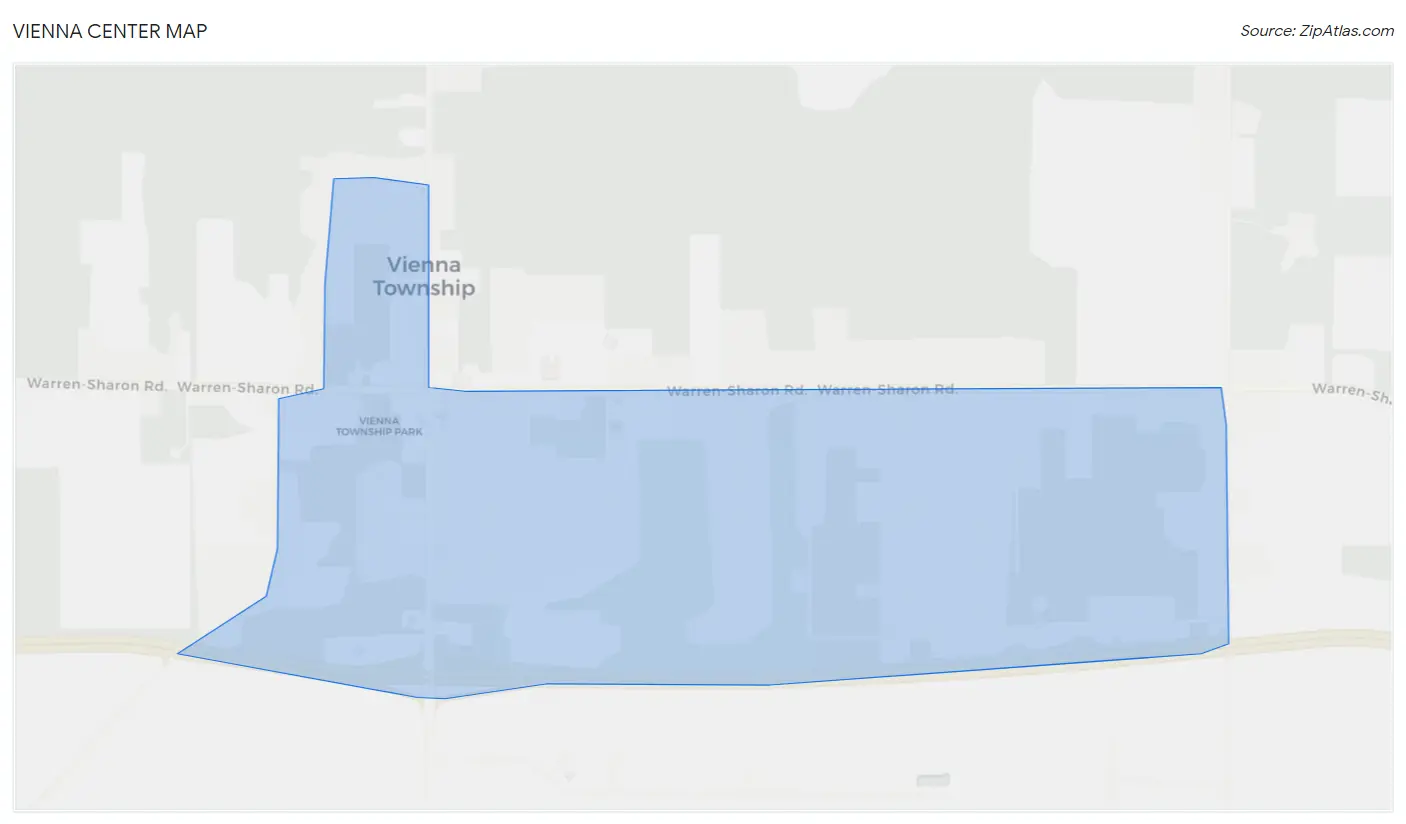
Vienna Center Map
Vienna Center Overview
$37,630
PER CAPITA INCOME
$113,292
AVG FAMILY INCOME
$60,855
AVG HOUSEHOLD INCOME
31.2%
WAGE / INCOME GAP [ % ]
68.8¢/ $1
WAGE / INCOME GAP [ $ ]
0.39
INEQUALITY / GINI INDEX
651
TOTAL POPULATION
334
MALE POPULATION
317
FEMALE POPULATION
105.36
MALES / 100 FEMALES
94.91
FEMALES / 100 MALES
48.7
MEDIAN AGE
3.0
AVG FAMILY SIZE
2.3
AVG HOUSEHOLD SIZE
352
LABOR FORCE [ PEOPLE ]
57.5%
PERCENT IN LABOR FORCE
8.5%
UNEMPLOYMENT RATE
Income in Vienna Center
Income Overview in Vienna Center
Per Capita Income in Vienna Center is $37,630, while median incomes of families and households are $113,292 and $60,855 respectively.
| Characteristic | Number | Measure |
| Per Capita Income | 651 | $37,630 |
| Median Family Income | 143 | $113,292 |
| Mean Family Income | 143 | $114,077 |
| Median Household Income | 283 | $60,855 |
| Mean Household Income | 283 | $85,904 |
| Income Deficit | 143 | $0 |
| Wage / Income Gap (%) | 651 | 31.17% |
| Wage / Income Gap ($) | 651 | 68.83¢ per $1 |
| Gini / Inequality Index | 651 | 0.39 |
Earnings by Sex in Vienna Center
Average Earnings in Vienna Center are $33,182, $28,393 for men and $41,250 for women, a difference of 31.2%.
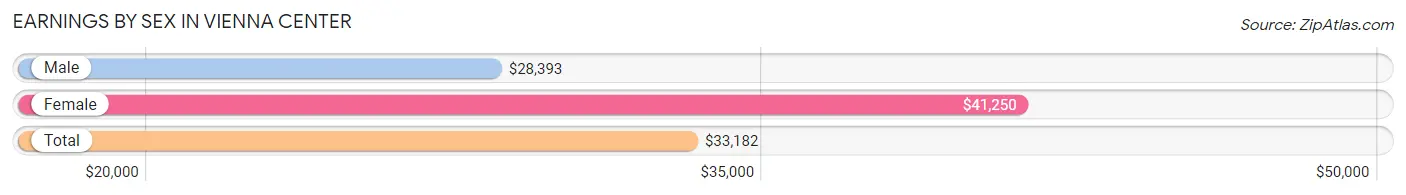
| Sex | Number | Average Earnings |
| Male | 217 (62.7%) | $28,393 |
| Female | 129 (37.3%) | $41,250 |
| Total | 346 (100.0%) | $33,182 |
Earnings by Sex by Income Bracket in Vienna Center
The most common earnings brackets in Vienna Center are $75,000 to $99,999 for men (63 | 29.0%) and $75,000 to $99,999 for women (30 | 23.3%).
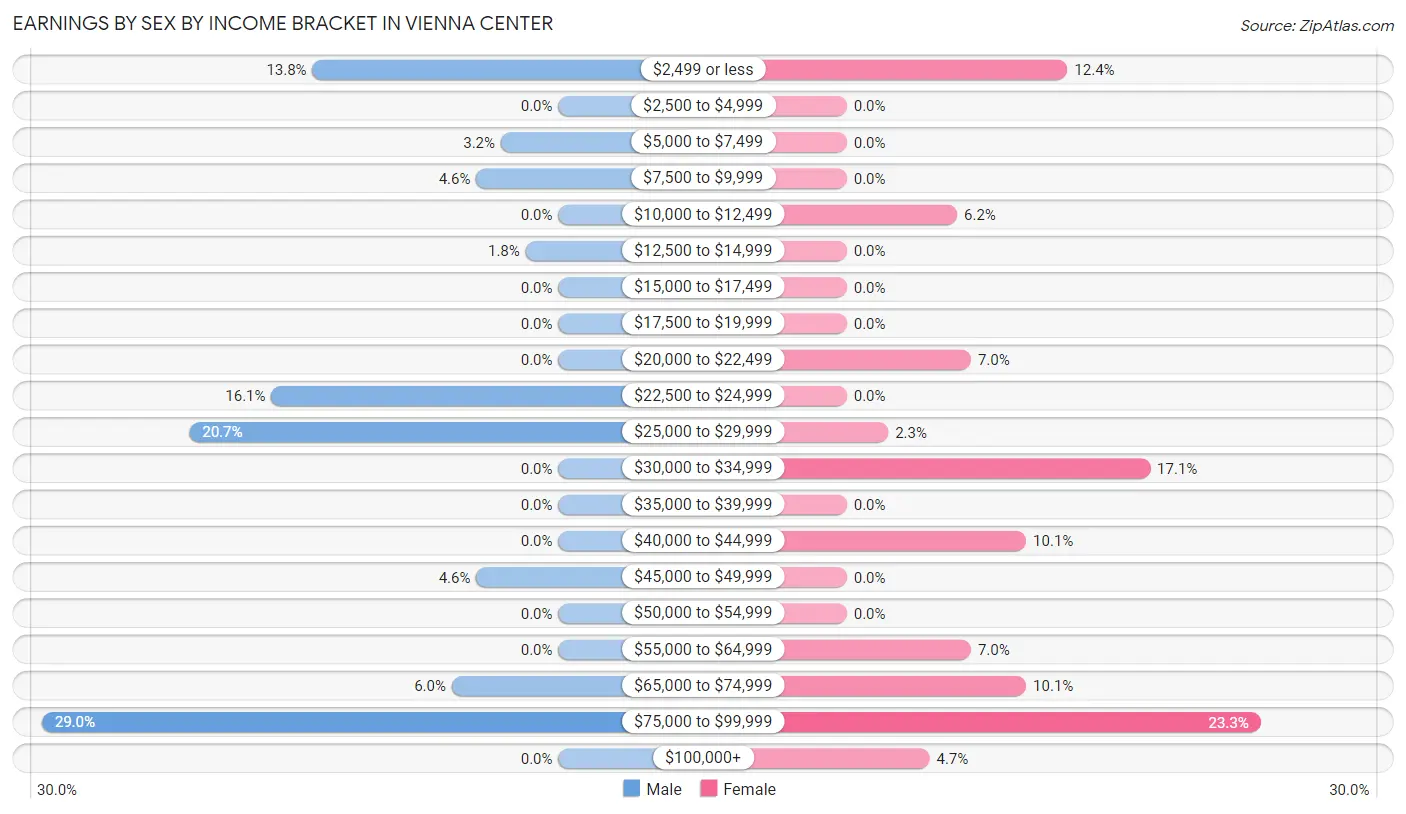
| Income | Male | Female |
| $2,499 or less | 30 (13.8%) | 16 (12.4%) |
| $2,500 to $4,999 | 0 (0.0%) | 0 (0.0%) |
| $5,000 to $7,499 | 7 (3.2%) | 0 (0.0%) |
| $7,500 to $9,999 | 10 (4.6%) | 0 (0.0%) |
| $10,000 to $12,499 | 0 (0.0%) | 8 (6.2%) |
| $12,500 to $14,999 | 4 (1.8%) | 0 (0.0%) |
| $15,000 to $17,499 | 0 (0.0%) | 0 (0.0%) |
| $17,500 to $19,999 | 0 (0.0%) | 0 (0.0%) |
| $20,000 to $22,499 | 0 (0.0%) | 9 (7.0%) |
| $22,500 to $24,999 | 35 (16.1%) | 0 (0.0%) |
| $25,000 to $29,999 | 45 (20.7%) | 3 (2.3%) |
| $30,000 to $34,999 | 0 (0.0%) | 22 (17.1%) |
| $35,000 to $39,999 | 0 (0.0%) | 0 (0.0%) |
| $40,000 to $44,999 | 0 (0.0%) | 13 (10.1%) |
| $45,000 to $49,999 | 10 (4.6%) | 0 (0.0%) |
| $50,000 to $54,999 | 0 (0.0%) | 0 (0.0%) |
| $55,000 to $64,999 | 0 (0.0%) | 9 (7.0%) |
| $65,000 to $74,999 | 13 (6.0%) | 13 (10.1%) |
| $75,000 to $99,999 | 63 (29.0%) | 30 (23.3%) |
| $100,000+ | 0 (0.0%) | 6 (4.6%) |
| Total | 217 (100.0%) | 129 (100.0%) |
Earnings by Sex by Educational Attainment in Vienna Center
Average earnings in Vienna Center are $82,250 for men and $73,365 for women, a difference of 10.8%. Men with an educational attainment of bachelor's degree enjoy the highest average annual earnings of $81,000, while those with high school diploma education earn the least with $68,077. Women with an educational attainment of bachelor's degree earn the most with the average annual earnings of $76,339, while those with college or associate's degree education have the smallest earnings of $74,038.
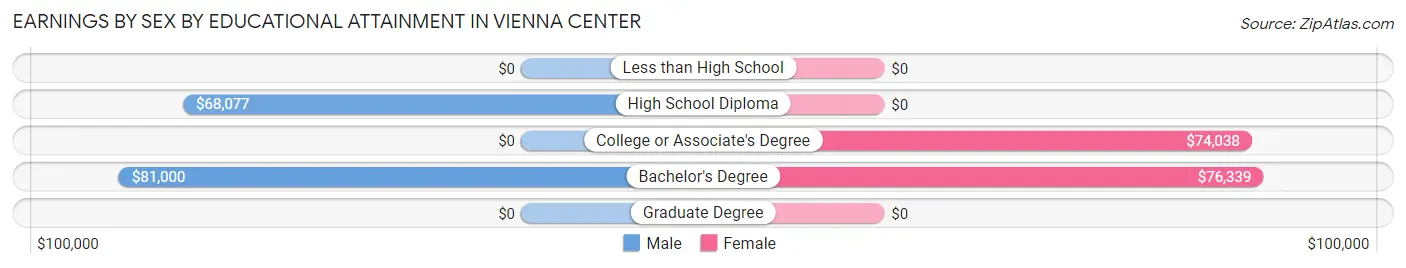
| Educational Attainment | Male Income | Female Income |
| Less than High School | - | - |
| High School Diploma | $68,077 | $0 |
| College or Associate's Degree | - | - |
| Bachelor's Degree | $81,000 | $76,339 |
| Graduate Degree | - | - |
| Total | $82,250 | $73,365 |
Family Income in Vienna Center
Family Income Brackets in Vienna Center
According to the Vienna Center family income data, there are 40 families falling into the $100,000 to $149,999 income range, which is the most common income bracket and makes up 28.0% of all families.
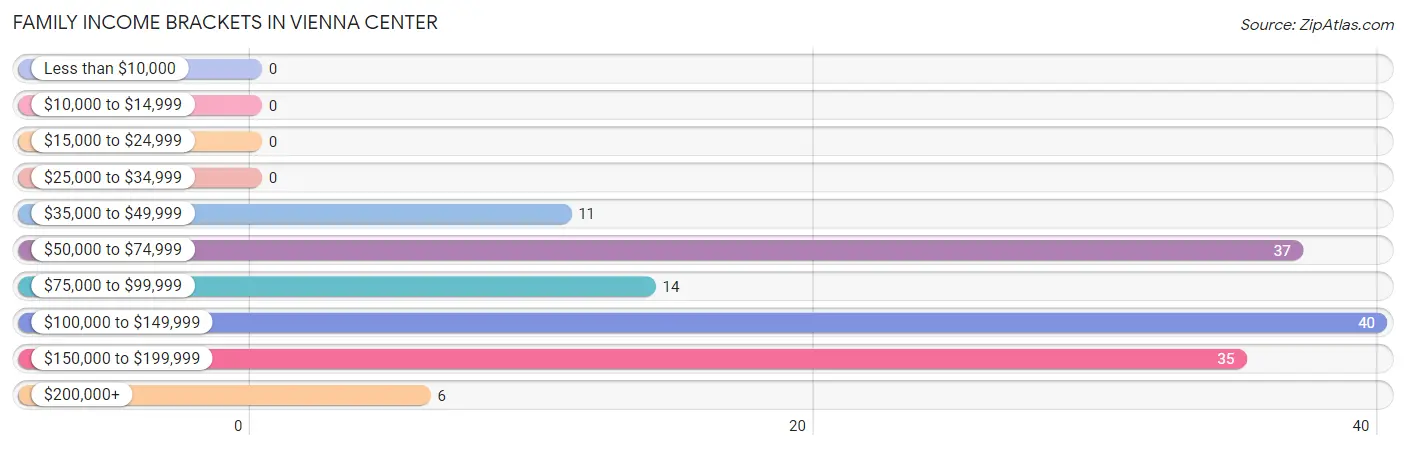
| Income Bracket | # Families | % Families |
| Less than $10,000 | 0 | 0.0% |
| $10,000 to $14,999 | 0 | 0.0% |
| $15,000 to $24,999 | 0 | 0.0% |
| $25,000 to $34,999 | 0 | 0.0% |
| $35,000 to $49,999 | 11 | 7.7% |
| $50,000 to $74,999 | 37 | 25.9% |
| $75,000 to $99,999 | 14 | 9.8% |
| $100,000 to $149,999 | 40 | 28.0% |
| $150,000 to $199,999 | 35 | 24.5% |
| $200,000+ | 6 | 4.2% |
Family Income by Famaliy Size in Vienna Center
4-person families (52 | 36.4%) account for the highest median family income in Vienna Center with $114,083 per family, while 4-person families (52 | 36.4%) have the highest median income of $28,521 per family member.
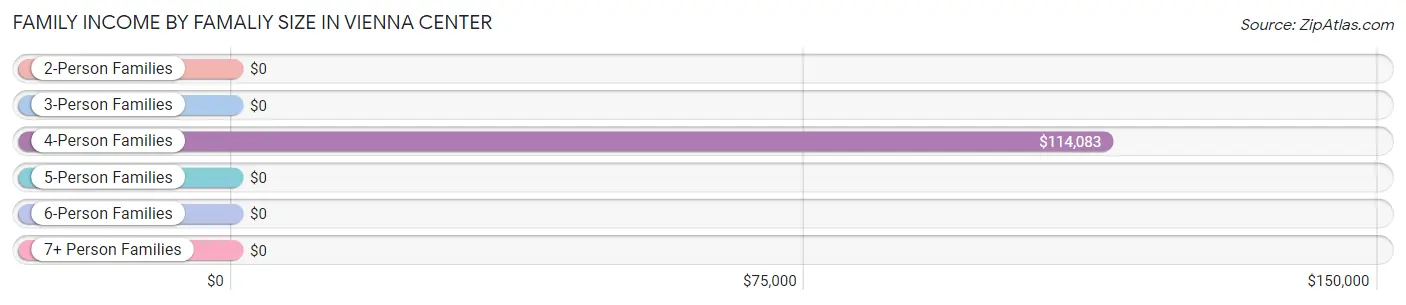
| Income Bracket | # Families | Median Income |
| 2-Person Families | 67 (46.9%) | $0 |
| 3-Person Families | 20 (14.0%) | $0 |
| 4-Person Families | 52 (36.4%) | $114,083 |
| 5-Person Families | 0 (0.0%) | $0 |
| 6-Person Families | 0 (0.0%) | $0 |
| 7+ Person Families | 4 (2.8%) | $0 |
| Total | 143 (100.0%) | $113,292 |
Family Income by Number of Earners in Vienna Center
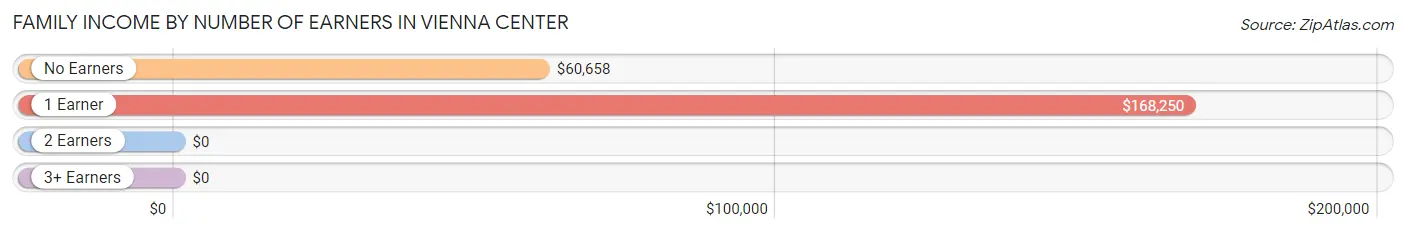
| Number of Earners | # Families | Median Income |
| No Earners | 44 (30.8%) | $60,658 |
| 1 Earner | 34 (23.8%) | $168,250 |
| 2 Earners | 26 (18.2%) | $0 |
| 3+ Earners | 39 (27.3%) | $0 |
| Total | 143 (100.0%) | $113,292 |
Household Income in Vienna Center
Household Income Brackets in Vienna Center
With 73 households falling in the category, the $35,000 to $49,999 income range is the most frequent in Vienna Center, accounting for 25.8% of all households.
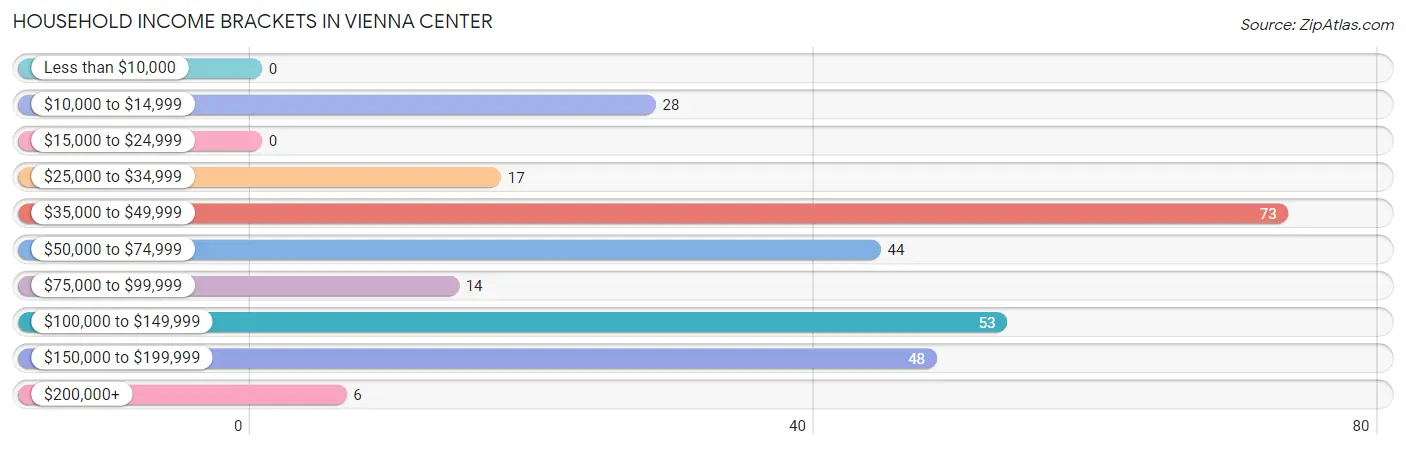
| Income Bracket | # Households | % Households |
| Less than $10,000 | 0 | 0.0% |
| $10,000 to $14,999 | 28 | 9.9% |
| $15,000 to $24,999 | 0 | 0.0% |
| $25,000 to $34,999 | 17 | 6.0% |
| $35,000 to $49,999 | 73 | 25.8% |
| $50,000 to $74,999 | 44 | 15.5% |
| $75,000 to $99,999 | 14 | 4.9% |
| $100,000 to $149,999 | 53 | 18.7% |
| $150,000 to $199,999 | 48 | 17.0% |
| $200,000+ | 6 | 2.1% |
Household Income by Householder Age in Vienna Center
The median household income in Vienna Center is $60,855, with the highest median household income of $141,708 found in the 45 to 64 years age bracket for the primary householder. A total of 97 households (34.3%) fall into this category. Meanwhile, the 15 to 24 years age bracket for the primary householder has the lowest median household income of $0, with 9 households (3.2%) in this group.
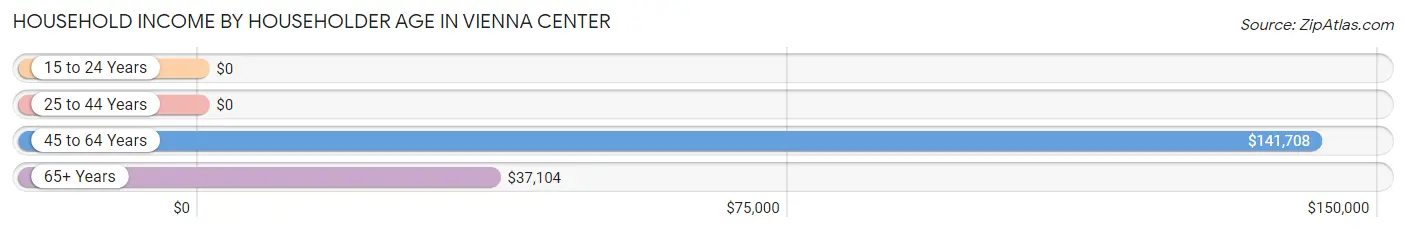
| Income Bracket | # Households | Median Income |
| 15 to 24 Years | 9 (3.2%) | $0 |
| 25 to 44 Years | 60 (21.2%) | $0 |
| 45 to 64 Years | 97 (34.3%) | $141,708 |
| 65+ Years | 117 (41.3%) | $37,104 |
| Total | 283 (100.0%) | $60,855 |
Poverty in Vienna Center
Income Below Poverty by Sex and Age in Vienna Center
With 12.0% poverty level for males and 4.7% for females among the residents of Vienna Center, 6 to 11 year old males and 5 year old females are the most vulnerable to poverty, with 4 males (100.0%) and 4 females (100.0%) in their respective age groups living below the poverty level.
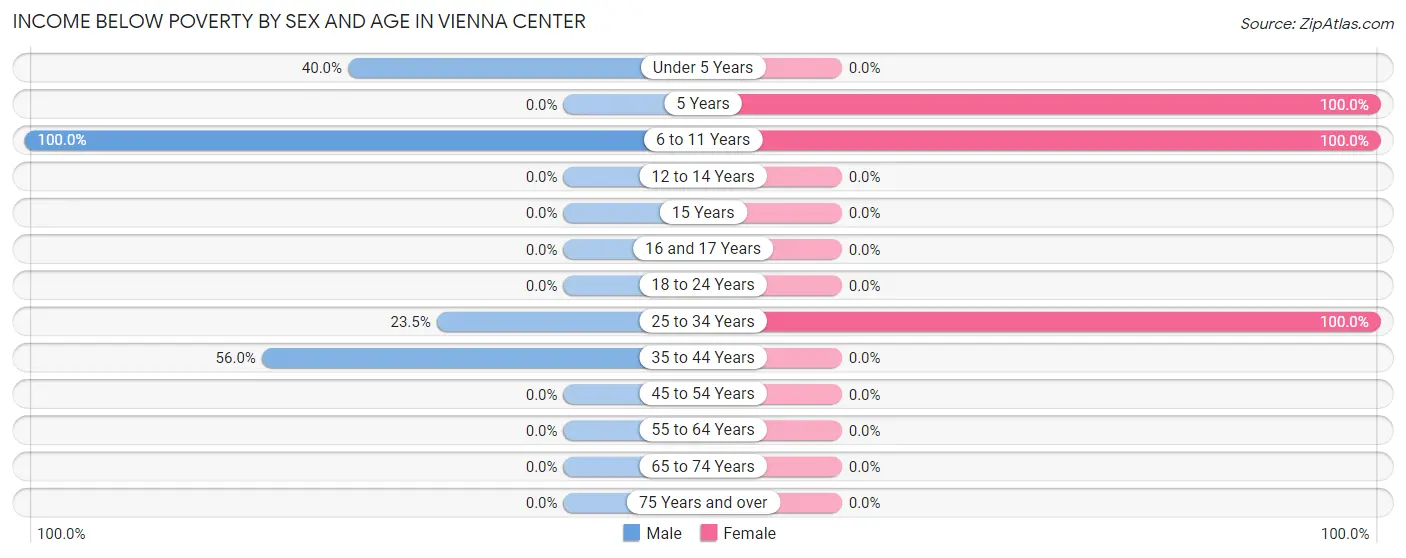
| Age Bracket | Male | Female |
| Under 5 Years | 4 (40.0%) | 0 (0.0%) |
| 5 Years | 0 (0.0%) | 4 (100.0%) |
| 6 to 11 Years | 4 (100.0%) | 8 (100.0%) |
| 12 to 14 Years | 0 (0.0%) | 0 (0.0%) |
| 15 Years | 0 (0.0%) | 0 (0.0%) |
| 16 and 17 Years | 0 (0.0%) | 0 (0.0%) |
| 18 to 24 Years | 0 (0.0%) | 0 (0.0%) |
| 25 to 34 Years | 4 (23.5%) | 3 (100.0%) |
| 35 to 44 Years | 28 (56.0%) | 0 (0.0%) |
| 45 to 54 Years | 0 (0.0%) | 0 (0.0%) |
| 55 to 64 Years | 0 (0.0%) | 0 (0.0%) |
| 65 to 74 Years | 0 (0.0%) | 0 (0.0%) |
| 75 Years and over | 0 (0.0%) | 0 (0.0%) |
| Total | 40 (12.0%) | 15 (4.7%) |
Income Above Poverty by Sex and Age in Vienna Center
According to the poverty statistics in Vienna Center, males aged 16 and 17 years and females aged 12 to 14 years are the age groups that are most secure financially, with 100.0% of males and 100.0% of females in these age groups living above the poverty line.
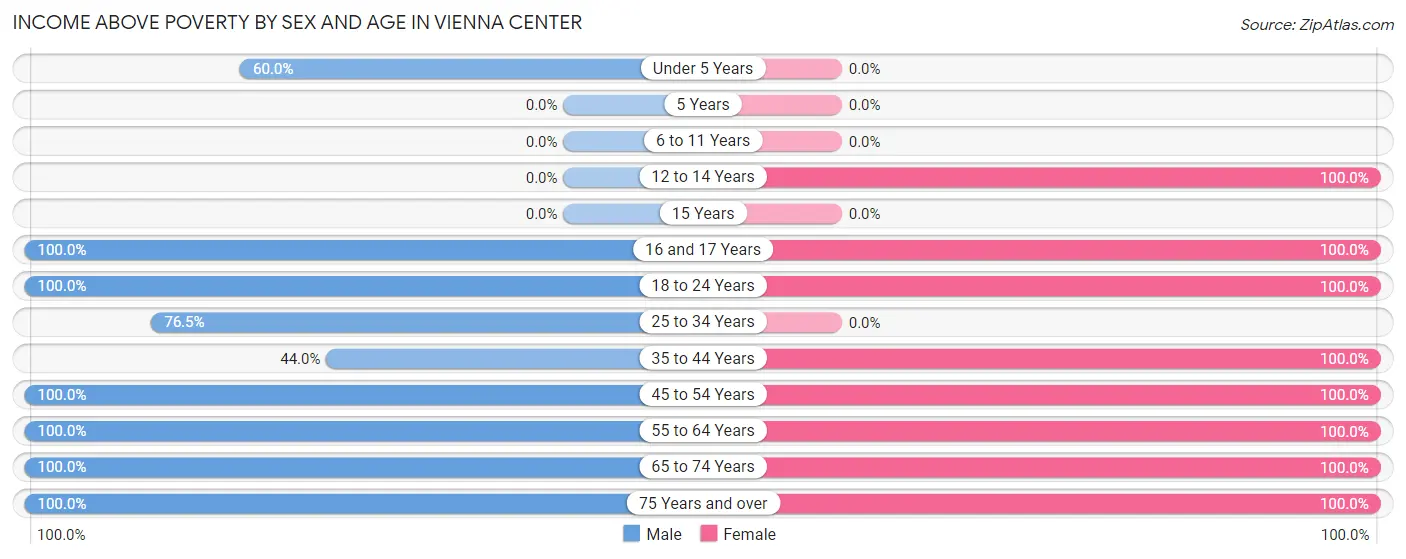
| Age Bracket | Male | Female |
| Under 5 Years | 6 (60.0%) | 0 (0.0%) |
| 5 Years | 0 (0.0%) | 0 (0.0%) |
| 6 to 11 Years | 0 (0.0%) | 0 (0.0%) |
| 12 to 14 Years | 0 (0.0%) | 13 (100.0%) |
| 15 Years | 0 (0.0%) | 0 (0.0%) |
| 16 and 17 Years | 30 (100.0%) | 9 (100.0%) |
| 18 to 24 Years | 90 (100.0%) | 31 (100.0%) |
| 25 to 34 Years | 13 (76.5%) | 0 (0.0%) |
| 35 to 44 Years | 22 (44.0%) | 20 (100.0%) |
| 45 to 54 Years | 55 (100.0%) | 68 (100.0%) |
| 55 to 64 Years | 29 (100.0%) | 41 (100.0%) |
| 65 to 74 Years | 34 (100.0%) | 103 (100.0%) |
| 75 Years and over | 15 (100.0%) | 17 (100.0%) |
| Total | 294 (88.0%) | 302 (95.3%) |
Income Below Poverty Among Married-Couple Families in Vienna Center
The poverty statistics for married-couple families in Vienna Center show that 2.8% or 4 of the total 143 families live below the poverty line. Families with 5 or more children have the highest poverty rate of 100.0%, comprising of 4 families. On the other hand, families with no children have the lowest poverty rate of 0.0%, which includes 0 families.
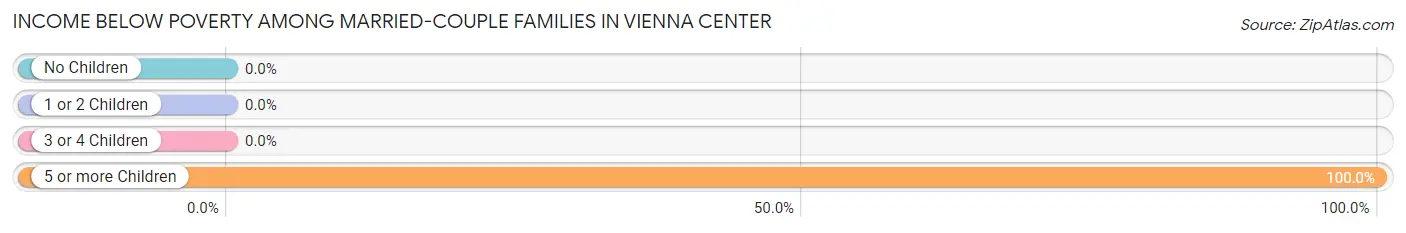
| Children | Above Poverty | Below Poverty |
| No Children | 88 (100.0%) | 0 (0.0%) |
| 1 or 2 Children | 51 (100.0%) | 0 (0.0%) |
| 3 or 4 Children | 0 (0.0%) | 0 (0.0%) |
| 5 or more Children | 0 (0.0%) | 4 (100.0%) |
| Total | 139 (97.2%) | 4 (2.8%) |
Income Below Poverty Among Single-Parent Households in Vienna Center
| Children | Single Father | Single Mother |
| No Children | 0 (0.0%) | 0 (0.0%) |
| 1 or 2 Children | 0 (0.0%) | 0 (0.0%) |
| 3 or 4 Children | 0 (0.0%) | 0 (0.0%) |
| 5 or more Children | 0 (0.0%) | 0 (0.0%) |
| Total | 0 (0.0%) | 0 (0.0%) |
Income Below Poverty Among Married-Couple vs Single-Parent Households in Vienna Center
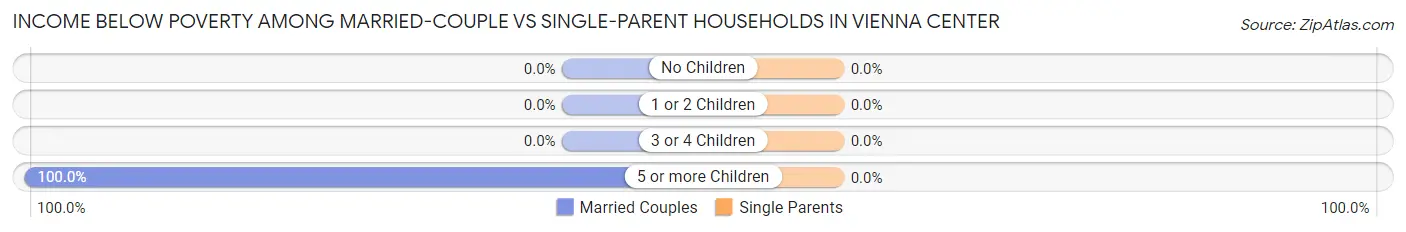
| Children | Married-Couple Families | Single-Parent Households |
| No Children | 0 (0.0%) | 0 (0.0%) |
| 1 or 2 Children | 0 (0.0%) | 0 (0.0%) |
| 3 or 4 Children | 0 (0.0%) | 0 (0.0%) |
| 5 or more Children | 4 (100.0%) | 0 (0.0%) |
| Total | 4 (2.8%) | 0 (0.0%) |
Race in Vienna Center
The most populous races in Vienna Center are White / Caucasian (629 | 96.6%), and Two or more Races (22 | 3.4%).
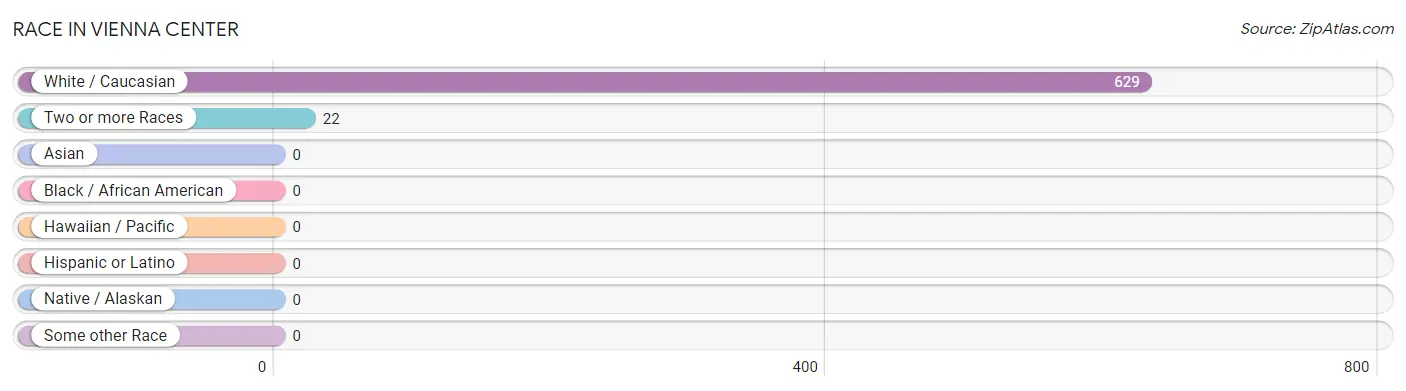
| Race | # Population | % Population |
| Asian | 0 | 0.0% |
| Black / African American | 0 | 0.0% |
| Hawaiian / Pacific | 0 | 0.0% |
| Hispanic or Latino | 0 | 0.0% |
| Native / Alaskan | 0 | 0.0% |
| White / Caucasian | 629 | 96.6% |
| Two or more Races | 22 | 3.4% |
| Some other Race | 0 | 0.0% |
| Total | 651 | 100.0% |
Ancestry in Vienna Center
The most populous ancestries reported in Vienna Center are American (129 | 19.8%), German (112 | 17.2%), English (88 | 13.5%), Irish (54 | 8.3%), and Polish (32 | 4.9%), together accounting for 63.7% of all Vienna Center residents.
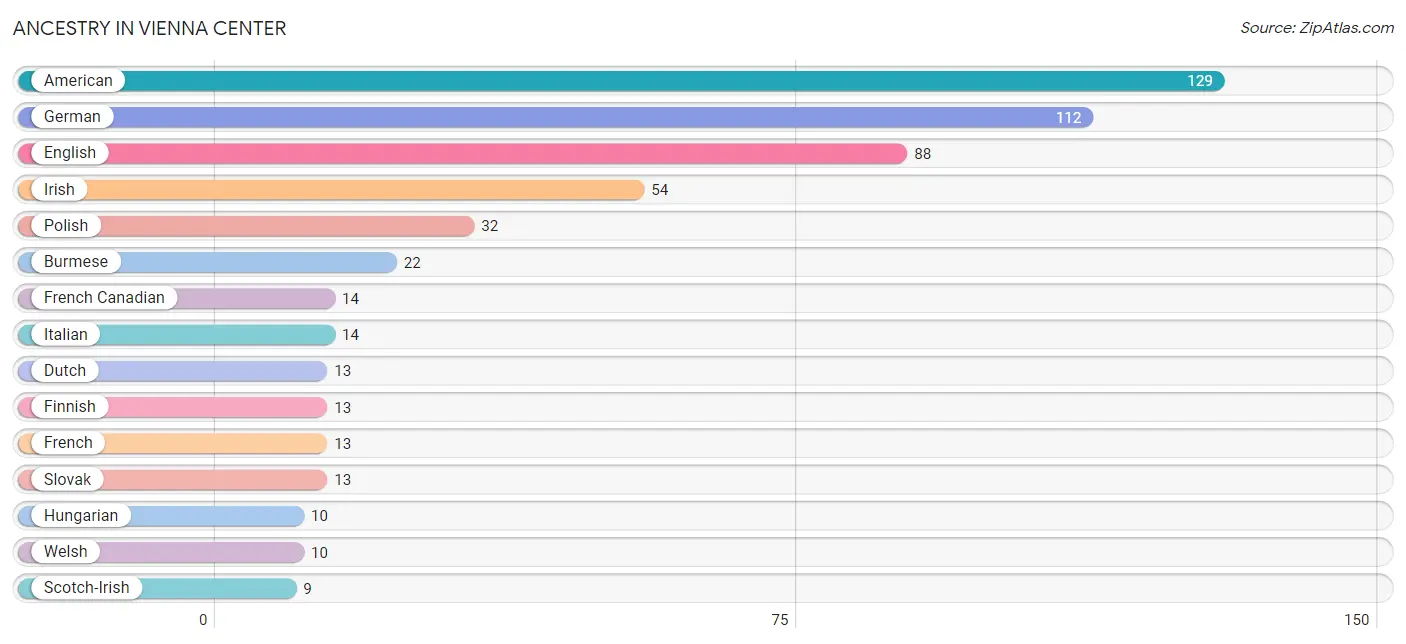
| Ancestry | # Population | % Population |
| American | 129 | 19.8% |
| Burmese | 22 | 3.4% |
| Dutch | 13 | 2.0% |
| English | 88 | 13.5% |
| Finnish | 13 | 2.0% |
| French | 13 | 2.0% |
| French Canadian | 14 | 2.1% |
| German | 112 | 17.2% |
| Hungarian | 10 | 1.5% |
| Irish | 54 | 8.3% |
| Italian | 14 | 2.1% |
| Polish | 32 | 4.9% |
| Scotch-Irish | 9 | 1.4% |
| Slovak | 13 | 2.0% |
| Welsh | 10 | 1.5% | View All 15 Rows |
Immigrants in Vienna Center
The most numerous immigrant groups reported in Vienna Center came from Europe (7 | 1.1%), Germany (7 | 1.1%), and Western Europe (7 | 1.1%), together accounting for 3.2% of all Vienna Center residents.
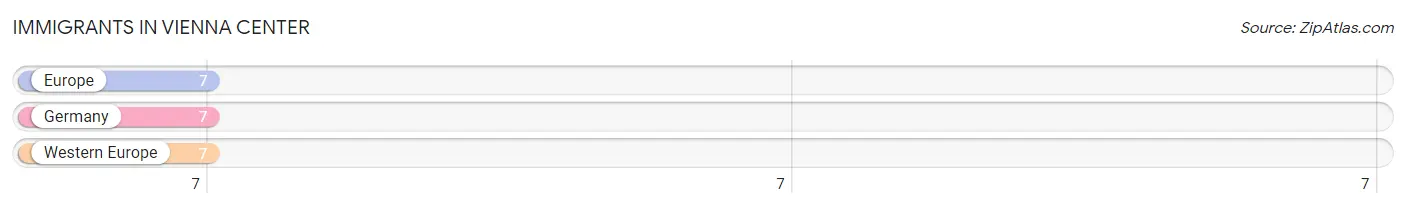
| Immigration Origin | # Population | % Population |
| Europe | 7 | 1.1% |
| Germany | 7 | 1.1% |
| Western Europe | 7 | 1.1% | View All 3 Rows |
Sex and Age in Vienna Center
Sex and Age in Vienna Center
The most populous age groups in Vienna Center are 20 to 24 Years (80 | 23.9%) for men and 65 to 69 Years (70 | 22.1%) for women.
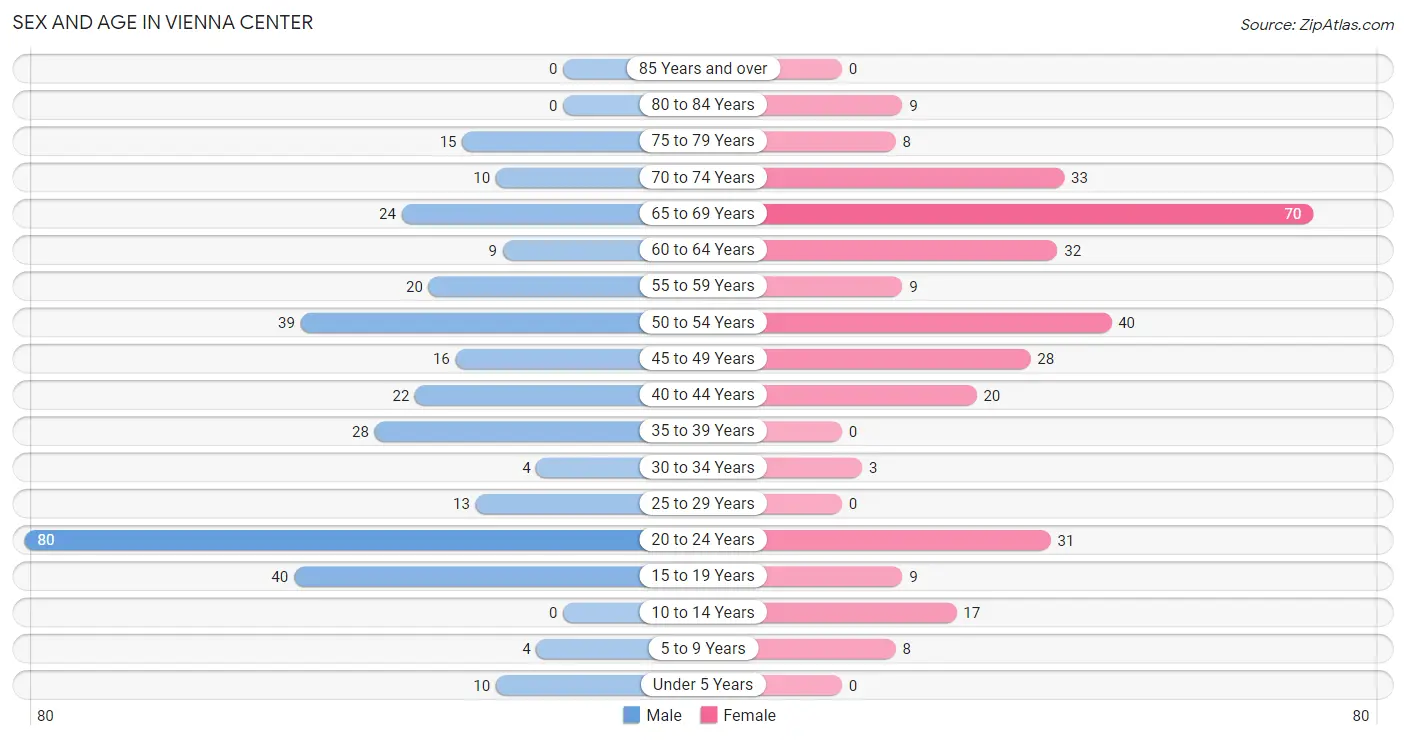
| Age Bracket | Male | Female |
| Under 5 Years | 10 (3.0%) | 0 (0.0%) |
| 5 to 9 Years | 4 (1.2%) | 8 (2.5%) |
| 10 to 14 Years | 0 (0.0%) | 17 (5.4%) |
| 15 to 19 Years | 40 (12.0%) | 9 (2.8%) |
| 20 to 24 Years | 80 (23.9%) | 31 (9.8%) |
| 25 to 29 Years | 13 (3.9%) | 0 (0.0%) |
| 30 to 34 Years | 4 (1.2%) | 3 (0.9%) |
| 35 to 39 Years | 28 (8.4%) | 0 (0.0%) |
| 40 to 44 Years | 22 (6.6%) | 20 (6.3%) |
| 45 to 49 Years | 16 (4.8%) | 28 (8.8%) |
| 50 to 54 Years | 39 (11.7%) | 40 (12.6%) |
| 55 to 59 Years | 20 (6.0%) | 9 (2.8%) |
| 60 to 64 Years | 9 (2.7%) | 32 (10.1%) |
| 65 to 69 Years | 24 (7.2%) | 70 (22.1%) |
| 70 to 74 Years | 10 (3.0%) | 33 (10.4%) |
| 75 to 79 Years | 15 (4.5%) | 8 (2.5%) |
| 80 to 84 Years | 0 (0.0%) | 9 (2.8%) |
| 85 Years and over | 0 (0.0%) | 0 (0.0%) |
| Total | 334 (100.0%) | 317 (100.0%) |
Families and Households in Vienna Center
Median Family Size in Vienna Center
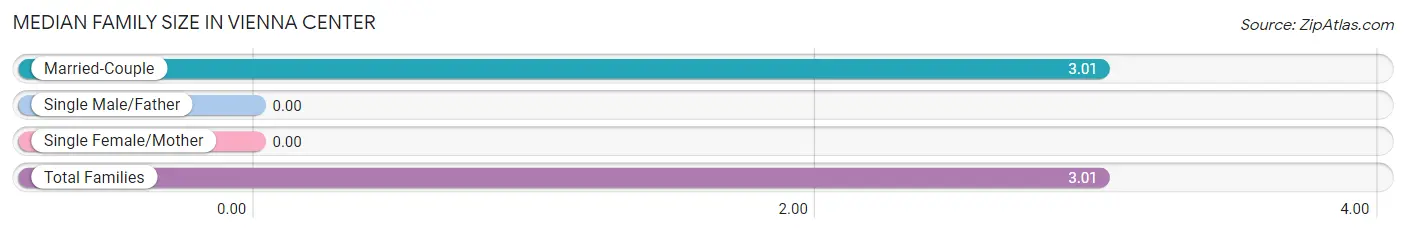
| Family Type | # Families | Family Size |
| Married-Couple | 143 (100.0%) | 3.01 |
| Single Male/Father | 0 (0.0%) | - |
| Single Female/Mother | 0 (0.0%) | - |
| Total Families | 143 (100.0%) | 3.01 |
Median Household Size in Vienna Center
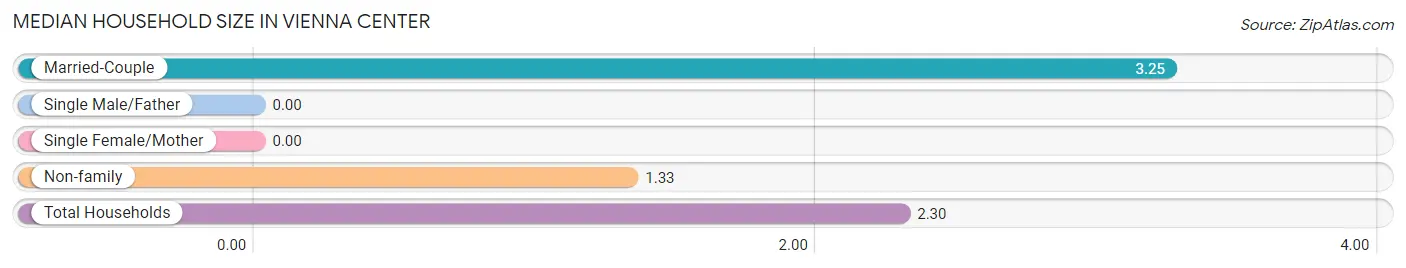
| Household Type | # Households | Household Size |
| Married-Couple | 143 (50.5%) | 3.25 |
| Single Male/Father | 0 (0.0%) | - |
| Single Female/Mother | 0 (0.0%) | - |
| Non-family | 140 (49.5%) | 1.33 |
| Total Households | 283 (100.0%) | 2.30 |
Household Size by Marriage Status in Vienna Center
Out of a total of 283 households in Vienna Center, 143 (50.5%) are family households, while 140 (49.5%) are nonfamily households. The most numerous type of family households are 2-person households, comprising 67, and the most common type of nonfamily households are 1-person households, comprising 105.
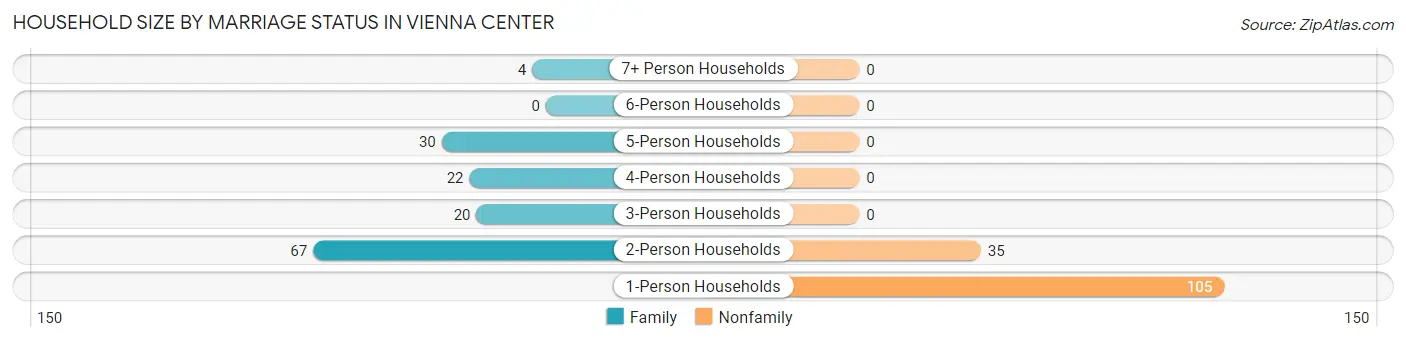
| Household Size | Family Households | Nonfamily Households |
| 1-Person Households | - | 105 (37.1%) |
| 2-Person Households | 67 (23.7%) | 35 (12.4%) |
| 3-Person Households | 20 (7.1%) | 0 (0.0%) |
| 4-Person Households | 22 (7.8%) | 0 (0.0%) |
| 5-Person Households | 30 (10.6%) | 0 (0.0%) |
| 6-Person Households | 0 (0.0%) | 0 (0.0%) |
| 7+ Person Households | 4 (1.4%) | 0 (0.0%) |
| Total | 143 (50.5%) | 140 (49.5%) |
Female Fertility in Vienna Center
Fertility by Age in Vienna Center
Average fertility rate in Vienna Center is 66.0 births per 1,000 women. Women in the age bracket of 35 to 50 years have the highest fertility rate with 125.0 births per 1,000 women. Women in the age bracket of 35 to 50 years acount for 100.0% of all women with births.
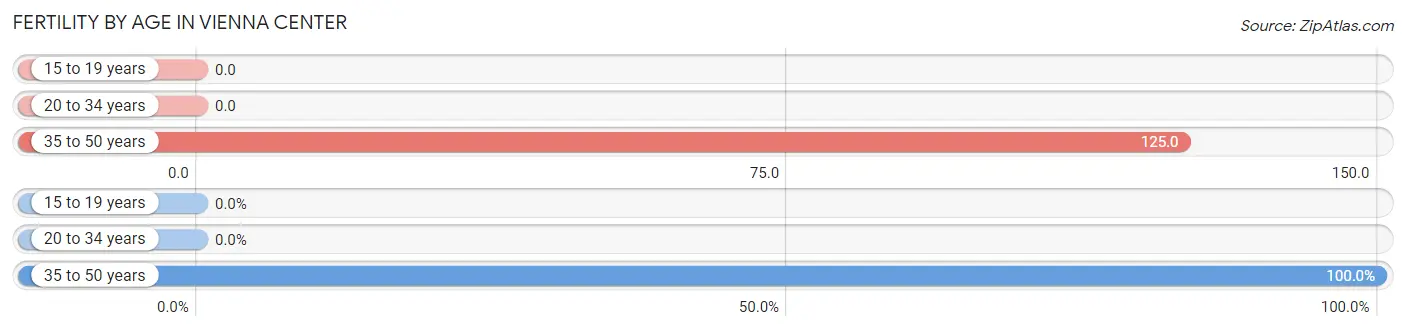
| Age Bracket | Women with Births | Births / 1,000 Women |
| 15 to 19 years | 0 (0.0%) | 0.0 |
| 20 to 34 years | 0 (0.0%) | 0.0 |
| 35 to 50 years | 6 (100.0%) | 125.0 |
| Total | 6 (100.0%) | 66.0 |
Fertility by Age by Marriage Status in Vienna Center
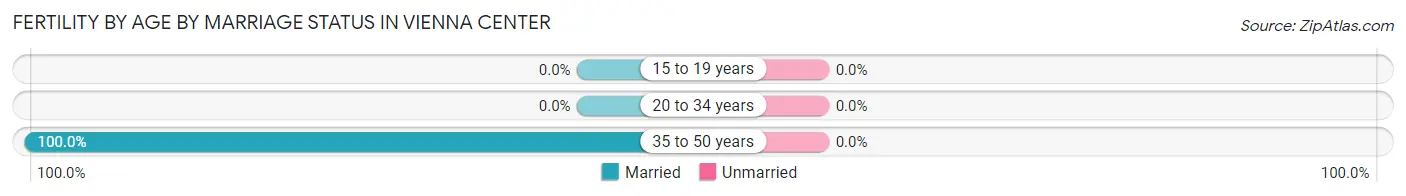
| Age Bracket | Married | Unmarried |
| 15 to 19 years | 0 (0.0%) | 0 (0.0%) |
| 20 to 34 years | 0 (0.0%) | 0 (0.0%) |
| 35 to 50 years | 6 (100.0%) | 0 (0.0%) |
| Total | 6 (100.0%) | 0 (0.0%) |
Fertility by Education in Vienna Center
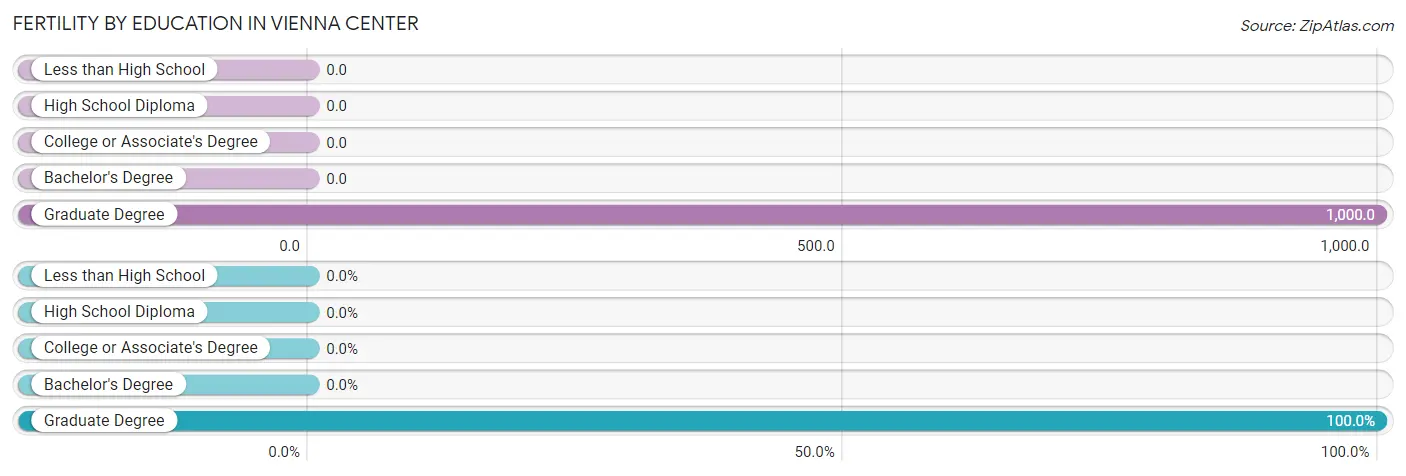
| Educational Attainment | Women with Births | Births / 1,000 Women |
| Less than High School | 0 (0.0%) | 0.0 |
| High School Diploma | 0 (0.0%) | 0.0 |
| College or Associate's Degree | 0 (0.0%) | 0.0 |
| Bachelor's Degree | 0 (0.0%) | 0.0 |
| Graduate Degree | 6 (100.0%) | 1,000.0 |
| Total | 6 (100.0%) | 66.0 |
Fertility by Education by Marriage Status in Vienna Center
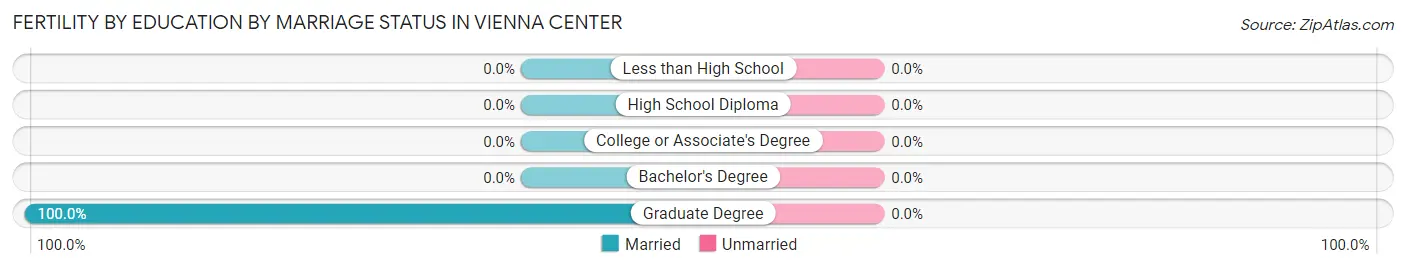
| Educational Attainment | Married | Unmarried |
| Less than High School | 0 (0.0%) | 0 (0.0%) |
| High School Diploma | 0 (0.0%) | 0 (0.0%) |
| College or Associate's Degree | 0 (0.0%) | 0 (0.0%) |
| Bachelor's Degree | 0 (0.0%) | 0 (0.0%) |
| Graduate Degree | 6 (100.0%) | 0 (0.0%) |
| Total | 6 (100.0%) | 0 (0.0%) |
Employment Characteristics in Vienna Center
Employment by Class of Employer in Vienna Center
Among the 319 employed individuals in Vienna Center, private company employees (246 | 77.1%), state government employees (29 | 9.1%), and not-for-profit organizations (25 | 7.8%) make up the most common classes of employment.
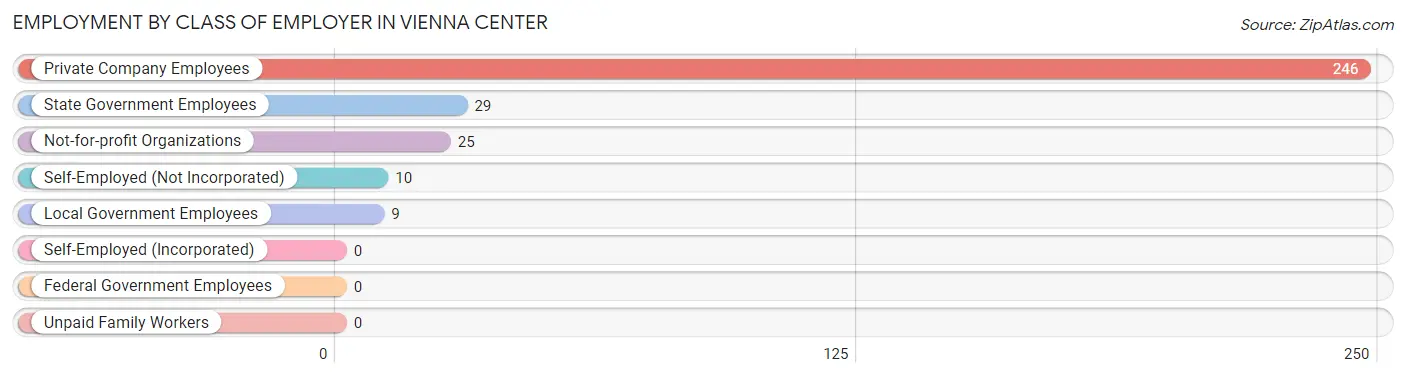
| Employer Class | # Employees | % Employees |
| Private Company Employees | 246 | 77.1% |
| Self-Employed (Incorporated) | 0 | 0.0% |
| Self-Employed (Not Incorporated) | 10 | 3.1% |
| Not-for-profit Organizations | 25 | 7.8% |
| Local Government Employees | 9 | 2.8% |
| State Government Employees | 29 | 9.1% |
| Federal Government Employees | 0 | 0.0% |
| Unpaid Family Workers | 0 | 0.0% |
| Total | 319 | 100.0% |
Employment Status by Age in Vienna Center
According to the labor force statistics for Vienna Center, out of the total population over 16 years of age (612), 57.5% or 352 individuals are in the labor force, with 8.5% or 30 of them unemployed. The age group with the highest labor force participation rate is 16 to 19 years, with 100.0% or 49 individuals in the labor force. Within the labor force, the 45 to 54 years age range has the highest percentage of unemployed individuals, with 30.9% or 30 of them being unemployed.
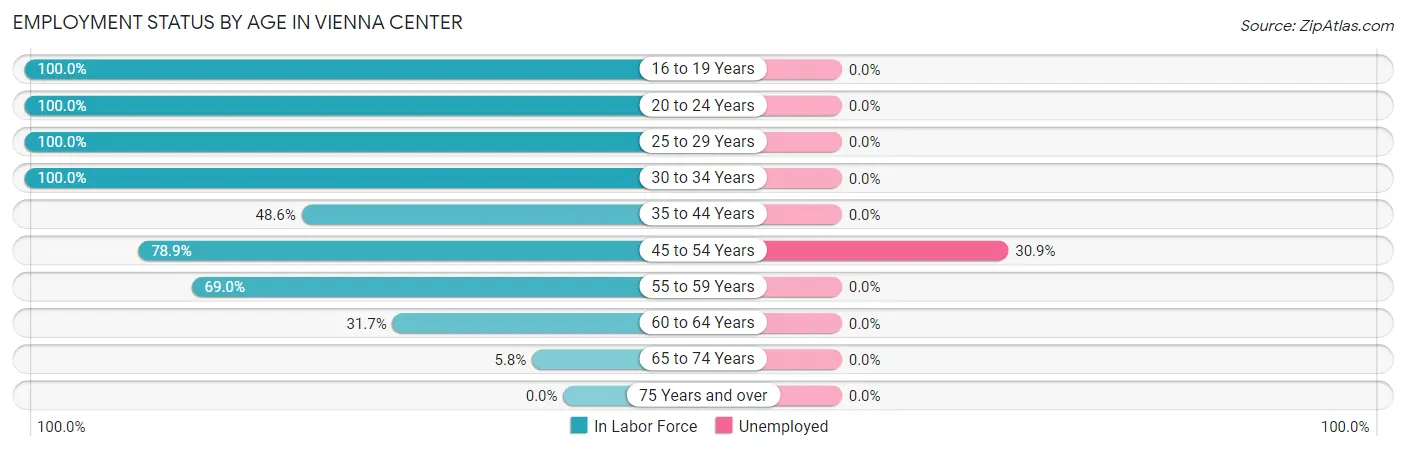
| Age Bracket | In Labor Force | Unemployed |
| 16 to 19 Years | 49 (100.0%) | 0 (0.0%) |
| 20 to 24 Years | 111 (100.0%) | 0 (0.0%) |
| 25 to 29 Years | 13 (100.0%) | 0 (0.0%) |
| 30 to 34 Years | 7 (100.0%) | 0 (0.0%) |
| 35 to 44 Years | 34 (48.6%) | 0 (0.0%) |
| 45 to 54 Years | 97 (78.9%) | 30 (30.9%) |
| 55 to 59 Years | 20 (69.0%) | 0 (0.0%) |
| 60 to 64 Years | 13 (31.7%) | 0 (0.0%) |
| 65 to 74 Years | 8 (5.8%) | 0 (0.0%) |
| 75 Years and over | 0 (0.0%) | 0 (0.0%) |
| Total | 352 (57.5%) | 30 (8.5%) |
Employment Status by Educational Attainment in Vienna Center
According to labor force statistics for Vienna Center, 65.0% of individuals (184) out of the total population between 25 and 64 years of age (283) are in the labor force, with 16.3% or 30 of them being unemployed. The group with the highest labor force participation rate are those with the educational attainment of bachelor's degree or higher, with 80.4% or 82 individuals in the labor force. Within the labor force, individuals with high school diploma education have the highest percentage of unemployment, with 39.5% or 30 of them being unemployed.
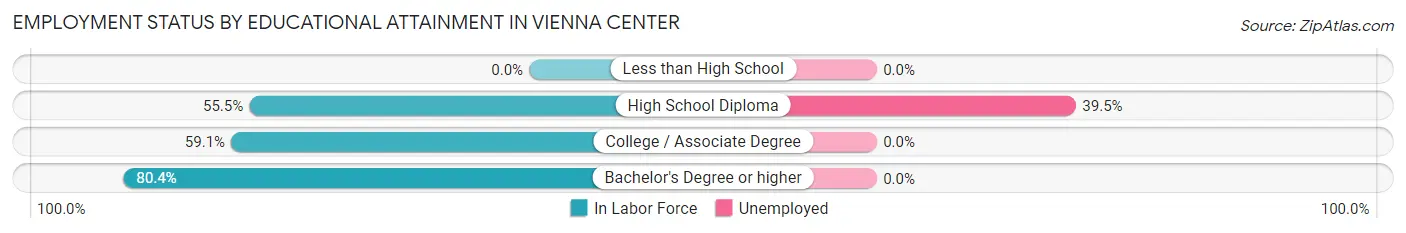
| Educational Attainment | In Labor Force | Unemployed |
| Less than High School | 0 (0.0%) | 0 (0.0%) |
| High School Diploma | 76 (55.5%) | 54 (39.5%) |
| College / Associate Degree | 26 (59.1%) | 0 (0.0%) |
| Bachelor's Degree or higher | 82 (80.4%) | 0 (0.0%) |
| Total | 184 (65.0%) | 46 (16.3%) |
Employment Occupations by Sex in Vienna Center
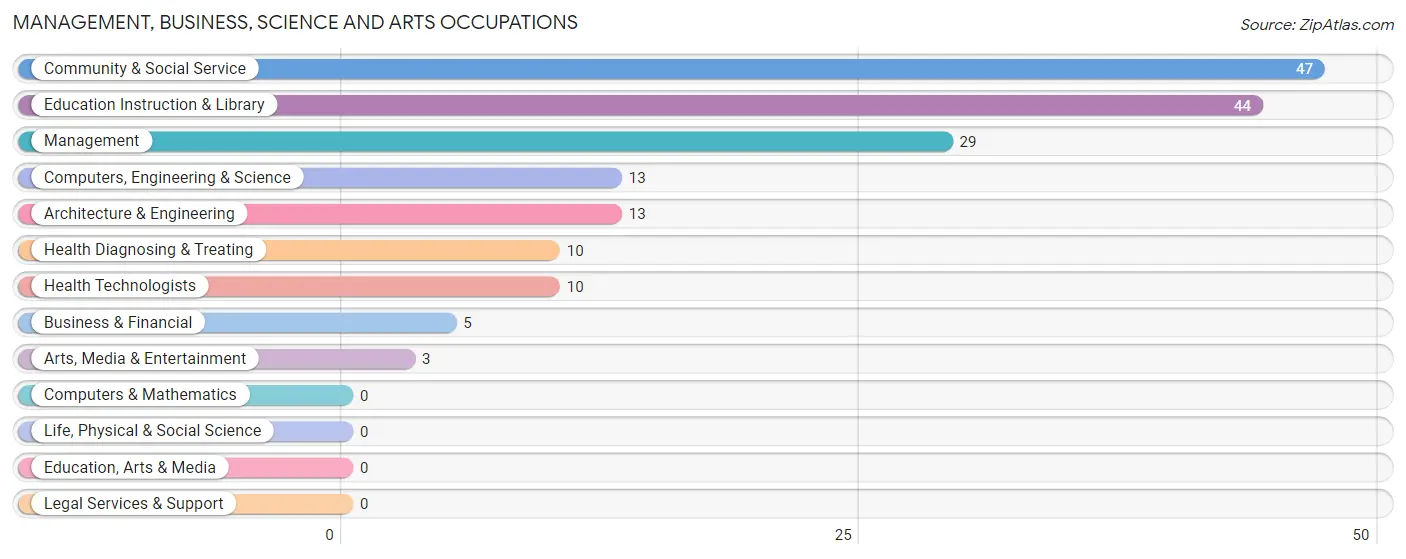
Management, Business, Science and Arts Occupations
The most common Management, Business, Science and Arts occupations in Vienna Center are Community & Social Service (47 | 14.6%), Education Instruction & Library (44 | 13.7%), Management (29 | 9.0%), Computers, Engineering & Science (13 | 4.0%), and Architecture & Engineering (13 | 4.0%).
Management, Business, Science and Arts Occupations by Sex
Within the Management, Business, Science and Arts occupations in Vienna Center, the most male-oriented occupations are Business & Financial (100.0%), Health Diagnosing & Treating (100.0%), and Health Technologists (100.0%), while the most female-oriented occupations are Computers, Engineering & Science (100.0%), Architecture & Engineering (100.0%), and Arts, Media & Entertainment (100.0%).
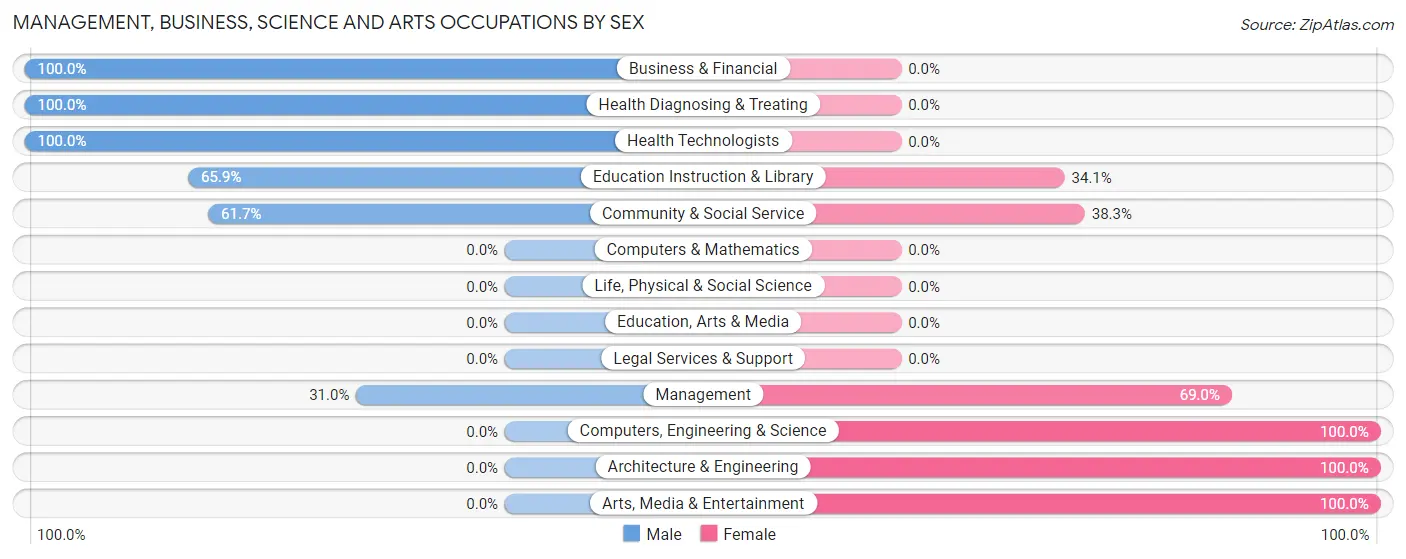
| Occupation | Male | Female |
| Management | 9 (31.0%) | 20 (69.0%) |
| Business & Financial | 5 (100.0%) | 0 (0.0%) |
| Computers, Engineering & Science | 0 (0.0%) | 13 (100.0%) |
| Computers & Mathematics | 0 (0.0%) | 0 (0.0%) |
| Architecture & Engineering | 0 (0.0%) | 13 (100.0%) |
| Life, Physical & Social Science | 0 (0.0%) | 0 (0.0%) |
| Community & Social Service | 29 (61.7%) | 18 (38.3%) |
| Education, Arts & Media | 0 (0.0%) | 0 (0.0%) |
| Legal Services & Support | 0 (0.0%) | 0 (0.0%) |
| Education Instruction & Library | 29 (65.9%) | 15 (34.1%) |
| Arts, Media & Entertainment | 0 (0.0%) | 3 (100.0%) |
| Health Diagnosing & Treating | 10 (100.0%) | 0 (0.0%) |
| Health Technologists | 10 (100.0%) | 0 (0.0%) |
| Total (Category) | 53 (51.0%) | 51 (49.0%) |
| Total (Overall) | 210 (65.2%) | 112 (34.8%) |
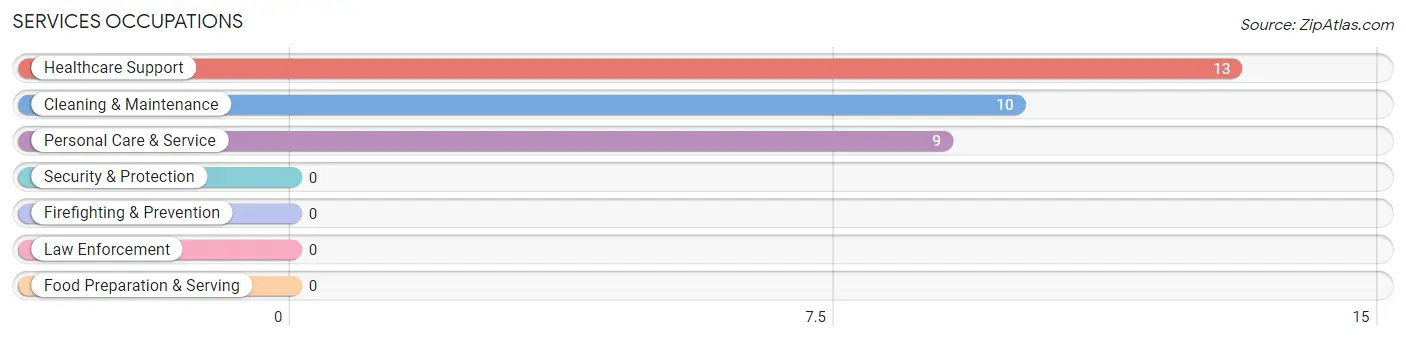
Services Occupations
The most common Services occupations in Vienna Center are Healthcare Support (13 | 4.0%), Cleaning & Maintenance (10 | 3.1%), and Personal Care & Service (9 | 2.8%).
Services Occupations by Sex
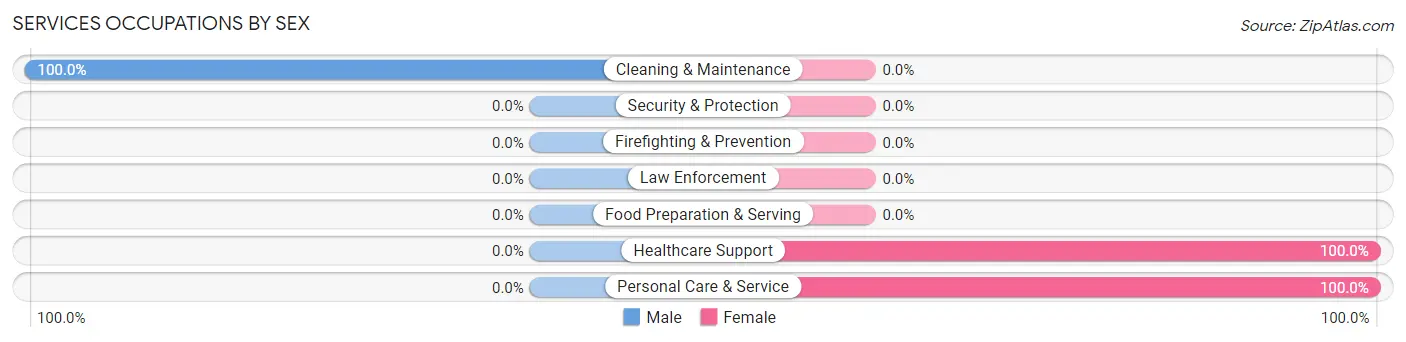
| Occupation | Male | Female |
| Healthcare Support | 0 (0.0%) | 13 (100.0%) |
| Security & Protection | 0 (0.0%) | 0 (0.0%) |
| Firefighting & Prevention | 0 (0.0%) | 0 (0.0%) |
| Law Enforcement | 0 (0.0%) | 0 (0.0%) |
| Food Preparation & Serving | 0 (0.0%) | 0 (0.0%) |
| Cleaning & Maintenance | 10 (100.0%) | 0 (0.0%) |
| Personal Care & Service | 0 (0.0%) | 9 (100.0%) |
| Total (Category) | 10 (31.2%) | 22 (68.8%) |
| Total (Overall) | 210 (65.2%) | 112 (34.8%) |
Sales and Office Occupations
The most common Sales and Office occupations in Vienna Center are Office & Administration (17 | 5.3%), and Sales & Related (10 | 3.1%).
Sales and Office Occupations by Sex
| Occupation | Male | Female |
| Sales & Related | 10 (100.0%) | 0 (0.0%) |
| Office & Administration | 0 (0.0%) | 17 (100.0%) |
| Total (Category) | 10 (37.0%) | 17 (63.0%) |
| Total (Overall) | 210 (65.2%) | 112 (34.8%) |
Natural Resources, Construction and Maintenance Occupations
The most common Natural Resources, Construction and Maintenance occupations in Vienna Center are Installation, Maintenance & Repair (48 | 14.9%), and Construction & Extraction (10 | 3.1%).
Natural Resources, Construction and Maintenance Occupations by Sex
| Occupation | Male | Female |
| Farming, Fishing & Forestry | 0 (0.0%) | 0 (0.0%) |
| Construction & Extraction | 10 (100.0%) | 0 (0.0%) |
| Installation, Maintenance & Repair | 48 (100.0%) | 0 (0.0%) |
| Total (Category) | 58 (100.0%) | 0 (0.0%) |
| Total (Overall) | 210 (65.2%) | 112 (34.8%) |
Production, Transportation and Moving Occupations
The most common Production, Transportation and Moving occupations in Vienna Center are , and Material Moving (101 | 31.4%).
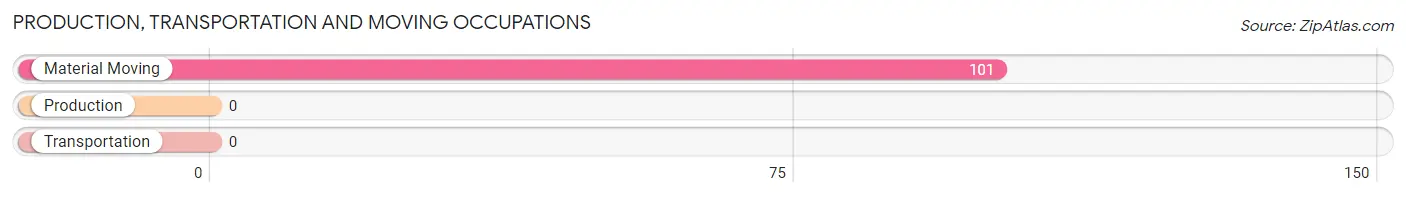
Production, Transportation and Moving Occupations by Sex
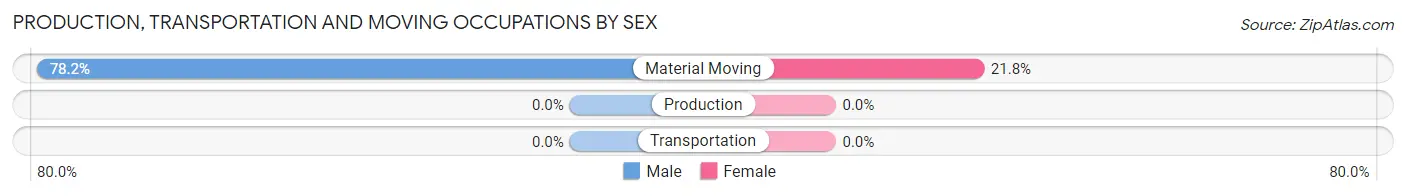
| Occupation | Male | Female |
| Production | 0 (0.0%) | 0 (0.0%) |
| Transportation | 0 (0.0%) | 0 (0.0%) |
| Material Moving | 79 (78.2%) | 22 (21.8%) |
| Total (Category) | 79 (78.2%) | 22 (21.8%) |
| Total (Overall) | 210 (65.2%) | 112 (34.8%) |
Employment Industries by Sex in Vienna Center
Employment Industries in Vienna Center
The major employment industries in Vienna Center include Retail Trade (107 | 33.2%), Educational Services (53 | 16.5%), Health Care & Social Assistance (46 | 14.3%), Transportation & Warehousing (35 | 10.9%), and Manufacturing (30 | 9.3%).
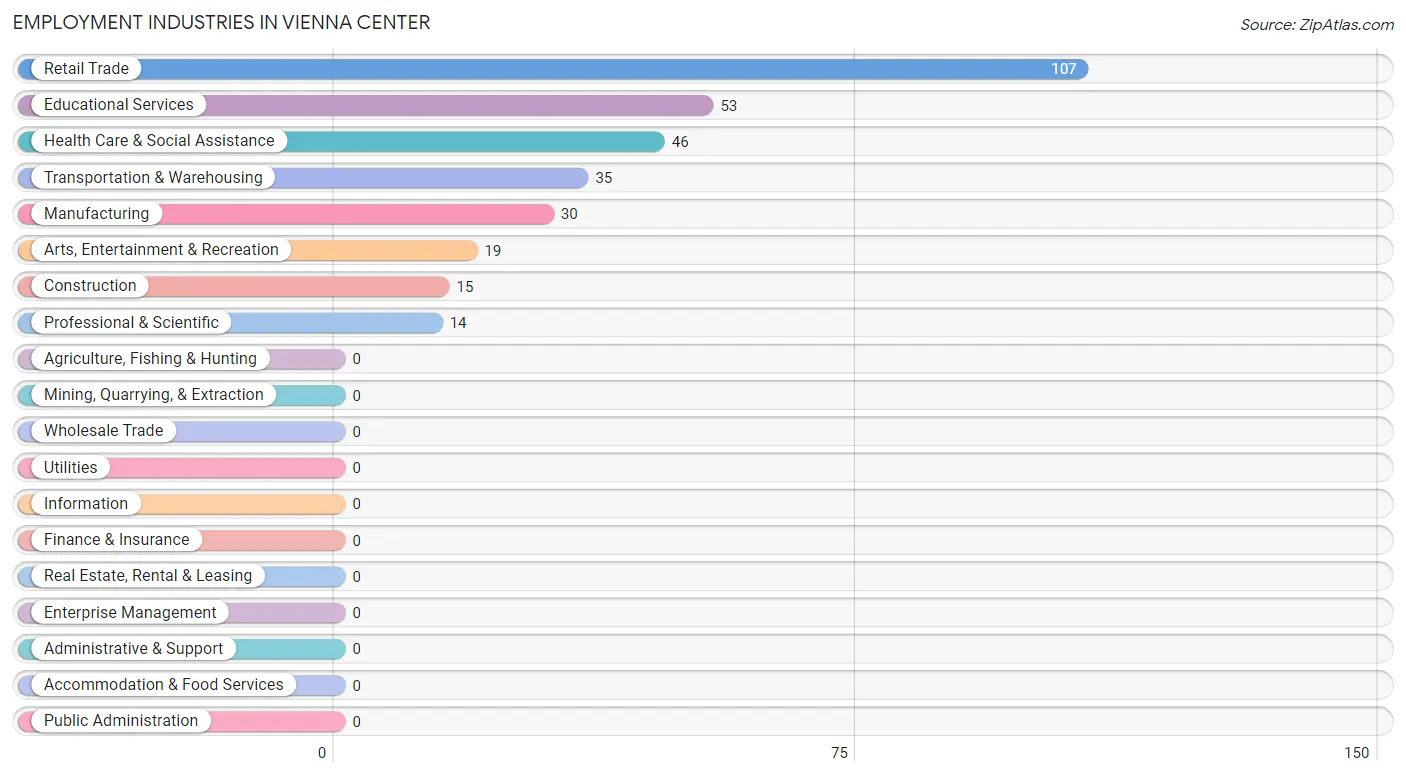
Employment Industries by Sex in Vienna Center
The Vienna Center industries that see more men than women are Construction (100.0%), Transportation & Warehousing (100.0%), and Retail Trade (79.4%), whereas the industries that tend to have a higher number of women are Professional & Scientific (100.0%), Health Care & Social Assistance (58.7%), and Arts, Entertainment & Recreation (47.4%).
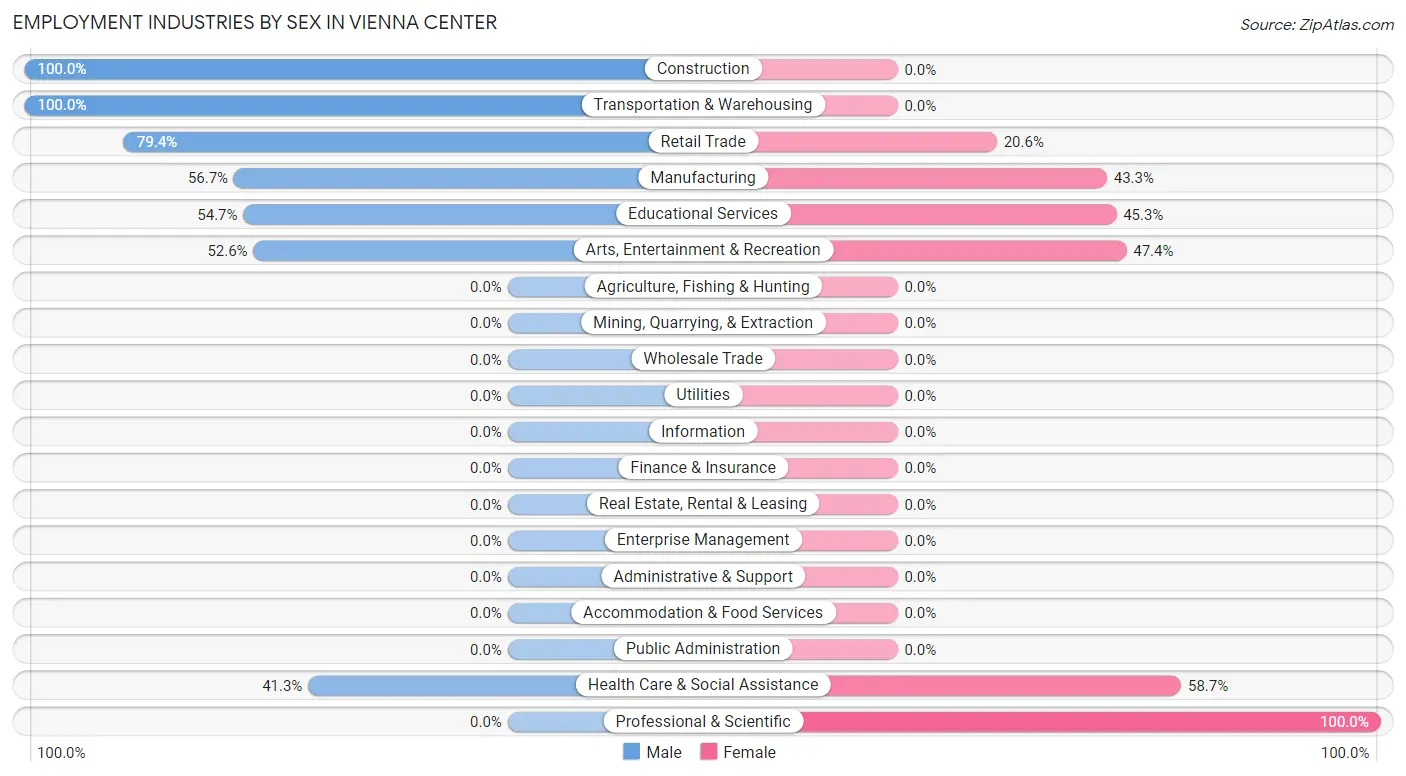
| Industry | Male | Female |
| Agriculture, Fishing & Hunting | 0 (0.0%) | 0 (0.0%) |
| Mining, Quarrying, & Extraction | 0 (0.0%) | 0 (0.0%) |
| Construction | 15 (100.0%) | 0 (0.0%) |
| Manufacturing | 17 (56.7%) | 13 (43.3%) |
| Wholesale Trade | 0 (0.0%) | 0 (0.0%) |
| Retail Trade | 85 (79.4%) | 22 (20.6%) |
| Transportation & Warehousing | 35 (100.0%) | 0 (0.0%) |
| Utilities | 0 (0.0%) | 0 (0.0%) |
| Information | 0 (0.0%) | 0 (0.0%) |
| Finance & Insurance | 0 (0.0%) | 0 (0.0%) |
| Real Estate, Rental & Leasing | 0 (0.0%) | 0 (0.0%) |
| Professional & Scientific | 0 (0.0%) | 14 (100.0%) |
| Enterprise Management | 0 (0.0%) | 0 (0.0%) |
| Administrative & Support | 0 (0.0%) | 0 (0.0%) |
| Educational Services | 29 (54.7%) | 24 (45.3%) |
| Health Care & Social Assistance | 19 (41.3%) | 27 (58.7%) |
| Arts, Entertainment & Recreation | 10 (52.6%) | 9 (47.4%) |
| Accommodation & Food Services | 0 (0.0%) | 0 (0.0%) |
| Public Administration | 0 (0.0%) | 0 (0.0%) |
| Total | 210 (65.2%) | 112 (34.8%) |
Education in Vienna Center
School Enrollment in Vienna Center
The most common levels of schooling among the 138 students in Vienna Center are high school (74 | 53.6%), college / undergraduate (35 | 25.4%), and middle school (17 | 12.3%).
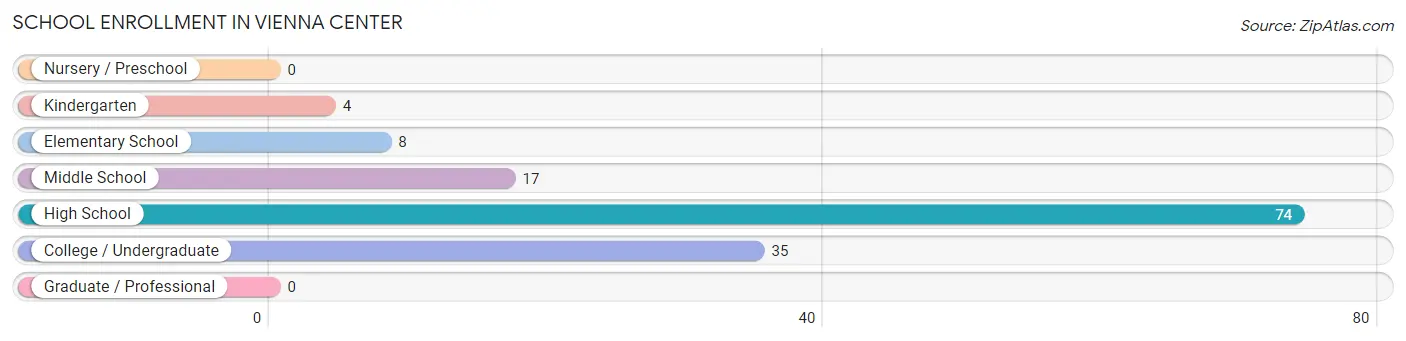
| School Level | # Students | % Students |
| Nursery / Preschool | 0 | 0.0% |
| Kindergarten | 4 | 2.9% |
| Elementary School | 8 | 5.8% |
| Middle School | 17 | 12.3% |
| High School | 74 | 53.6% |
| College / Undergraduate | 35 | 25.4% |
| Graduate / Professional | 0 | 0.0% |
| Total | 138 | 100.0% |
School Enrollment by Age by Funding Source in Vienna Center
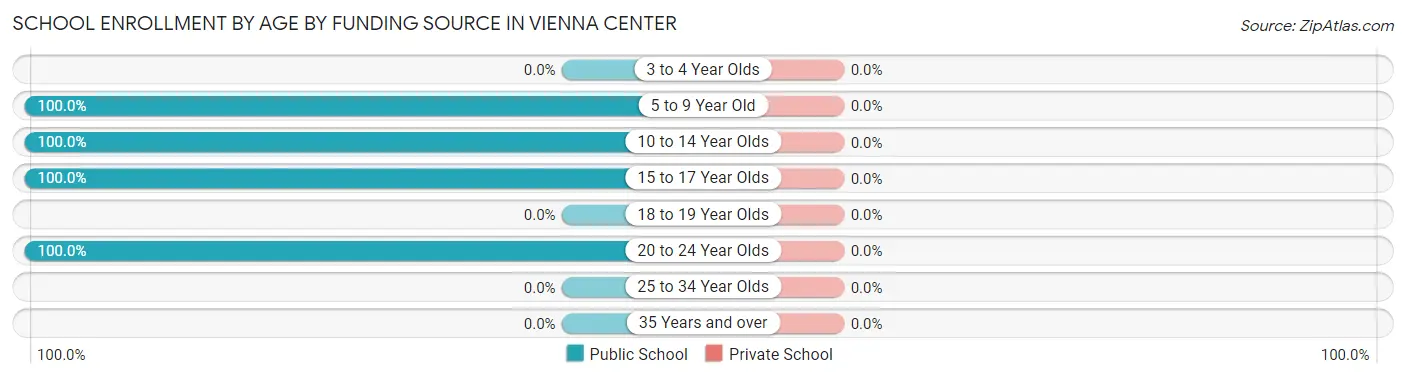
| Age Bracket | Public School | Private School |
| 3 to 4 Year Olds | 0 (0.0%) | 0 (0.0%) |
| 5 to 9 Year Old | 12 (100.0%) | 0 (0.0%) |
| 10 to 14 Year Olds | 17 (100.0%) | 0 (0.0%) |
| 15 to 17 Year Olds | 39 (100.0%) | 0 (0.0%) |
| 18 to 19 Year Olds | 0 (0.0%) | 0 (0.0%) |
| 20 to 24 Year Olds | 70 (100.0%) | 0 (0.0%) |
| 25 to 34 Year Olds | 0 (0.0%) | 0 (0.0%) |
| 35 Years and over | 0 (0.0%) | 0 (0.0%) |
| Total | 138 (100.0%) | 0 (0.0%) |
Educational Attainment by Field of Study in Vienna Center
Engineering (53 | 31.0%), arts & humanities (29 | 17.0%), science & technology (20 | 11.7%), business (19 | 11.1%), and psychology (17 | 9.9%) are the most common fields of study among 171 individuals in Vienna Center who have obtained a bachelor's degree or higher.
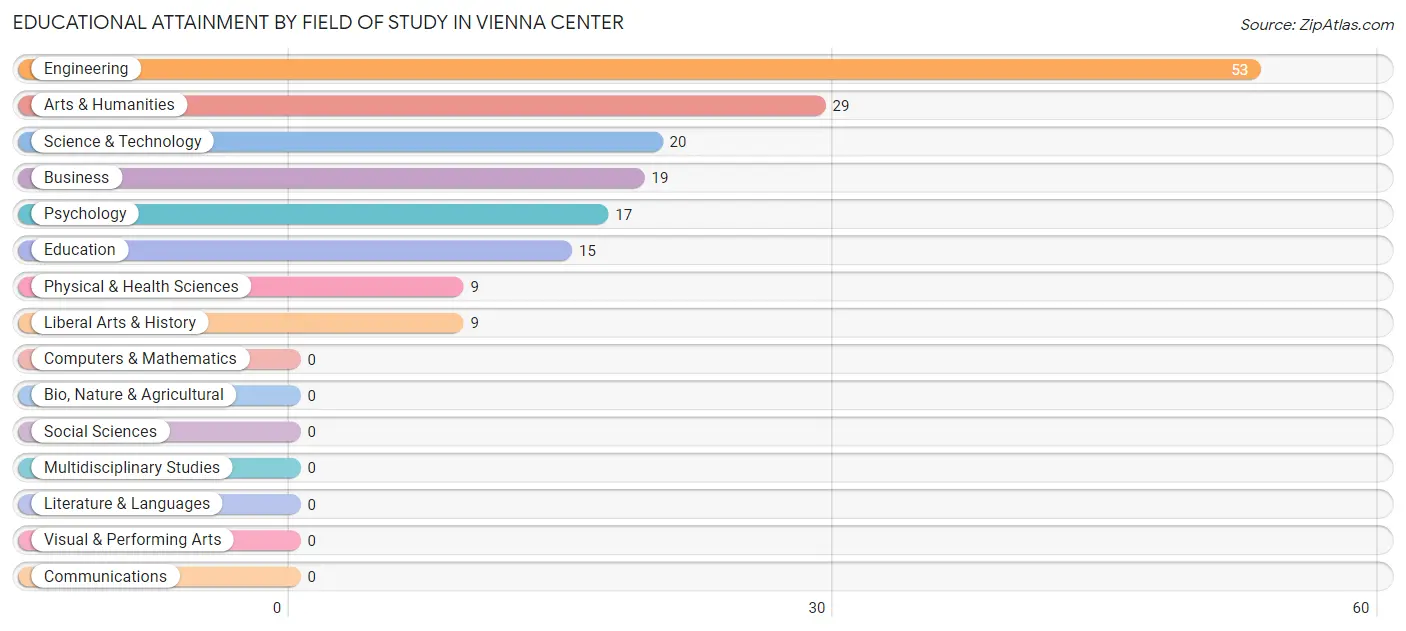
| Field of Study | # Graduates | % Graduates |
| Computers & Mathematics | 0 | 0.0% |
| Bio, Nature & Agricultural | 0 | 0.0% |
| Physical & Health Sciences | 9 | 5.3% |
| Psychology | 17 | 9.9% |
| Social Sciences | 0 | 0.0% |
| Engineering | 53 | 31.0% |
| Multidisciplinary Studies | 0 | 0.0% |
| Science & Technology | 20 | 11.7% |
| Business | 19 | 11.1% |
| Education | 15 | 8.8% |
| Literature & Languages | 0 | 0.0% |
| Liberal Arts & History | 9 | 5.3% |
| Visual & Performing Arts | 0 | 0.0% |
| Communications | 0 | 0.0% |
| Arts & Humanities | 29 | 17.0% |
| Total | 171 | 100.0% |
Transportation & Commute in Vienna Center
Vehicle Availability by Sex in Vienna Center
The most prevalent vehicle ownership categories in Vienna Center are males with 5 or more vehicles (139, accounting for 66.2%) and females with 5 or more vehicles (27, making up 127.5%).
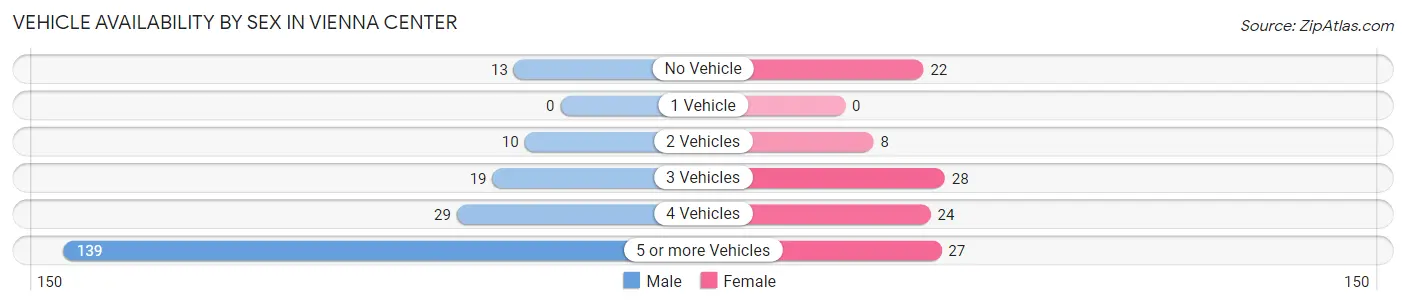
| Vehicles Available | Male | Female |
| No Vehicle | 13 (6.2%) | 22 (20.2%) |
| 1 Vehicle | 0 (0.0%) | 0 (0.0%) |
| 2 Vehicles | 10 (4.8%) | 8 (7.3%) |
| 3 Vehicles | 19 (9.0%) | 28 (25.7%) |
| 4 Vehicles | 29 (13.8%) | 24 (22.0%) |
| 5 or more Vehicles | 139 (66.2%) | 27 (24.8%) |
| Total | 210 (100.0%) | 109 (100.0%) |
Commute Time in Vienna Center
The most frequently occuring commute durations in Vienna Center are 15 to 19 minutes (68 commuters, 21.3%), 5 to 9 minutes (67 commuters, 21.0%), and 60 to 89 minutes (64 commuters, 20.1%).
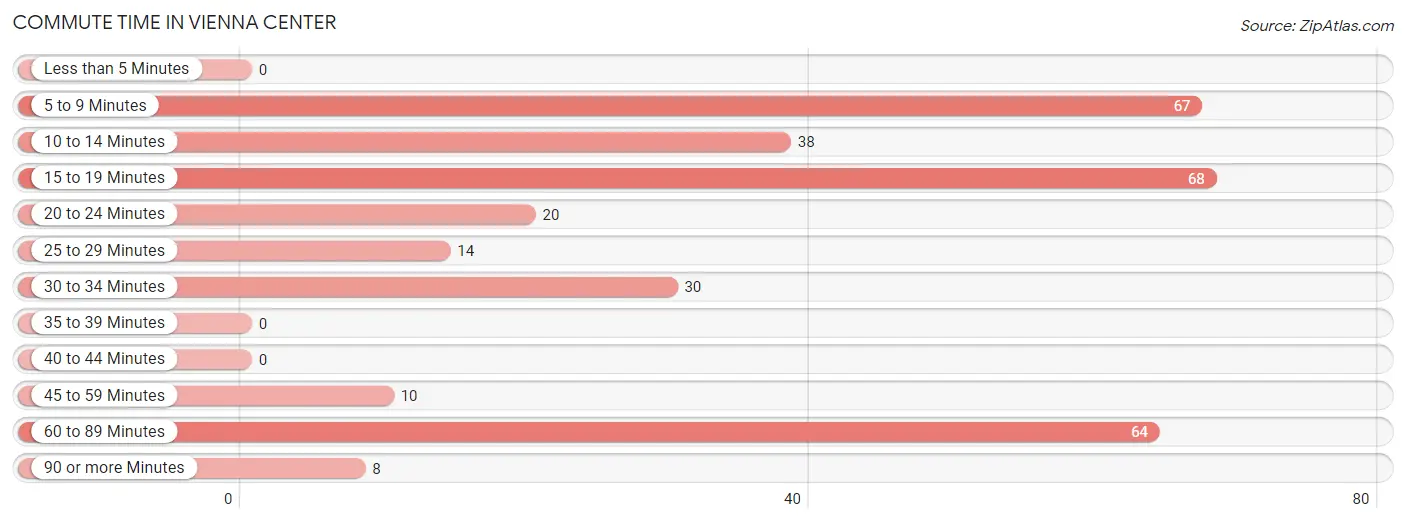
| Commute Time | # Commuters | % Commuters |
| Less than 5 Minutes | 0 | 0.0% |
| 5 to 9 Minutes | 67 | 21.0% |
| 10 to 14 Minutes | 38 | 11.9% |
| 15 to 19 Minutes | 68 | 21.3% |
| 20 to 24 Minutes | 20 | 6.3% |
| 25 to 29 Minutes | 14 | 4.4% |
| 30 to 34 Minutes | 30 | 9.4% |
| 35 to 39 Minutes | 0 | 0.0% |
| 40 to 44 Minutes | 0 | 0.0% |
| 45 to 59 Minutes | 10 | 3.1% |
| 60 to 89 Minutes | 64 | 20.1% |
| 90 or more Minutes | 8 | 2.5% |
Commute Time by Sex in Vienna Center
The most common commute times in Vienna Center are 60 to 89 minutes (64 commuters, 30.5%) for males and 10 to 14 minutes (28 commuters, 25.7%) for females.
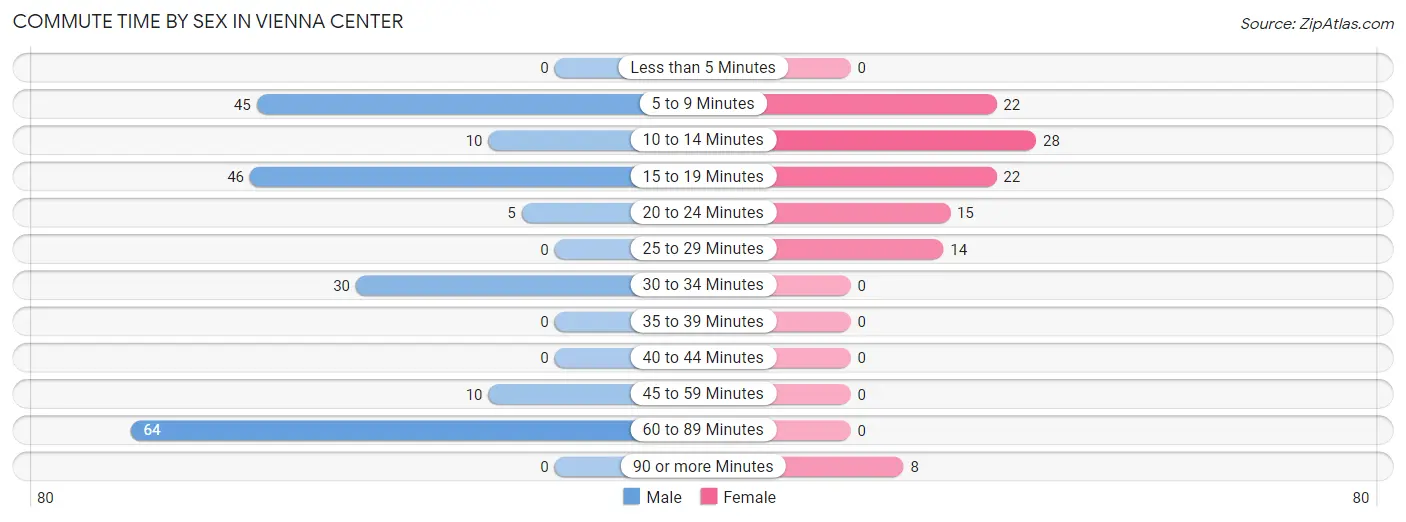
| Commute Time | Male | Female |
| Less than 5 Minutes | 0 (0.0%) | 0 (0.0%) |
| 5 to 9 Minutes | 45 (21.4%) | 22 (20.2%) |
| 10 to 14 Minutes | 10 (4.8%) | 28 (25.7%) |
| 15 to 19 Minutes | 46 (21.9%) | 22 (20.2%) |
| 20 to 24 Minutes | 5 (2.4%) | 15 (13.8%) |
| 25 to 29 Minutes | 0 (0.0%) | 14 (12.8%) |
| 30 to 34 Minutes | 30 (14.3%) | 0 (0.0%) |
| 35 to 39 Minutes | 0 (0.0%) | 0 (0.0%) |
| 40 to 44 Minutes | 0 (0.0%) | 0 (0.0%) |
| 45 to 59 Minutes | 10 (4.8%) | 0 (0.0%) |
| 60 to 89 Minutes | 64 (30.5%) | 0 (0.0%) |
| 90 or more Minutes | 0 (0.0%) | 8 (7.3%) |
Time of Departure to Work by Sex in Vienna Center
The most frequent times of departure to work in Vienna Center are 6:00 AM to 6:29 AM (78, 37.1%) for males and 7:30 AM to 7:59 AM (31, 28.4%) for females.
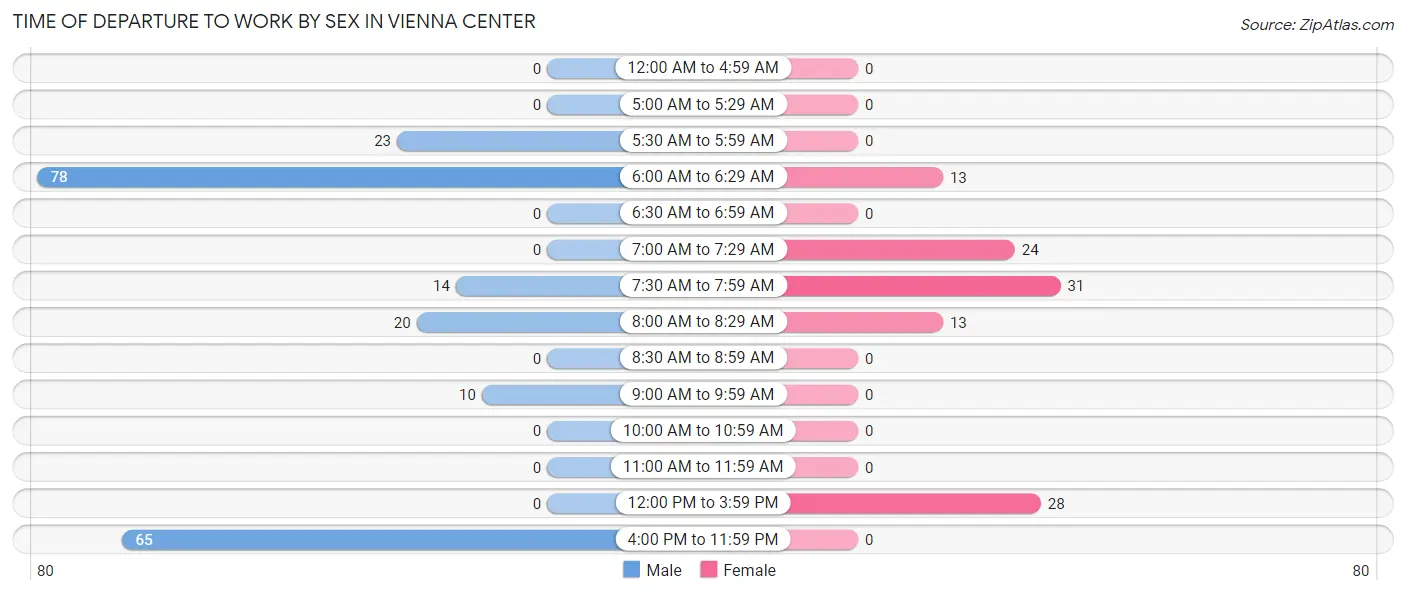
| Time of Departure | Male | Female |
| 12:00 AM to 4:59 AM | 0 (0.0%) | 0 (0.0%) |
| 5:00 AM to 5:29 AM | 0 (0.0%) | 0 (0.0%) |
| 5:30 AM to 5:59 AM | 23 (11.0%) | 0 (0.0%) |
| 6:00 AM to 6:29 AM | 78 (37.1%) | 13 (11.9%) |
| 6:30 AM to 6:59 AM | 0 (0.0%) | 0 (0.0%) |
| 7:00 AM to 7:29 AM | 0 (0.0%) | 24 (22.0%) |
| 7:30 AM to 7:59 AM | 14 (6.7%) | 31 (28.4%) |
| 8:00 AM to 8:29 AM | 20 (9.5%) | 13 (11.9%) |
| 8:30 AM to 8:59 AM | 0 (0.0%) | 0 (0.0%) |
| 9:00 AM to 9:59 AM | 10 (4.8%) | 0 (0.0%) |
| 10:00 AM to 10:59 AM | 0 (0.0%) | 0 (0.0%) |
| 11:00 AM to 11:59 AM | 0 (0.0%) | 0 (0.0%) |
| 12:00 PM to 3:59 PM | 0 (0.0%) | 28 (25.7%) |
| 4:00 PM to 11:59 PM | 65 (30.9%) | 0 (0.0%) |
| Total | 210 (100.0%) | 109 (100.0%) |
Housing Occupancy in Vienna Center
Occupancy by Ownership in Vienna Center
Of the total 283 dwellings in Vienna Center, owner-occupied units account for 242 (85.5%), while renter-occupied units make up 41 (14.5%).
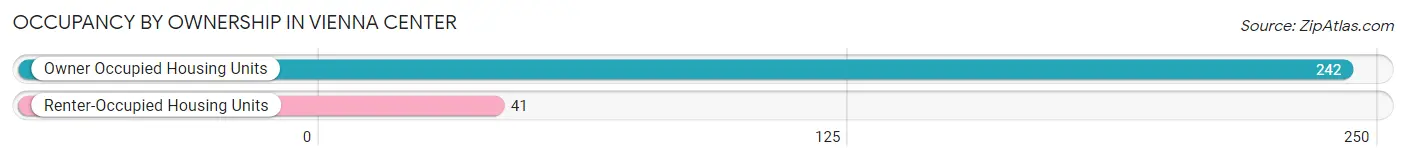
| Occupancy | # Housing Units | % Housing Units |
| Owner Occupied Housing Units | 242 | 85.5% |
| Renter-Occupied Housing Units | 41 | 14.5% |
| Total Occupied Housing Units | 283 | 100.0% |
Occupancy by Household Size in Vienna Center
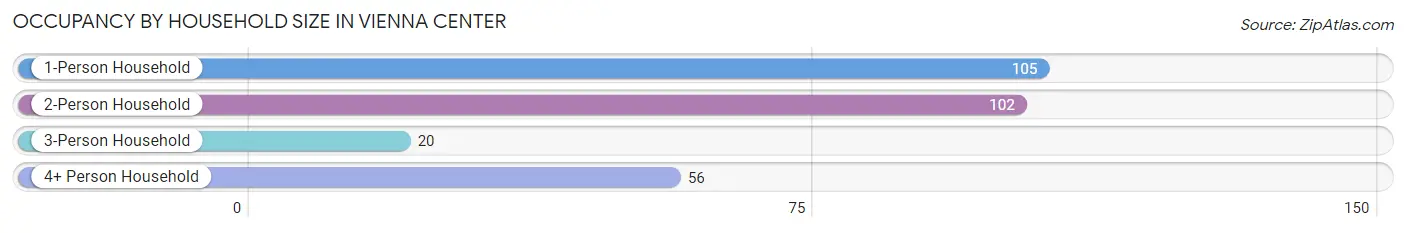
| Household Size | # Housing Units | % Housing Units |
| 1-Person Household | 105 | 37.1% |
| 2-Person Household | 102 | 36.0% |
| 3-Person Household | 20 | 7.1% |
| 4+ Person Household | 56 | 19.8% |
| Total Housing Units | 283 | 100.0% |
Occupancy by Ownership by Household Size in Vienna Center
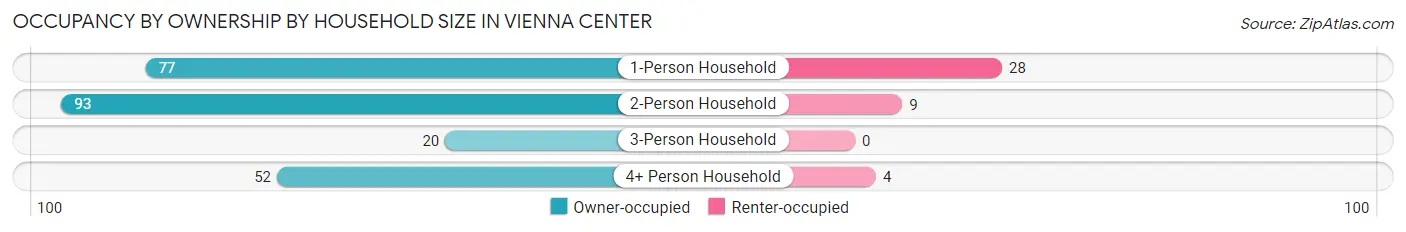
| Household Size | Owner-occupied | Renter-occupied |
| 1-Person Household | 77 (73.3%) | 28 (26.7%) |
| 2-Person Household | 93 (91.2%) | 9 (8.8%) |
| 3-Person Household | 20 (100.0%) | 0 (0.0%) |
| 4+ Person Household | 52 (92.9%) | 4 (7.1%) |
| Total Housing Units | 242 (85.5%) | 41 (14.5%) |
Occupancy by Educational Attainment in Vienna Center
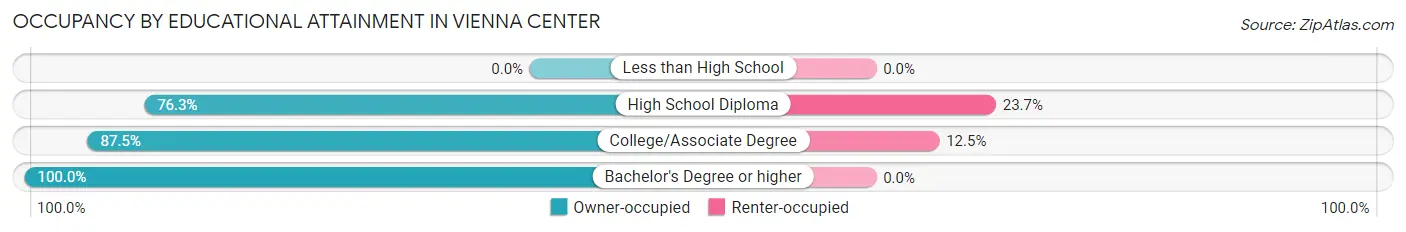
| Household Size | Owner-occupied | Renter-occupied |
| Less than High School | 0 (0.0%) | 0 (0.0%) |
| High School Diploma | 119 (76.3%) | 37 (23.7%) |
| College/Associate Degree | 28 (87.5%) | 4 (12.5%) |
| Bachelor's Degree or higher | 95 (100.0%) | 0 (0.0%) |
Occupancy by Age of Householder in Vienna Center
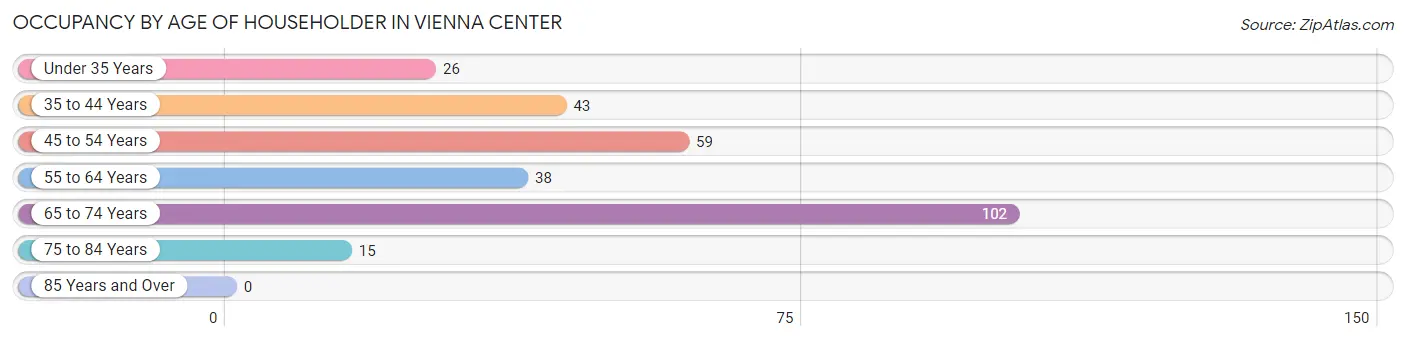
| Age Bracket | # Households | % Households |
| Under 35 Years | 26 | 9.2% |
| 35 to 44 Years | 43 | 15.2% |
| 45 to 54 Years | 59 | 20.8% |
| 55 to 64 Years | 38 | 13.4% |
| 65 to 74 Years | 102 | 36.0% |
| 75 to 84 Years | 15 | 5.3% |
| 85 Years and Over | 0 | 0.0% |
| Total | 283 | 100.0% |
Housing Finances in Vienna Center
Median Income by Occupancy in Vienna Center
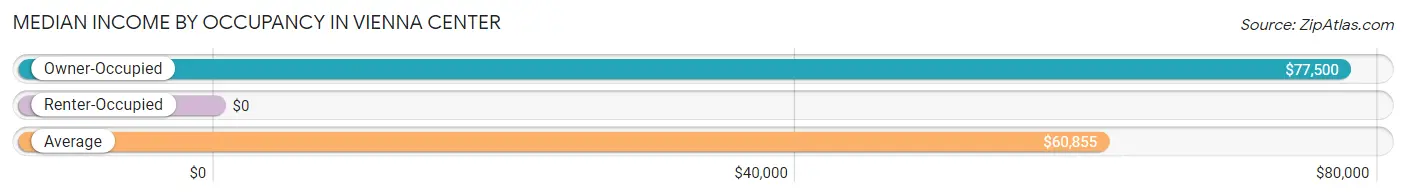
| Occupancy Type | # Households | Median Income |
| Owner-Occupied | 242 (85.5%) | $77,500 |
| Renter-Occupied | 41 (14.5%) | $0 |
| Average | 283 (100.0%) | $60,855 |
Occupancy by Householder Income Bracket in Vienna Center
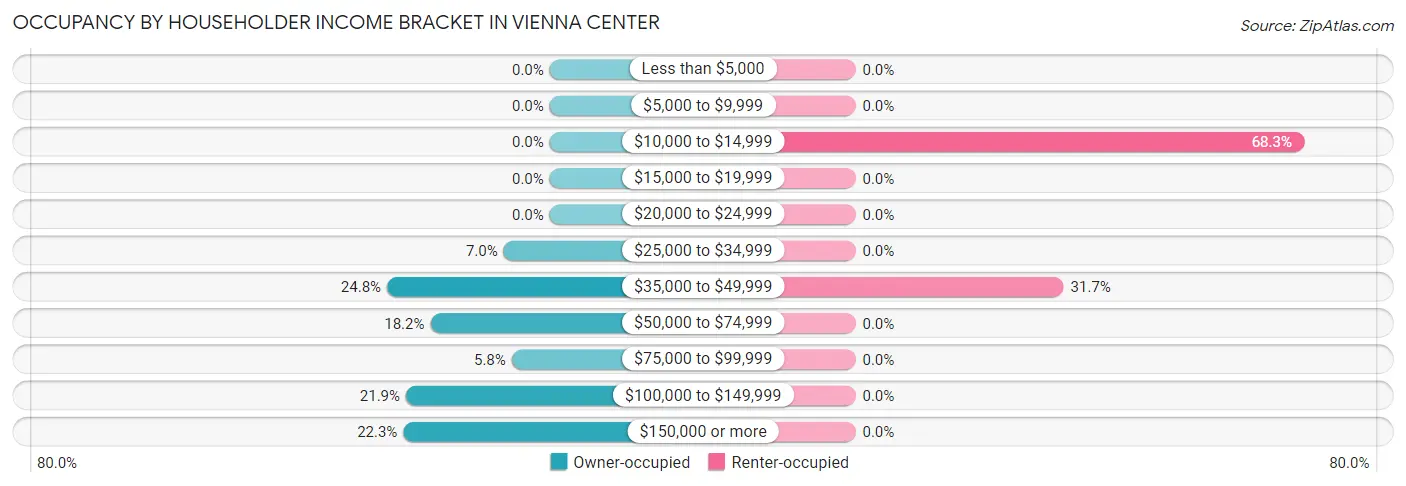
| Income Bracket | Owner-occupied | Renter-occupied |
| Less than $5,000 | 0 (0.0%) | 0 (0.0%) |
| $5,000 to $9,999 | 0 (0.0%) | 0 (0.0%) |
| $10,000 to $14,999 | 0 (0.0%) | 28 (68.3%) |
| $15,000 to $19,999 | 0 (0.0%) | 0 (0.0%) |
| $20,000 to $24,999 | 0 (0.0%) | 0 (0.0%) |
| $25,000 to $34,999 | 17 (7.0%) | 0 (0.0%) |
| $35,000 to $49,999 | 60 (24.8%) | 13 (31.7%) |
| $50,000 to $74,999 | 44 (18.2%) | 0 (0.0%) |
| $75,000 to $99,999 | 14 (5.8%) | 0 (0.0%) |
| $100,000 to $149,999 | 53 (21.9%) | 0 (0.0%) |
| $150,000 or more | 54 (22.3%) | 0 (0.0%) |
| Total | 242 (100.0%) | 41 (100.0%) |
Monthly Housing Cost Tiers in Vienna Center
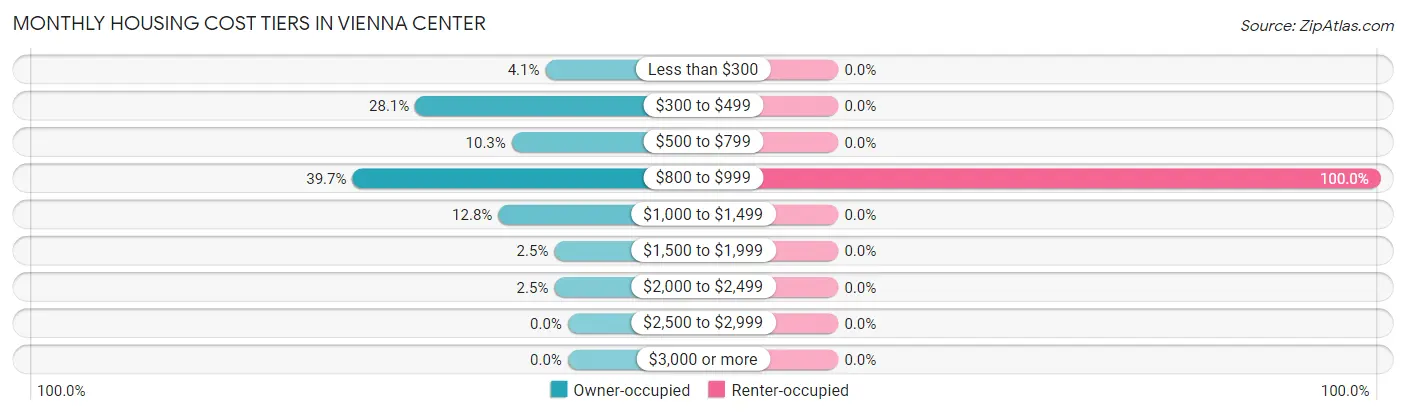
| Monthly Cost | Owner-occupied | Renter-occupied |
| Less than $300 | 10 (4.1%) | 0 (0.0%) |
| $300 to $499 | 68 (28.1%) | 0 (0.0%) |
| $500 to $799 | 25 (10.3%) | 0 (0.0%) |
| $800 to $999 | 96 (39.7%) | 41 (100.0%) |
| $1,000 to $1,499 | 31 (12.8%) | 0 (0.0%) |
| $1,500 to $1,999 | 6 (2.5%) | 0 (0.0%) |
| $2,000 to $2,499 | 6 (2.5%) | 0 (0.0%) |
| $2,500 to $2,999 | 0 (0.0%) | 0 (0.0%) |
| $3,000 or more | 0 (0.0%) | 0 (0.0%) |
| Total | 242 (100.0%) | 41 (100.0%) |
Physical Housing Characteristics in Vienna Center
Housing Structures in Vienna Center
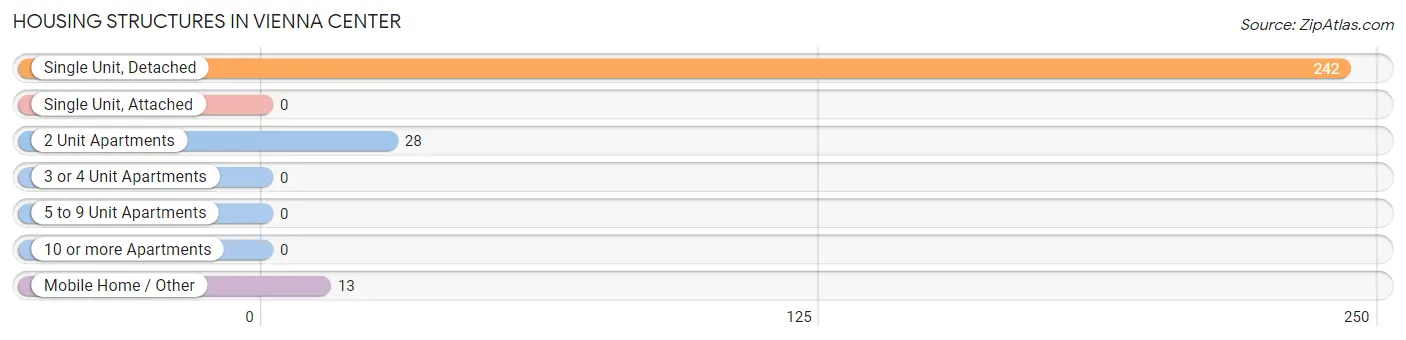
| Structure Type | # Housing Units | % Housing Units |
| Single Unit, Detached | 242 | 85.5% |
| Single Unit, Attached | 0 | 0.0% |
| 2 Unit Apartments | 28 | 9.9% |
| 3 or 4 Unit Apartments | 0 | 0.0% |
| 5 to 9 Unit Apartments | 0 | 0.0% |
| 10 or more Apartments | 0 | 0.0% |
| Mobile Home / Other | 13 | 4.6% |
| Total | 283 | 100.0% |
Housing Structures by Occupancy in Vienna Center
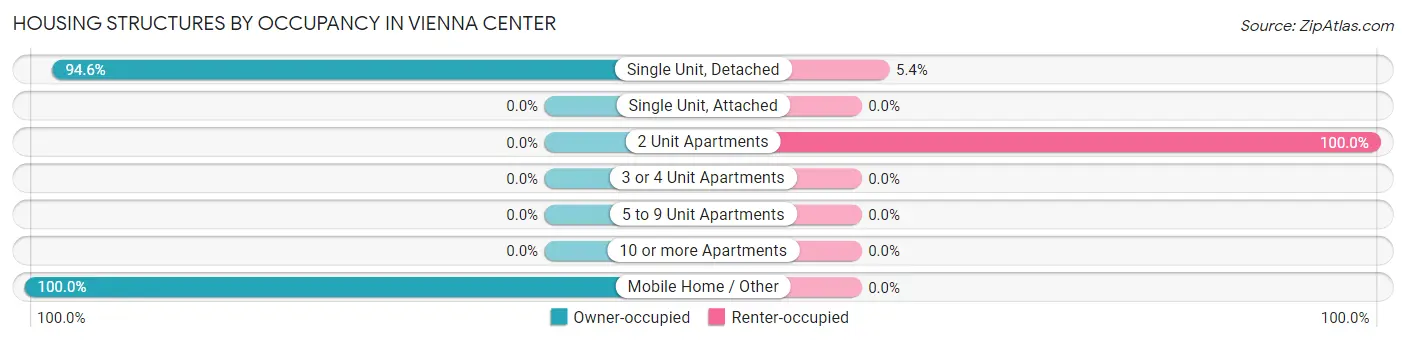
| Structure Type | Owner-occupied | Renter-occupied |
| Single Unit, Detached | 229 (94.6%) | 13 (5.4%) |
| Single Unit, Attached | 0 (0.0%) | 0 (0.0%) |
| 2 Unit Apartments | 0 (0.0%) | 28 (100.0%) |
| 3 or 4 Unit Apartments | 0 (0.0%) | 0 (0.0%) |
| 5 to 9 Unit Apartments | 0 (0.0%) | 0 (0.0%) |
| 10 or more Apartments | 0 (0.0%) | 0 (0.0%) |
| Mobile Home / Other | 13 (100.0%) | 0 (0.0%) |
| Total | 242 (85.5%) | 41 (14.5%) |
Housing Structures by Number of Rooms in Vienna Center
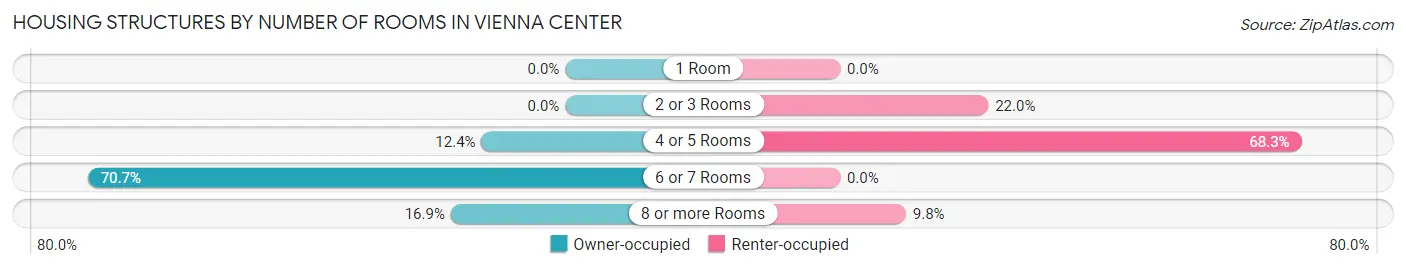
| Number of Rooms | Owner-occupied | Renter-occupied |
| 1 Room | 0 (0.0%) | 0 (0.0%) |
| 2 or 3 Rooms | 0 (0.0%) | 9 (22.0%) |
| 4 or 5 Rooms | 30 (12.4%) | 28 (68.3%) |
| 6 or 7 Rooms | 171 (70.7%) | 0 (0.0%) |
| 8 or more Rooms | 41 (16.9%) | 4 (9.8%) |
| Total | 242 (100.0%) | 41 (100.0%) |
Housing Structure by Heating Type in Vienna Center
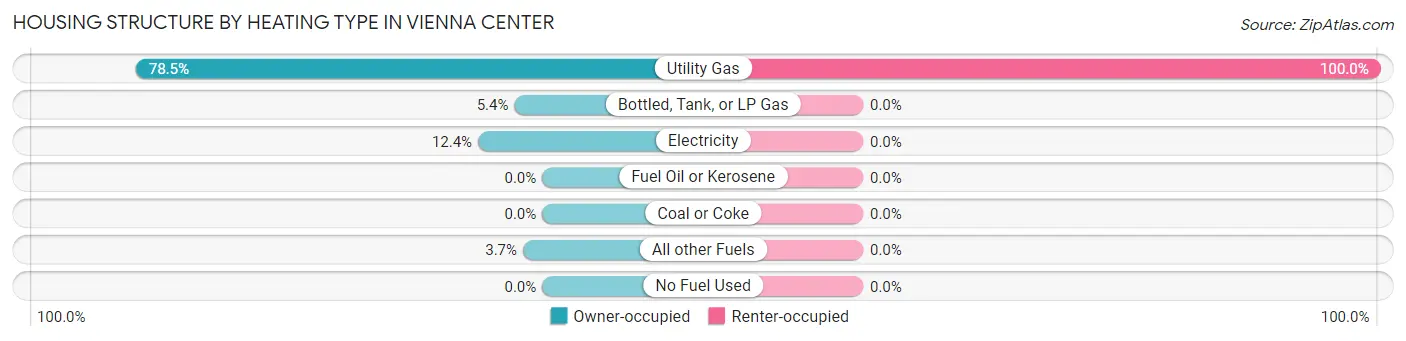
| Heating Type | Owner-occupied | Renter-occupied |
| Utility Gas | 190 (78.5%) | 41 (100.0%) |
| Bottled, Tank, or LP Gas | 13 (5.4%) | 0 (0.0%) |
| Electricity | 30 (12.4%) | 0 (0.0%) |
| Fuel Oil or Kerosene | 0 (0.0%) | 0 (0.0%) |
| Coal or Coke | 0 (0.0%) | 0 (0.0%) |
| All other Fuels | 9 (3.7%) | 0 (0.0%) |
| No Fuel Used | 0 (0.0%) | 0 (0.0%) |
| Total | 242 (100.0%) | 41 (100.0%) |
Household Vehicle Usage in Vienna Center
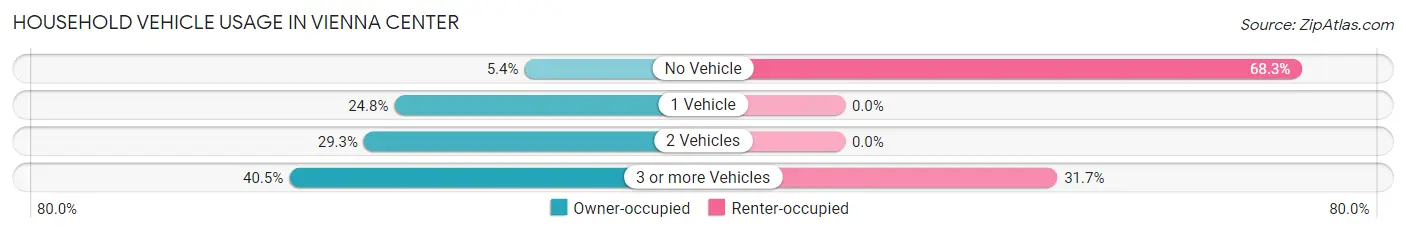
| Vehicles per Household | Owner-occupied | Renter-occupied |
| No Vehicle | 13 (5.4%) | 28 (68.3%) |
| 1 Vehicle | 60 (24.8%) | 0 (0.0%) |
| 2 Vehicles | 71 (29.3%) | 0 (0.0%) |
| 3 or more Vehicles | 98 (40.5%) | 13 (31.7%) |
| Total | 242 (100.0%) | 41 (100.0%) |
Real Estate & Mortgages in Vienna Center
Real Estate and Mortgage Overview in Vienna Center
| Characteristic | Without Mortgage | With Mortgage |
| Housing Units | 119 | 123 |
| Median Property Value | $179,700 | $114,800 |
| Median Household Income | - | - |
| Monthly Housing Costs | $476 | $0 |
| Real Estate Taxes | $1,966 | $0 |
Property Value by Mortgage Status in Vienna Center
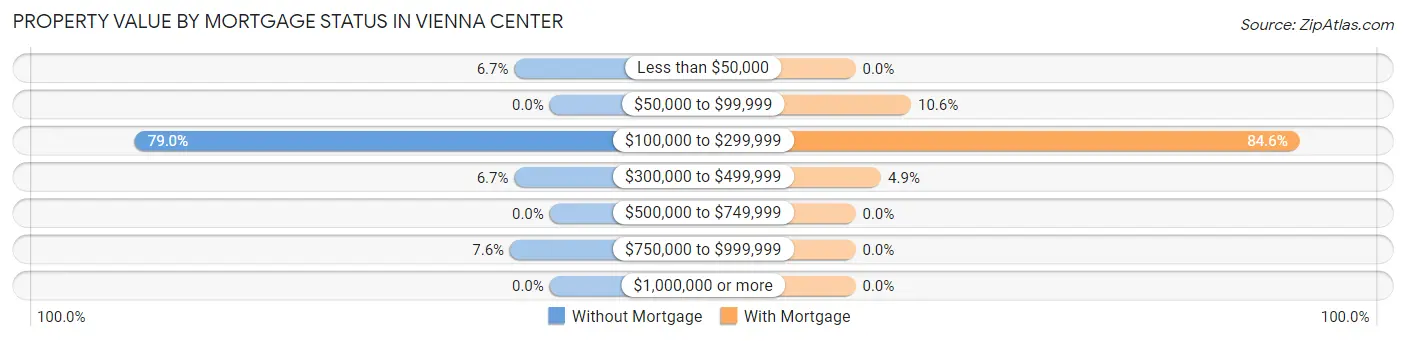
| Property Value | Without Mortgage | With Mortgage |
| Less than $50,000 | 8 (6.7%) | 0 (0.0%) |
| $50,000 to $99,999 | 0 (0.0%) | 13 (10.6%) |
| $100,000 to $299,999 | 94 (79.0%) | 104 (84.6%) |
| $300,000 to $499,999 | 8 (6.7%) | 6 (4.9%) |
| $500,000 to $749,999 | 0 (0.0%) | 0 (0.0%) |
| $750,000 to $999,999 | 9 (7.6%) | 0 (0.0%) |
| $1,000,000 or more | 0 (0.0%) | 0 (0.0%) |
| Total | 119 (100.0%) | 123 (100.0%) |
Household Income by Mortgage Status in Vienna Center
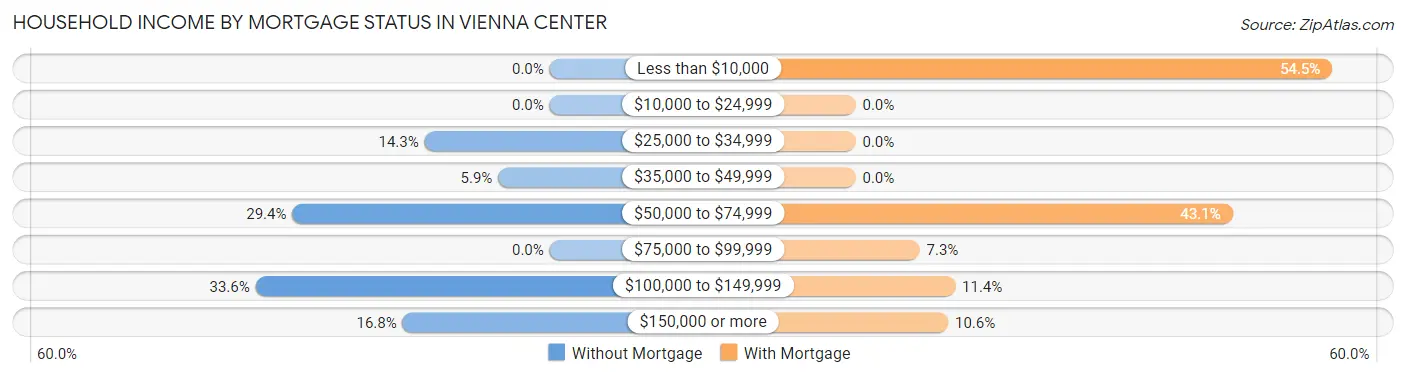
| Household Income | Without Mortgage | With Mortgage |
| Less than $10,000 | 0 (0.0%) | 67 (54.5%) |
| $10,000 to $24,999 | 0 (0.0%) | 0 (0.0%) |
| $25,000 to $34,999 | 17 (14.3%) | 0 (0.0%) |
| $35,000 to $49,999 | 7 (5.9%) | 0 (0.0%) |
| $50,000 to $74,999 | 35 (29.4%) | 53 (43.1%) |
| $75,000 to $99,999 | 0 (0.0%) | 9 (7.3%) |
| $100,000 to $149,999 | 40 (33.6%) | 14 (11.4%) |
| $150,000 or more | 20 (16.8%) | 13 (10.6%) |
| Total | 119 (100.0%) | 123 (100.0%) |
Property Value to Household Income Ratio in Vienna Center
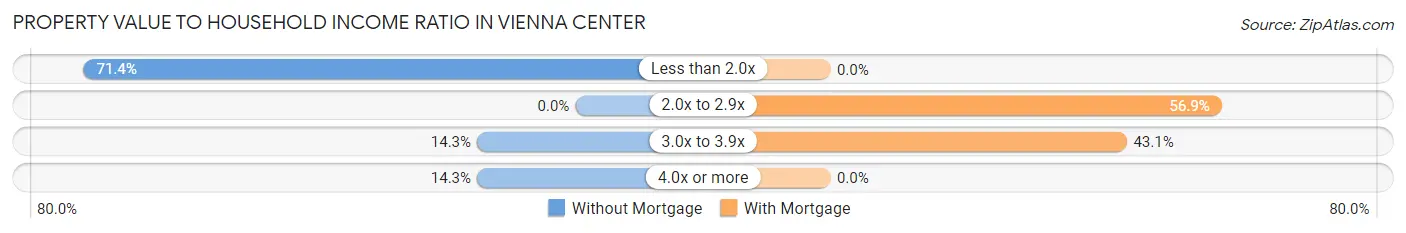
| Value-to-Income Ratio | Without Mortgage | With Mortgage |
| Less than 2.0x | 85 (71.4%) | 0 (0.0%) |
| 2.0x to 2.9x | 0 (0.0%) | 70 (56.9%) |
| 3.0x to 3.9x | 17 (14.3%) | 53 (43.1%) |
| 4.0x or more | 17 (14.3%) | 0 (0.0%) |
| Total | 119 (100.0%) | 123 (100.0%) |
Real Estate Taxes by Mortgage Status in Vienna Center
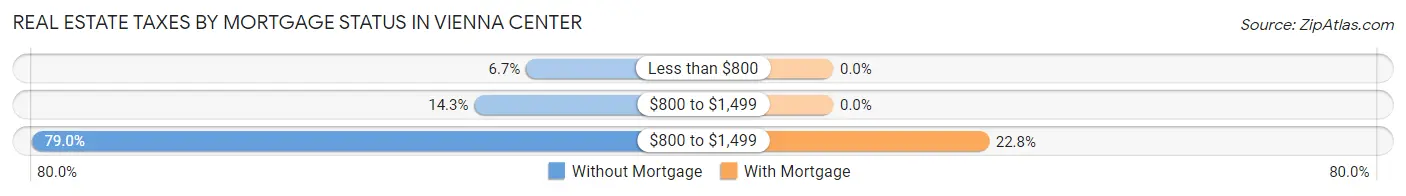
| Property Taxes | Without Mortgage | With Mortgage |
| Less than $800 | 8 (6.7%) | 0 (0.0%) |
| $800 to $1,499 | 17 (14.3%) | 0 (0.0%) |
| $800 to $1,499 | 94 (79.0%) | 28 (22.8%) |
| Total | 119 (100.0%) | 123 (100.0%) |
Health & Disability in Vienna Center
Health Insurance Coverage by Age in Vienna Center
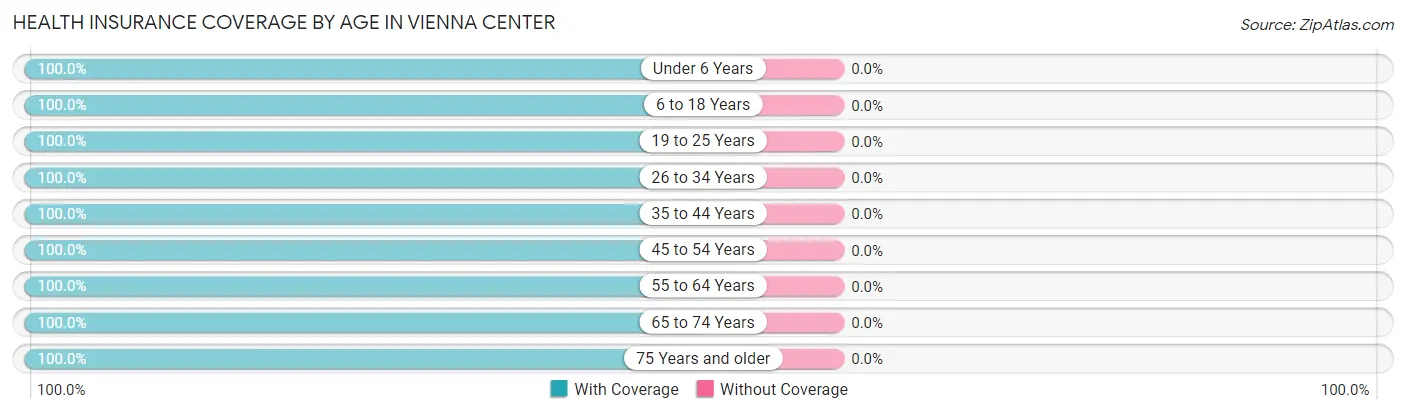
| Age Bracket | With Coverage | Without Coverage |
| Under 6 Years | 14 (100.0%) | 0 (0.0%) |
| 6 to 18 Years | 74 (100.0%) | 0 (0.0%) |
| 19 to 25 Years | 111 (100.0%) | 0 (0.0%) |
| 26 to 34 Years | 20 (100.0%) | 0 (0.0%) |
| 35 to 44 Years | 70 (100.0%) | 0 (0.0%) |
| 45 to 54 Years | 123 (100.0%) | 0 (0.0%) |
| 55 to 64 Years | 70 (100.0%) | 0 (0.0%) |
| 65 to 74 Years | 137 (100.0%) | 0 (0.0%) |
| 75 Years and older | 32 (100.0%) | 0 (0.0%) |
| Total | 651 (100.0%) | 0 (0.0%) |
Health Insurance Coverage by Citizenship Status in Vienna Center
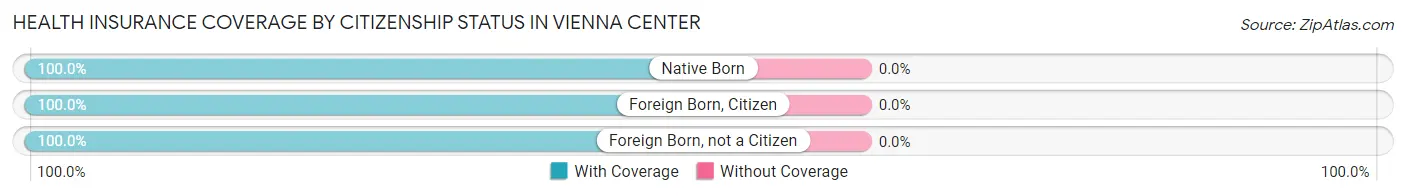
| Citizenship Status | With Coverage | Without Coverage |
| Native Born | 14 (100.0%) | 0 (0.0%) |
| Foreign Born, Citizen | 74 (100.0%) | 0 (0.0%) |
| Foreign Born, not a Citizen | 111 (100.0%) | 0 (0.0%) |
Health Insurance Coverage by Household Income in Vienna Center
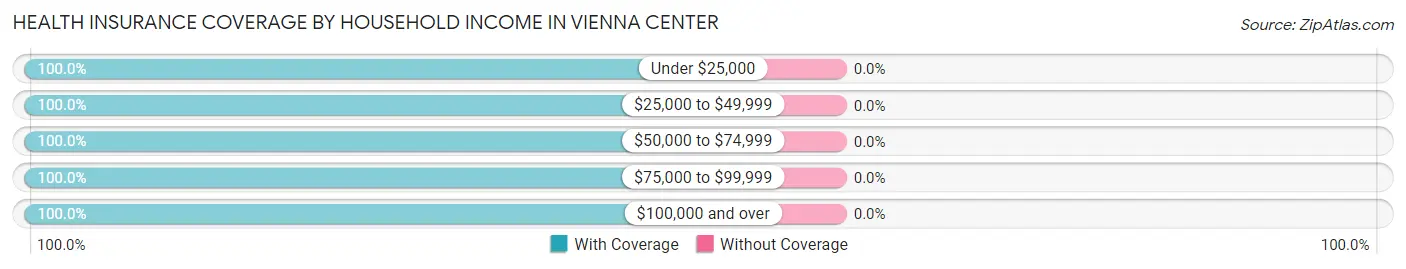
| Household Income | With Coverage | Without Coverage |
| Under $25,000 | 28 (100.0%) | 0 (0.0%) |
| $25,000 to $49,999 | 148 (100.0%) | 0 (0.0%) |
| $50,000 to $74,999 | 79 (100.0%) | 0 (0.0%) |
| $75,000 to $99,999 | 36 (100.0%) | 0 (0.0%) |
| $100,000 and over | 360 (100.0%) | 0 (0.0%) |
Public vs Private Health Insurance Coverage by Age in Vienna Center
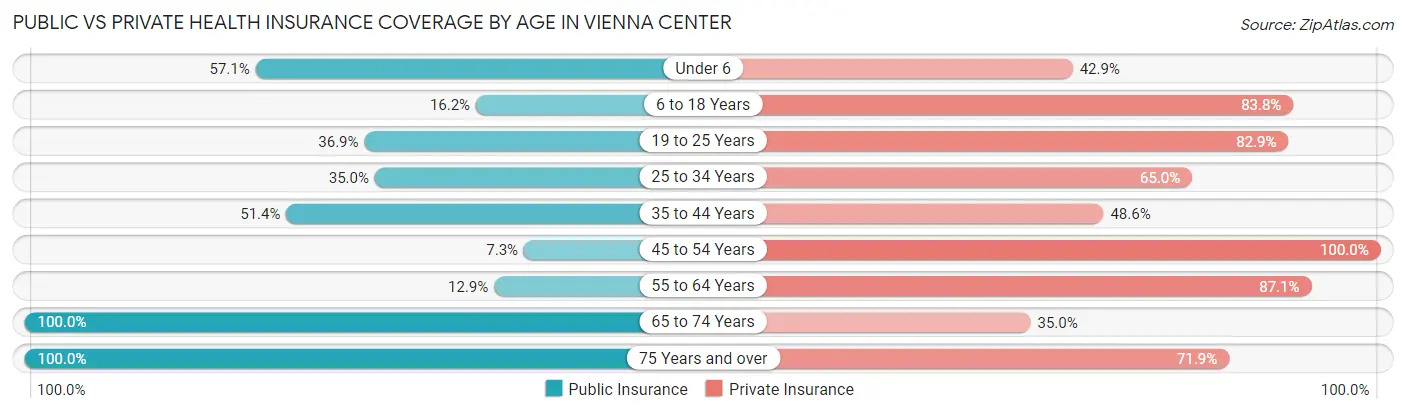
| Age Bracket | Public Insurance | Private Insurance |
| Under 6 | 8 (57.1%) | 6 (42.9%) |
| 6 to 18 Years | 12 (16.2%) | 62 (83.8%) |
| 19 to 25 Years | 41 (36.9%) | 92 (82.9%) |
| 25 to 34 Years | 7 (35.0%) | 13 (65.0%) |
| 35 to 44 Years | 36 (51.4%) | 34 (48.6%) |
| 45 to 54 Years | 9 (7.3%) | 123 (100.0%) |
| 55 to 64 Years | 9 (12.9%) | 61 (87.1%) |
| 65 to 74 Years | 137 (100.0%) | 48 (35.0%) |
| 75 Years and over | 32 (100.0%) | 23 (71.9%) |
| Total | 291 (44.7%) | 462 (71.0%) |
Disability Status by Sex by Age in Vienna Center
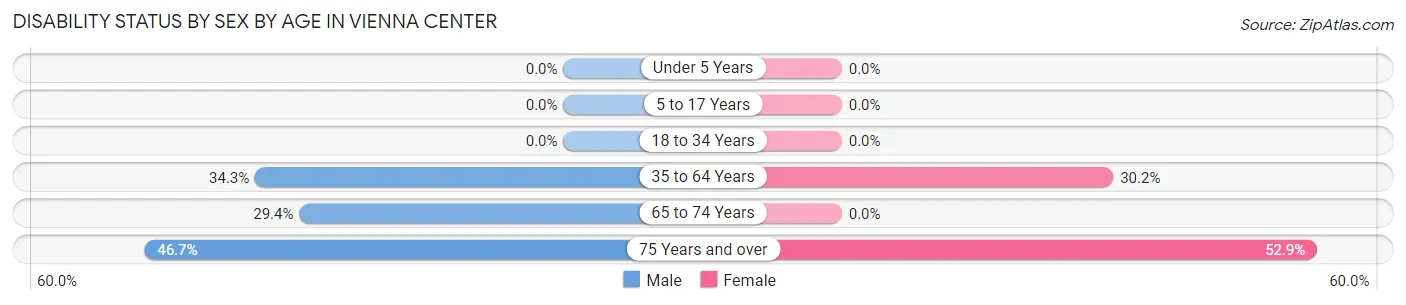
| Age Bracket | Male | Female |
| Under 5 Years | 0 (0.0%) | 0 (0.0%) |
| 5 to 17 Years | 0 (0.0%) | 0 (0.0%) |
| 18 to 34 Years | 0 (0.0%) | 0 (0.0%) |
| 35 to 64 Years | 46 (34.3%) | 39 (30.2%) |
| 65 to 74 Years | 10 (29.4%) | 0 (0.0%) |
| 75 Years and over | 7 (46.7%) | 9 (52.9%) |
Disability Class by Sex by Age in Vienna Center
Disability Class: Hearing Difficulty
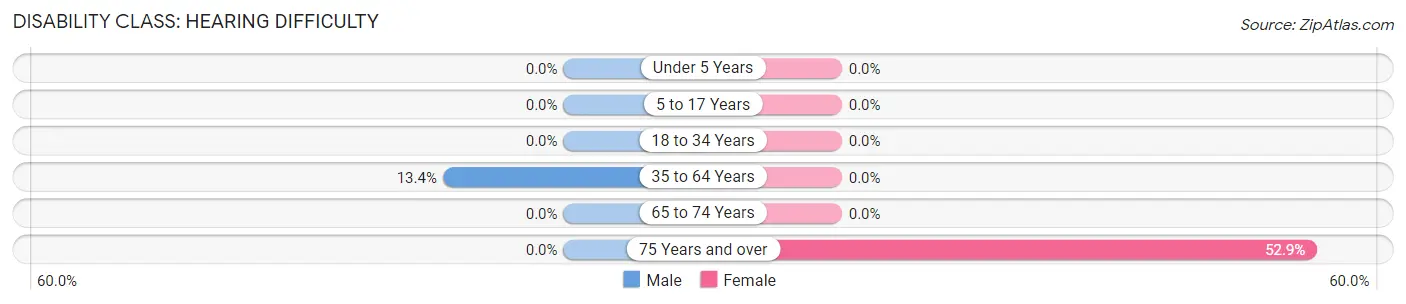
| Age Bracket | Male | Female |
| Under 5 Years | 0 (0.0%) | 0 (0.0%) |
| 5 to 17 Years | 0 (0.0%) | 0 (0.0%) |
| 18 to 34 Years | 0 (0.0%) | 0 (0.0%) |
| 35 to 64 Years | 18 (13.4%) | 0 (0.0%) |
| 65 to 74 Years | 0 (0.0%) | 0 (0.0%) |
| 75 Years and over | 0 (0.0%) | 9 (52.9%) |
Disability Class: Vision Difficulty
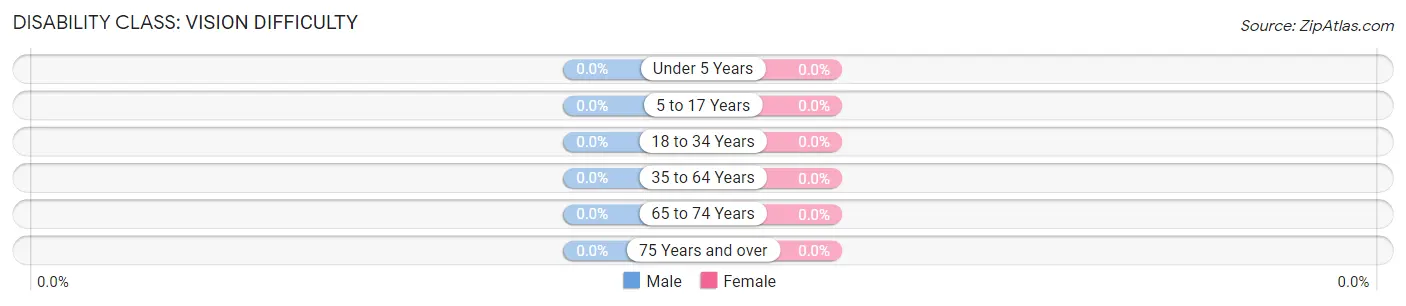
| Age Bracket | Male | Female |
| Under 5 Years | 0 (0.0%) | 0 (0.0%) |
| 5 to 17 Years | 0 (0.0%) | 0 (0.0%) |
| 18 to 34 Years | 0 (0.0%) | 0 (0.0%) |
| 35 to 64 Years | 0 (0.0%) | 0 (0.0%) |
| 65 to 74 Years | 0 (0.0%) | 0 (0.0%) |
| 75 Years and over | 0 (0.0%) | 0 (0.0%) |
Disability Class: Cognitive Difficulty
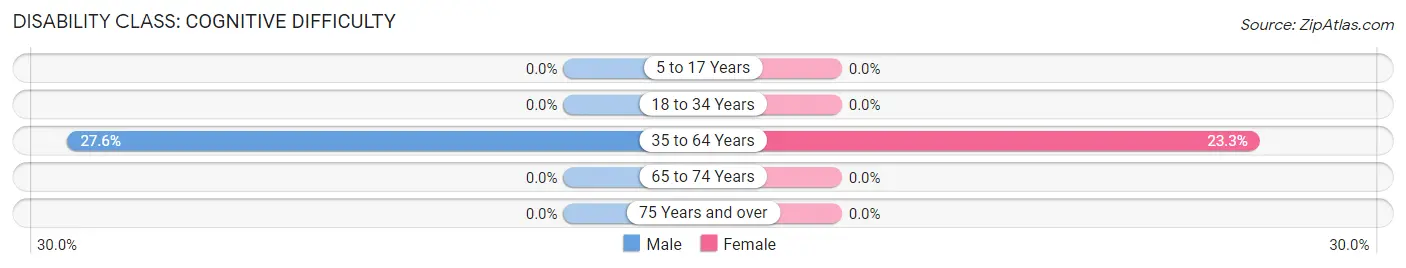
| Age Bracket | Male | Female |
| 5 to 17 Years | 0 (0.0%) | 0 (0.0%) |
| 18 to 34 Years | 0 (0.0%) | 0 (0.0%) |
| 35 to 64 Years | 37 (27.6%) | 30 (23.3%) |
| 65 to 74 Years | 0 (0.0%) | 0 (0.0%) |
| 75 Years and over | 0 (0.0%) | 0 (0.0%) |
Disability Class: Ambulatory Difficulty
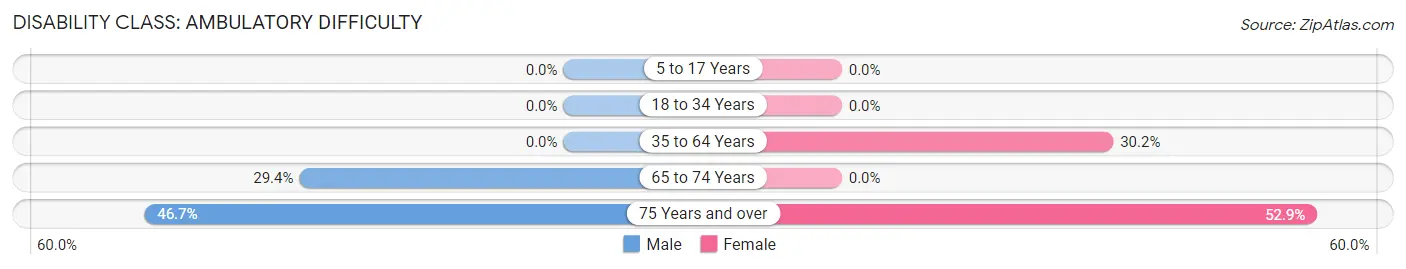
| Age Bracket | Male | Female |
| 5 to 17 Years | 0 (0.0%) | 0 (0.0%) |
| 18 to 34 Years | 0 (0.0%) | 0 (0.0%) |
| 35 to 64 Years | 0 (0.0%) | 39 (30.2%) |
| 65 to 74 Years | 10 (29.4%) | 0 (0.0%) |
| 75 Years and over | 7 (46.7%) | 9 (52.9%) |
Disability Class: Self-Care Difficulty
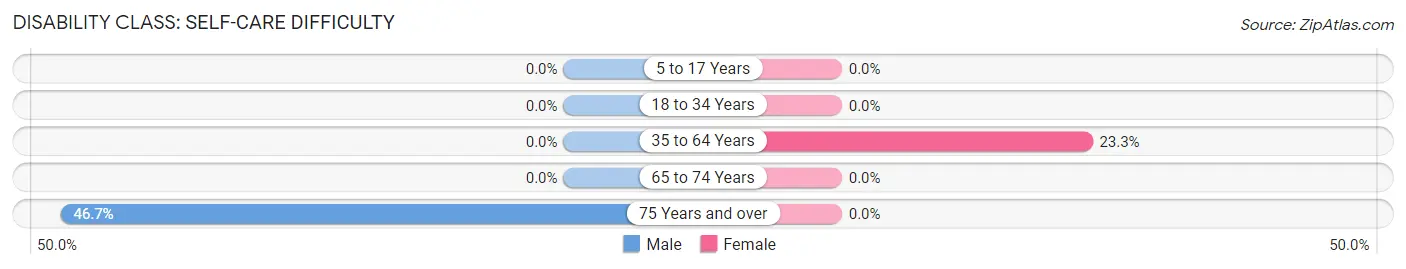
| Age Bracket | Male | Female |
| 5 to 17 Years | 0 (0.0%) | 0 (0.0%) |
| 18 to 34 Years | 0 (0.0%) | 0 (0.0%) |
| 35 to 64 Years | 0 (0.0%) | 30 (23.3%) |
| 65 to 74 Years | 0 (0.0%) | 0 (0.0%) |
| 75 Years and over | 7 (46.7%) | 0 (0.0%) |
Technology Access in Vienna Center
Computing Device Access in Vienna Center
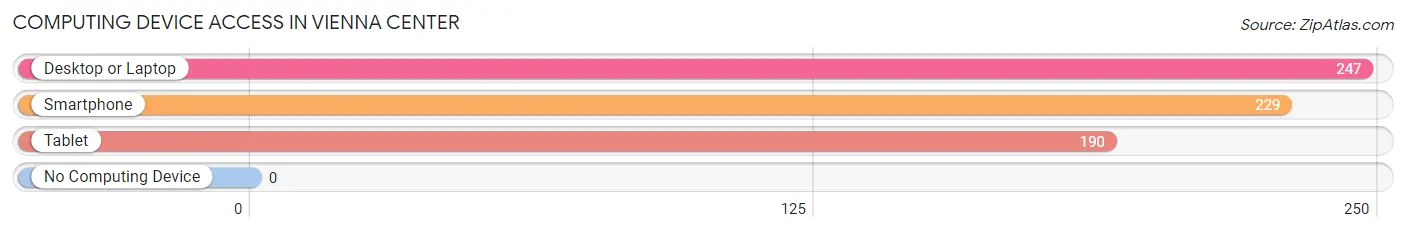
| Device Type | # Households | % Households |
| Desktop or Laptop | 247 | 87.3% |
| Smartphone | 229 | 80.9% |
| Tablet | 190 | 67.1% |
| No Computing Device | 0 | 0.0% |
| Total | 283 | 100.0% |
Internet Access in Vienna Center
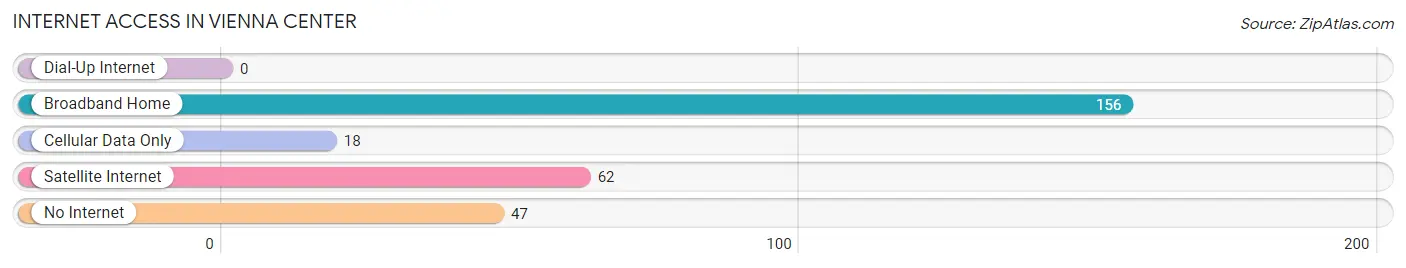
| Internet Type | # Households | % Households |
| Dial-Up Internet | 0 | 0.0% |
| Broadband Home | 156 | 55.1% |
| Cellular Data Only | 18 | 6.4% |
| Satellite Internet | 62 | 21.9% |
| No Internet | 47 | 16.6% |
| Total | 283 | 100.0% |
Vienna Center Summary
Vienna Center is a small unincorporated community located in Trumbull County, Ohio. It is situated in the northeast corner of the county, just south of the city of Warren. The community is part of the Youngstown-Warren-Boardman metropolitan statistical area.
History
Vienna Center was founded in 1820 by a group of settlers from Vienna, New York. The settlers were attracted to the area by the abundance of natural resources, including timber and fertile soil. The community was originally known as Vienna Township, but the name was changed to Vienna Center in 1837.
The first post office in Vienna Center was established in 1837. The community was home to several businesses, including a sawmill, a grist mill, a blacksmith shop, and a general store. The Vienna Center Methodist Church was established in 1845.
Geography
Vienna Center is located at 41°14'N 80°48'W. It is situated in the northeast corner of Trumbull County, just south of the city of Warren. The community is part of the Youngstown-Warren-Boardman metropolitan statistical area.
The terrain of Vienna Center is mostly flat, with some rolling hills. The area is heavily forested, with a mix of deciduous and coniferous trees. The climate is humid continental, with cold winters and hot, humid summers.
Economy
Vienna Center is a small, rural community with a limited economy. The primary industries in the area are agriculture and forestry. The community is home to several small farms, which produce a variety of crops, including corn, soybeans, and hay. The area is also home to several sawmills and lumber yards.
The community is also home to several small businesses, including a gas station, a convenience store, and a few restaurants. There are also several small retail stores in the area.
Demographics
As of the 2010 census, Vienna Center had a population of 1,845. The racial makeup of the community was 97.3% White, 0.7% African American, 0.3% Native American, 0.2% Asian, and 1.5% from other races. The median household income was $41,250, and the median family income was $50,000.
The majority of Vienna Center residents are employed in the agricultural and forestry industries. The community is also home to several small businesses, including a gas station, a convenience store, and a few restaurants. The unemployment rate in Vienna Center is slightly higher than the national average.
Common Questions
What is Per Capita Income in Vienna Center?
Per Capita income in Vienna Center is $37,630.
What is the Median Family Income in Vienna Center?
Median Family Income in Vienna Center is $113,292.
What is the Median Household income in Vienna Center?
Median Household Income in Vienna Center is $60,855.
What is Income or Wage Gap in Vienna Center?
Income or Wage Gap in Vienna Center is 31.2%.
Women in Vienna Center earn 68.8 cents for every dollar earned by a man.
What is Inequality or Gini Index in Vienna Center?
Inequality or Gini Index in Vienna Center is 0.39.
What is the Total Population of Vienna Center?
Total Population of Vienna Center is 651.
What is the Total Male Population of Vienna Center?
Total Male Population of Vienna Center is 334.
What is the Total Female Population of Vienna Center?
Total Female Population of Vienna Center is 317.
What is the Ratio of Males per 100 Females in Vienna Center?
There are 105.36 Males per 100 Females in Vienna Center.
What is the Ratio of Females per 100 Males in Vienna Center?
There are 94.91 Females per 100 Males in Vienna Center.
What is the Median Population Age in Vienna Center?
Median Population Age in Vienna Center is 48.7 Years.
What is the Average Family Size in Vienna Center
Average Family Size in Vienna Center is 3.0 People.
What is the Average Household Size in Vienna Center
Average Household Size in Vienna Center is 2.3 People.
How Large is the Labor Force in Vienna Center?
There are 352 People in the Labor Forcein in Vienna Center.
What is the Percentage of People in the Labor Force in Vienna Center?
57.5% of People are in the Labor Force in Vienna Center.
What is the Unemployment Rate in Vienna Center?
Unemployment Rate in Vienna Center is 8.5%.