Pheasant Run, OH Map & Demographics
Pheasant Run Map
Pheasant Run Overview
$29,651
PER CAPITA INCOME
$77,045
AVG FAMILY INCOME
$66,875
AVG HOUSEHOLD INCOME
59.0%
WAGE / INCOME GAP [ % ]
41.0¢/ $1
WAGE / INCOME GAP [ $ ]
0.34
INEQUALITY / GINI INDEX
1,481
TOTAL POPULATION
881
MALE POPULATION
600
FEMALE POPULATION
146.83
MALES / 100 FEMALES
68.10
FEMALES / 100 MALES
42.5
MEDIAN AGE
2.9
AVG FAMILY SIZE
2.6
AVG HOUSEHOLD SIZE
699
LABOR FORCE [ PEOPLE ]
59.4%
PERCENT IN LABOR FORCE
3.4%
UNEMPLOYMENT RATE
Income in Pheasant Run
Income Overview in Pheasant Run
Per Capita Income in Pheasant Run is $29,651, while median incomes of families and households are $77,045 and $66,875 respectively.
| Characteristic | Number | Measure |
| Per Capita Income | 1,481 | $29,651 |
| Median Family Income | 456 | $77,045 |
| Mean Family Income | 456 | $86,893 |
| Median Household Income | 564 | $66,875 |
| Mean Household Income | 564 | $79,431 |
| Income Deficit | 456 | $0 |
| Wage / Income Gap (%) | 1,481 | 58.97% |
| Wage / Income Gap ($) | 1,481 | 41.03¢ per $1 |
| Gini / Inequality Index | 1,481 | 0.34 |
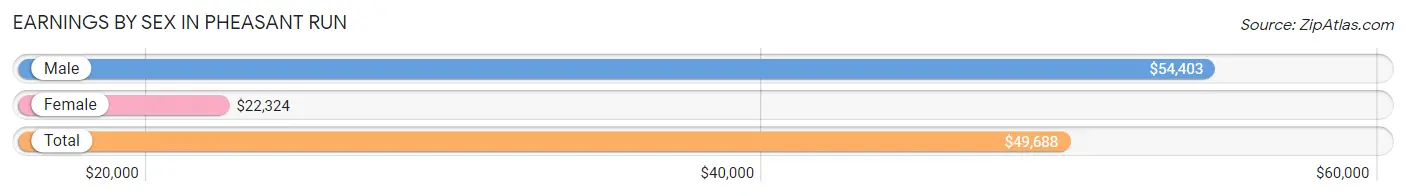
Earnings by Sex in Pheasant Run
Average Earnings in Pheasant Run are $49,688, $54,403 for men and $22,324 for women, a difference of 59.0%.
| Sex | Number | Average Earnings |
| Male | 419 (59.9%) | $54,403 |
| Female | 280 (40.1%) | $22,324 |
| Total | 699 (100.0%) | $49,688 |
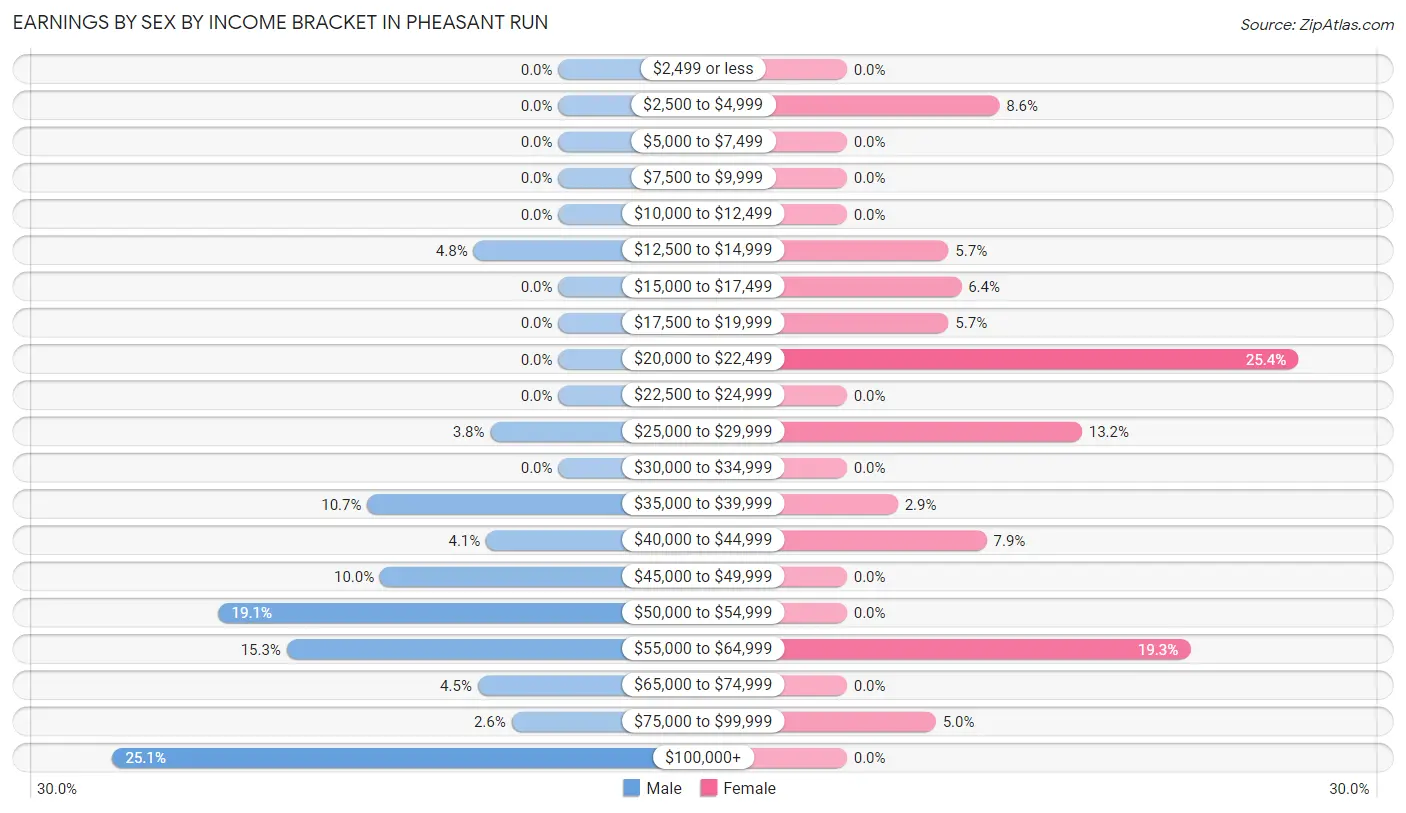
Earnings by Sex by Income Bracket in Pheasant Run
The most common earnings brackets in Pheasant Run are $100,000+ for men (105 | 25.1%) and $20,000 to $22,499 for women (71 | 25.4%).
| Income | Male | Female |
| $2,499 or less | 0 (0.0%) | 0 (0.0%) |
| $2,500 to $4,999 | 0 (0.0%) | 24 (8.6%) |
| $5,000 to $7,499 | 0 (0.0%) | 0 (0.0%) |
| $7,500 to $9,999 | 0 (0.0%) | 0 (0.0%) |
| $10,000 to $12,499 | 0 (0.0%) | 0 (0.0%) |
| $12,500 to $14,999 | 20 (4.8%) | 16 (5.7%) |
| $15,000 to $17,499 | 0 (0.0%) | 18 (6.4%) |
| $17,500 to $19,999 | 0 (0.0%) | 16 (5.7%) |
| $20,000 to $22,499 | 0 (0.0%) | 71 (25.4%) |
| $22,500 to $24,999 | 0 (0.0%) | 0 (0.0%) |
| $25,000 to $29,999 | 16 (3.8%) | 37 (13.2%) |
| $30,000 to $34,999 | 0 (0.0%) | 0 (0.0%) |
| $35,000 to $39,999 | 45 (10.7%) | 8 (2.9%) |
| $40,000 to $44,999 | 17 (4.1%) | 22 (7.9%) |
| $45,000 to $49,999 | 42 (10.0%) | 0 (0.0%) |
| $50,000 to $54,999 | 80 (19.1%) | 0 (0.0%) |
| $55,000 to $64,999 | 64 (15.3%) | 54 (19.3%) |
| $65,000 to $74,999 | 19 (4.5%) | 0 (0.0%) |
| $75,000 to $99,999 | 11 (2.6%) | 14 (5.0%) |
| $100,000+ | 105 (25.1%) | 0 (0.0%) |
| Total | 419 (100.0%) | 280 (100.0%) |
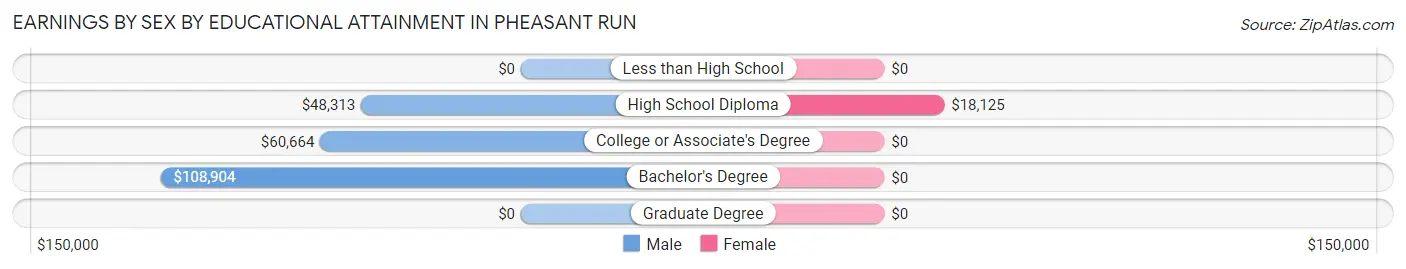
Earnings by Sex by Educational Attainment in Pheasant Run
Average earnings in Pheasant Run are $60,020 for men and $22,324 for women, a difference of 62.8%. Men with an educational attainment of bachelor's degree enjoy the highest average annual earnings of $108,904, while those with high school diploma education earn the least with $48,313. Women with an educational attainment of high school diploma earn the most with the average annual earnings of $18,125, while those with high school diploma education have the smallest earnings of $18,125.
| Educational Attainment | Male Income | Female Income |
| Less than High School | - | - |
| High School Diploma | $48,313 | $18,125 |
| College or Associate's Degree | $60,664 | $0 |
| Bachelor's Degree | $108,904 | $0 |
| Graduate Degree | - | - |
| Total | $60,020 | $22,324 |
Family Income in Pheasant Run
Family Income Brackets in Pheasant Run
According to the Pheasant Run family income data, there are 115 families falling into the $75,000 to $99,999 income range, which is the most common income bracket and makes up 25.2% of all families.
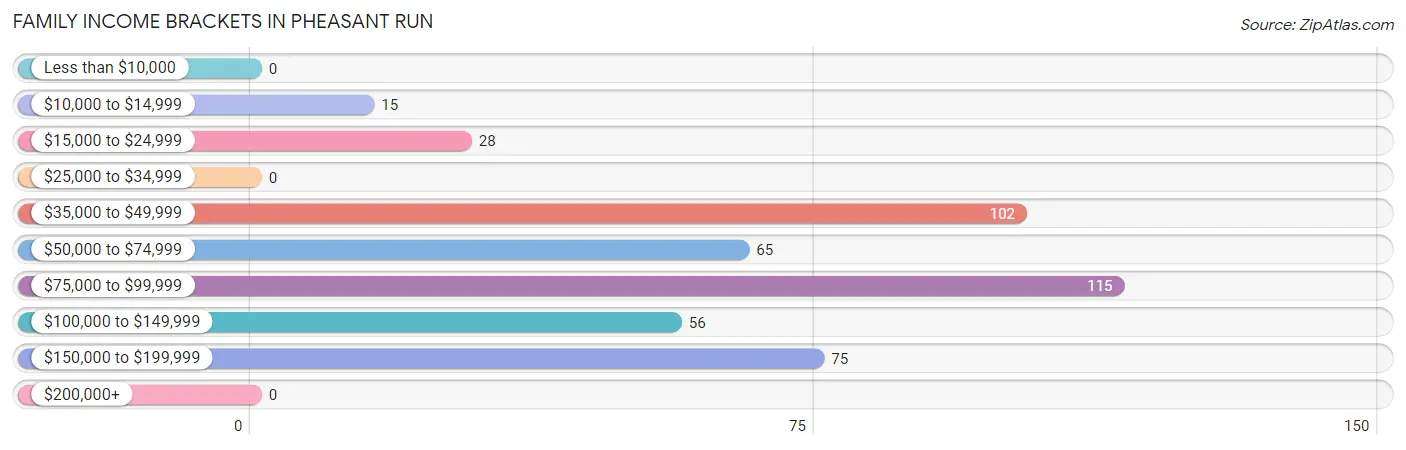
| Income Bracket | # Families | % Families |
| Less than $10,000 | 0 | 0.0% |
| $10,000 to $14,999 | 15 | 3.3% |
| $15,000 to $24,999 | 28 | 6.1% |
| $25,000 to $34,999 | 0 | 0.0% |
| $35,000 to $49,999 | 102 | 22.4% |
| $50,000 to $74,999 | 65 | 14.3% |
| $75,000 to $99,999 | 115 | 25.2% |
| $100,000 to $149,999 | 56 | 12.3% |
| $150,000 to $199,999 | 75 | 16.4% |
| $200,000+ | 0 | 0.0% |
Family Income by Famaliy Size in Pheasant Run
2-person families (227 | 49.8%) account for the highest median family income in Pheasant Run with $54,313 per family, while 2-person families (227 | 49.8%) have the highest median income of $27,156 per family member.
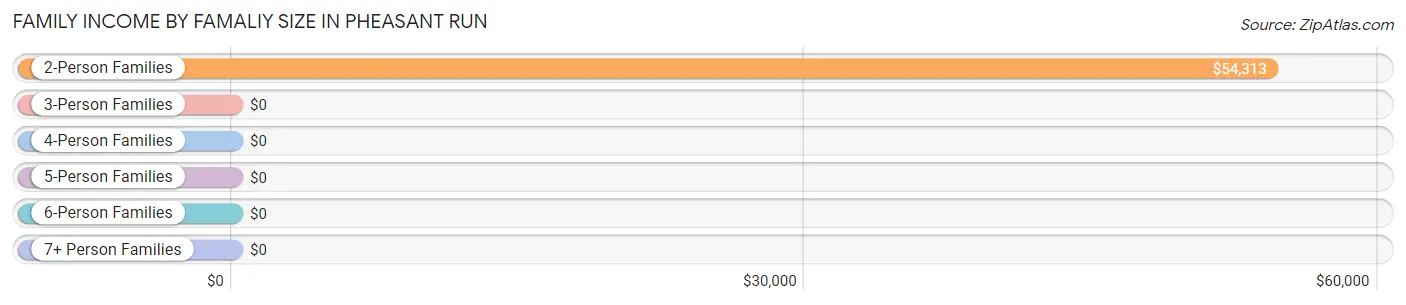
| Income Bracket | # Families | Median Income |
| 2-Person Families | 227 (49.8%) | $54,313 |
| 3-Person Families | 61 (13.4%) | $0 |
| 4-Person Families | 150 (32.9%) | $0 |
| 5-Person Families | 18 (4.0%) | $0 |
| 6-Person Families | 0 (0.0%) | $0 |
| 7+ Person Families | 0 (0.0%) | $0 |
| Total | 456 (100.0%) | $77,045 |
Family Income by Number of Earners in Pheasant Run
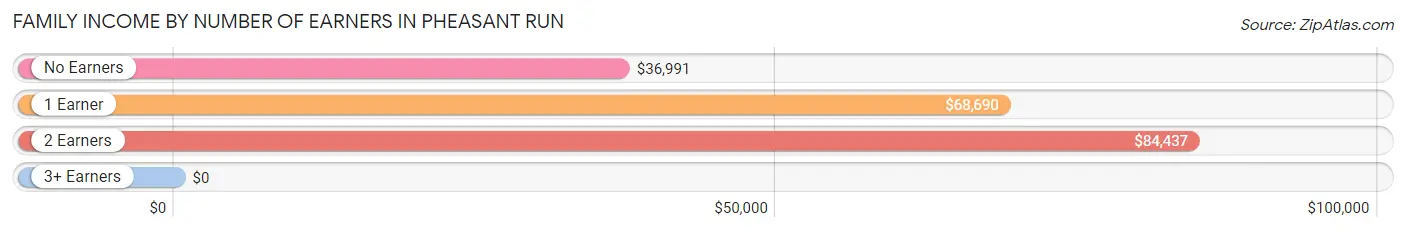
| Number of Earners | # Families | Median Income |
| No Earners | 129 (28.3%) | $36,991 |
| 1 Earner | 76 (16.7%) | $68,690 |
| 2 Earners | 218 (47.8%) | $84,437 |
| 3+ Earners | 33 (7.2%) | $0 |
| Total | 456 (100.0%) | $77,045 |
Household Income in Pheasant Run
Household Income Brackets in Pheasant Run
With 142 households falling in the category, the $35,000 to $49,999 income range is the most frequent in Pheasant Run, accounting for 25.2% of all households.
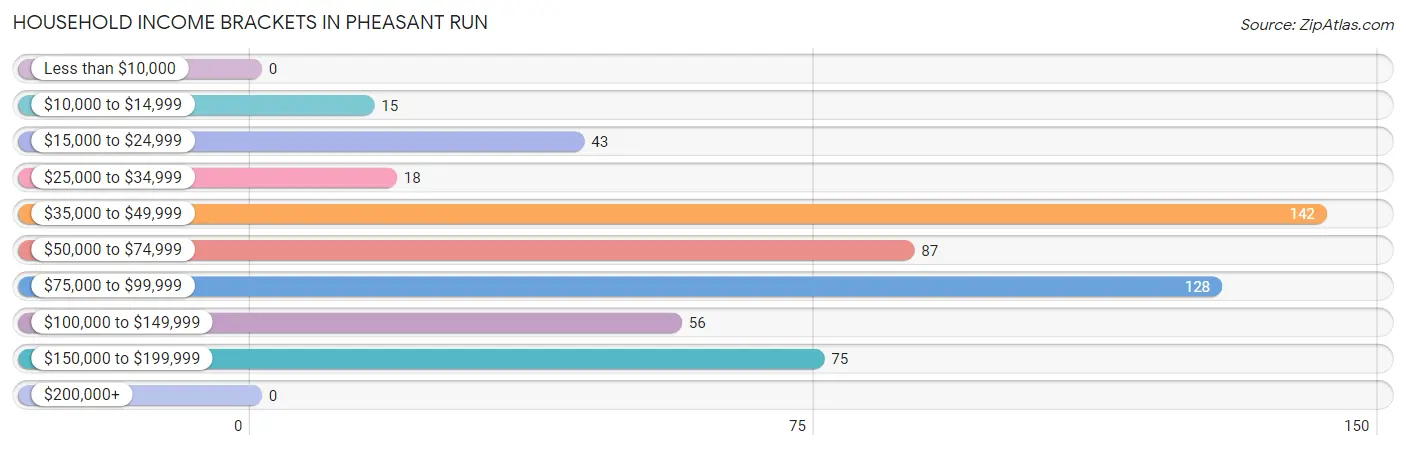
| Income Bracket | # Households | % Households |
| Less than $10,000 | 0 | 0.0% |
| $10,000 to $14,999 | 15 | 2.7% |
| $15,000 to $24,999 | 43 | 7.6% |
| $25,000 to $34,999 | 18 | 3.2% |
| $35,000 to $49,999 | 142 | 25.2% |
| $50,000 to $74,999 | 87 | 15.4% |
| $75,000 to $99,999 | 128 | 22.7% |
| $100,000 to $149,999 | 56 | 9.9% |
| $150,000 to $199,999 | 75 | 13.3% |
| $200,000+ | 0 | 0.0% |
Household Income by Householder Age in Pheasant Run
The median household income in Pheasant Run is $66,875, with the highest median household income of $84,366 found in the 25 to 44 years age bracket for the primary householder. A total of 194 households (34.4%) fall into this category.
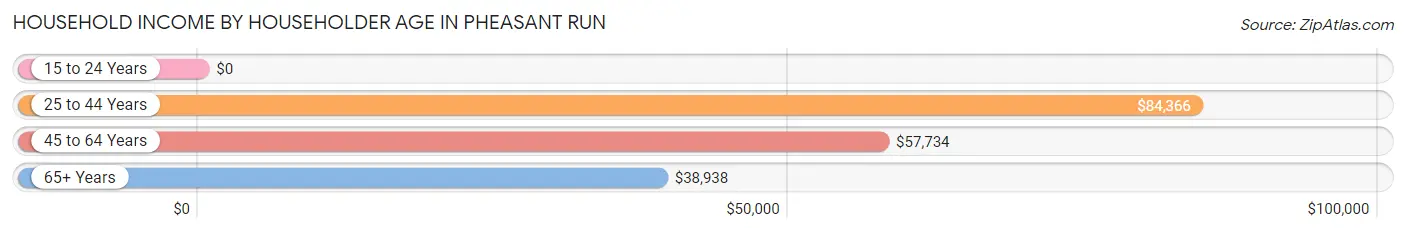
| Income Bracket | # Households | Median Income |
| 15 to 24 Years | 0 (0.0%) | $0 |
| 25 to 44 Years | 194 (34.4%) | $84,366 |
| 45 to 64 Years | 261 (46.3%) | $57,734 |
| 65+ Years | 109 (19.3%) | $38,938 |
| Total | 564 (100.0%) | $66,875 |
Poverty in Pheasant Run
Income Below Poverty by Sex and Age in Pheasant Run
With 1.7% poverty level for males and 5.7% for females among the residents of Pheasant Run, 55 to 64 year old males and 45 to 54 year old females are the most vulnerable to poverty, with 15 males (10.4%) and 20 females (17.2%) in their respective age groups living below the poverty level.
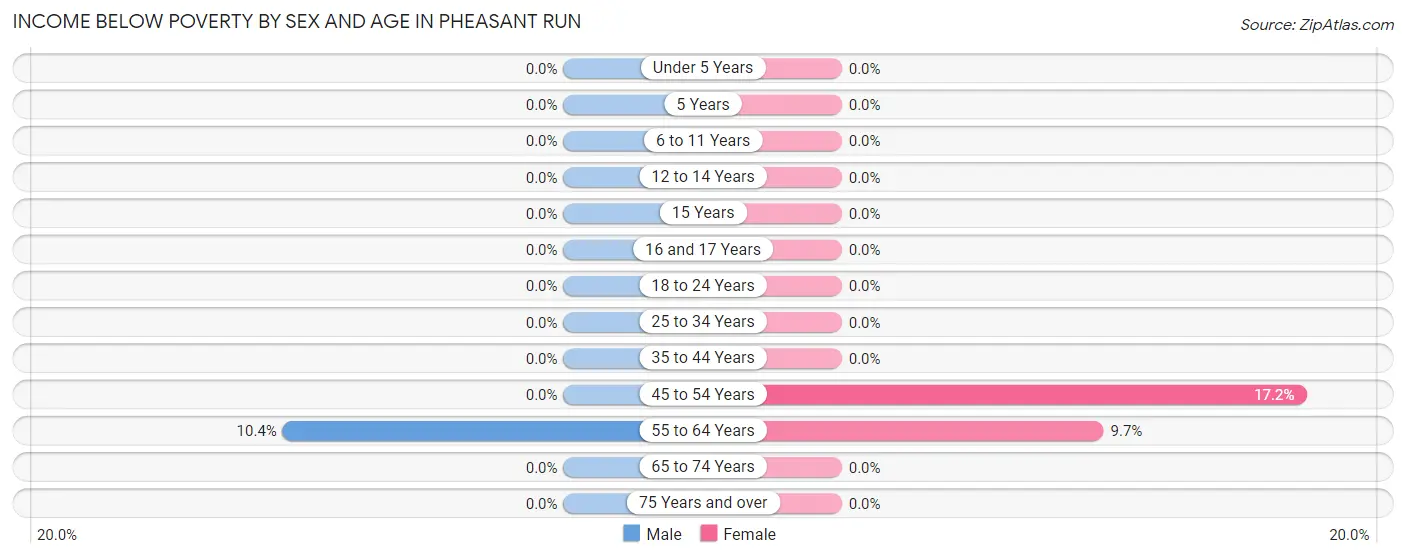
| Age Bracket | Male | Female |
| Under 5 Years | 0 (0.0%) | 0 (0.0%) |
| 5 Years | 0 (0.0%) | 0 (0.0%) |
| 6 to 11 Years | 0 (0.0%) | 0 (0.0%) |
| 12 to 14 Years | 0 (0.0%) | 0 (0.0%) |
| 15 Years | 0 (0.0%) | 0 (0.0%) |
| 16 and 17 Years | 0 (0.0%) | 0 (0.0%) |
| 18 to 24 Years | 0 (0.0%) | 0 (0.0%) |
| 25 to 34 Years | 0 (0.0%) | 0 (0.0%) |
| 35 to 44 Years | 0 (0.0%) | 0 (0.0%) |
| 45 to 54 Years | 0 (0.0%) | 20 (17.2%) |
| 55 to 64 Years | 15 (10.4%) | 14 (9.7%) |
| 65 to 74 Years | 0 (0.0%) | 0 (0.0%) |
| 75 Years and over | 0 (0.0%) | 0 (0.0%) |
| Total | 15 (1.7%) | 34 (5.7%) |
Income Above Poverty by Sex and Age in Pheasant Run
According to the poverty statistics in Pheasant Run, males aged under 5 years and females aged under 5 years are the age groups that are most secure financially, with 100.0% of males and 100.0% of females in these age groups living above the poverty line.
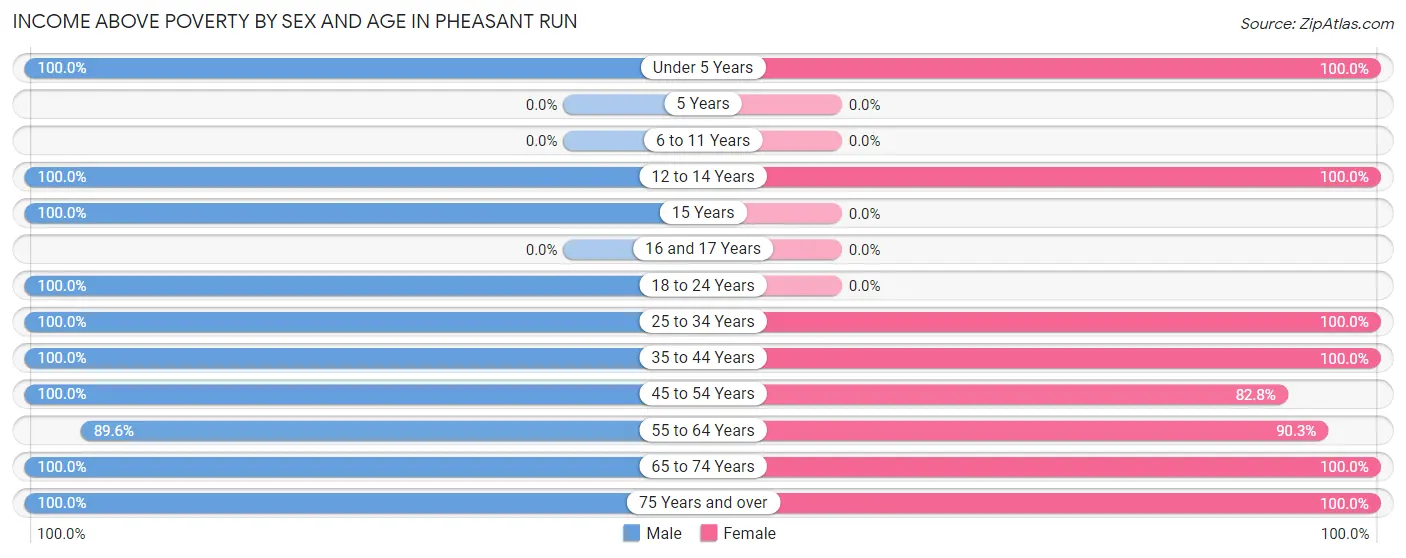
| Age Bracket | Male | Female |
| Under 5 Years | 97 (100.0%) | 66 (100.0%) |
| 5 Years | 0 (0.0%) | 0 (0.0%) |
| 6 to 11 Years | 0 (0.0%) | 0 (0.0%) |
| 12 to 14 Years | 77 (100.0%) | 18 (100.0%) |
| 15 Years | 47 (100.0%) | 0 (0.0%) |
| 16 and 17 Years | 0 (0.0%) | 0 (0.0%) |
| 18 to 24 Years | 22 (100.0%) | 0 (0.0%) |
| 25 to 34 Years | 204 (100.0%) | 139 (100.0%) |
| 35 to 44 Years | 128 (100.0%) | 41 (100.0%) |
| 45 to 54 Years | 63 (100.0%) | 96 (82.8%) |
| 55 to 64 Years | 129 (89.6%) | 130 (90.3%) |
| 65 to 74 Years | 64 (100.0%) | 48 (100.0%) |
| 75 Years and over | 35 (100.0%) | 28 (100.0%) |
| Total | 866 (98.3%) | 566 (94.3%) |
Income Below Poverty Among Married-Couple Families in Pheasant Run
The poverty statistics for married-couple families in Pheasant Run show that 3.4% or 15 of the total 438 families live below the poverty line. Families with no children have the highest poverty rate of 5.6%, comprising of 15 families. On the other hand, families with 1 or 2 children have the lowest poverty rate of 0.0%, which includes 0 families.
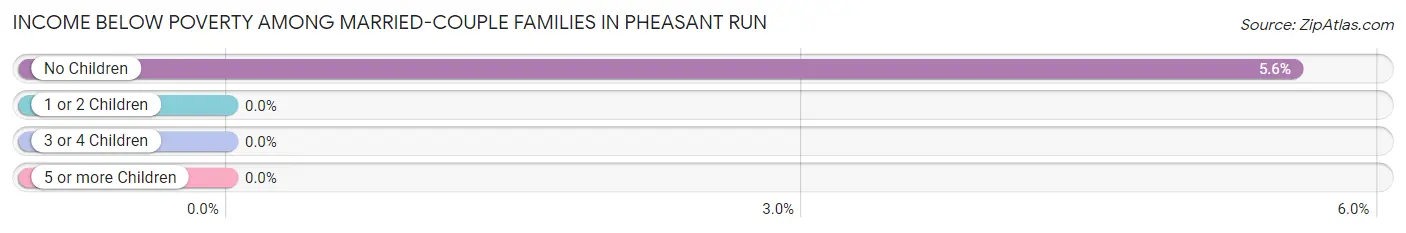
| Children | Above Poverty | Below Poverty |
| No Children | 255 (94.4%) | 15 (5.6%) |
| 1 or 2 Children | 168 (100.0%) | 0 (0.0%) |
| 3 or 4 Children | 0 (0.0%) | 0 (0.0%) |
| 5 or more Children | 0 (0.0%) | 0 (0.0%) |
| Total | 423 (96.6%) | 15 (3.4%) |
Income Below Poverty Among Single-Parent Households in Pheasant Run
| Children | Single Father | Single Mother |
| No Children | 0 (0.0%) | 0 (0.0%) |
| 1 or 2 Children | 0 (0.0%) | 0 (0.0%) |
| 3 or 4 Children | 0 (0.0%) | 0 (0.0%) |
| 5 or more Children | 0 (0.0%) | 0 (0.0%) |
| Total | 0 (0.0%) | 0 (0.0%) |
Income Below Poverty Among Married-Couple vs Single-Parent Households in Pheasant Run
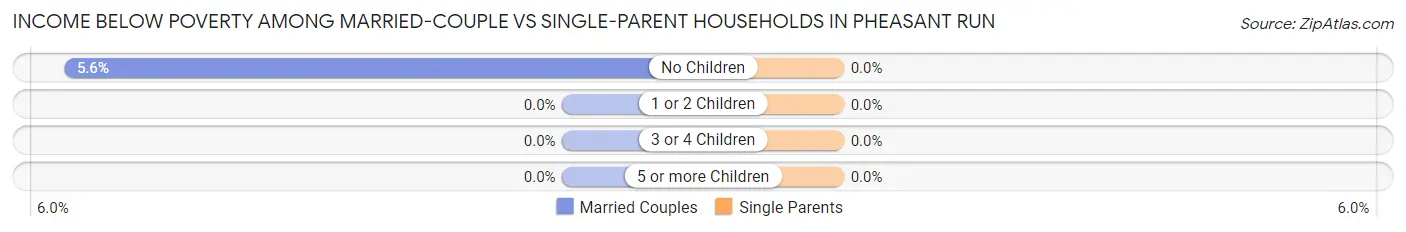
| Children | Married-Couple Families | Single-Parent Households |
| No Children | 15 (5.6%) | 0 (0.0%) |
| 1 or 2 Children | 0 (0.0%) | 0 (0.0%) |
| 3 or 4 Children | 0 (0.0%) | 0 (0.0%) |
| 5 or more Children | 0 (0.0%) | 0 (0.0%) |
| Total | 15 (3.4%) | 0 (0.0%) |
Race in Pheasant Run
The most populous races in Pheasant Run are White / Caucasian (1,451 | 98.0%), Hispanic or Latino (66 | 4.5%), and Two or more Races (30 | 2.0%).
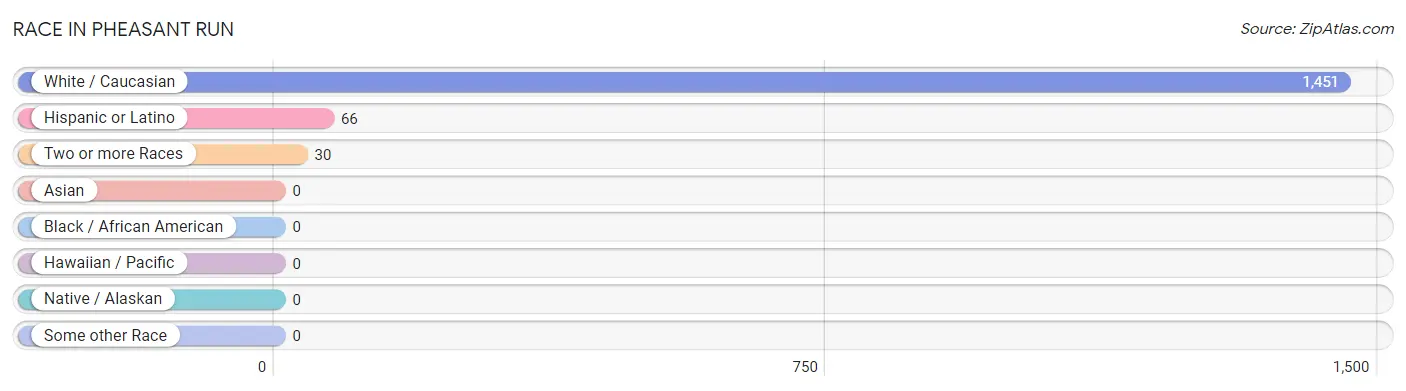
| Race | # Population | % Population |
| Asian | 0 | 0.0% |
| Black / African American | 0 | 0.0% |
| Hawaiian / Pacific | 0 | 0.0% |
| Hispanic or Latino | 66 | 4.5% |
| Native / Alaskan | 0 | 0.0% |
| White / Caucasian | 1,451 | 98.0% |
| Two or more Races | 30 | 2.0% |
| Some other Race | 0 | 0.0% |
| Total | 1,481 | 100.0% |
Ancestry in Pheasant Run
The most populous ancestries reported in Pheasant Run are German (600 | 40.5%), English (319 | 21.5%), Italian (291 | 19.7%), Irish (272 | 18.4%), and Polish (118 | 8.0%), together accounting for 108.0% of all Pheasant Run residents.
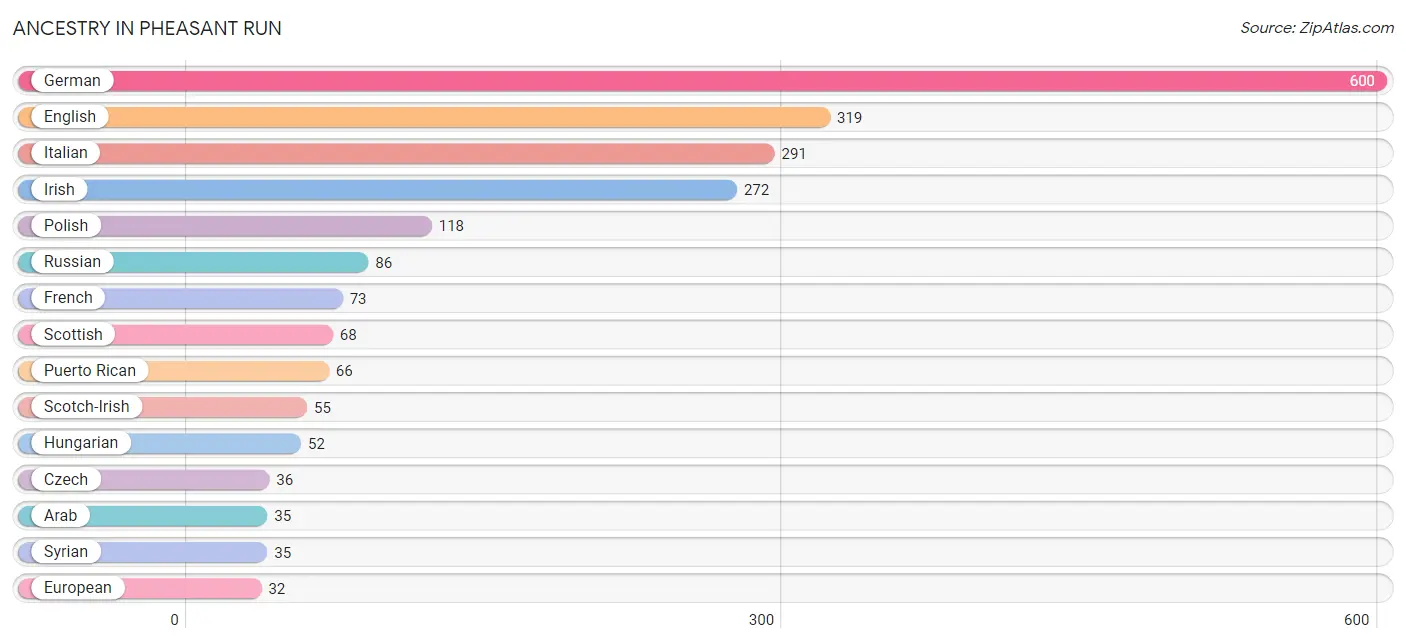
| Ancestry | # Population | % Population |
| American | 26 | 1.8% |
| Arab | 35 | 2.4% |
| British | 22 | 1.5% |
| Czech | 36 | 2.4% |
| Czechoslovakian | 14 | 0.9% |
| English | 319 | 21.5% |
| European | 32 | 2.2% |
| French | 73 | 4.9% |
| German | 600 | 40.5% |
| Hungarian | 52 | 3.5% |
| Irish | 272 | 18.4% |
| Italian | 291 | 19.7% |
| Polish | 118 | 8.0% |
| Puerto Rican | 66 | 4.5% |
| Russian | 86 | 5.8% |
| Scotch-Irish | 55 | 3.7% |
| Scottish | 68 | 4.6% |
| Slovak | 11 | 0.7% |
| Slovene | 28 | 1.9% |
| Syrian | 35 | 2.4% |
| Ukrainian | 20 | 1.3% |
| Welsh | 20 | 1.3% | View All 22 Rows |
Immigrants in Pheasant Run

| Immigration Origin | # Population | % Population | View All 0 Rows |
Sex and Age in Pheasant Run
Sex and Age in Pheasant Run
The most populous age groups in Pheasant Run are 30 to 34 Years (139 | 15.8%) for men and 30 to 34 Years (117 | 19.5%) for women.
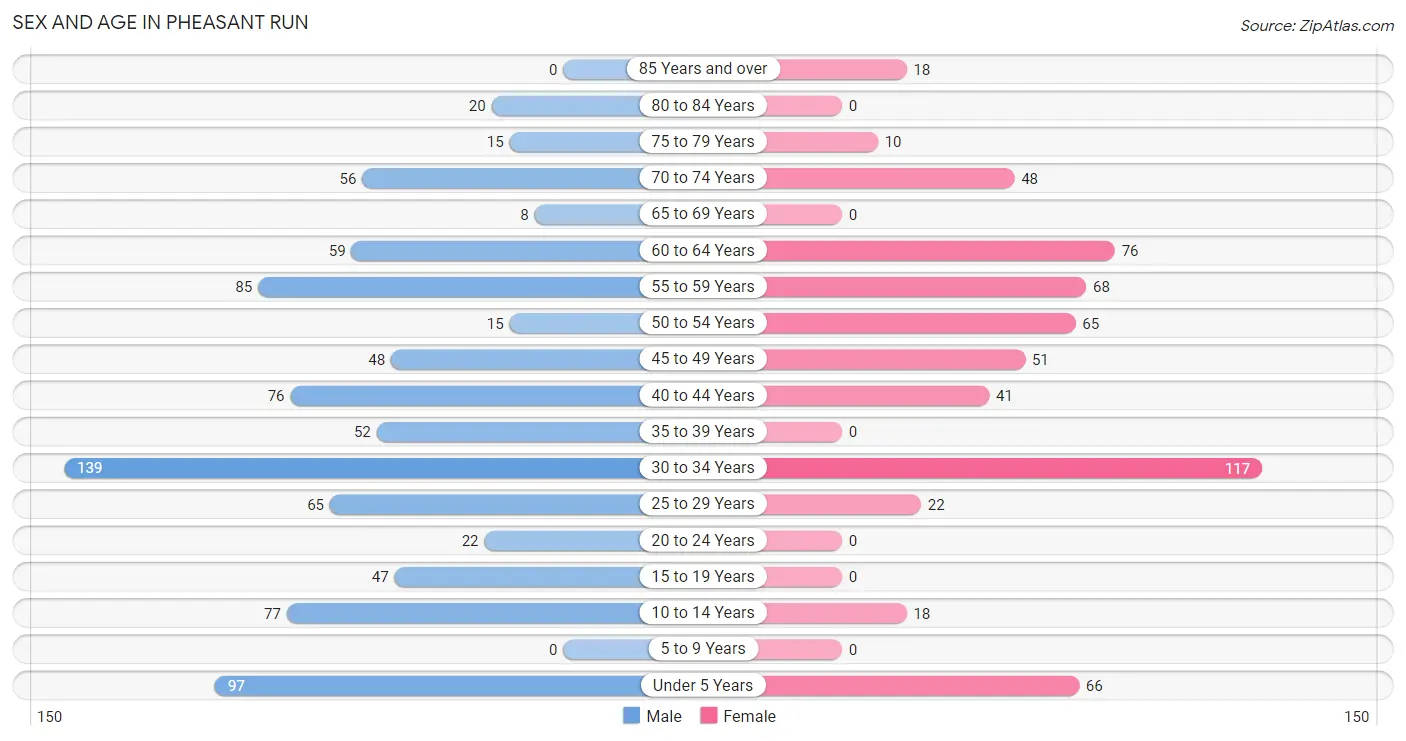
| Age Bracket | Male | Female |
| Under 5 Years | 97 (11.0%) | 66 (11.0%) |
| 5 to 9 Years | 0 (0.0%) | 0 (0.0%) |
| 10 to 14 Years | 77 (8.7%) | 18 (3.0%) |
| 15 to 19 Years | 47 (5.3%) | 0 (0.0%) |
| 20 to 24 Years | 22 (2.5%) | 0 (0.0%) |
| 25 to 29 Years | 65 (7.4%) | 22 (3.7%) |
| 30 to 34 Years | 139 (15.8%) | 117 (19.5%) |
| 35 to 39 Years | 52 (5.9%) | 0 (0.0%) |
| 40 to 44 Years | 76 (8.6%) | 41 (6.8%) |
| 45 to 49 Years | 48 (5.4%) | 51 (8.5%) |
| 50 to 54 Years | 15 (1.7%) | 65 (10.8%) |
| 55 to 59 Years | 85 (9.7%) | 68 (11.3%) |
| 60 to 64 Years | 59 (6.7%) | 76 (12.7%) |
| 65 to 69 Years | 8 (0.9%) | 0 (0.0%) |
| 70 to 74 Years | 56 (6.4%) | 48 (8.0%) |
| 75 to 79 Years | 15 (1.7%) | 10 (1.7%) |
| 80 to 84 Years | 20 (2.3%) | 0 (0.0%) |
| 85 Years and over | 0 (0.0%) | 18 (3.0%) |
| Total | 881 (100.0%) | 600 (100.0%) |
Families and Households in Pheasant Run
Median Family Size in Pheasant Run
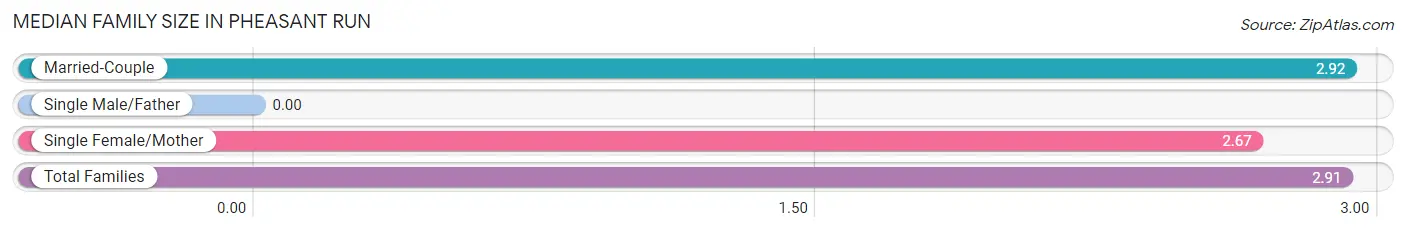
| Family Type | # Families | Family Size |
| Married-Couple | 438 (96.1%) | 2.92 |
| Single Male/Father | 0 (0.0%) | - |
| Single Female/Mother | 18 (4.0%) | 2.67 |
| Total Families | 456 (100.0%) | 2.91 |
Median Household Size in Pheasant Run
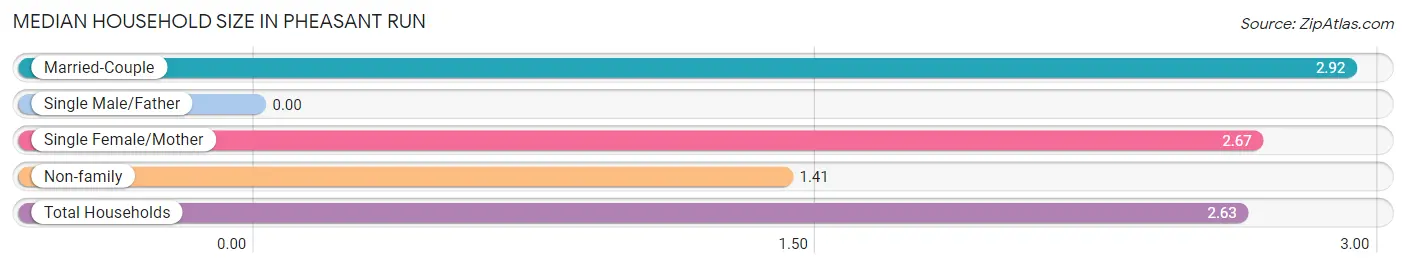
| Household Type | # Households | Household Size |
| Married-Couple | 438 (77.7%) | 2.92 |
| Single Male/Father | 0 (0.0%) | - |
| Single Female/Mother | 18 (3.2%) | 2.67 |
| Non-family | 108 (19.2%) | 1.41 |
| Total Households | 564 (100.0%) | 2.63 |
Household Size by Marriage Status in Pheasant Run
Out of a total of 564 households in Pheasant Run, 456 (80.8%) are family households, while 108 (19.2%) are nonfamily households. The most numerous type of family households are 2-person households, comprising 227, and the most common type of nonfamily households are 1-person households, comprising 71.
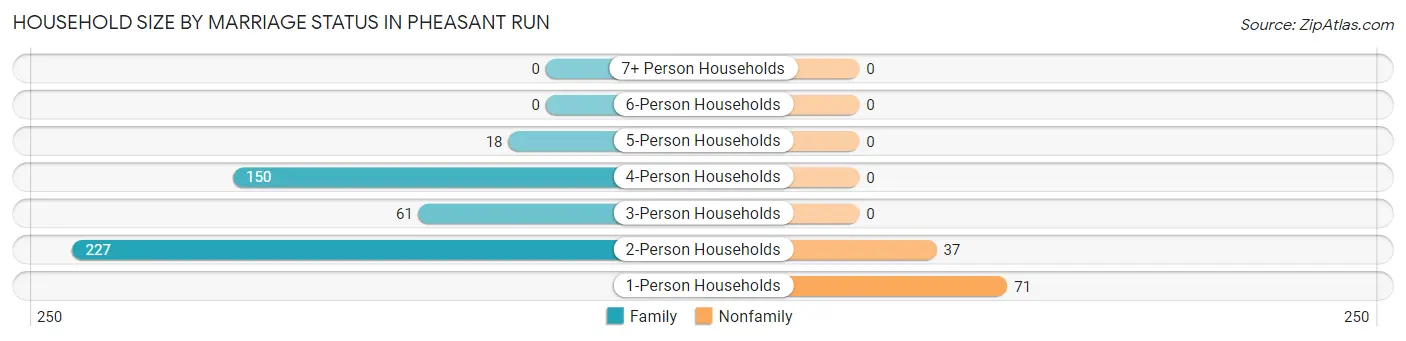
| Household Size | Family Households | Nonfamily Households |
| 1-Person Households | - | 71 (12.6%) |
| 2-Person Households | 227 (40.3%) | 37 (6.6%) |
| 3-Person Households | 61 (10.8%) | 0 (0.0%) |
| 4-Person Households | 150 (26.6%) | 0 (0.0%) |
| 5-Person Households | 18 (3.2%) | 0 (0.0%) |
| 6-Person Households | 0 (0.0%) | 0 (0.0%) |
| 7+ Person Households | 0 (0.0%) | 0 (0.0%) |
| Total | 456 (80.8%) | 108 (19.2%) |
Female Fertility in Pheasant Run
Fertility by Age in Pheasant Run
Average fertility rate in Pheasant Run is 290.0 births per 1,000 women. Women in the age bracket of 20 to 34 years have the highest fertility rate with 511.0 births per 1,000 women. Women in the age bracket of 20 to 34 years acount for 100.0% of all women with births.
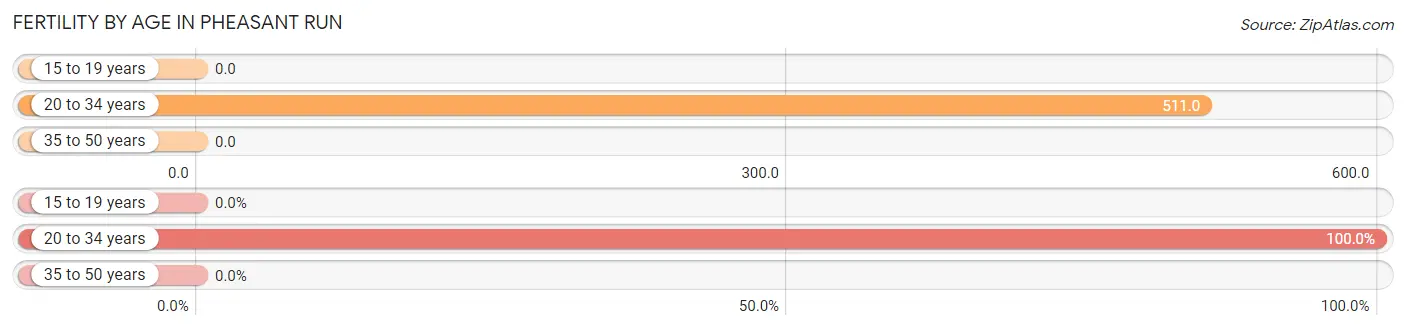
| Age Bracket | Women with Births | Births / 1,000 Women |
| 15 to 19 years | 0 (0.0%) | 0.0 |
| 20 to 34 years | 71 (100.0%) | 511.0 |
| 35 to 50 years | 0 (0.0%) | 0.0 |
| Total | 71 (100.0%) | 290.0 |
Fertility by Age by Marriage Status in Pheasant Run
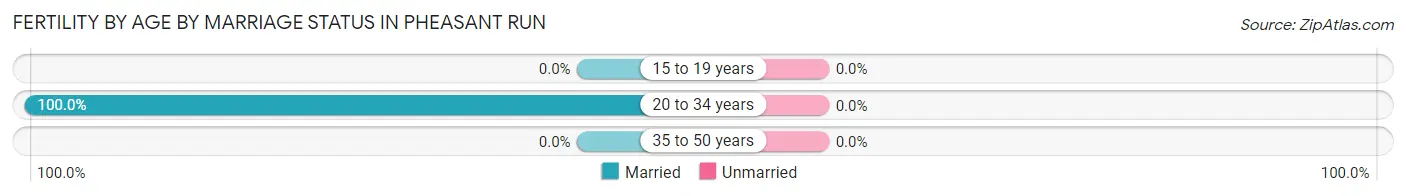
| Age Bracket | Married | Unmarried |
| 15 to 19 years | 0 (0.0%) | 0 (0.0%) |
| 20 to 34 years | 71 (100.0%) | 0 (0.0%) |
| 35 to 50 years | 0 (0.0%) | 0 (0.0%) |
| Total | 71 (100.0%) | 0 (0.0%) |
Fertility by Education in Pheasant Run
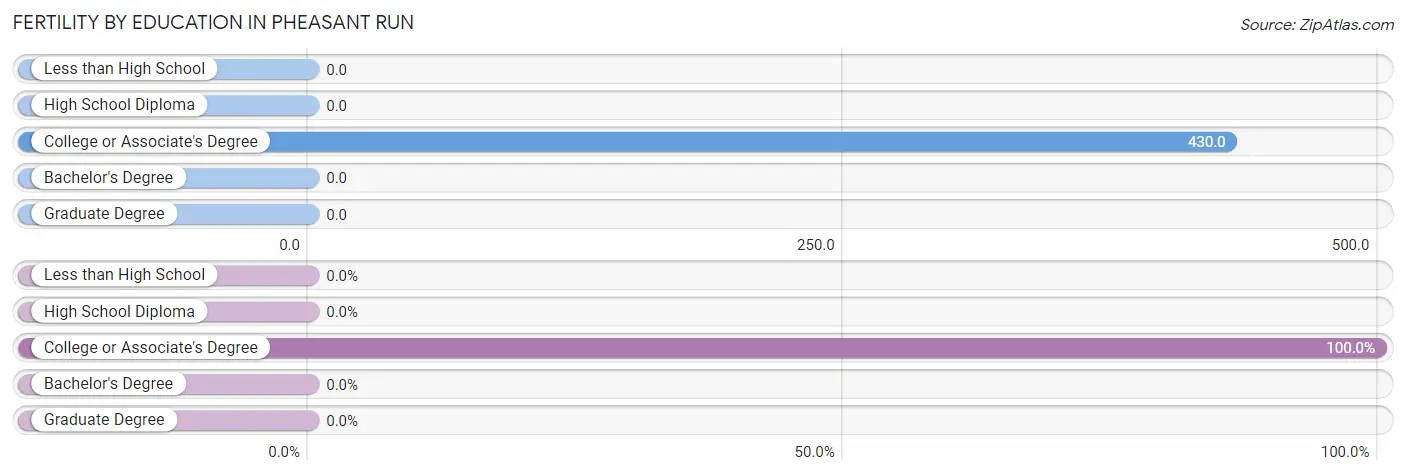
| Educational Attainment | Women with Births | Births / 1,000 Women |
| Less than High School | 0 (0.0%) | 0.0 |
| High School Diploma | 0 (0.0%) | 0.0 |
| College or Associate's Degree | 71 (100.0%) | 430.0 |
| Bachelor's Degree | 0 (0.0%) | 0.0 |
| Graduate Degree | 0 (0.0%) | 0.0 |
| Total | 71 (100.0%) | 290.0 |
Fertility by Education by Marriage Status in Pheasant Run
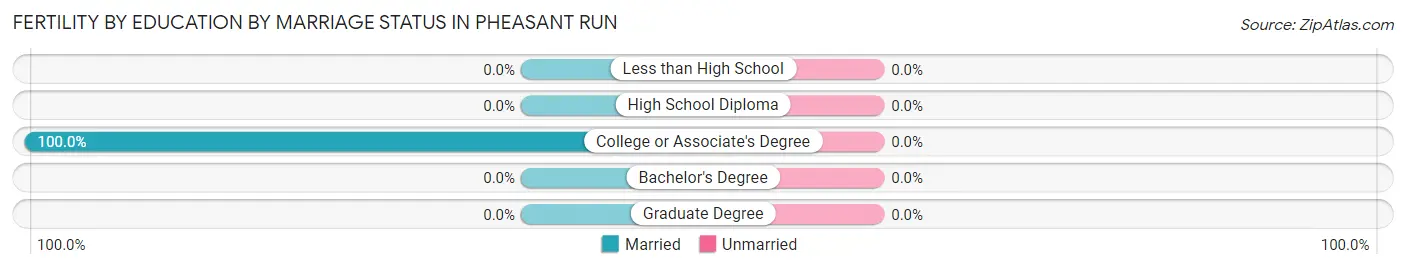
| Educational Attainment | Married | Unmarried |
| Less than High School | 0 (0.0%) | 0 (0.0%) |
| High School Diploma | 0 (0.0%) | 0 (0.0%) |
| College or Associate's Degree | 71 (100.0%) | 0 (0.0%) |
| Bachelor's Degree | 0 (0.0%) | 0 (0.0%) |
| Graduate Degree | 0 (0.0%) | 0 (0.0%) |
| Total | 71 (100.0%) | 0 (0.0%) |
Employment Characteristics in Pheasant Run
Employment by Class of Employer in Pheasant Run
Among the 589 employed individuals in Pheasant Run, private company employees (470 | 79.8%), not-for-profit organizations (63 | 10.7%), and local government employees (56 | 9.5%) make up the most common classes of employment.
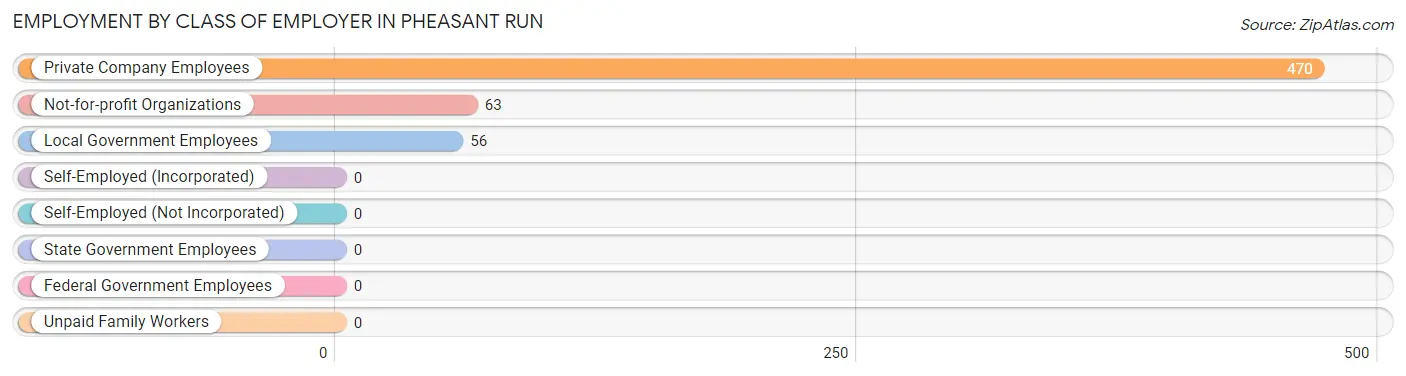
| Employer Class | # Employees | % Employees |
| Private Company Employees | 470 | 79.8% |
| Self-Employed (Incorporated) | 0 | 0.0% |
| Self-Employed (Not Incorporated) | 0 | 0.0% |
| Not-for-profit Organizations | 63 | 10.7% |
| Local Government Employees | 56 | 9.5% |
| State Government Employees | 0 | 0.0% |
| Federal Government Employees | 0 | 0.0% |
| Unpaid Family Workers | 0 | 0.0% |
| Total | 589 | 100.0% |
Employment Status by Age in Pheasant Run
According to the labor force statistics for Pheasant Run, out of the total population over 16 years of age (1,176), 59.4% or 699 individuals are in the labor force, with 3.4% or 24 of them unemployed. The age group with the highest labor force participation rate is 20 to 24 years, with 100.0% or 22 individuals in the labor force. Within the labor force, the 30 to 34 years age range has the highest percentage of unemployed individuals, with 11.9% or 24 of them being unemployed.
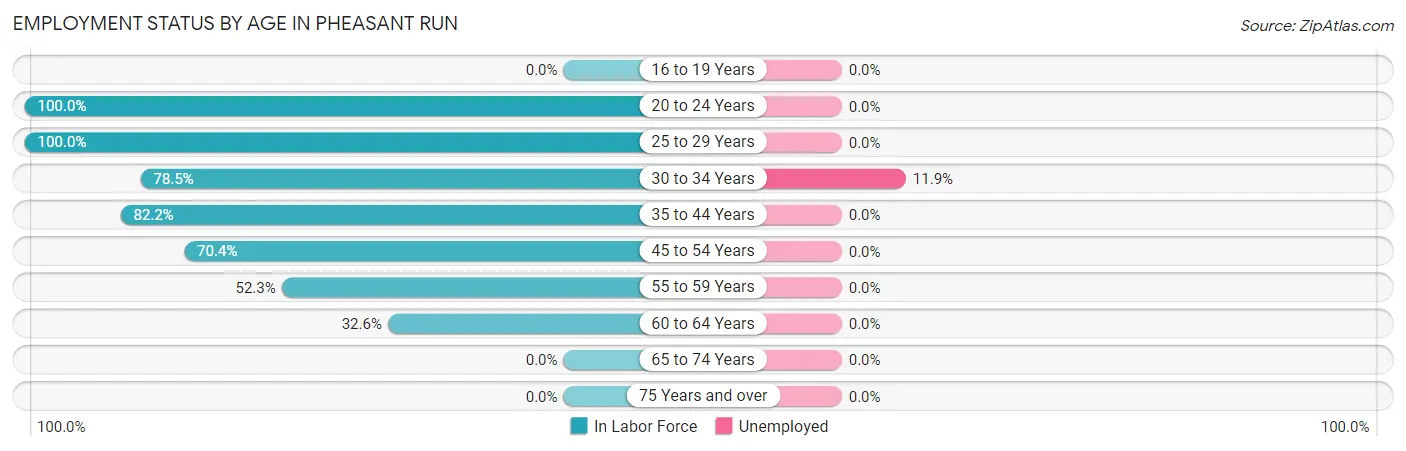
| Age Bracket | In Labor Force | Unemployed |
| 16 to 19 Years | 0 (0.0%) | 0 (0.0%) |
| 20 to 24 Years | 22 (100.0%) | 0 (0.0%) |
| 25 to 29 Years | 87 (100.0%) | 0 (0.0%) |
| 30 to 34 Years | 201 (78.5%) | 24 (11.9%) |
| 35 to 44 Years | 139 (82.2%) | 0 (0.0%) |
| 45 to 54 Years | 126 (70.4%) | 0 (0.0%) |
| 55 to 59 Years | 80 (52.3%) | 0 (0.0%) |
| 60 to 64 Years | 44 (32.6%) | 0 (0.0%) |
| 65 to 74 Years | 0 (0.0%) | 0 (0.0%) |
| 75 Years and over | 0 (0.0%) | 0 (0.0%) |
| Total | 699 (59.4%) | 24 (3.4%) |
Employment Status by Educational Attainment in Pheasant Run
According to labor force statistics for Pheasant Run, 69.2% of individuals (677) out of the total population between 25 and 64 years of age (979) are in the labor force, with 3.5% or 24 of them being unemployed. The group with the highest labor force participation rate are those with the educational attainment of bachelor's degree or higher, with 100.0% or 130 individuals in the labor force. Within the labor force, individuals with college / associate degree education have the highest percentage of unemployment, with 6.7% or 24 of them being unemployed.
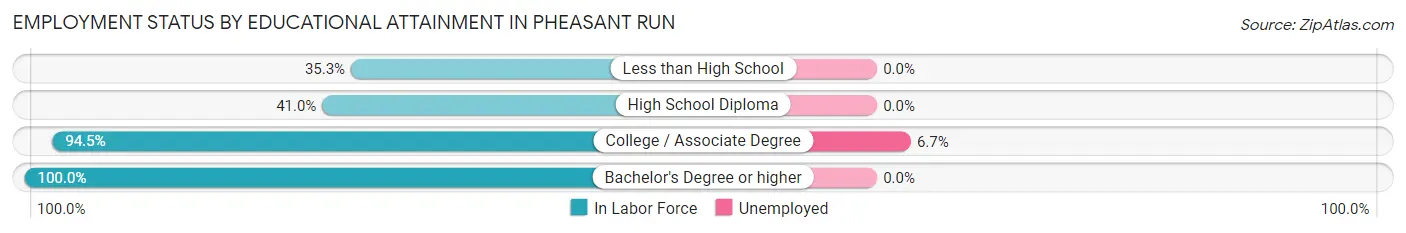
| Educational Attainment | In Labor Force | Unemployed |
| Less than High School | 24 (35.3%) | 0 (0.0%) |
| High School Diploma | 165 (41.0%) | 0 (0.0%) |
| College / Associate Degree | 358 (94.5%) | 25 (6.7%) |
| Bachelor's Degree or higher | 130 (100.0%) | 0 (0.0%) |
| Total | 677 (69.2%) | 34 (3.5%) |
Employment Occupations by Sex in Pheasant Run
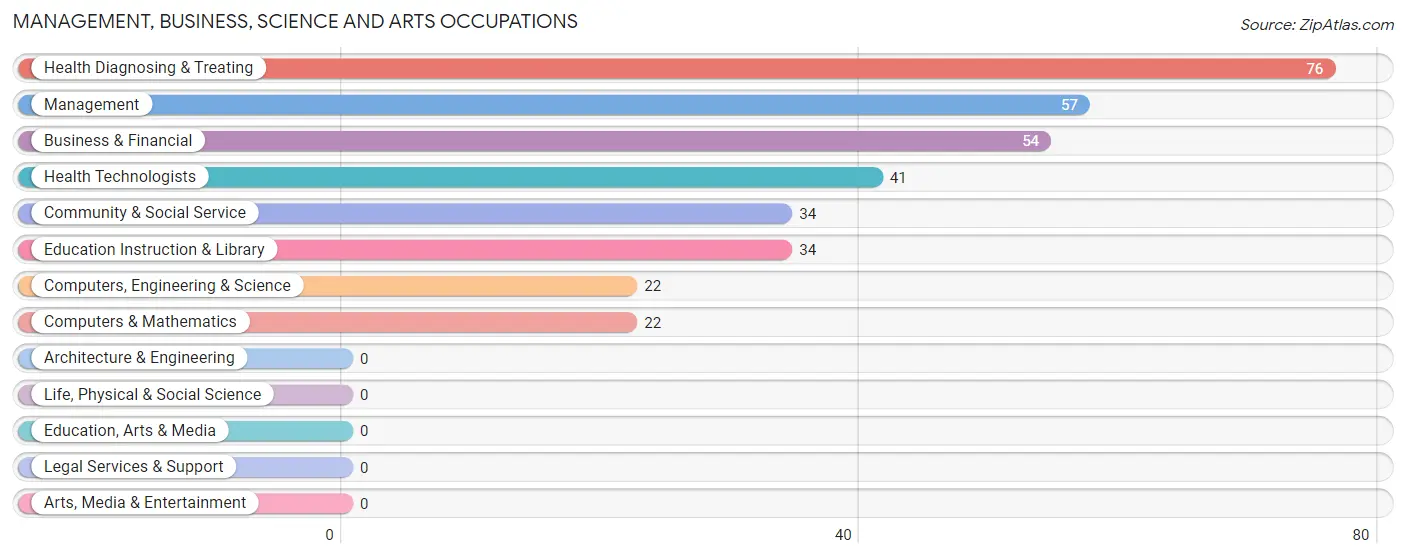
Management, Business, Science and Arts Occupations
The most common Management, Business, Science and Arts occupations in Pheasant Run are Health Diagnosing & Treating (76 | 11.3%), Management (57 | 8.4%), Business & Financial (54 | 8.0%), Health Technologists (41 | 6.1%), and Community & Social Service (34 | 5.0%).
Management, Business, Science and Arts Occupations by Sex
Within the Management, Business, Science and Arts occupations in Pheasant Run, the most male-oriented occupations are Management (100.0%), Business & Financial (33.3%), and Health Diagnosing & Treating (26.3%), while the most female-oriented occupations are Computers, Engineering & Science (100.0%), Computers & Mathematics (100.0%), and Community & Social Service (100.0%).
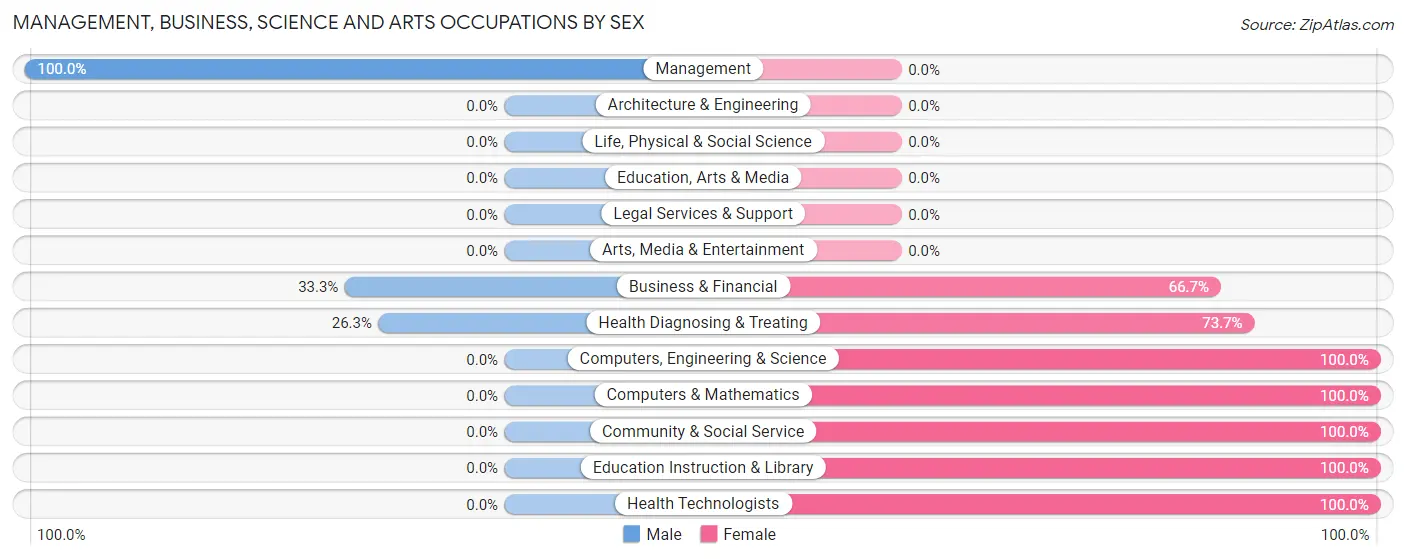
| Occupation | Male | Female |
| Management | 57 (100.0%) | 0 (0.0%) |
| Business & Financial | 18 (33.3%) | 36 (66.7%) |
| Computers, Engineering & Science | 0 (0.0%) | 22 (100.0%) |
| Computers & Mathematics | 0 (0.0%) | 22 (100.0%) |
| Architecture & Engineering | 0 (0.0%) | 0 (0.0%) |
| Life, Physical & Social Science | 0 (0.0%) | 0 (0.0%) |
| Community & Social Service | 0 (0.0%) | 34 (100.0%) |
| Education, Arts & Media | 0 (0.0%) | 0 (0.0%) |
| Legal Services & Support | 0 (0.0%) | 0 (0.0%) |
| Education Instruction & Library | 0 (0.0%) | 34 (100.0%) |
| Arts, Media & Entertainment | 0 (0.0%) | 0 (0.0%) |
| Health Diagnosing & Treating | 20 (26.3%) | 56 (73.7%) |
| Health Technologists | 0 (0.0%) | 41 (100.0%) |
| Total (Category) | 95 (39.1%) | 148 (60.9%) |
| Total (Overall) | 419 (62.1%) | 256 (37.9%) |
Services Occupations
Services Occupations by Sex
| Occupation | Male | Female |
| Healthcare Support | 0 (0.0%) | 0 (0.0%) |
| Security & Protection | 0 (0.0%) | 0 (0.0%) |
| Firefighting & Prevention | 0 (0.0%) | 0 (0.0%) |
| Law Enforcement | 0 (0.0%) | 0 (0.0%) |
| Food Preparation & Serving | 0 (0.0%) | 0 (0.0%) |
| Cleaning & Maintenance | 0 (0.0%) | 0 (0.0%) |
| Personal Care & Service | 0 (0.0%) | 0 (0.0%) |
| Total (Category) | 0 (0.0%) | 0 (0.0%) |
| Total (Overall) | 419 (62.1%) | 256 (37.9%) |
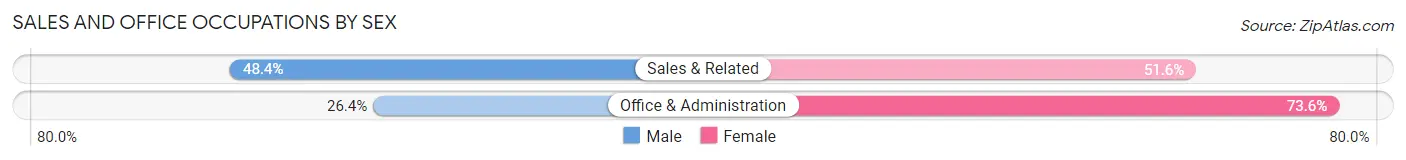
Sales and Office Occupations
The most common Sales and Office occupations in Pheasant Run are Office & Administration (125 | 18.5%), and Sales & Related (31 | 4.6%).
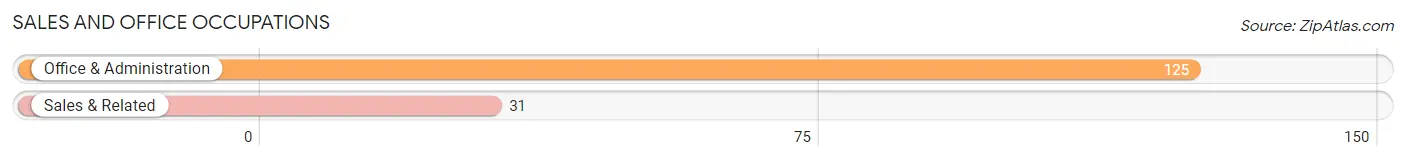
Sales and Office Occupations by Sex
| Occupation | Male | Female |
| Sales & Related | 15 (48.4%) | 16 (51.6%) |
| Office & Administration | 33 (26.4%) | 92 (73.6%) |
| Total (Category) | 48 (30.8%) | 108 (69.2%) |
| Total (Overall) | 419 (62.1%) | 256 (37.9%) |
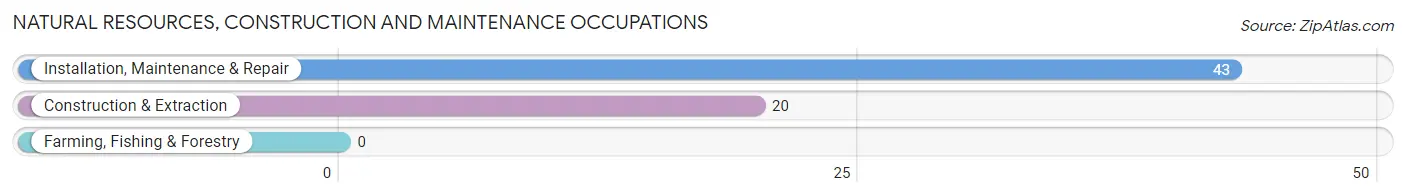
Natural Resources, Construction and Maintenance Occupations
The most common Natural Resources, Construction and Maintenance occupations in Pheasant Run are Installation, Maintenance & Repair (43 | 6.4%), and Construction & Extraction (20 | 3.0%).
Natural Resources, Construction and Maintenance Occupations by Sex
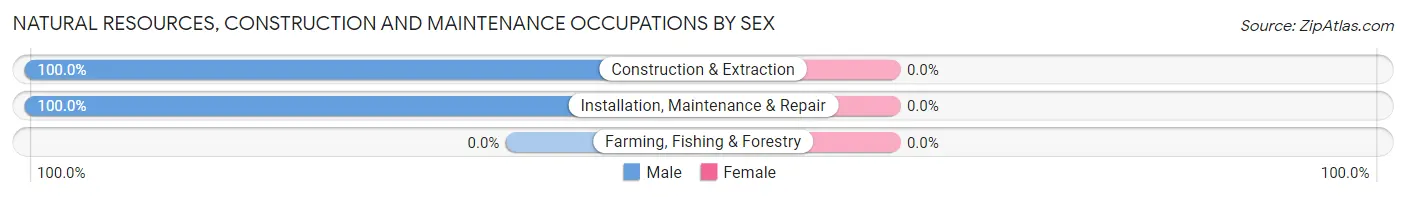
| Occupation | Male | Female |
| Farming, Fishing & Forestry | 0 (0.0%) | 0 (0.0%) |
| Construction & Extraction | 20 (100.0%) | 0 (0.0%) |
| Installation, Maintenance & Repair | 43 (100.0%) | 0 (0.0%) |
| Total (Category) | 63 (100.0%) | 0 (0.0%) |
| Total (Overall) | 419 (62.1%) | 256 (37.9%) |
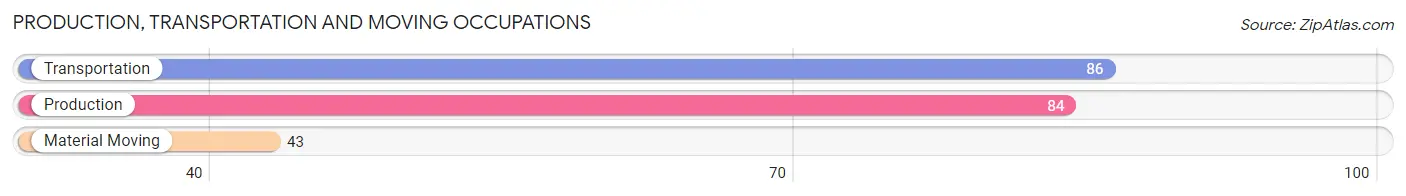
Production, Transportation and Moving Occupations
The most common Production, Transportation and Moving occupations in Pheasant Run are Transportation (86 | 12.7%), Production (84 | 12.4%), and Material Moving (43 | 6.4%).
Production, Transportation and Moving Occupations by Sex
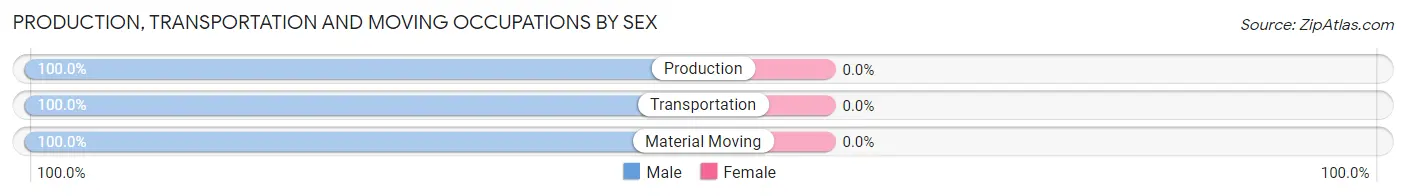
| Occupation | Male | Female |
| Production | 84 (100.0%) | 0 (0.0%) |
| Transportation | 86 (100.0%) | 0 (0.0%) |
| Material Moving | 43 (100.0%) | 0 (0.0%) |
| Total (Category) | 213 (100.0%) | 0 (0.0%) |
| Total (Overall) | 419 (62.1%) | 256 (37.9%) |
Employment Industries by Sex in Pheasant Run
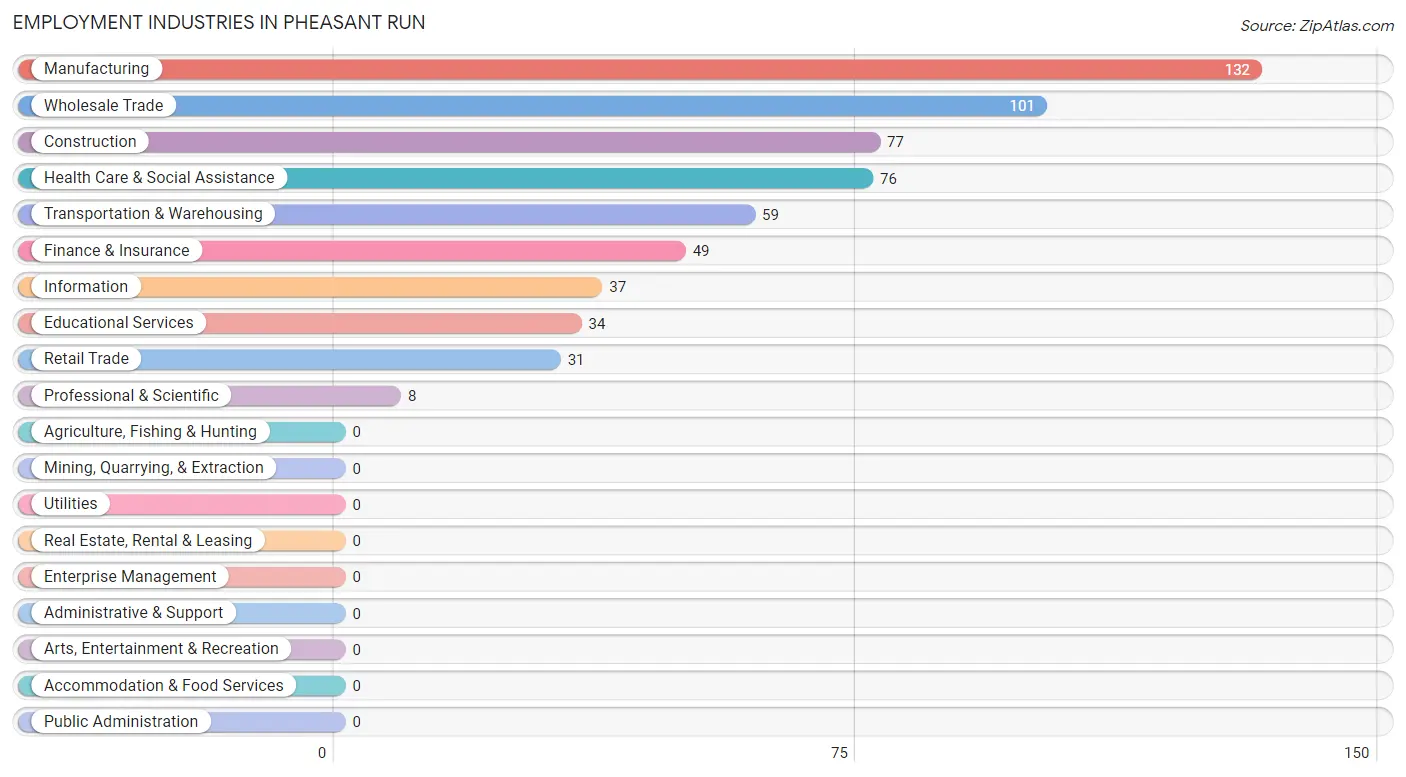
Employment Industries in Pheasant Run
The major employment industries in Pheasant Run include Manufacturing (132 | 19.6%), Wholesale Trade (101 | 15.0%), Construction (77 | 11.4%), Health Care & Social Assistance (76 | 11.3%), and Transportation & Warehousing (59 | 8.7%).
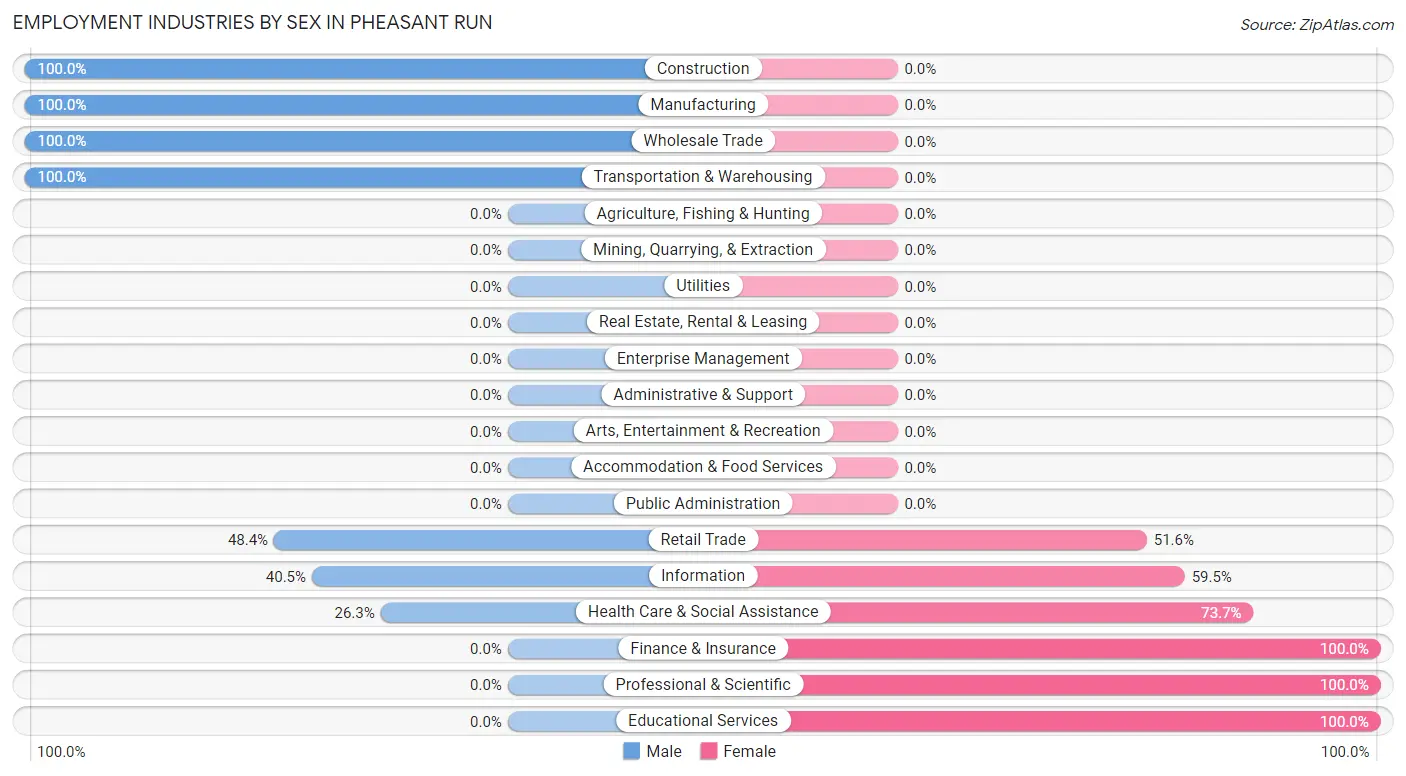
Employment Industries by Sex in Pheasant Run
The Pheasant Run industries that see more men than women are Construction (100.0%), Manufacturing (100.0%), and Wholesale Trade (100.0%), whereas the industries that tend to have a higher number of women are Finance & Insurance (100.0%), Professional & Scientific (100.0%), and Educational Services (100.0%).
| Industry | Male | Female |
| Agriculture, Fishing & Hunting | 0 (0.0%) | 0 (0.0%) |
| Mining, Quarrying, & Extraction | 0 (0.0%) | 0 (0.0%) |
| Construction | 77 (100.0%) | 0 (0.0%) |
| Manufacturing | 132 (100.0%) | 0 (0.0%) |
| Wholesale Trade | 101 (100.0%) | 0 (0.0%) |
| Retail Trade | 15 (48.4%) | 16 (51.6%) |
| Transportation & Warehousing | 59 (100.0%) | 0 (0.0%) |
| Utilities | 0 (0.0%) | 0 (0.0%) |
| Information | 15 (40.5%) | 22 (59.5%) |
| Finance & Insurance | 0 (0.0%) | 49 (100.0%) |
| Real Estate, Rental & Leasing | 0 (0.0%) | 0 (0.0%) |
| Professional & Scientific | 0 (0.0%) | 8 (100.0%) |
| Enterprise Management | 0 (0.0%) | 0 (0.0%) |
| Administrative & Support | 0 (0.0%) | 0 (0.0%) |
| Educational Services | 0 (0.0%) | 34 (100.0%) |
| Health Care & Social Assistance | 20 (26.3%) | 56 (73.7%) |
| Arts, Entertainment & Recreation | 0 (0.0%) | 0 (0.0%) |
| Accommodation & Food Services | 0 (0.0%) | 0 (0.0%) |
| Public Administration | 0 (0.0%) | 0 (0.0%) |
| Total | 419 (62.1%) | 256 (37.9%) |
Education in Pheasant Run
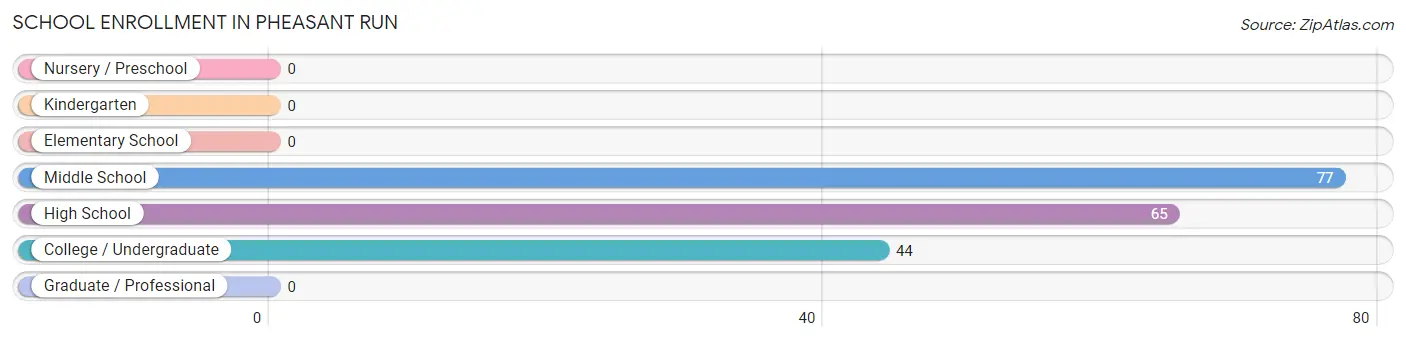
School Enrollment in Pheasant Run
The most common levels of schooling among the 186 students in Pheasant Run are middle school (77 | 41.4%), high school (65 | 34.9%), and college / undergraduate (44 | 23.7%).
| School Level | # Students | % Students |
| Nursery / Preschool | 0 | 0.0% |
| Kindergarten | 0 | 0.0% |
| Elementary School | 0 | 0.0% |
| Middle School | 77 | 41.4% |
| High School | 65 | 34.9% |
| College / Undergraduate | 44 | 23.7% |
| Graduate / Professional | 0 | 0.0% |
| Total | 186 | 100.0% |
School Enrollment by Age by Funding Source in Pheasant Run
Out of a total of 186 students who are enrolled in schools in Pheasant Run, 20 (10.8%) attend a private institution, while the remaining 166 (89.2%) are enrolled in public schools. The age group of 25 to 34 year olds has the highest likelihood of being enrolled in private schools, with 20 (45.5% in the age bracket) enrolled. Conversely, the age group of 10 to 14 year olds has the lowest likelihood of being enrolled in a private school, with 95 (100.0% in the age bracket) attending a public institution.
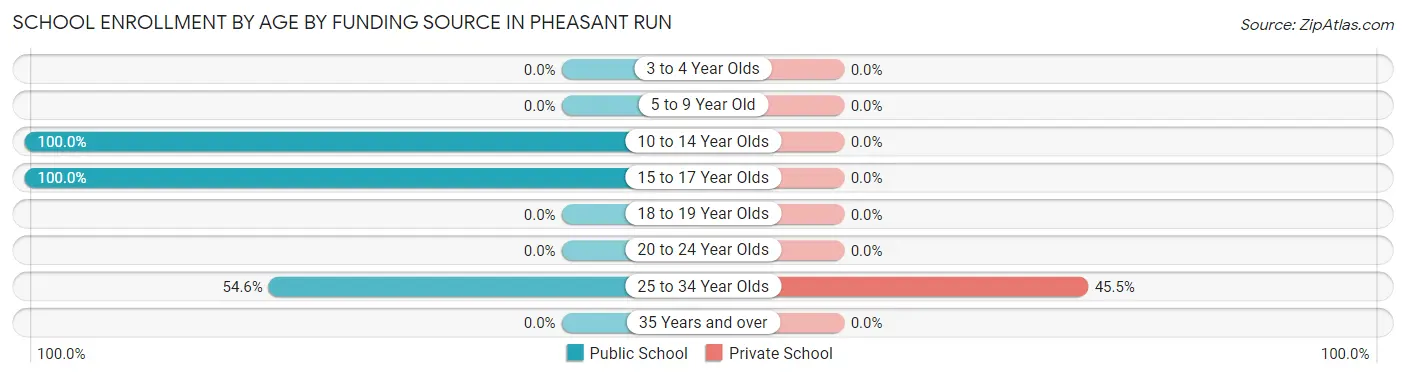
| Age Bracket | Public School | Private School |
| 3 to 4 Year Olds | 0 (0.0%) | 0 (0.0%) |
| 5 to 9 Year Old | 0 (0.0%) | 0 (0.0%) |
| 10 to 14 Year Olds | 95 (100.0%) | 0 (0.0%) |
| 15 to 17 Year Olds | 47 (100.0%) | 0 (0.0%) |
| 18 to 19 Year Olds | 0 (0.0%) | 0 (0.0%) |
| 20 to 24 Year Olds | 0 (0.0%) | 0 (0.0%) |
| 25 to 34 Year Olds | 24 (54.5%) | 20 (45.5%) |
| 35 Years and over | 0 (0.0%) | 0 (0.0%) |
| Total | 166 (89.2%) | 20 (10.8%) |
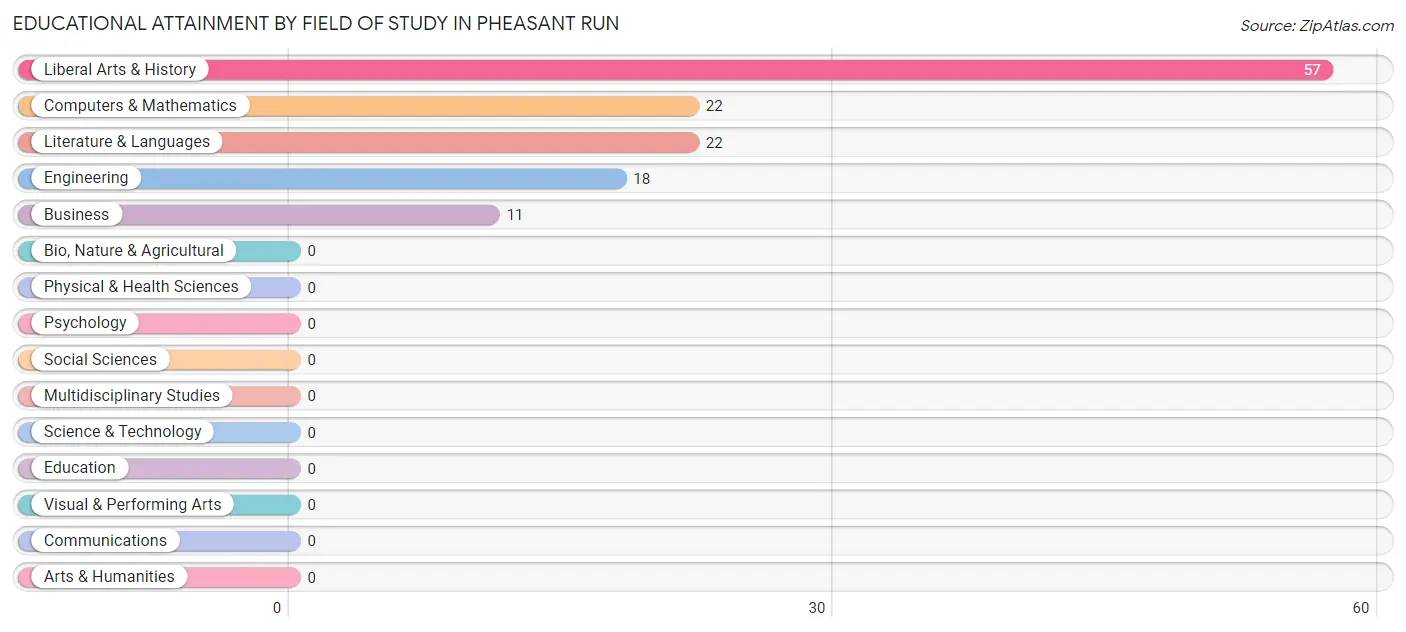
Educational Attainment by Field of Study in Pheasant Run
Liberal arts & history (57 | 43.9%), computers & mathematics (22 | 16.9%), literature & languages (22 | 16.9%), engineering (18 | 13.9%), and business (11 | 8.5%) are the most common fields of study among 130 individuals in Pheasant Run who have obtained a bachelor's degree or higher.
| Field of Study | # Graduates | % Graduates |
| Computers & Mathematics | 22 | 16.9% |
| Bio, Nature & Agricultural | 0 | 0.0% |
| Physical & Health Sciences | 0 | 0.0% |
| Psychology | 0 | 0.0% |
| Social Sciences | 0 | 0.0% |
| Engineering | 18 | 13.9% |
| Multidisciplinary Studies | 0 | 0.0% |
| Science & Technology | 0 | 0.0% |
| Business | 11 | 8.5% |
| Education | 0 | 0.0% |
| Literature & Languages | 22 | 16.9% |
| Liberal Arts & History | 57 | 43.9% |
| Visual & Performing Arts | 0 | 0.0% |
| Communications | 0 | 0.0% |
| Arts & Humanities | 0 | 0.0% |
| Total | 130 | 100.0% |
Transportation & Commute in Pheasant Run
Vehicle Availability by Sex in Pheasant Run
The most prevalent vehicle ownership categories in Pheasant Run are males with 2 vehicles (177, accounting for 42.2%) and females with 2 vehicles (62, making up 104.1%).
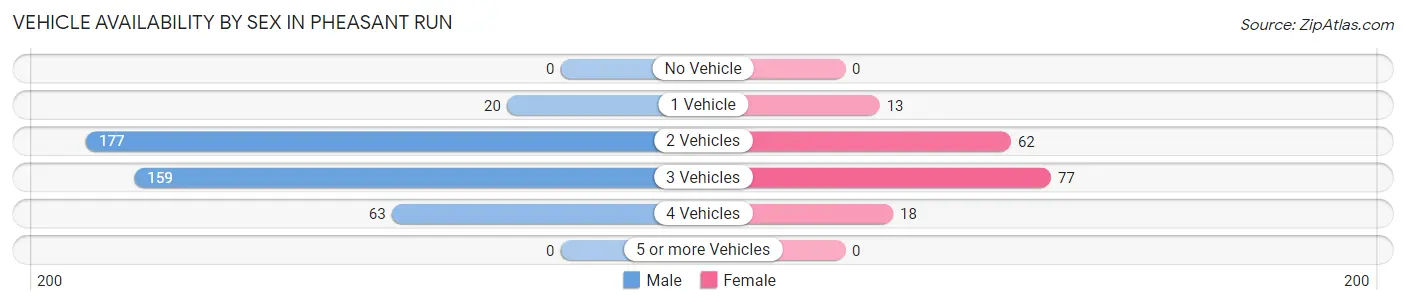
| Vehicles Available | Male | Female |
| No Vehicle | 0 (0.0%) | 0 (0.0%) |
| 1 Vehicle | 20 (4.8%) | 13 (7.6%) |
| 2 Vehicles | 177 (42.2%) | 62 (36.5%) |
| 3 Vehicles | 159 (38.0%) | 77 (45.3%) |
| 4 Vehicles | 63 (15.0%) | 18 (10.6%) |
| 5 or more Vehicles | 0 (0.0%) | 0 (0.0%) |
| Total | 419 (100.0%) | 170 (100.0%) |
Commute Time in Pheasant Run
The most frequently occuring commute durations in Pheasant Run are 35 to 39 minutes (147 commuters, 26.2%), 45 to 59 minutes (118 commuters, 21.0%), and 30 to 34 minutes (97 commuters, 17.3%).
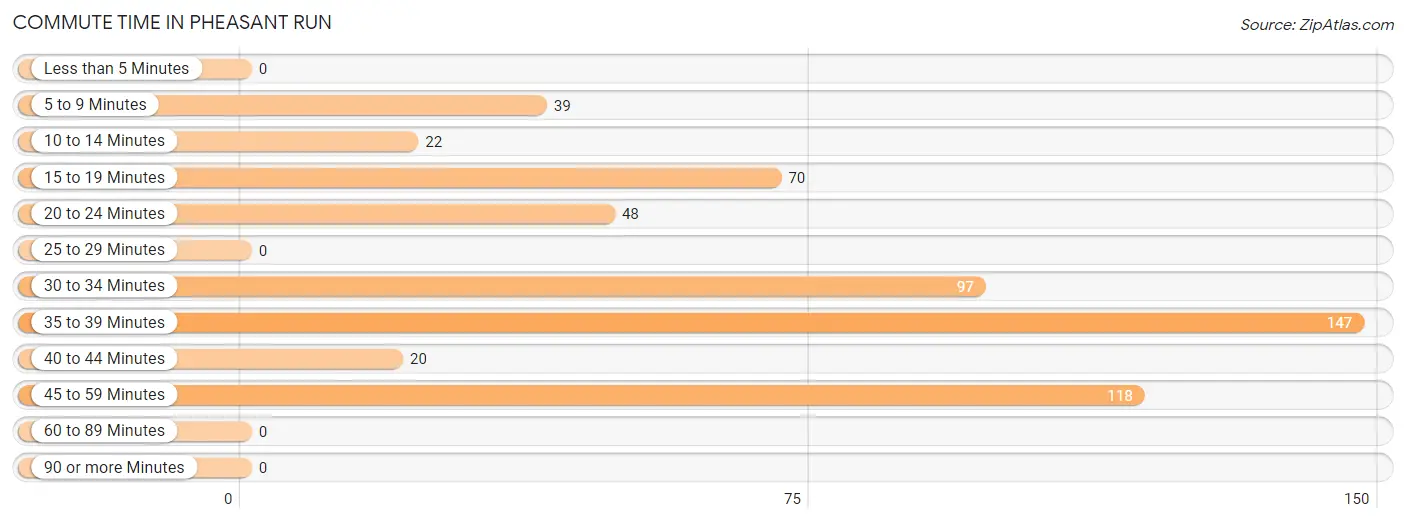
| Commute Time | # Commuters | % Commuters |
| Less than 5 Minutes | 0 | 0.0% |
| 5 to 9 Minutes | 39 | 7.0% |
| 10 to 14 Minutes | 22 | 3.9% |
| 15 to 19 Minutes | 70 | 12.5% |
| 20 to 24 Minutes | 48 | 8.6% |
| 25 to 29 Minutes | 0 | 0.0% |
| 30 to 34 Minutes | 97 | 17.3% |
| 35 to 39 Minutes | 147 | 26.2% |
| 40 to 44 Minutes | 20 | 3.6% |
| 45 to 59 Minutes | 118 | 21.0% |
| 60 to 89 Minutes | 0 | 0.0% |
| 90 or more Minutes | 0 | 0.0% |
Commute Time by Sex in Pheasant Run
The most common commute times in Pheasant Run are 35 to 39 minutes (147 commuters, 36.4%) for males and 30 to 34 minutes (57 commuters, 36.3%) for females.
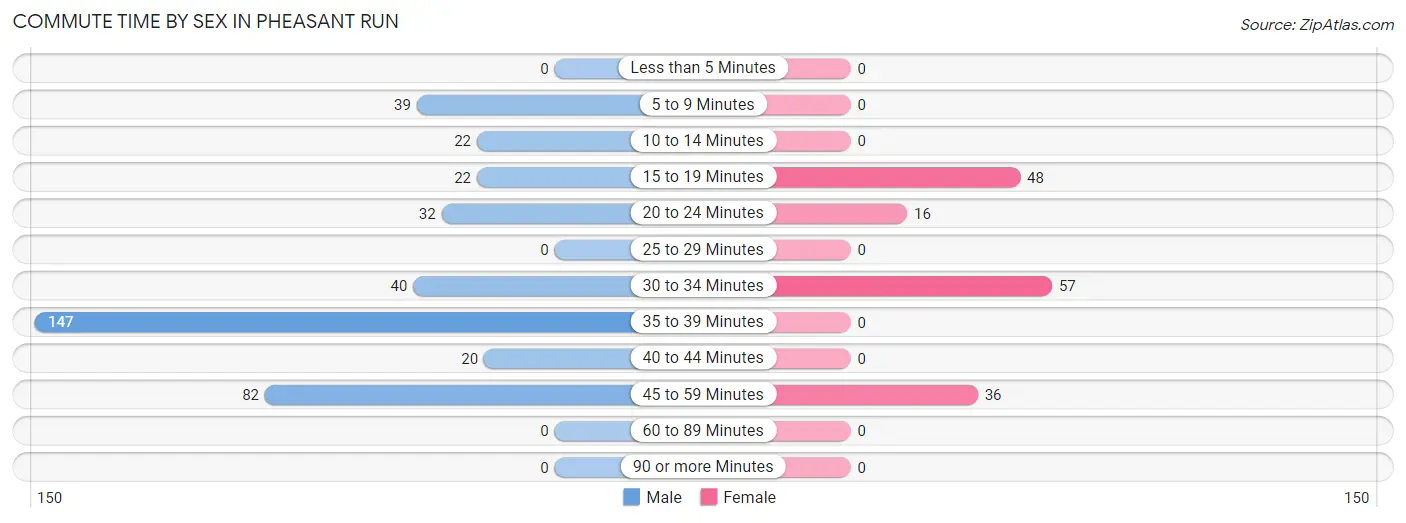
| Commute Time | Male | Female |
| Less than 5 Minutes | 0 (0.0%) | 0 (0.0%) |
| 5 to 9 Minutes | 39 (9.7%) | 0 (0.0%) |
| 10 to 14 Minutes | 22 (5.4%) | 0 (0.0%) |
| 15 to 19 Minutes | 22 (5.4%) | 48 (30.6%) |
| 20 to 24 Minutes | 32 (7.9%) | 16 (10.2%) |
| 25 to 29 Minutes | 0 (0.0%) | 0 (0.0%) |
| 30 to 34 Minutes | 40 (9.9%) | 57 (36.3%) |
| 35 to 39 Minutes | 147 (36.4%) | 0 (0.0%) |
| 40 to 44 Minutes | 20 (5.0%) | 0 (0.0%) |
| 45 to 59 Minutes | 82 (20.3%) | 36 (22.9%) |
| 60 to 89 Minutes | 0 (0.0%) | 0 (0.0%) |
| 90 or more Minutes | 0 (0.0%) | 0 (0.0%) |
Time of Departure to Work by Sex in Pheasant Run
The most frequent times of departure to work in Pheasant Run are 7:00 AM to 7:29 AM (134, 33.2%) for males and 5:30 AM to 5:59 AM (41, 26.1%) for females.
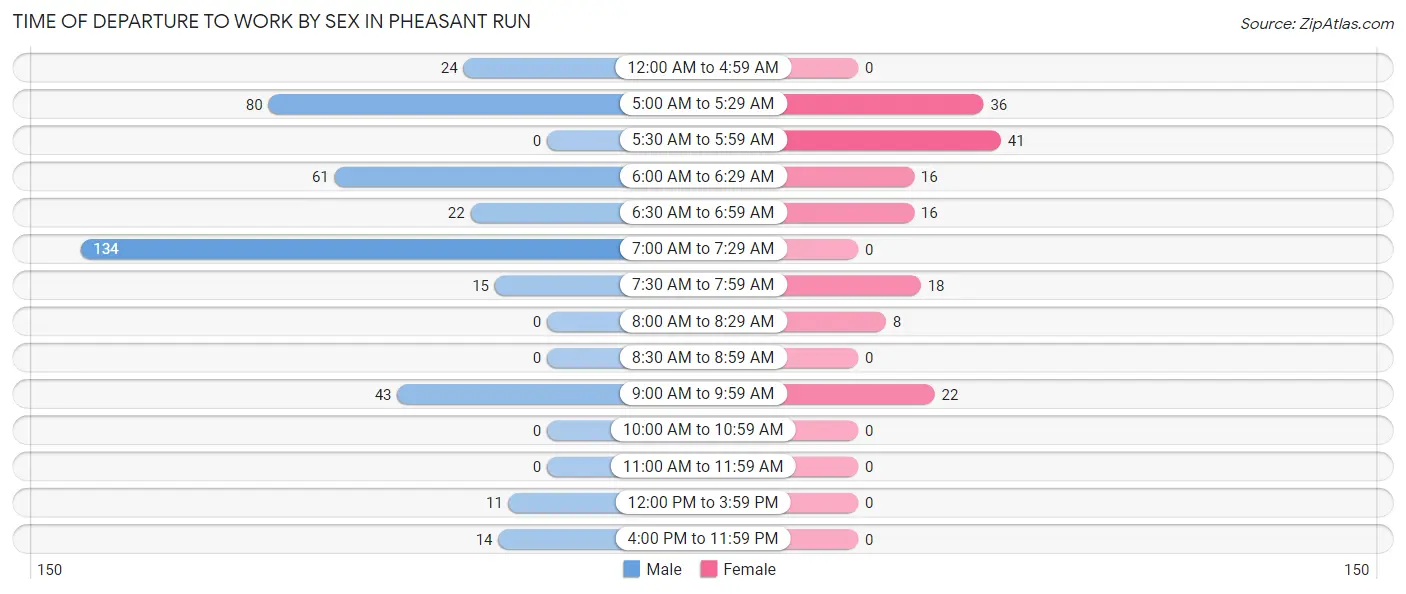
| Time of Departure | Male | Female |
| 12:00 AM to 4:59 AM | 24 (5.9%) | 0 (0.0%) |
| 5:00 AM to 5:29 AM | 80 (19.8%) | 36 (22.9%) |
| 5:30 AM to 5:59 AM | 0 (0.0%) | 41 (26.1%) |
| 6:00 AM to 6:29 AM | 61 (15.1%) | 16 (10.2%) |
| 6:30 AM to 6:59 AM | 22 (5.4%) | 16 (10.2%) |
| 7:00 AM to 7:29 AM | 134 (33.2%) | 0 (0.0%) |
| 7:30 AM to 7:59 AM | 15 (3.7%) | 18 (11.5%) |
| 8:00 AM to 8:29 AM | 0 (0.0%) | 8 (5.1%) |
| 8:30 AM to 8:59 AM | 0 (0.0%) | 0 (0.0%) |
| 9:00 AM to 9:59 AM | 43 (10.6%) | 22 (14.0%) |
| 10:00 AM to 10:59 AM | 0 (0.0%) | 0 (0.0%) |
| 11:00 AM to 11:59 AM | 0 (0.0%) | 0 (0.0%) |
| 12:00 PM to 3:59 PM | 11 (2.7%) | 0 (0.0%) |
| 4:00 PM to 11:59 PM | 14 (3.5%) | 0 (0.0%) |
| Total | 404 (100.0%) | 157 (100.0%) |
Housing Occupancy in Pheasant Run
Occupancy by Ownership in Pheasant Run
Of the total 564 dwellings in Pheasant Run, owner-occupied units account for 501 (88.8%), while renter-occupied units make up 63 (11.2%).
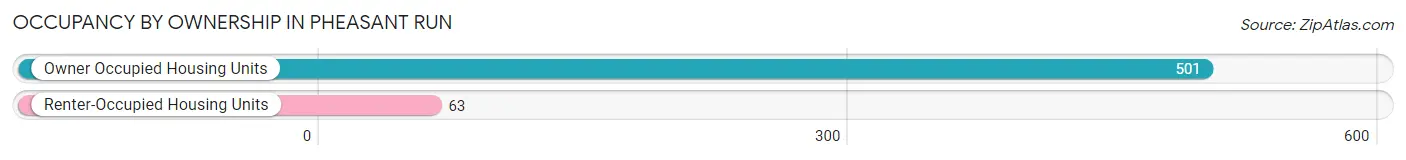
| Occupancy | # Housing Units | % Housing Units |
| Owner Occupied Housing Units | 501 | 88.8% |
| Renter-Occupied Housing Units | 63 | 11.2% |
| Total Occupied Housing Units | 564 | 100.0% |
Occupancy by Household Size in Pheasant Run
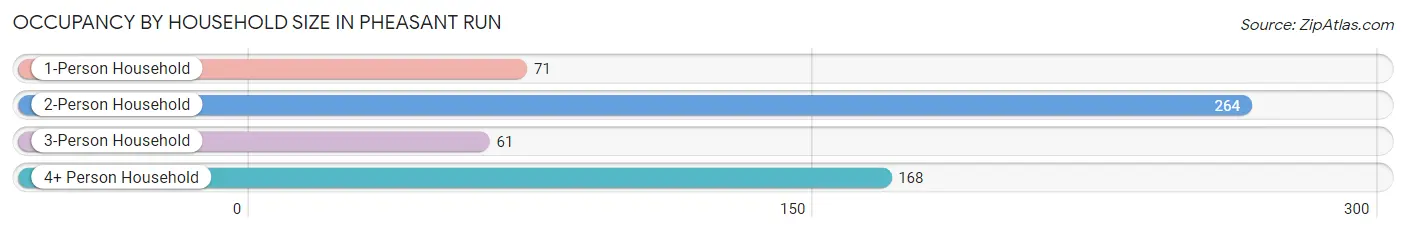
| Household Size | # Housing Units | % Housing Units |
| 1-Person Household | 71 | 12.6% |
| 2-Person Household | 264 | 46.8% |
| 3-Person Household | 61 | 10.8% |
| 4+ Person Household | 168 | 29.8% |
| Total Housing Units | 564 | 100.0% |
Occupancy by Ownership by Household Size in Pheasant Run
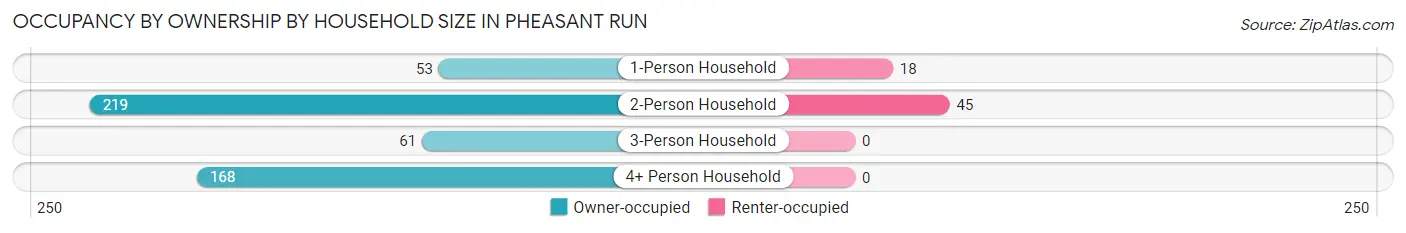
| Household Size | Owner-occupied | Renter-occupied |
| 1-Person Household | 53 (74.7%) | 18 (25.4%) |
| 2-Person Household | 219 (83.0%) | 45 (17.1%) |
| 3-Person Household | 61 (100.0%) | 0 (0.0%) |
| 4+ Person Household | 168 (100.0%) | 0 (0.0%) |
| Total Housing Units | 501 (88.8%) | 63 (11.2%) |
Occupancy by Educational Attainment in Pheasant Run
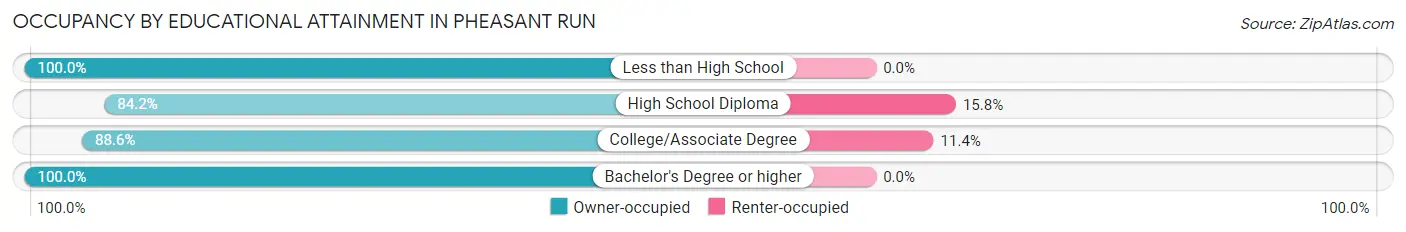
| Household Size | Owner-occupied | Renter-occupied |
| Less than High School | 15 (100.0%) | 0 (0.0%) |
| High School Diploma | 218 (84.2%) | 41 (15.8%) |
| College/Associate Degree | 171 (88.6%) | 22 (11.4%) |
| Bachelor's Degree or higher | 97 (100.0%) | 0 (0.0%) |
Occupancy by Age of Householder in Pheasant Run
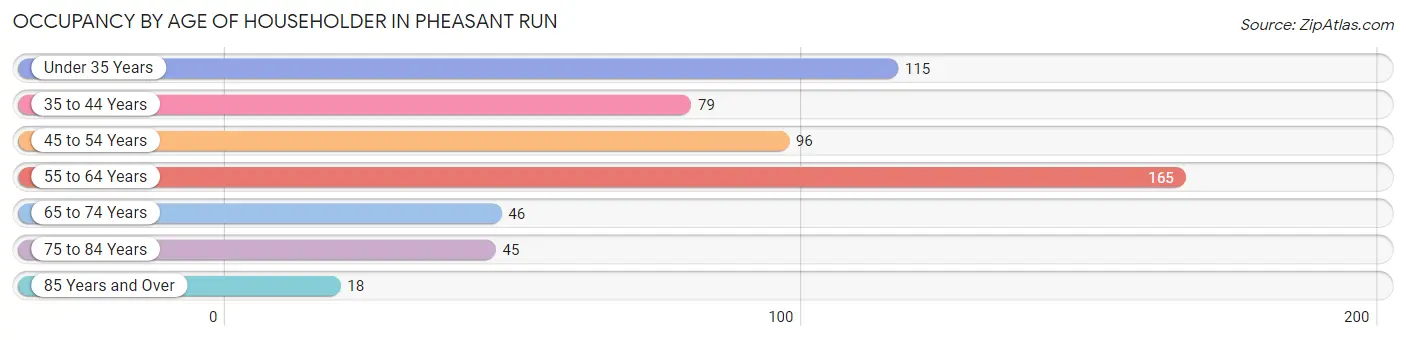
| Age Bracket | # Households | % Households |
| Under 35 Years | 115 | 20.4% |
| 35 to 44 Years | 79 | 14.0% |
| 45 to 54 Years | 96 | 17.0% |
| 55 to 64 Years | 165 | 29.3% |
| 65 to 74 Years | 46 | 8.2% |
| 75 to 84 Years | 45 | 8.0% |
| 85 Years and Over | 18 | 3.2% |
| Total | 564 | 100.0% |
Housing Finances in Pheasant Run
Median Income by Occupancy in Pheasant Run
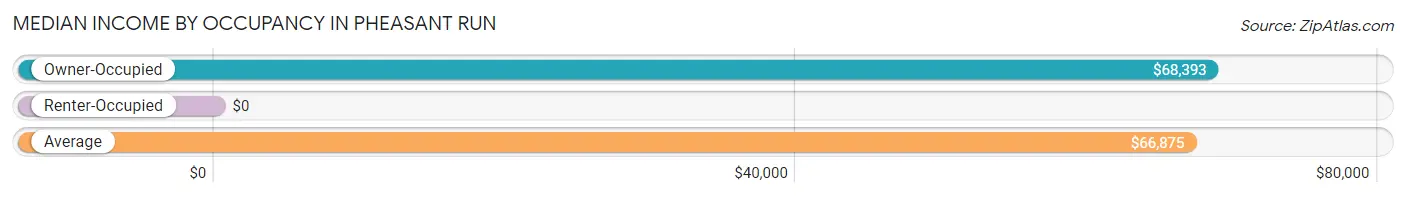
| Occupancy Type | # Households | Median Income |
| Owner-Occupied | 501 (88.8%) | $68,393 |
| Renter-Occupied | 63 (11.2%) | $0 |
| Average | 564 (100.0%) | $66,875 |
Occupancy by Householder Income Bracket in Pheasant Run
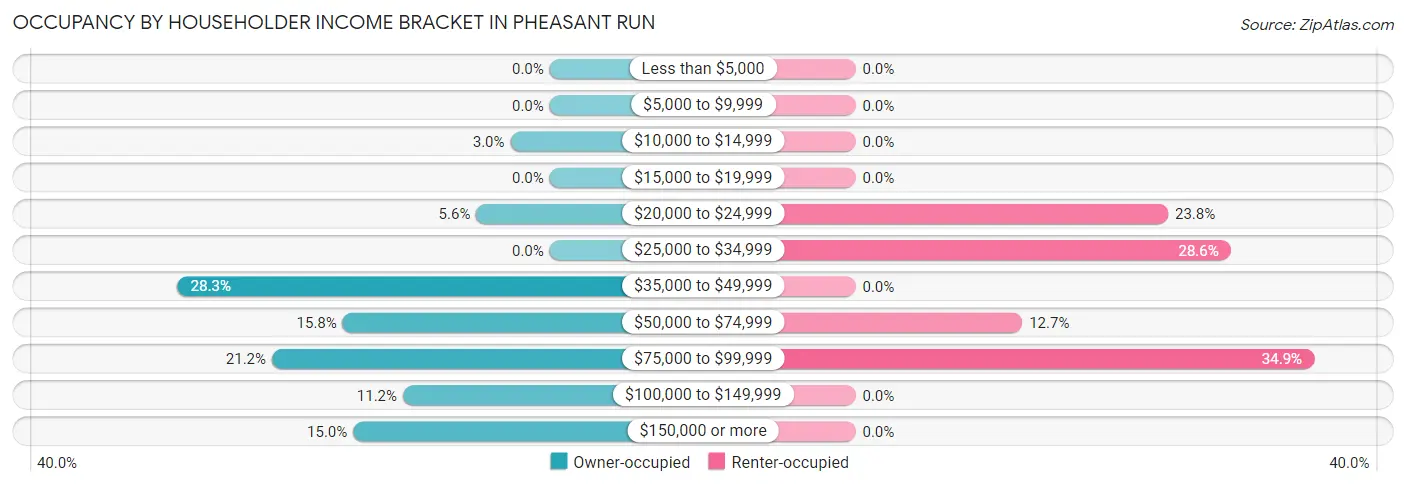
| Income Bracket | Owner-occupied | Renter-occupied |
| Less than $5,000 | 0 (0.0%) | 0 (0.0%) |
| $5,000 to $9,999 | 0 (0.0%) | 0 (0.0%) |
| $10,000 to $14,999 | 15 (3.0%) | 0 (0.0%) |
| $15,000 to $19,999 | 0 (0.0%) | 0 (0.0%) |
| $20,000 to $24,999 | 28 (5.6%) | 15 (23.8%) |
| $25,000 to $34,999 | 0 (0.0%) | 18 (28.6%) |
| $35,000 to $49,999 | 142 (28.3%) | 0 (0.0%) |
| $50,000 to $74,999 | 79 (15.8%) | 8 (12.7%) |
| $75,000 to $99,999 | 106 (21.2%) | 22 (34.9%) |
| $100,000 to $149,999 | 56 (11.2%) | 0 (0.0%) |
| $150,000 or more | 75 (15.0%) | 0 (0.0%) |
| Total | 501 (100.0%) | 63 (100.0%) |
Monthly Housing Cost Tiers in Pheasant Run
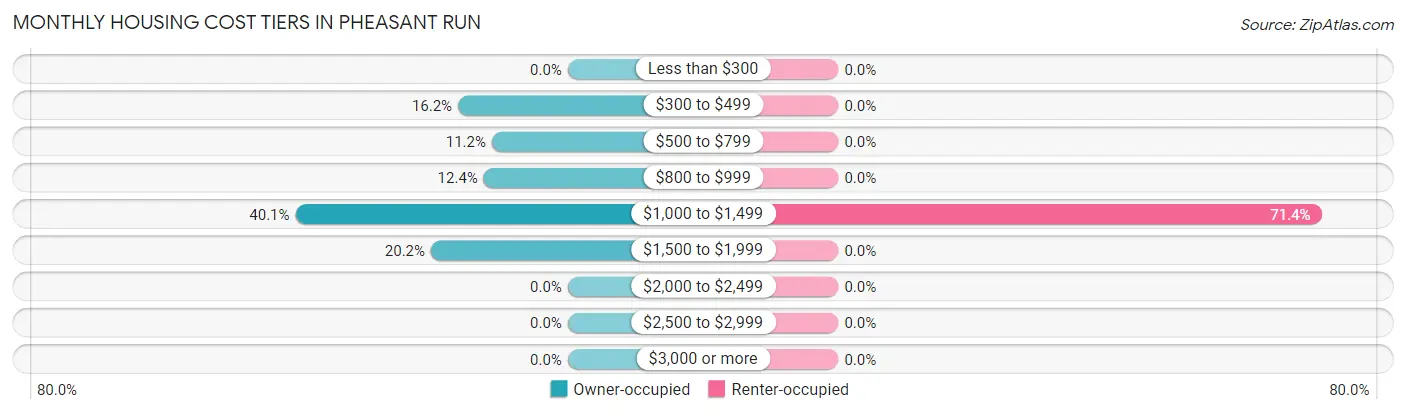
| Monthly Cost | Owner-occupied | Renter-occupied |
| Less than $300 | 0 (0.0%) | 0 (0.0%) |
| $300 to $499 | 81 (16.2%) | 0 (0.0%) |
| $500 to $799 | 56 (11.2%) | 0 (0.0%) |
| $800 to $999 | 62 (12.4%) | 0 (0.0%) |
| $1,000 to $1,499 | 201 (40.1%) | 45 (71.4%) |
| $1,500 to $1,999 | 101 (20.2%) | 0 (0.0%) |
| $2,000 to $2,499 | 0 (0.0%) | 0 (0.0%) |
| $2,500 to $2,999 | 0 (0.0%) | 0 (0.0%) |
| $3,000 or more | 0 (0.0%) | 0 (0.0%) |
| Total | 501 (100.0%) | 63 (100.0%) |
Physical Housing Characteristics in Pheasant Run
Housing Structures in Pheasant Run
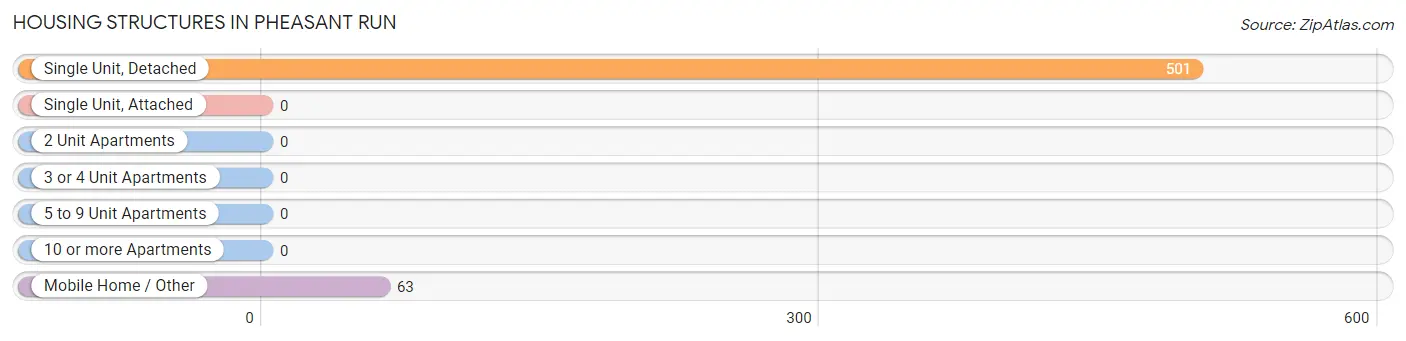
| Structure Type | # Housing Units | % Housing Units |
| Single Unit, Detached | 501 | 88.8% |
| Single Unit, Attached | 0 | 0.0% |
| 2 Unit Apartments | 0 | 0.0% |
| 3 or 4 Unit Apartments | 0 | 0.0% |
| 5 to 9 Unit Apartments | 0 | 0.0% |
| 10 or more Apartments | 0 | 0.0% |
| Mobile Home / Other | 63 | 11.2% |
| Total | 564 | 100.0% |
Housing Structures by Occupancy in Pheasant Run
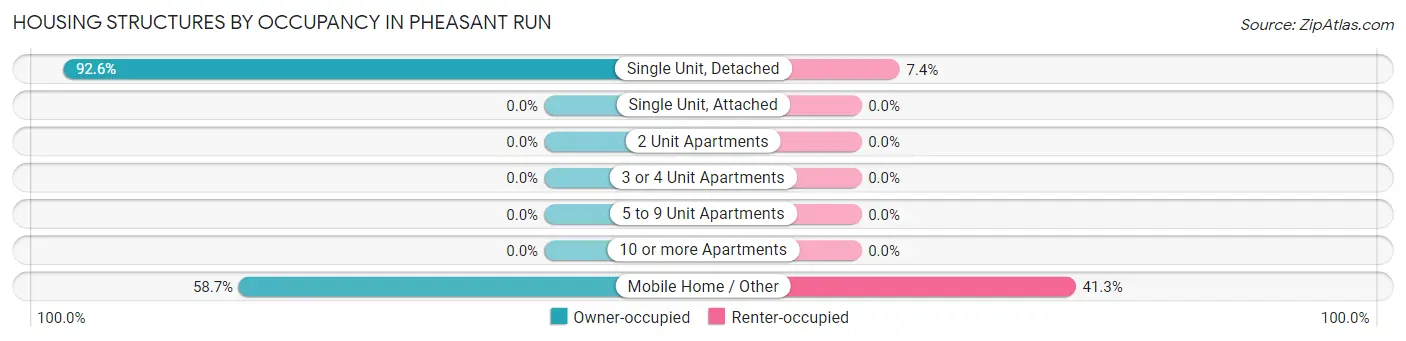
| Structure Type | Owner-occupied | Renter-occupied |
| Single Unit, Detached | 464 (92.6%) | 37 (7.4%) |
| Single Unit, Attached | 0 (0.0%) | 0 (0.0%) |
| 2 Unit Apartments | 0 (0.0%) | 0 (0.0%) |
| 3 or 4 Unit Apartments | 0 (0.0%) | 0 (0.0%) |
| 5 to 9 Unit Apartments | 0 (0.0%) | 0 (0.0%) |
| 10 or more Apartments | 0 (0.0%) | 0 (0.0%) |
| Mobile Home / Other | 37 (58.7%) | 26 (41.3%) |
| Total | 501 (88.8%) | 63 (11.2%) |
Housing Structures by Number of Rooms in Pheasant Run
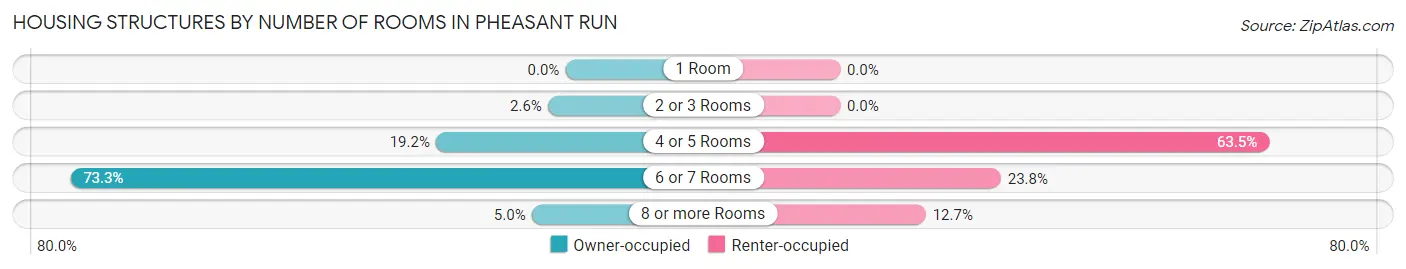
| Number of Rooms | Owner-occupied | Renter-occupied |
| 1 Room | 0 (0.0%) | 0 (0.0%) |
| 2 or 3 Rooms | 13 (2.6%) | 0 (0.0%) |
| 4 or 5 Rooms | 96 (19.2%) | 40 (63.5%) |
| 6 or 7 Rooms | 367 (73.3%) | 15 (23.8%) |
| 8 or more Rooms | 25 (5.0%) | 8 (12.7%) |
| Total | 501 (100.0%) | 63 (100.0%) |
Housing Structure by Heating Type in Pheasant Run
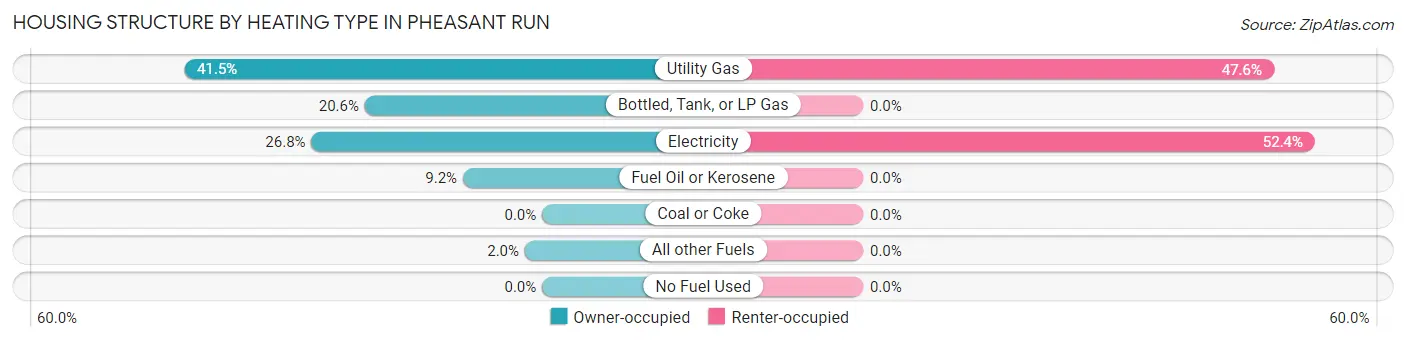
| Heating Type | Owner-occupied | Renter-occupied |
| Utility Gas | 208 (41.5%) | 30 (47.6%) |
| Bottled, Tank, or LP Gas | 103 (20.6%) | 0 (0.0%) |
| Electricity | 134 (26.8%) | 33 (52.4%) |
| Fuel Oil or Kerosene | 46 (9.2%) | 0 (0.0%) |
| Coal or Coke | 0 (0.0%) | 0 (0.0%) |
| All other Fuels | 10 (2.0%) | 0 (0.0%) |
| No Fuel Used | 0 (0.0%) | 0 (0.0%) |
| Total | 501 (100.0%) | 63 (100.0%) |
Household Vehicle Usage in Pheasant Run
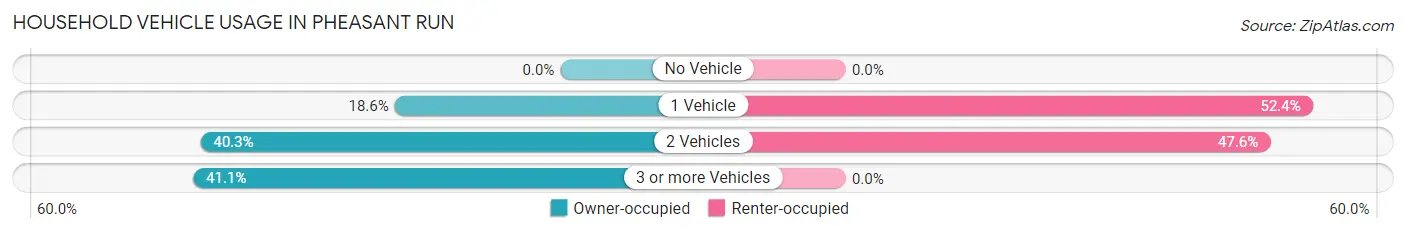
| Vehicles per Household | Owner-occupied | Renter-occupied |
| No Vehicle | 0 (0.0%) | 0 (0.0%) |
| 1 Vehicle | 93 (18.6%) | 33 (52.4%) |
| 2 Vehicles | 202 (40.3%) | 30 (47.6%) |
| 3 or more Vehicles | 206 (41.1%) | 0 (0.0%) |
| Total | 501 (100.0%) | 63 (100.0%) |
Real Estate & Mortgages in Pheasant Run
Real Estate and Mortgage Overview in Pheasant Run
| Characteristic | Without Mortgage | With Mortgage |
| Housing Units | 127 | 374 |
| Median Property Value | $110,000 | $111,100 |
| Median Household Income | $46,658 | $75 |
| Monthly Housing Costs | $478 | $0 |
| Real Estate Taxes | $1,258 | $0 |
Property Value by Mortgage Status in Pheasant Run
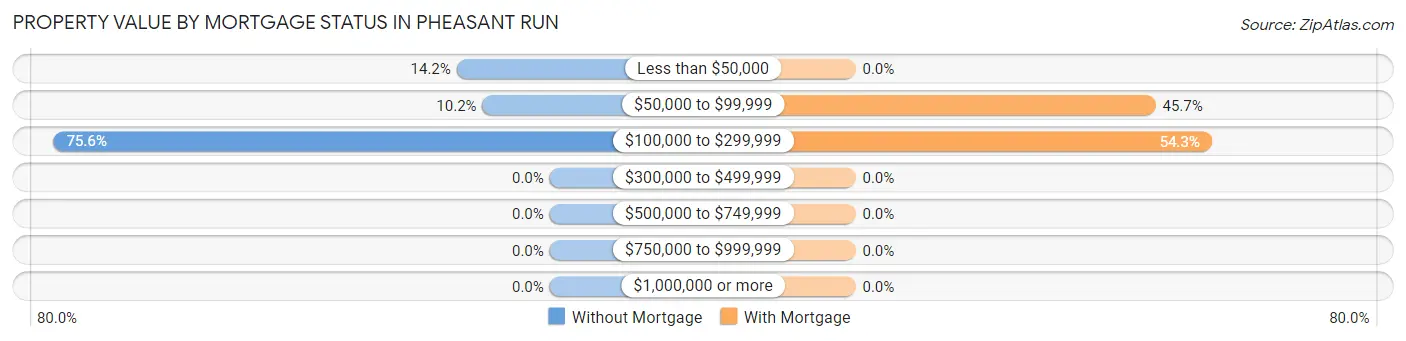
| Property Value | Without Mortgage | With Mortgage |
| Less than $50,000 | 18 (14.2%) | 0 (0.0%) |
| $50,000 to $99,999 | 13 (10.2%) | 171 (45.7%) |
| $100,000 to $299,999 | 96 (75.6%) | 203 (54.3%) |
| $300,000 to $499,999 | 0 (0.0%) | 0 (0.0%) |
| $500,000 to $749,999 | 0 (0.0%) | 0 (0.0%) |
| $750,000 to $999,999 | 0 (0.0%) | 0 (0.0%) |
| $1,000,000 or more | 0 (0.0%) | 0 (0.0%) |
| Total | 127 (100.0%) | 374 (100.0%) |
Household Income by Mortgage Status in Pheasant Run
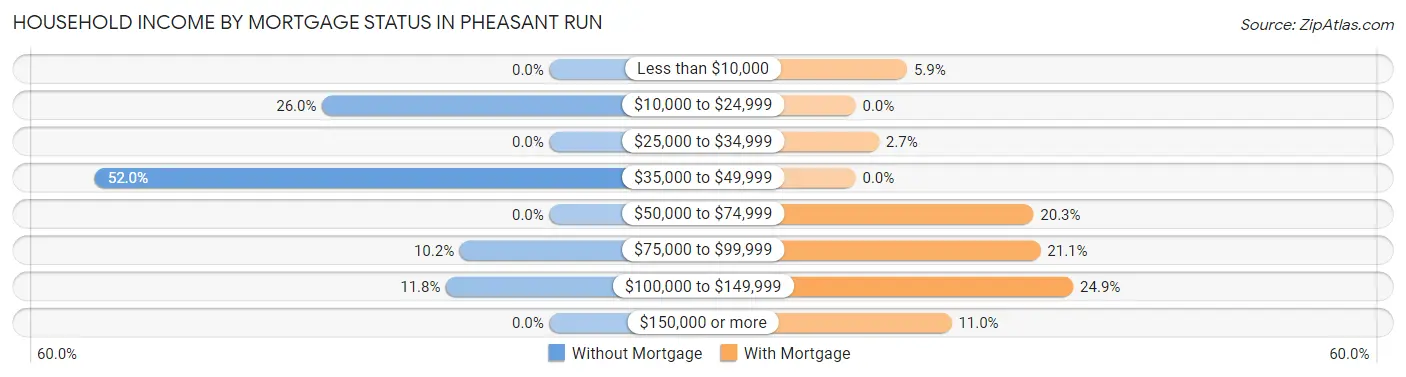
| Household Income | Without Mortgage | With Mortgage |
| Less than $10,000 | 0 (0.0%) | 22 (5.9%) |
| $10,000 to $24,999 | 33 (26.0%) | 0 (0.0%) |
| $25,000 to $34,999 | 0 (0.0%) | 10 (2.7%) |
| $35,000 to $49,999 | 66 (52.0%) | 0 (0.0%) |
| $50,000 to $74,999 | 0 (0.0%) | 76 (20.3%) |
| $75,000 to $99,999 | 13 (10.2%) | 79 (21.1%) |
| $100,000 to $149,999 | 15 (11.8%) | 93 (24.9%) |
| $150,000 or more | 0 (0.0%) | 41 (11.0%) |
| Total | 127 (100.0%) | 374 (100.0%) |
Property Value to Household Income Ratio in Pheasant Run
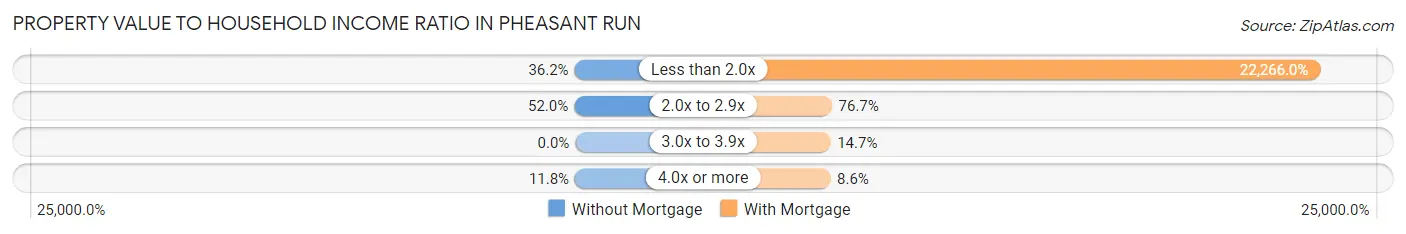
| Value-to-Income Ratio | Without Mortgage | With Mortgage |
| Less than 2.0x | 46 (36.2%) | 83,275 (22,266.0%) |
| 2.0x to 2.9x | 66 (52.0%) | 287 (76.7%) |
| 3.0x to 3.9x | 0 (0.0%) | 55 (14.7%) |
| 4.0x or more | 15 (11.8%) | 32 (8.6%) |
| Total | 127 (100.0%) | 374 (100.0%) |
Real Estate Taxes by Mortgage Status in Pheasant Run
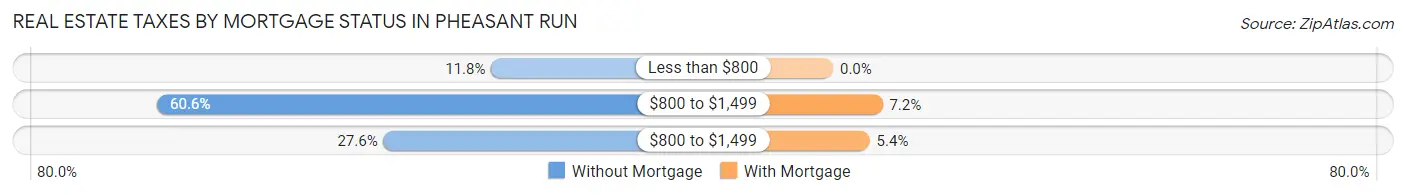
| Property Taxes | Without Mortgage | With Mortgage |
| Less than $800 | 15 (11.8%) | 0 (0.0%) |
| $800 to $1,499 | 77 (60.6%) | 27 (7.2%) |
| $800 to $1,499 | 35 (27.6%) | 20 (5.3%) |
| Total | 127 (100.0%) | 374 (100.0%) |
Health & Disability in Pheasant Run
Health Insurance Coverage by Age in Pheasant Run
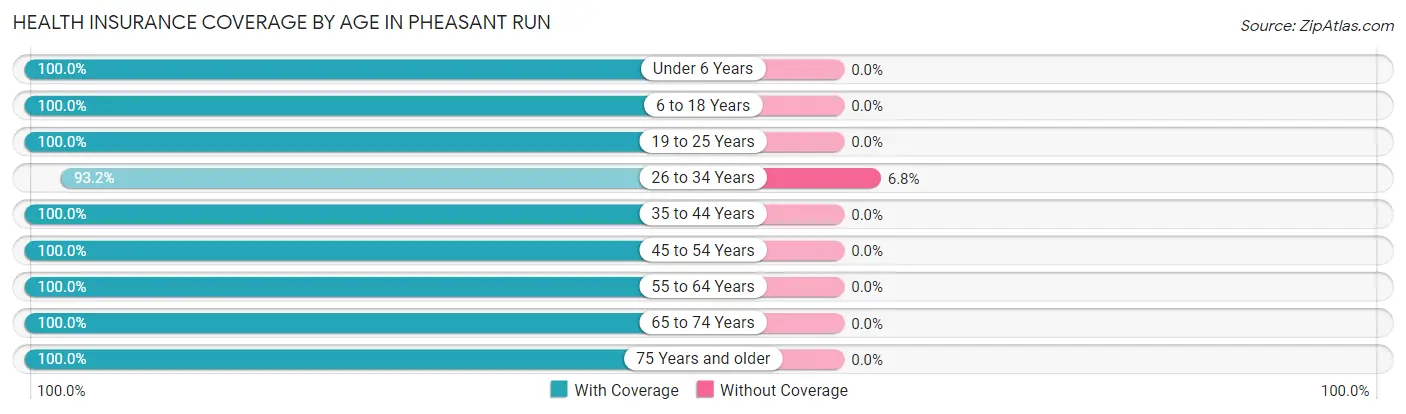
| Age Bracket | With Coverage | Without Coverage |
| Under 6 Years | 163 (100.0%) | 0 (0.0%) |
| 6 to 18 Years | 142 (100.0%) | 0 (0.0%) |
| 19 to 25 Years | 42 (100.0%) | 0 (0.0%) |
| 26 to 34 Years | 301 (93.2%) | 22 (6.8%) |
| 35 to 44 Years | 169 (100.0%) | 0 (0.0%) |
| 45 to 54 Years | 179 (100.0%) | 0 (0.0%) |
| 55 to 64 Years | 288 (100.0%) | 0 (0.0%) |
| 65 to 74 Years | 112 (100.0%) | 0 (0.0%) |
| 75 Years and older | 63 (100.0%) | 0 (0.0%) |
| Total | 1,459 (98.5%) | 22 (1.5%) |
Health Insurance Coverage by Citizenship Status in Pheasant Run
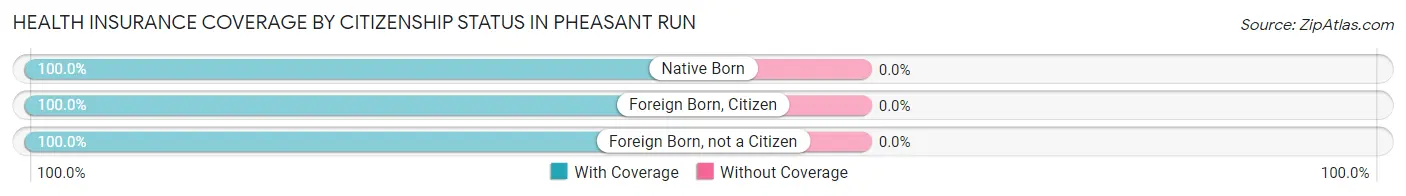
| Citizenship Status | With Coverage | Without Coverage |
| Native Born | 163 (100.0%) | 0 (0.0%) |
| Foreign Born, Citizen | 142 (100.0%) | 0 (0.0%) |
| Foreign Born, not a Citizen | 42 (100.0%) | 0 (0.0%) |
Health Insurance Coverage by Household Income in Pheasant Run
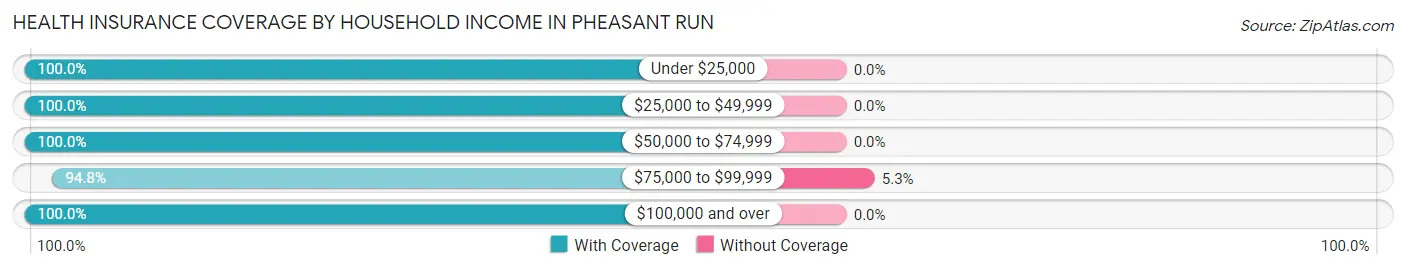
| Household Income | With Coverage | Without Coverage |
| Under $25,000 | 132 (100.0%) | 0 (0.0%) |
| $25,000 to $49,999 | 321 (100.0%) | 0 (0.0%) |
| $50,000 to $74,999 | 179 (100.0%) | 0 (0.0%) |
| $75,000 to $99,999 | 397 (94.8%) | 22 (5.2%) |
| $100,000 and over | 430 (100.0%) | 0 (0.0%) |
Public vs Private Health Insurance Coverage by Age in Pheasant Run
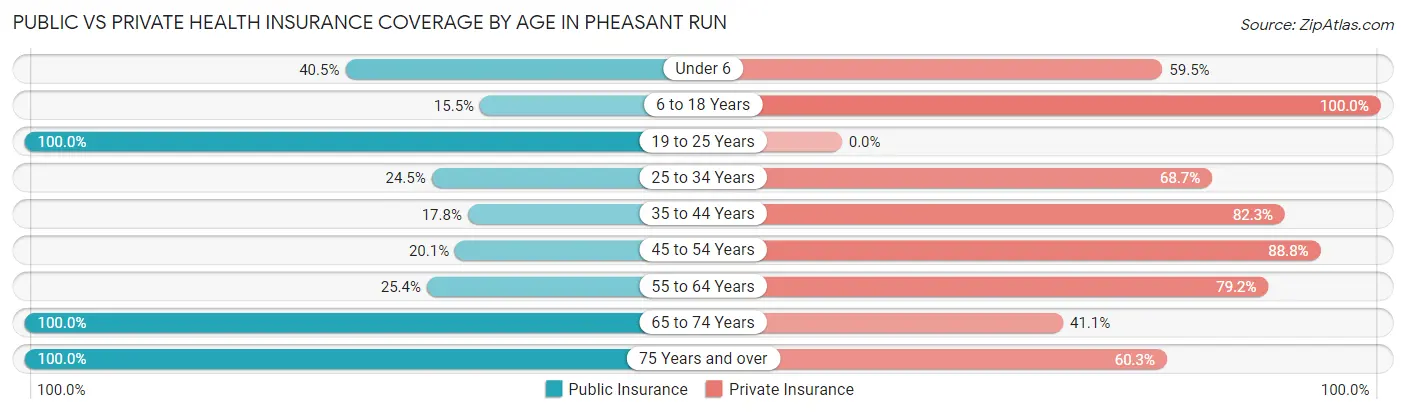
| Age Bracket | Public Insurance | Private Insurance |
| Under 6 | 66 (40.5%) | 97 (59.5%) |
| 6 to 18 Years | 22 (15.5%) | 142 (100.0%) |
| 19 to 25 Years | 42 (100.0%) | 0 (0.0%) |
| 25 to 34 Years | 79 (24.5%) | 222 (68.7%) |
| 35 to 44 Years | 30 (17.7%) | 139 (82.3%) |
| 45 to 54 Years | 36 (20.1%) | 159 (88.8%) |
| 55 to 64 Years | 73 (25.4%) | 228 (79.2%) |
| 65 to 74 Years | 112 (100.0%) | 46 (41.1%) |
| 75 Years and over | 63 (100.0%) | 38 (60.3%) |
| Total | 523 (35.3%) | 1,071 (72.3%) |
Disability Status by Sex by Age in Pheasant Run
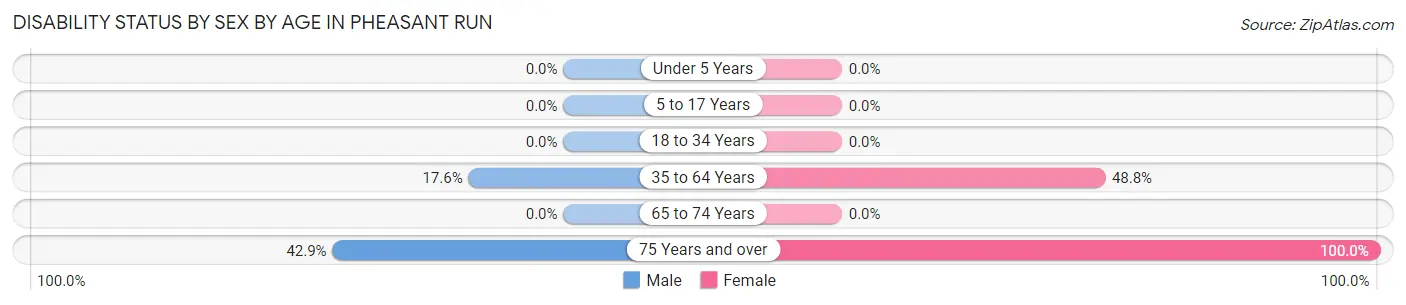
| Age Bracket | Male | Female |
| Under 5 Years | 0 (0.0%) | 0 (0.0%) |
| 5 to 17 Years | 0 (0.0%) | 0 (0.0%) |
| 18 to 34 Years | 0 (0.0%) | 0 (0.0%) |
| 35 to 64 Years | 59 (17.6%) | 147 (48.8%) |
| 65 to 74 Years | 0 (0.0%) | 0 (0.0%) |
| 75 Years and over | 15 (42.9%) | 28 (100.0%) |
Disability Class by Sex by Age in Pheasant Run
Disability Class: Hearing Difficulty
| Age Bracket | Male | Female |
| Under 5 Years | 0 (0.0%) | 0 (0.0%) |
| 5 to 17 Years | 0 (0.0%) | 0 (0.0%) |
| 18 to 34 Years | 0 (0.0%) | 0 (0.0%) |
| 35 to 64 Years | 0 (0.0%) | 0 (0.0%) |
| 65 to 74 Years | 0 (0.0%) | 0 (0.0%) |
| 75 Years and over | 0 (0.0%) | 0 (0.0%) |
Disability Class: Vision Difficulty
| Age Bracket | Male | Female |
| Under 5 Years | 0 (0.0%) | 0 (0.0%) |
| 5 to 17 Years | 0 (0.0%) | 0 (0.0%) |
| 18 to 34 Years | 0 (0.0%) | 0 (0.0%) |
| 35 to 64 Years | 0 (0.0%) | 0 (0.0%) |
| 65 to 74 Years | 0 (0.0%) | 0 (0.0%) |
| 75 Years and over | 0 (0.0%) | 0 (0.0%) |
Disability Class: Cognitive Difficulty
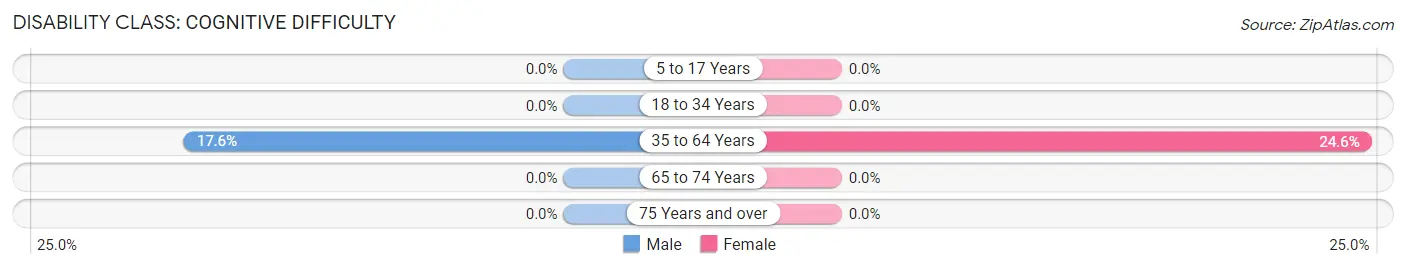
| Age Bracket | Male | Female |
| 5 to 17 Years | 0 (0.0%) | 0 (0.0%) |
| 18 to 34 Years | 0 (0.0%) | 0 (0.0%) |
| 35 to 64 Years | 59 (17.6%) | 74 (24.6%) |
| 65 to 74 Years | 0 (0.0%) | 0 (0.0%) |
| 75 Years and over | 0 (0.0%) | 0 (0.0%) |
Disability Class: Ambulatory Difficulty
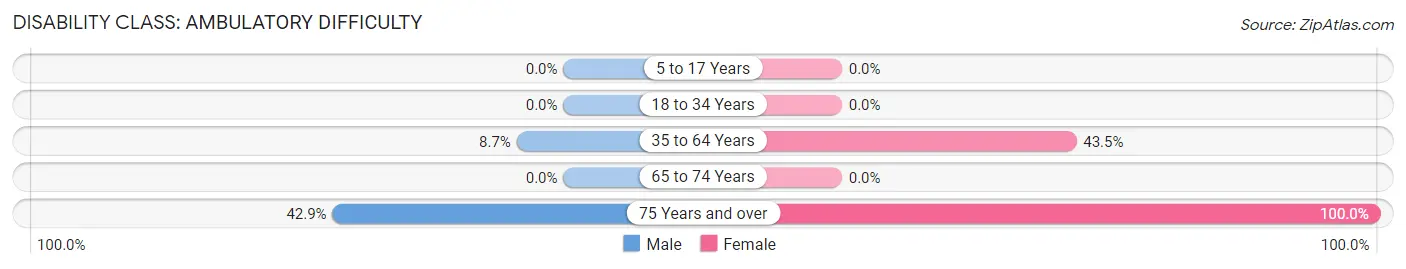
| Age Bracket | Male | Female |
| 5 to 17 Years | 0 (0.0%) | 0 (0.0%) |
| 18 to 34 Years | 0 (0.0%) | 0 (0.0%) |
| 35 to 64 Years | 29 (8.7%) | 131 (43.5%) |
| 65 to 74 Years | 0 (0.0%) | 0 (0.0%) |
| 75 Years and over | 15 (42.9%) | 28 (100.0%) |
Disability Class: Self-Care Difficulty
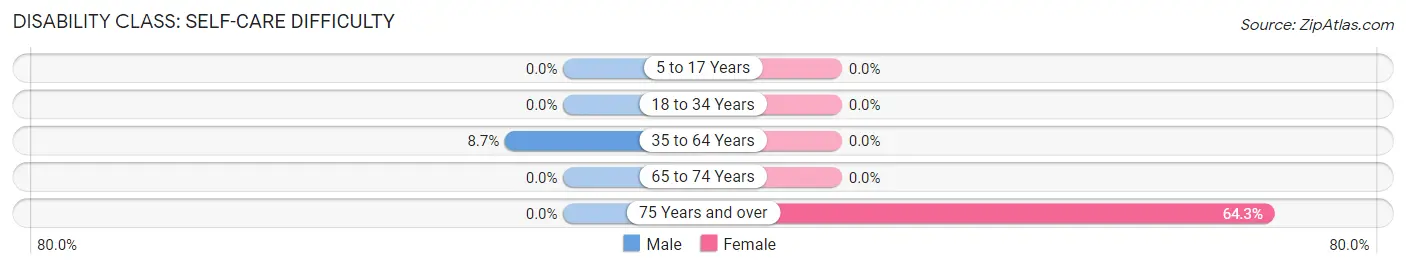
| Age Bracket | Male | Female |
| 5 to 17 Years | 0 (0.0%) | 0 (0.0%) |
| 18 to 34 Years | 0 (0.0%) | 0 (0.0%) |
| 35 to 64 Years | 29 (8.7%) | 0 (0.0%) |
| 65 to 74 Years | 0 (0.0%) | 0 (0.0%) |
| 75 Years and over | 0 (0.0%) | 18 (64.3%) |
Technology Access in Pheasant Run
Computing Device Access in Pheasant Run
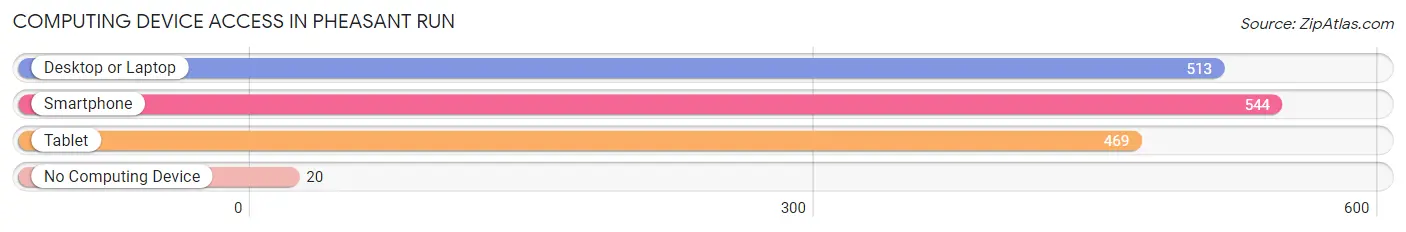
| Device Type | # Households | % Households |
| Desktop or Laptop | 513 | 91.0% |
| Smartphone | 544 | 96.5% |
| Tablet | 469 | 83.2% |
| No Computing Device | 20 | 3.5% |
| Total | 564 | 100.0% |
Internet Access in Pheasant Run
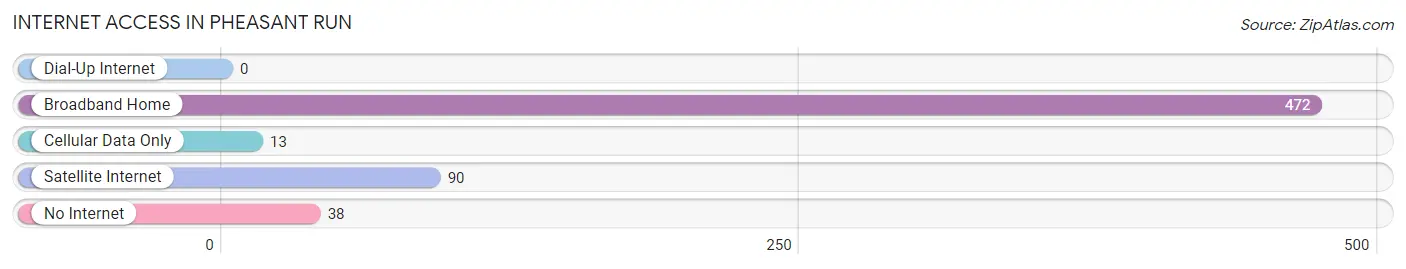
| Internet Type | # Households | % Households |
| Dial-Up Internet | 0 | 0.0% |
| Broadband Home | 472 | 83.7% |
| Cellular Data Only | 13 | 2.3% |
| Satellite Internet | 90 | 16.0% |
| No Internet | 38 | 6.7% |
| Total | 564 | 100.0% |
Pheasant Run Summary
Pheasant Run is a small unincorporated community located in the southeastern corner of Ohio, in the county of Muskingum. It is situated on the banks of the Muskingum River, and is surrounded by rolling hills and farmland. The community is home to a population of approximately 500 people, and is known for its rural charm and friendly atmosphere.
History
Pheasant Run was first settled in the early 1800s by a group of German immigrants. The settlers were attracted to the area due to its fertile soil and abundant wildlife, and the community quickly grew. By the mid-1800s, the town had become a thriving agricultural center, with a variety of crops being grown in the area.
In the late 1800s, the town began to experience a period of growth and prosperity. The railroad arrived in the area in 1887, and the town soon became a hub for the surrounding agricultural communities. The railroad also brought with it a number of new businesses, including a sawmill, a grist mill, and a general store.
In the early 1900s, the town experienced a period of decline as the railroad began to move away from the area. The population began to dwindle, and the town slowly began to fade away. However, in the late 1970s, the town experienced a resurgence as a number of new businesses began to move into the area.
Geography
Pheasant Run is located in the southeastern corner of Ohio, in the county of Muskingum. It is situated on the banks of the Muskingum River, and is surrounded by rolling hills and farmland. The town is located approximately 25 miles from the city of Zanesville, and is approximately 50 miles from the state capital of Columbus.
The town is located in a temperate climate, with hot summers and cold winters. The average temperature in the summer months is around 75 degrees Fahrenheit, while the average temperature in the winter months is around 35 degrees Fahrenheit. The town receives an average of 40 inches of precipitation per year, with most of the precipitation occurring in the spring and summer months.
Economy
Pheasant Run is a small, rural community with a primarily agricultural economy. The town is home to a number of small businesses, including a general store, a sawmill, and a grist mill. The town is also home to a number of farms, which produce a variety of crops, including corn, soybeans, and wheat.
In addition to agriculture, the town is also home to a number of small manufacturing businesses. These businesses produce a variety of products, including furniture, clothing, and automotive parts. The town is also home to a number of service-based businesses, including restaurants, auto repair shops, and a variety of other services.
Demographics
As of the 2010 census, the population of Pheasant Run was approximately 500 people. The town is predominantly white, with approximately 95% of the population identifying as Caucasian. The town is also home to a small Hispanic population, with approximately 5% of the population identifying as Hispanic or Latino.
The median household income in Pheasant Run is approximately $35,000, which is slightly lower than the national average. The town has a relatively low unemployment rate, with approximately 5% of the population being unemployed. The town also has a relatively low poverty rate, with approximately 10% of the population living below the poverty line.
Common Questions
What is Per Capita Income in Pheasant Run?
Per Capita income in Pheasant Run is $29,651.
What is the Median Family Income in Pheasant Run?
Median Family Income in Pheasant Run is $77,045.
What is the Median Household income in Pheasant Run?
Median Household Income in Pheasant Run is $66,875.
What is Income or Wage Gap in Pheasant Run?
Income or Wage Gap in Pheasant Run is 59.0%.
Women in Pheasant Run earn 41.0 cents for every dollar earned by a man.
What is Inequality or Gini Index in Pheasant Run?
Inequality or Gini Index in Pheasant Run is 0.34.
What is the Total Population of Pheasant Run?
Total Population of Pheasant Run is 1,481.
What is the Total Male Population of Pheasant Run?
Total Male Population of Pheasant Run is 881.
What is the Total Female Population of Pheasant Run?
Total Female Population of Pheasant Run is 600.
What is the Ratio of Males per 100 Females in Pheasant Run?
There are 146.83 Males per 100 Females in Pheasant Run.
What is the Ratio of Females per 100 Males in Pheasant Run?
There are 68.10 Females per 100 Males in Pheasant Run.
What is the Median Population Age in Pheasant Run?
Median Population Age in Pheasant Run is 42.5 Years.
What is the Average Family Size in Pheasant Run
Average Family Size in Pheasant Run is 2.9 People.
What is the Average Household Size in Pheasant Run
Average Household Size in Pheasant Run is 2.6 People.
How Large is the Labor Force in Pheasant Run?
There are 699 People in the Labor Forcein in Pheasant Run.
What is the Percentage of People in the Labor Force in Pheasant Run?
59.4% of People are in the Labor Force in Pheasant Run.
What is the Unemployment Rate in Pheasant Run?
Unemployment Rate in Pheasant Run is 3.4%.