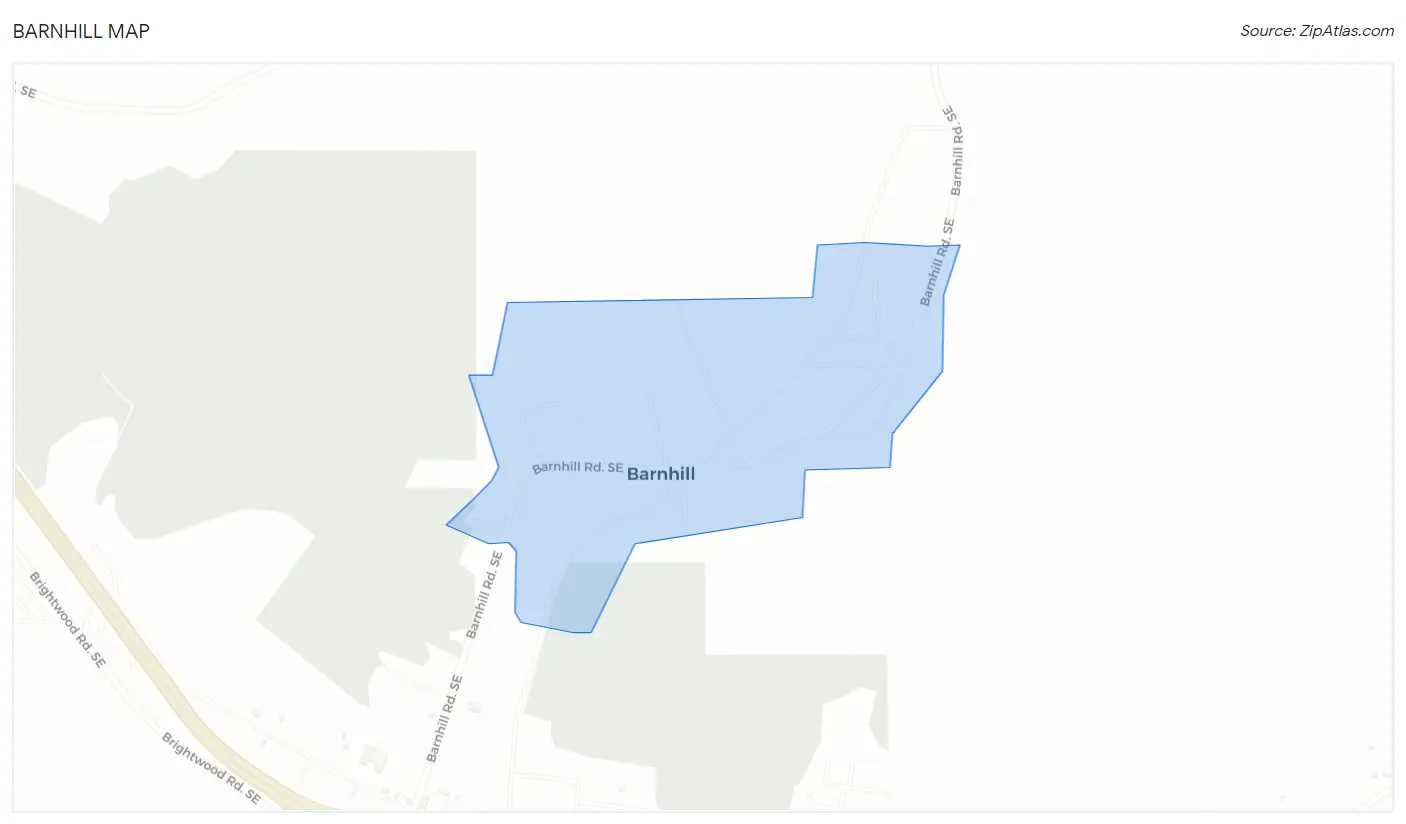
Barnhill, OH Map & Demographics
Barnhill Map
Barnhill Overview
$27,238
PER CAPITA INCOME
$66,838
AVG FAMILY INCOME
$60,893
AVG HOUSEHOLD INCOME
0.27
INEQUALITY / GINI INDEX
601
TOTAL POPULATION
314
MALE POPULATION
287
FEMALE POPULATION
109.41
MALES / 100 FEMALES
91.40
FEMALES / 100 MALES
36.0
MEDIAN AGE
3.3
AVG FAMILY SIZE
2.9
AVG HOUSEHOLD SIZE
379
LABOR FORCE [ PEOPLE ]
70.7%
PERCENT IN LABOR FORCE
8.4%
UNEMPLOYMENT RATE
Income in Barnhill
Income Overview in Barnhill
Per Capita Income in Barnhill is $27,238, while median incomes of families and households are $66,838 and $60,893 respectively.
| Characteristic | Number | Measure |
| Per Capita Income | 601 | $27,238 |
| Median Family Income | 147 | $66,838 |
| Mean Family Income | 147 | $69,111 |
| Median Household Income | 210 | $60,893 |
| Mean Household Income | 210 | $65,481 |
| Income Deficit | 147 | $0 |
| Wage / Income Gap (%) | 601 | 0.00% |
| Wage / Income Gap ($) | 601 | 100.00¢ per $1 |
| Gini / Inequality Index | 601 | 0.27 |
Earnings by Sex in Barnhill
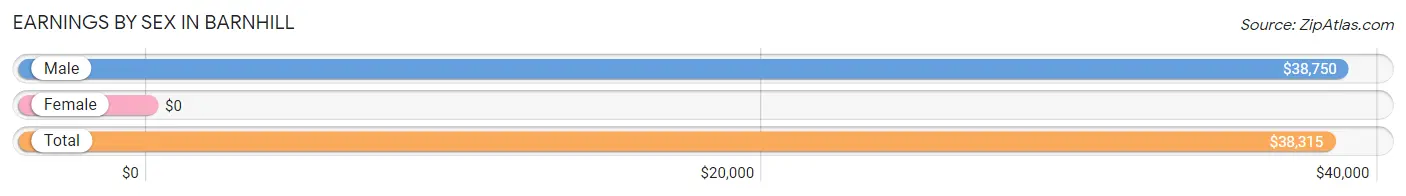
| Sex | Number | Average Earnings |
| Male | 233 (63.0%) | $38,750 |
| Female | 137 (37.0%) | $0 |
| Total | 370 (100.0%) | $38,315 |
Earnings by Sex by Income Bracket in Barnhill
The most common earnings brackets in Barnhill are $35,000 to $39,999 for men (89 | 38.2%) and $45,000 to $49,999 for women (30 | 21.9%).
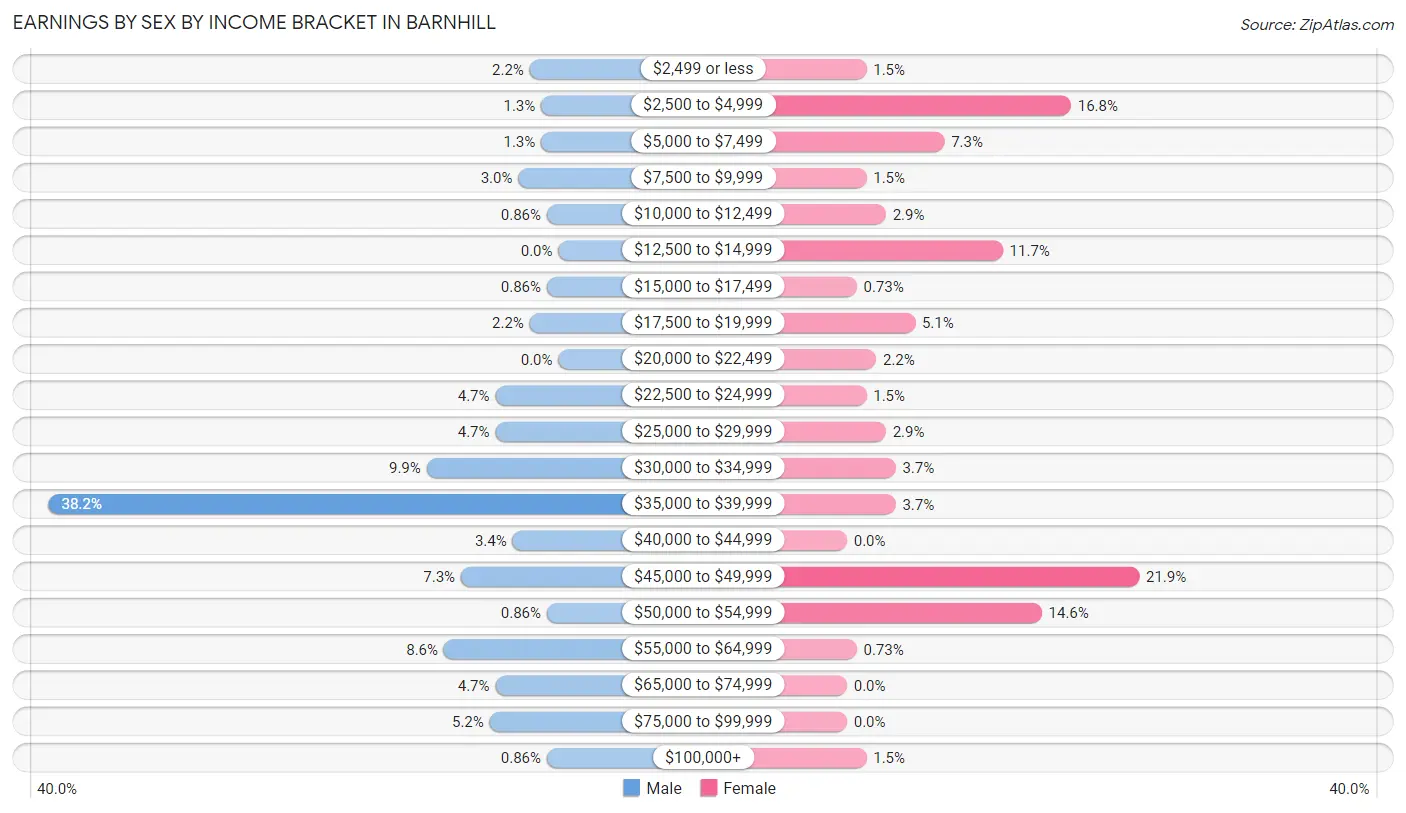
| Income | Male | Female |
| $2,499 or less | 5 (2.1%) | 2 (1.5%) |
| $2,500 to $4,999 | 3 (1.3%) | 23 (16.8%) |
| $5,000 to $7,499 | 3 (1.3%) | 10 (7.3%) |
| $7,500 to $9,999 | 7 (3.0%) | 2 (1.5%) |
| $10,000 to $12,499 | 2 (0.9%) | 4 (2.9%) |
| $12,500 to $14,999 | 0 (0.0%) | 16 (11.7%) |
| $15,000 to $17,499 | 2 (0.9%) | 1 (0.7%) |
| $17,500 to $19,999 | 5 (2.1%) | 7 (5.1%) |
| $20,000 to $22,499 | 0 (0.0%) | 3 (2.2%) |
| $22,500 to $24,999 | 11 (4.7%) | 2 (1.5%) |
| $25,000 to $29,999 | 11 (4.7%) | 4 (2.9%) |
| $30,000 to $34,999 | 23 (9.9%) | 5 (3.6%) |
| $35,000 to $39,999 | 89 (38.2%) | 5 (3.6%) |
| $40,000 to $44,999 | 8 (3.4%) | 0 (0.0%) |
| $45,000 to $49,999 | 17 (7.3%) | 30 (21.9%) |
| $50,000 to $54,999 | 2 (0.9%) | 20 (14.6%) |
| $55,000 to $64,999 | 20 (8.6%) | 1 (0.7%) |
| $65,000 to $74,999 | 11 (4.7%) | 0 (0.0%) |
| $75,000 to $99,999 | 12 (5.1%) | 0 (0.0%) |
| $100,000+ | 2 (0.9%) | 2 (1.5%) |
| Total | 233 (100.0%) | 137 (100.0%) |
Earnings by Sex by Educational Attainment in Barnhill
Average earnings in Barnhill are $46,250 for men and $29,063 for women, a difference of 37.2%. Men with an educational attainment of less than high school enjoy the highest average annual earnings of $62,917, while those with high school diploma education earn the least with $40,000. Women with an educational attainment of college or associate's degree earn the most with the average annual earnings of $50,179, while those with college or associate's degree education have the smallest earnings of $50,179.
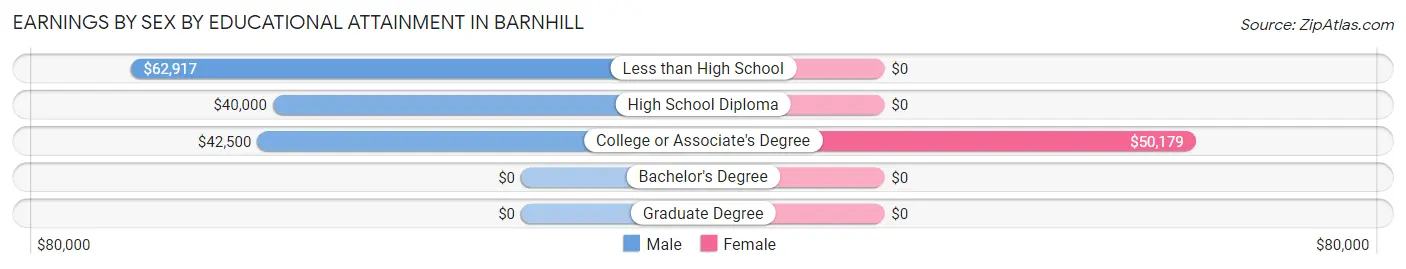
| Educational Attainment | Male Income | Female Income |
| Less than High School | $62,917 | $0 |
| High School Diploma | $40,000 | $0 |
| College or Associate's Degree | $42,500 | $50,179 |
| Bachelor's Degree | - | - |
| Graduate Degree | - | - |
| Total | $46,250 | $29,063 |
Family Income in Barnhill
Family Income Brackets in Barnhill
According to the Barnhill family income data, there are 54 families falling into the $50,000 to $74,999 income range, which is the most common income bracket and makes up 36.7% of all families.
| Income Bracket | # Families | % Families |
| Less than $10,000 | 2 | 1.4% |
| $10,000 to $14,999 | 0 | 0.0% |
| $15,000 to $24,999 | 8 | 5.4% |
| $25,000 to $34,999 | 5 | 3.4% |
| $35,000 to $49,999 | 19 | 12.9% |
| $50,000 to $74,999 | 54 | 36.7% |
| $75,000 to $99,999 | 37 | 25.2% |
| $100,000 to $149,999 | 22 | 15.0% |
| $150,000 to $199,999 | 0 | 0.0% |
| $200,000+ | 0 | 0.0% |
Family Income by Famaliy Size in Barnhill
5-person families (18 | 12.2%) account for the highest median family income in Barnhill with $113,409 per family, while 2-person families (94 | 63.9%) have the highest median income of $33,166 per family member.
| Income Bracket | # Families | Median Income |
| 2-Person Families | 94 (63.9%) | $66,333 |
| 3-Person Families | 26 (17.7%) | $54,500 |
| 4-Person Families | 7 (4.8%) | $0 |
| 5-Person Families | 18 (12.2%) | $113,409 |
| 6-Person Families | 2 (1.4%) | $0 |
| 7+ Person Families | 0 (0.0%) | $0 |
| Total | 147 (100.0%) | $66,838 |
Family Income by Number of Earners in Barnhill
| Number of Earners | # Families | Median Income |
| No Earners | 12 (8.2%) | $27,500 |
| 1 Earner | 44 (29.9%) | $62,143 |
| 2 Earners | 82 (55.8%) | $85,086 |
| 3+ Earners | 9 (6.1%) | $0 |
| Total | 147 (100.0%) | $66,838 |
Household Income in Barnhill
Household Income Brackets in Barnhill
With 77 households falling in the category, the $50,000 to $74,999 income range is the most frequent in Barnhill, accounting for 36.7% of all households.
| Income Bracket | # Households | % Households |
| Less than $10,000 | 2 | 1.0% |
| $10,000 to $14,999 | 5 | 2.4% |
| $15,000 to $24,999 | 11 | 5.2% |
| $25,000 to $34,999 | 18 | 8.6% |
| $35,000 to $49,999 | 27 | 12.9% |
| $50,000 to $74,999 | 77 | 36.7% |
| $75,000 to $99,999 | 37 | 17.6% |
| $100,000 to $149,999 | 31 | 14.8% |
| $150,000 to $199,999 | 0 | 0.0% |
| $200,000+ | 2 | 1.0% |
Household Income by Householder Age in Barnhill
The median household income in Barnhill is $60,893, with the highest median household income of $65,882 found in the 45 to 64 years age bracket for the primary householder. A total of 120 households (57.1%) fall into this category. Meanwhile, the 15 to 24 years age bracket for the primary householder has the lowest median household income of $0, with 10 households (4.8%) in this group.
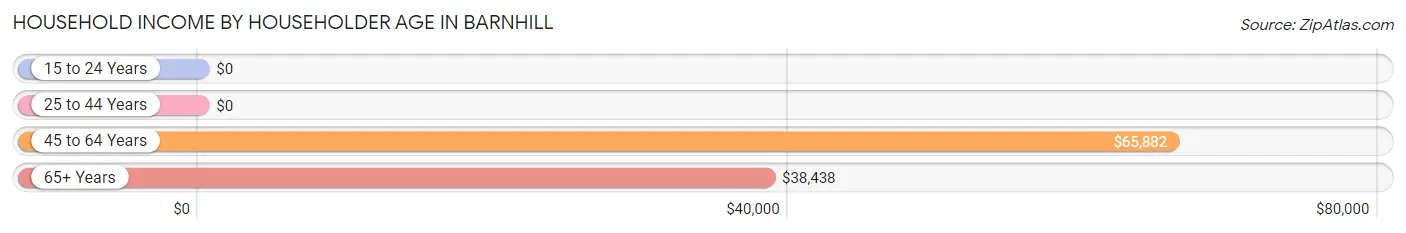
| Income Bracket | # Households | Median Income |
| 15 to 24 Years | 10 (4.8%) | $0 |
| 25 to 44 Years | 41 (19.5%) | $0 |
| 45 to 64 Years | 120 (57.1%) | $65,882 |
| 65+ Years | 39 (18.6%) | $38,438 |
| Total | 210 (100.0%) | $60,893 |
Poverty in Barnhill
Income Below Poverty by Sex and Age in Barnhill
With 2.2% poverty level for males and 12.0% for females among the residents of Barnhill, 16 and 17 year old males and 18 to 24 year old females are the most vulnerable to poverty, with 3 males (13.0%) and 9 females (90.0%) in their respective age groups living below the poverty level.
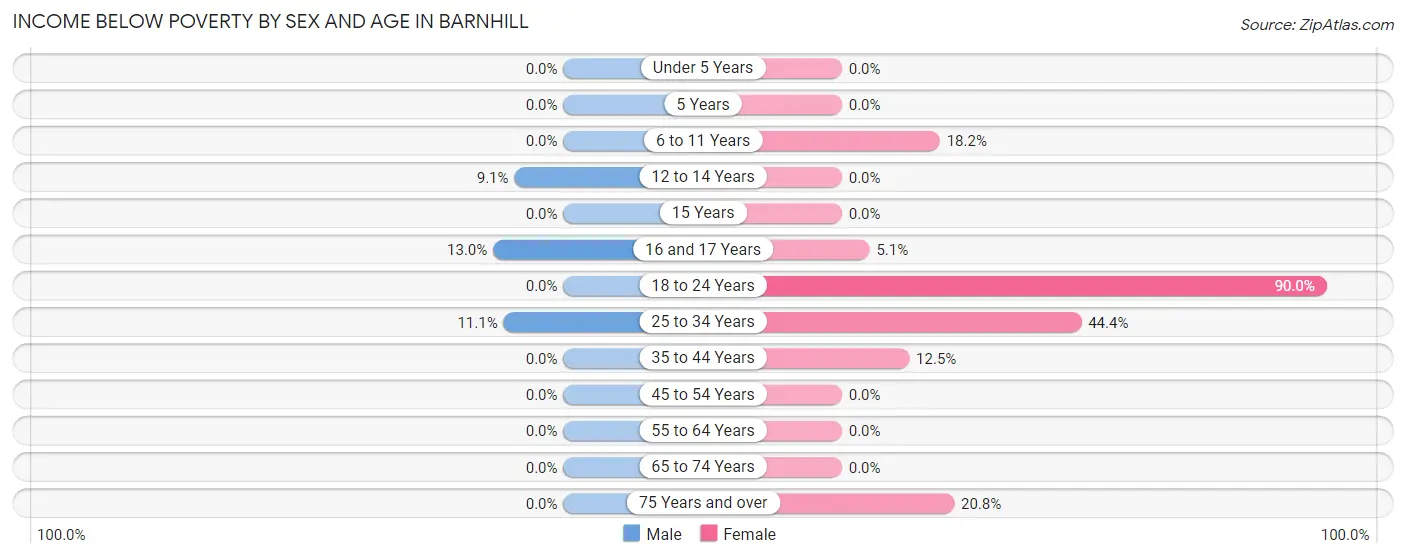
| Age Bracket | Male | Female |
| Under 5 Years | 0 (0.0%) | 0 (0.0%) |
| 5 Years | 0 (0.0%) | 0 (0.0%) |
| 6 to 11 Years | 0 (0.0%) | 2 (18.2%) |
| 12 to 14 Years | 2 (9.1%) | 0 (0.0%) |
| 15 Years | 0 (0.0%) | 0 (0.0%) |
| 16 and 17 Years | 3 (13.0%) | 2 (5.1%) |
| 18 to 24 Years | 0 (0.0%) | 9 (90.0%) |
| 25 to 34 Years | 2 (11.1%) | 12 (44.4%) |
| 35 to 44 Years | 0 (0.0%) | 4 (12.5%) |
| 45 to 54 Years | 0 (0.0%) | 0 (0.0%) |
| 55 to 64 Years | 0 (0.0%) | 0 (0.0%) |
| 65 to 74 Years | 0 (0.0%) | 0 (0.0%) |
| 75 Years and over | 0 (0.0%) | 5 (20.8%) |
| Total | 7 (2.2%) | 34 (12.0%) |
Income Above Poverty by Sex and Age in Barnhill
According to the poverty statistics in Barnhill, males aged 15 years and females aged under 5 years are the age groups that are most secure financially, with 100.0% of males and 100.0% of females in these age groups living above the poverty line.
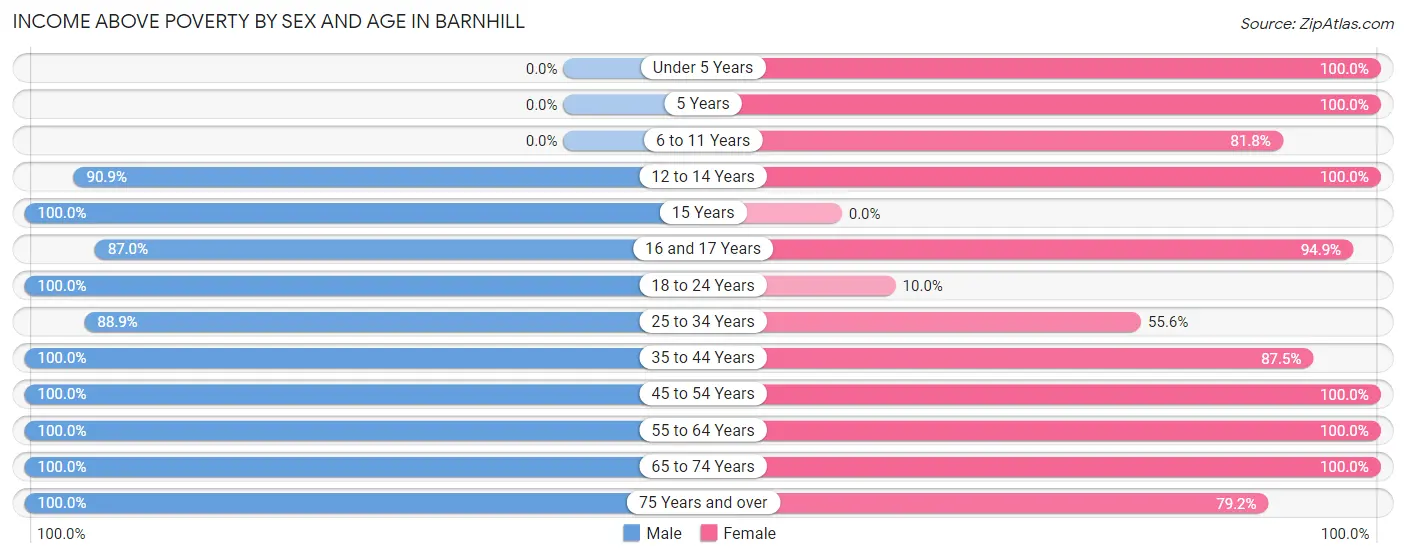
| Age Bracket | Male | Female |
| Under 5 Years | 0 (0.0%) | 3 (100.0%) |
| 5 Years | 0 (0.0%) | 10 (100.0%) |
| 6 to 11 Years | 0 (0.0%) | 9 (81.8%) |
| 12 to 14 Years | 20 (90.9%) | 11 (100.0%) |
| 15 Years | 2 (100.0%) | 0 (0.0%) |
| 16 and 17 Years | 20 (87.0%) | 37 (94.9%) |
| 18 to 24 Years | 114 (100.0%) | 1 (10.0%) |
| 25 to 34 Years | 16 (88.9%) | 15 (55.6%) |
| 35 to 44 Years | 34 (100.0%) | 28 (87.5%) |
| 45 to 54 Years | 28 (100.0%) | 51 (100.0%) |
| 55 to 64 Years | 46 (100.0%) | 55 (100.0%) |
| 65 to 74 Years | 13 (100.0%) | 10 (100.0%) |
| 75 Years and over | 12 (100.0%) | 19 (79.2%) |
| Total | 305 (97.8%) | 249 (88.0%) |
Income Below Poverty Among Married-Couple Families in Barnhill
The poverty statistics for married-couple families in Barnhill show that 2.1% or 2 of the total 94 families live below the poverty line. Families with no children have the highest poverty rate of 2.9%, comprising of 2 families. On the other hand, families with 1 or 2 children have the lowest poverty rate of 0.0%, which includes 0 families.
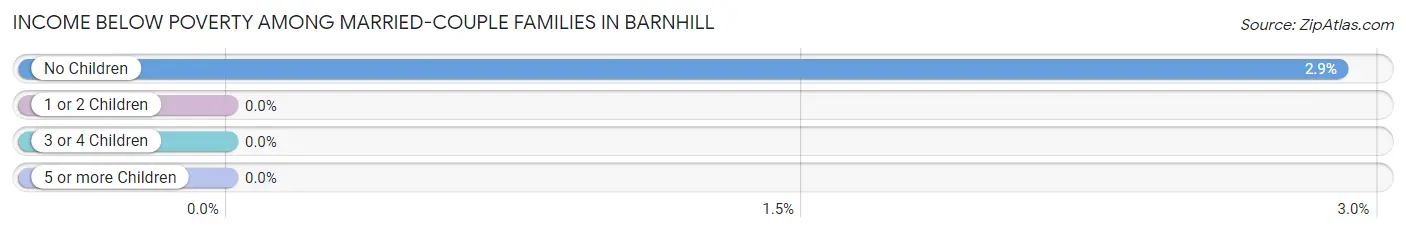
| Children | Above Poverty | Below Poverty |
| No Children | 67 (97.1%) | 2 (2.9%) |
| 1 or 2 Children | 9 (100.0%) | 0 (0.0%) |
| 3 or 4 Children | 16 (100.0%) | 0 (0.0%) |
| 5 or more Children | 0 (0.0%) | 0 (0.0%) |
| Total | 92 (97.9%) | 2 (2.1%) |
Income Below Poverty Among Single-Parent Households in Barnhill
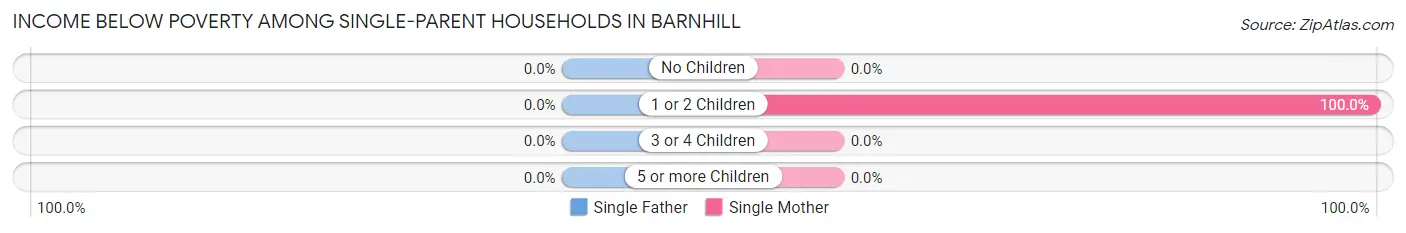
| Children | Single Father | Single Mother |
| No Children | 0 (0.0%) | 0 (0.0%) |
| 1 or 2 Children | 0 (0.0%) | 2 (100.0%) |
| 3 or 4 Children | 0 (0.0%) | 0 (0.0%) |
| 5 or more Children | 0 (0.0%) | 0 (0.0%) |
| Total | 0 (0.0%) | 2 (5.4%) |
Income Below Poverty Among Married-Couple vs Single-Parent Households in Barnhill
The poverty data for Barnhill shows that 2 of the married-couple family households (2.1%) and 2 of the single-parent households (3.8%) are living below the poverty level. Within the married-couple family households, those with no children have the highest poverty rate, with 2 households (2.9%) falling below the poverty line. Among the single-parent households, those with 1 or 2 children have the highest poverty rate, with 2 household (12.5%) living below poverty.
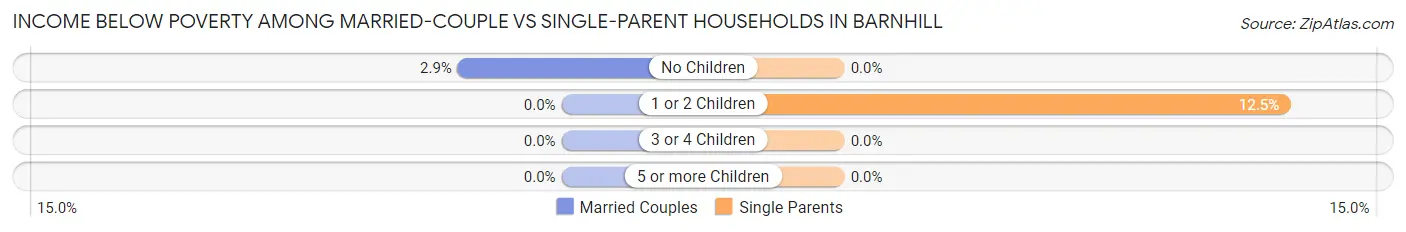
| Children | Married-Couple Families | Single-Parent Households |
| No Children | 2 (2.9%) | 0 (0.0%) |
| 1 or 2 Children | 0 (0.0%) | 2 (12.5%) |
| 3 or 4 Children | 0 (0.0%) | 0 (0.0%) |
| 5 or more Children | 0 (0.0%) | 0 (0.0%) |
| Total | 2 (2.1%) | 2 (3.8%) |
Race in Barnhill
The most populous races in Barnhill are White / Caucasian (470 | 78.2%), Two or more Races (131 | 21.8%), and Hispanic or Latino (39 | 6.5%).
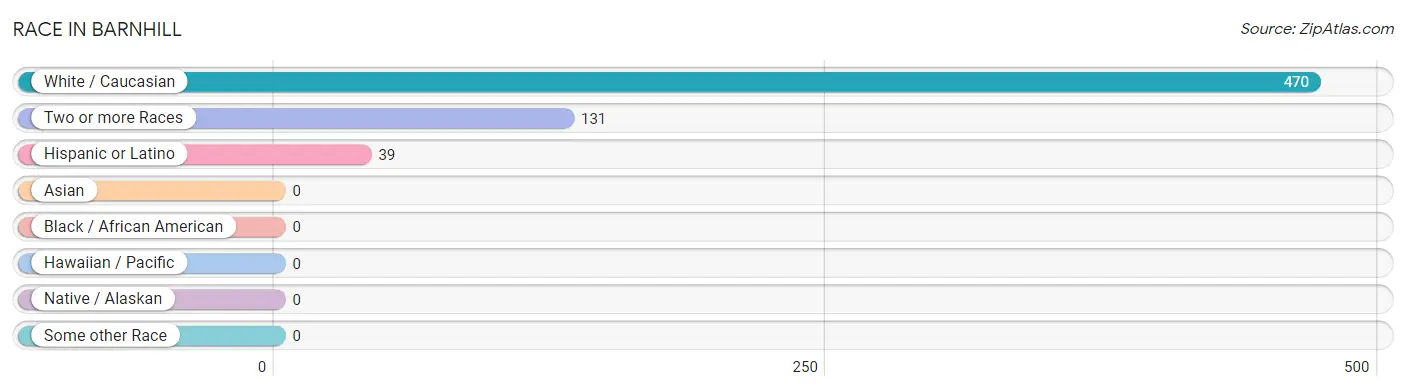
| Race | # Population | % Population |
| Asian | 0 | 0.0% |
| Black / African American | 0 | 0.0% |
| Hawaiian / Pacific | 0 | 0.0% |
| Hispanic or Latino | 39 | 6.5% |
| Native / Alaskan | 0 | 0.0% |
| White / Caucasian | 470 | 78.2% |
| Two or more Races | 131 | 21.8% |
| Some other Race | 0 | 0.0% |
| Total | 601 | 100.0% |
Ancestry in Barnhill
The most populous ancestries reported in Barnhill are French (126 | 21.0%), Irish (120 | 20.0%), English (74 | 12.3%), German (70 | 11.7%), and American (37 | 6.2%), together accounting for 71.1% of all Barnhill residents.
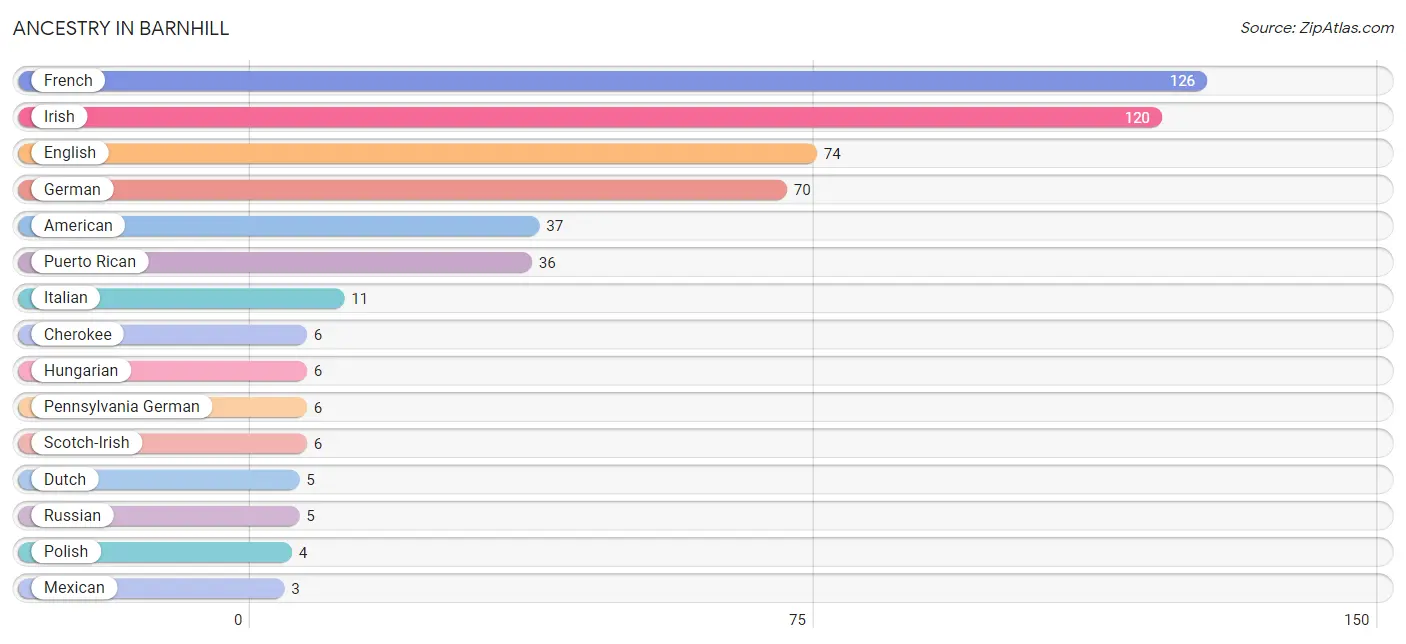
| Ancestry | # Population | % Population |
| American | 37 | 6.2% |
| Cherokee | 6 | 1.0% |
| Dutch | 5 | 0.8% |
| English | 74 | 12.3% |
| French | 126 | 21.0% |
| German | 70 | 11.7% |
| Hungarian | 6 | 1.0% |
| Irish | 120 | 20.0% |
| Italian | 11 | 1.8% |
| Mexican | 3 | 0.5% |
| Northern European | 2 | 0.3% |
| Norwegian | 2 | 0.3% |
| Pennsylvania German | 6 | 1.0% |
| Polish | 4 | 0.7% |
| Puerto Rican | 36 | 6.0% |
| Russian | 5 | 0.8% |
| Scotch-Irish | 6 | 1.0% | View All 17 Rows |
Immigrants in Barnhill

| Immigration Origin | # Population | % Population | View All 0 Rows |
Sex and Age in Barnhill
Sex and Age in Barnhill
The most populous age groups in Barnhill are 20 to 24 Years (108 | 34.4%) for men and 15 to 19 Years (41 | 14.3%) for women.

| Age Bracket | Male | Female |
| Under 5 Years | 0 (0.0%) | 3 (1.1%) |
| 5 to 9 Years | 2 (0.6%) | 18 (6.3%) |
| 10 to 14 Years | 22 (7.0%) | 18 (6.3%) |
| 15 to 19 Years | 31 (9.9%) | 41 (14.3%) |
| 20 to 24 Years | 108 (34.4%) | 8 (2.8%) |
| 25 to 29 Years | 14 (4.5%) | 1 (0.4%) |
| 30 to 34 Years | 4 (1.3%) | 26 (9.1%) |
| 35 to 39 Years | 28 (8.9%) | 20 (7.0%) |
| 40 to 44 Years | 6 (1.9%) | 12 (4.2%) |
| 45 to 49 Years | 16 (5.1%) | 37 (12.9%) |
| 50 to 54 Years | 12 (3.8%) | 14 (4.9%) |
| 55 to 59 Years | 33 (10.5%) | 30 (10.4%) |
| 60 to 64 Years | 13 (4.1%) | 25 (8.7%) |
| 65 to 69 Years | 8 (2.5%) | 7 (2.4%) |
| 70 to 74 Years | 5 (1.6%) | 3 (1.1%) |
| 75 to 79 Years | 5 (1.6%) | 15 (5.2%) |
| 80 to 84 Years | 7 (2.2%) | 9 (3.1%) |
| 85 Years and over | 0 (0.0%) | 0 (0.0%) |
| Total | 314 (100.0%) | 287 (100.0%) |
Families and Households in Barnhill
Median Family Size in Barnhill
The median family size in Barnhill is 3.33 persons per family, with single female/mother families (37 | 25.2%) accounting for the largest median family size of 3.97 persons per family. On the other hand, married-couple families (94 | 63.9%) represent the smallest median family size with 3.04 persons per family.
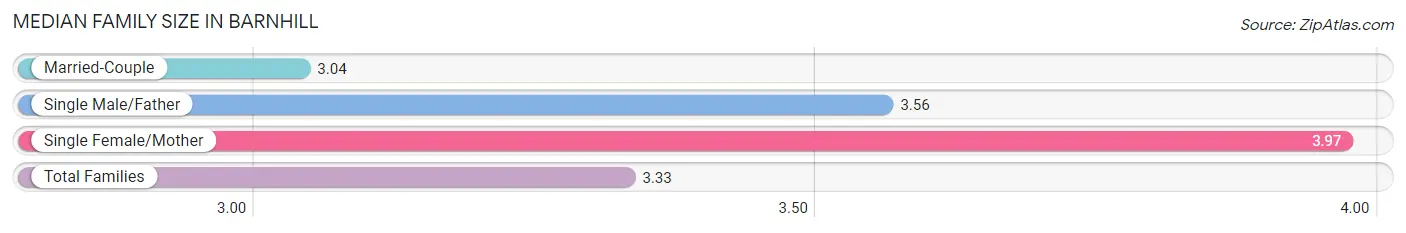
| Family Type | # Families | Family Size |
| Married-Couple | 94 (63.9%) | 3.04 |
| Single Male/Father | 16 (10.9%) | 3.56 |
| Single Female/Mother | 37 (25.2%) | 3.97 |
| Total Families | 147 (100.0%) | 3.33 |
Median Household Size in Barnhill
The median household size in Barnhill is 2.86 persons per household, with single male/father households (16 | 7.6%) accounting for the largest median household size of 5.13 persons per household. non-family households (63 | 30.0%) represent the smallest median household size with 1.35 persons per household.
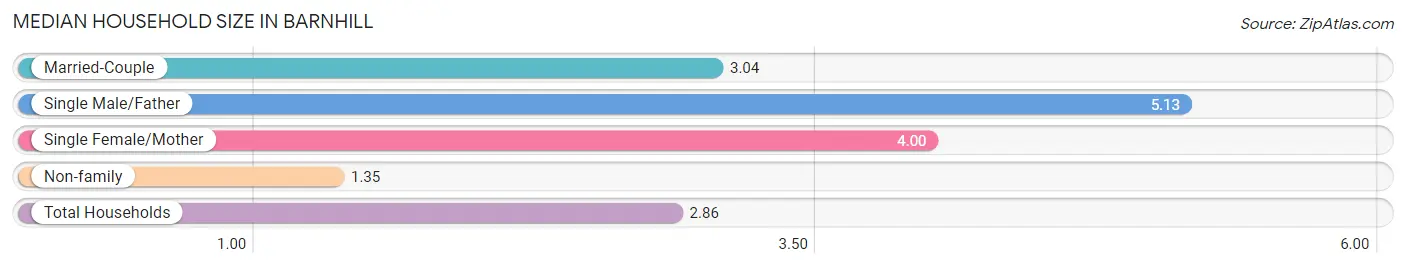
| Household Type | # Households | Household Size |
| Married-Couple | 94 (44.8%) | 3.04 |
| Single Male/Father | 16 (7.6%) | 5.13 |
| Single Female/Mother | 37 (17.6%) | 4.00 |
| Non-family | 63 (30.0%) | 1.35 |
| Total Households | 210 (100.0%) | 2.86 |
Household Size by Marriage Status in Barnhill
Out of a total of 210 households in Barnhill, 147 (70.0%) are family households, while 63 (30.0%) are nonfamily households. The most numerous type of family households are 2-person households, comprising 89, and the most common type of nonfamily households are 1-person households, comprising 45.
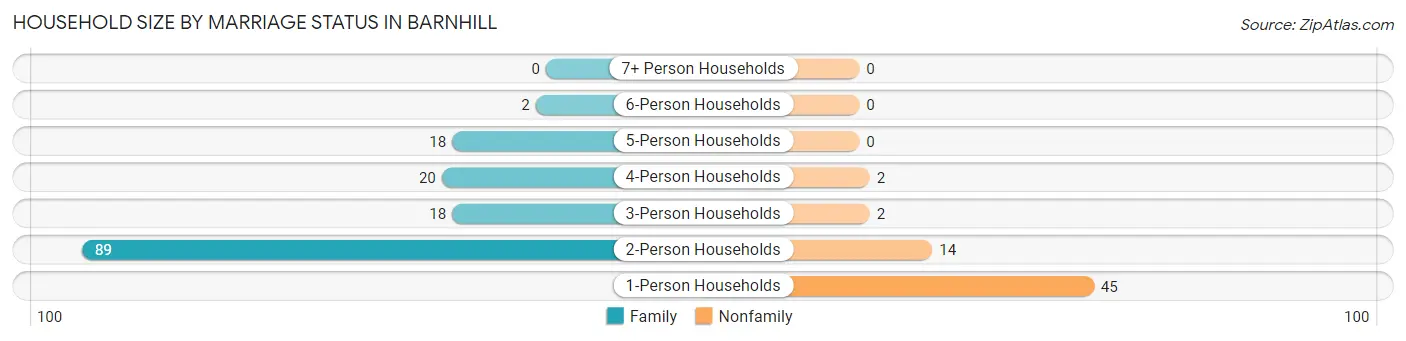
| Household Size | Family Households | Nonfamily Households |
| 1-Person Households | - | 45 (21.4%) |
| 2-Person Households | 89 (42.4%) | 14 (6.7%) |
| 3-Person Households | 18 (8.6%) | 2 (0.9%) |
| 4-Person Households | 20 (9.5%) | 2 (0.9%) |
| 5-Person Households | 18 (8.6%) | 0 (0.0%) |
| 6-Person Households | 2 (0.9%) | 0 (0.0%) |
| 7+ Person Households | 0 (0.0%) | 0 (0.0%) |
| Total | 147 (70.0%) | 63 (30.0%) |
Female Fertility in Barnhill
Fertility by Age in Barnhill
Average fertility rate in Barnhill is 26.0 births per 1,000 women. Women in the age bracket of 20 to 34 years have the highest fertility rate with 114.0 births per 1,000 women. Women in the age bracket of 20 to 34 years acount for 100.0% of all women with births.
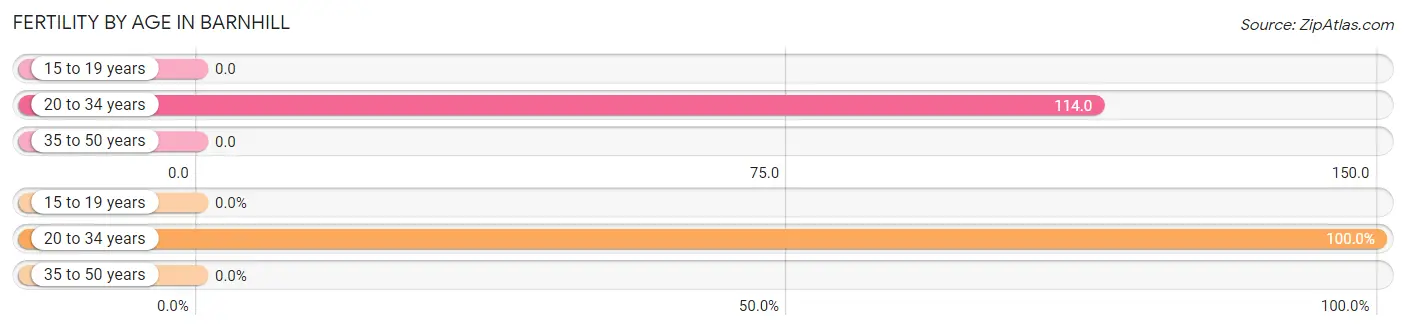
| Age Bracket | Women with Births | Births / 1,000 Women |
| 15 to 19 years | 0 (0.0%) | 0.0 |
| 20 to 34 years | 4 (100.0%) | 114.0 |
| 35 to 50 years | 0 (0.0%) | 0.0 |
| Total | 4 (100.0%) | 26.0 |
Fertility by Age by Marriage Status in Barnhill
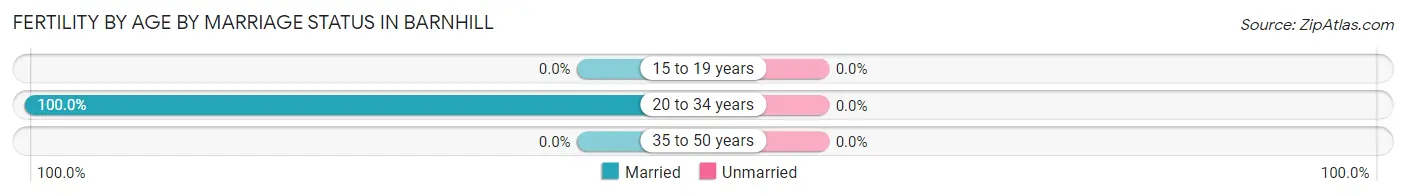
| Age Bracket | Married | Unmarried |
| 15 to 19 years | 0 (0.0%) | 0 (0.0%) |
| 20 to 34 years | 4 (100.0%) | 0 (0.0%) |
| 35 to 50 years | 0 (0.0%) | 0 (0.0%) |
| Total | 4 (100.0%) | 0 (0.0%) |
Fertility by Education in Barnhill
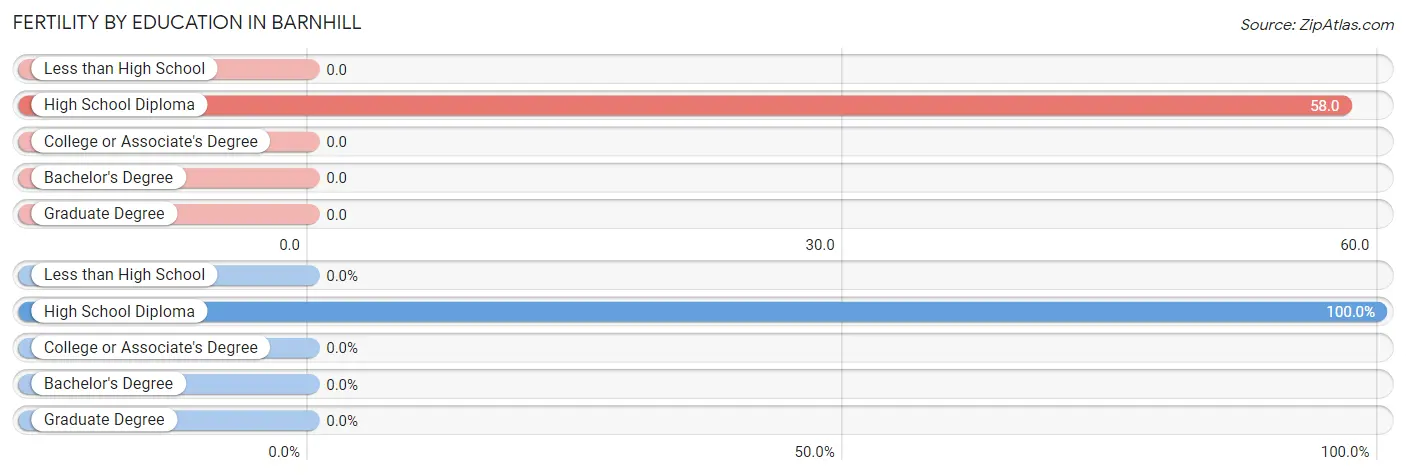
| Educational Attainment | Women with Births | Births / 1,000 Women |
| Less than High School | 0 (0.0%) | 0.0 |
| High School Diploma | 4 (100.0%) | 58.0 |
| College or Associate's Degree | 0 (0.0%) | 0.0 |
| Bachelor's Degree | 0 (0.0%) | 0.0 |
| Graduate Degree | 0 (0.0%) | 0.0 |
| Total | 4 (100.0%) | 26.0 |
Fertility by Education by Marriage Status in Barnhill
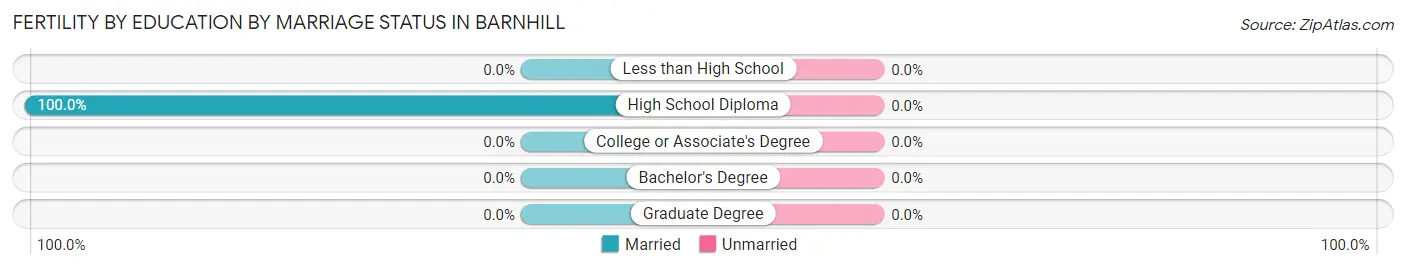
| Educational Attainment | Married | Unmarried |
| Less than High School | 0 (0.0%) | 0 (0.0%) |
| High School Diploma | 4 (100.0%) | 0 (0.0%) |
| College or Associate's Degree | 0 (0.0%) | 0 (0.0%) |
| Bachelor's Degree | 0 (0.0%) | 0 (0.0%) |
| Graduate Degree | 0 (0.0%) | 0 (0.0%) |
| Total | 4 (100.0%) | 0 (0.0%) |
Employment Characteristics in Barnhill
Employment by Class of Employer in Barnhill
Among the 343 employed individuals in Barnhill, private company employees (314 | 91.5%), not-for-profit organizations (11 | 3.2%), and local government employees (8 | 2.3%) make up the most common classes of employment.
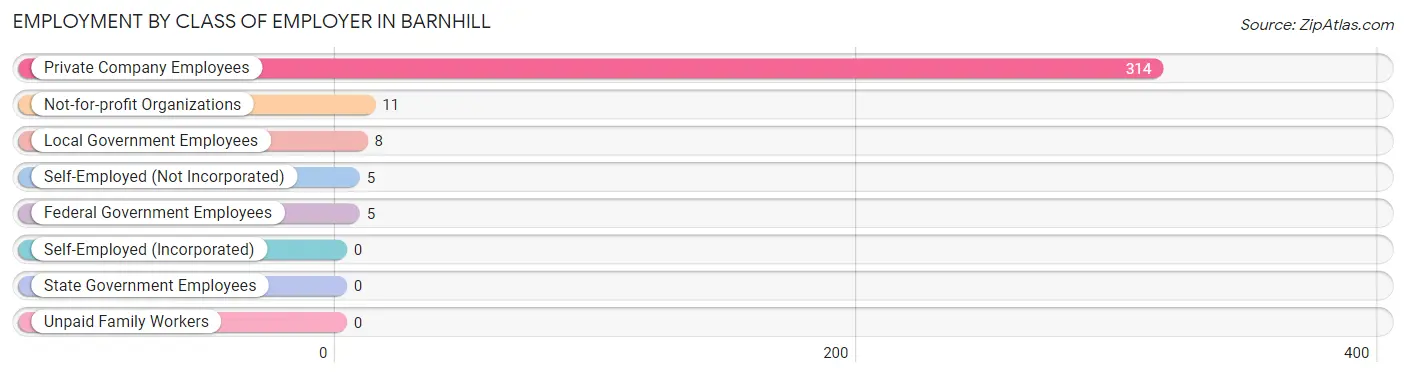
| Employer Class | # Employees | % Employees |
| Private Company Employees | 314 | 91.5% |
| Self-Employed (Incorporated) | 0 | 0.0% |
| Self-Employed (Not Incorporated) | 5 | 1.5% |
| Not-for-profit Organizations | 11 | 3.2% |
| Local Government Employees | 8 | 2.3% |
| State Government Employees | 0 | 0.0% |
| Federal Government Employees | 5 | 1.5% |
| Unpaid Family Workers | 0 | 0.0% |
| Total | 343 | 100.0% |
Employment Status by Age in Barnhill
According to the labor force statistics for Barnhill, out of the total population over 16 years of age (536), 70.7% or 379 individuals are in the labor force, with 8.4% or 32 of them unemployed. The age group with the highest labor force participation rate is 25 to 29 years, with 100.0% or 15 individuals in the labor force. Within the labor force, the 16 to 19 years age range has the highest percentage of unemployed individuals, with 50.0% or 12 of them being unemployed.
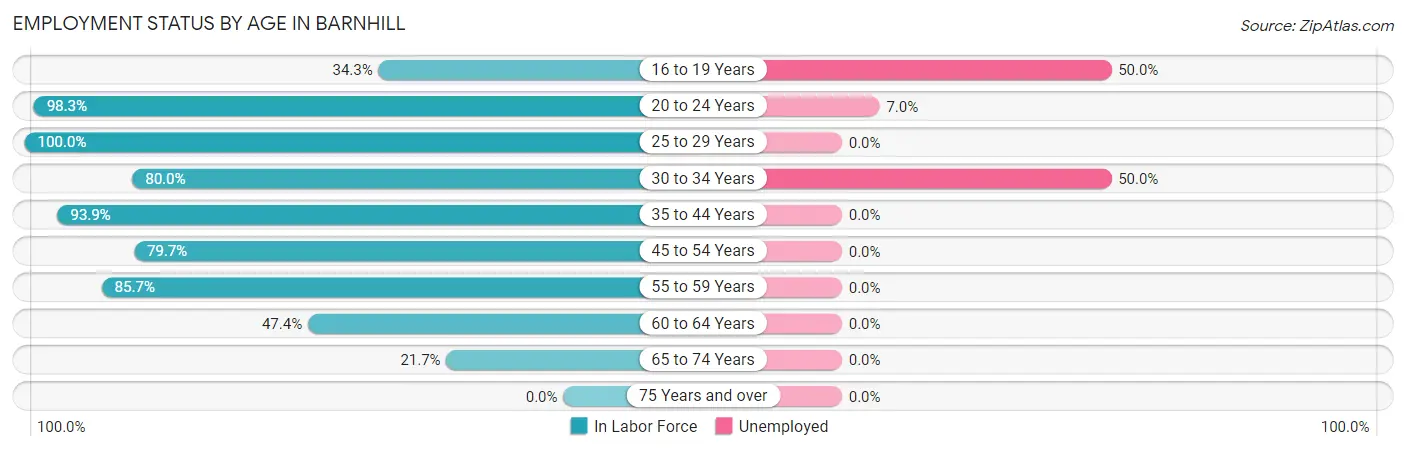
| Age Bracket | In Labor Force | Unemployed |
| 16 to 19 Years | 24 (34.3%) | 12 (50.0%) |
| 20 to 24 Years | 114 (98.3%) | 8 (7.0%) |
| 25 to 29 Years | 15 (100.0%) | 0 (0.0%) |
| 30 to 34 Years | 24 (80.0%) | 12 (50.0%) |
| 35 to 44 Years | 62 (93.9%) | 0 (0.0%) |
| 45 to 54 Years | 63 (79.7%) | 0 (0.0%) |
| 55 to 59 Years | 54 (85.7%) | 0 (0.0%) |
| 60 to 64 Years | 18 (47.4%) | 0 (0.0%) |
| 65 to 74 Years | 5 (21.7%) | 0 (0.0%) |
| 75 Years and over | 0 (0.0%) | 0 (0.0%) |
| Total | 379 (70.7%) | 32 (8.4%) |
Employment Status by Educational Attainment in Barnhill
According to labor force statistics for Barnhill, 81.1% of individuals (236) out of the total population between 25 and 64 years of age (291) are in the labor force, with 5.1% or 12 of them being unemployed. The group with the highest labor force participation rate are those with the educational attainment of bachelor's degree or higher, with 100.0% or 5 individuals in the labor force. Within the labor force, individuals with less than high school education have the highest percentage of unemployment, with 45.5% or 10 of them being unemployed.
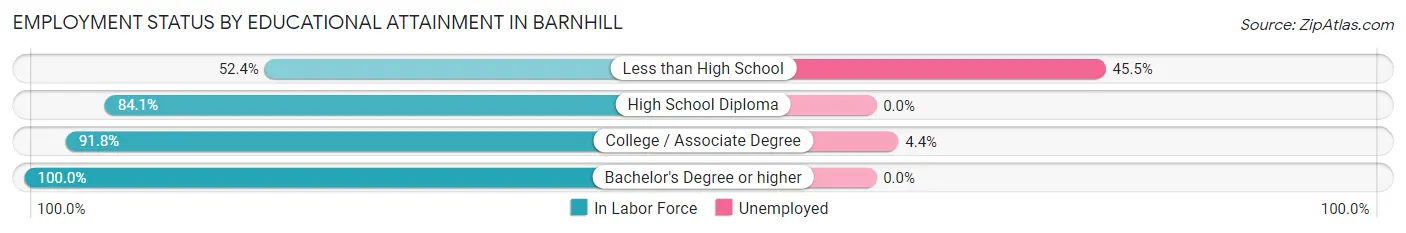
| Educational Attainment | In Labor Force | Unemployed |
| Less than High School | 22 (52.4%) | 19 (45.5%) |
| High School Diploma | 164 (84.1%) | 0 (0.0%) |
| College / Associate Degree | 45 (91.8%) | 2 (4.4%) |
| Bachelor's Degree or higher | 5 (100.0%) | 0 (0.0%) |
| Total | 236 (81.1%) | 15 (5.1%) |
Employment Occupations by Sex in Barnhill
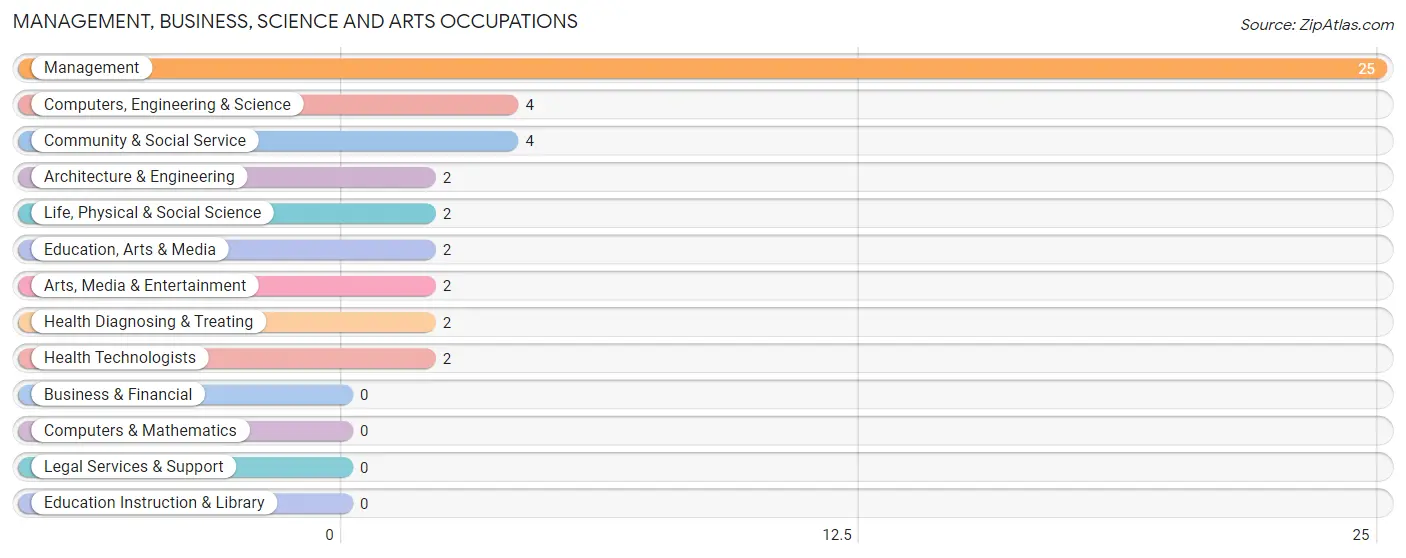
Management, Business, Science and Arts Occupations
The most common Management, Business, Science and Arts occupations in Barnhill are Management (25 | 7.2%), Computers, Engineering & Science (4 | 1.1%), Community & Social Service (4 | 1.1%), Architecture & Engineering (2 | 0.6%), and Life, Physical & Social Science (2 | 0.6%).
Management, Business, Science and Arts Occupations by Sex
Within the Management, Business, Science and Arts occupations in Barnhill, the most male-oriented occupations are Computers, Engineering & Science (100.0%), Architecture & Engineering (100.0%), and Life, Physical & Social Science (100.0%), while the most female-oriented occupations are Education, Arts & Media (100.0%), Health Diagnosing & Treating (100.0%), and Health Technologists (100.0%).
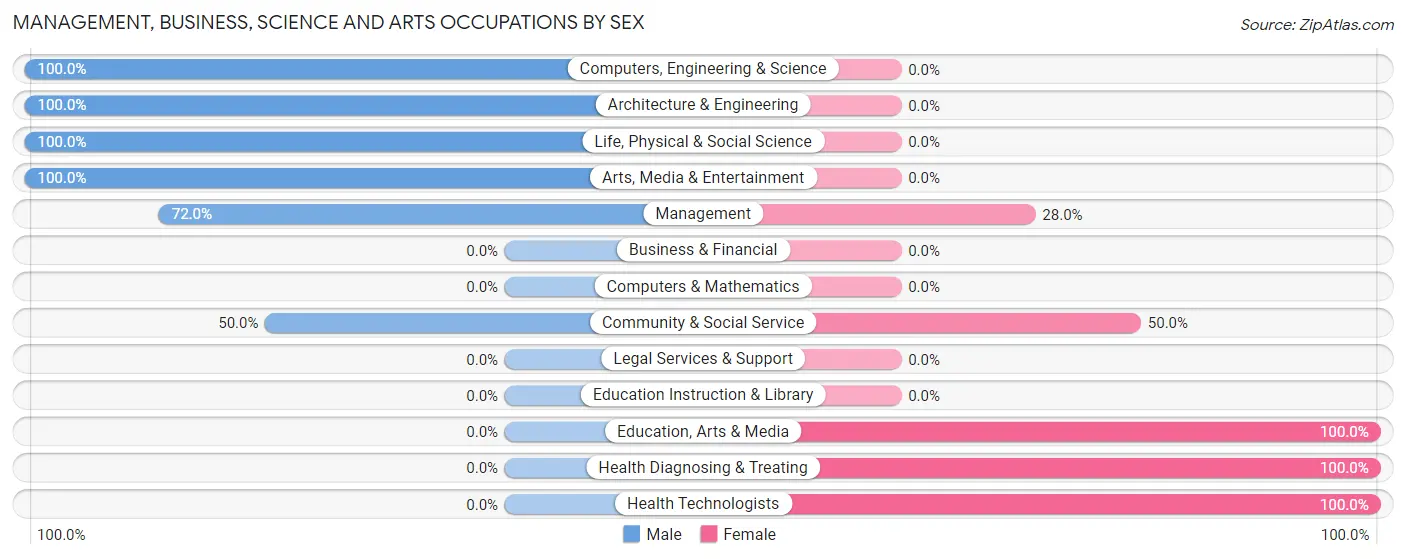
| Occupation | Male | Female |
| Management | 18 (72.0%) | 7 (28.0%) |
| Business & Financial | 0 (0.0%) | 0 (0.0%) |
| Computers, Engineering & Science | 4 (100.0%) | 0 (0.0%) |
| Computers & Mathematics | 0 (0.0%) | 0 (0.0%) |
| Architecture & Engineering | 2 (100.0%) | 0 (0.0%) |
| Life, Physical & Social Science | 2 (100.0%) | 0 (0.0%) |
| Community & Social Service | 2 (50.0%) | 2 (50.0%) |
| Education, Arts & Media | 0 (0.0%) | 2 (100.0%) |
| Legal Services & Support | 0 (0.0%) | 0 (0.0%) |
| Education Instruction & Library | 0 (0.0%) | 0 (0.0%) |
| Arts, Media & Entertainment | 2 (100.0%) | 0 (0.0%) |
| Health Diagnosing & Treating | 0 (0.0%) | 2 (100.0%) |
| Health Technologists | 0 (0.0%) | 2 (100.0%) |
| Total (Category) | 24 (68.6%) | 11 (31.4%) |
| Total (Overall) | 224 (64.5%) | 123 (35.4%) |
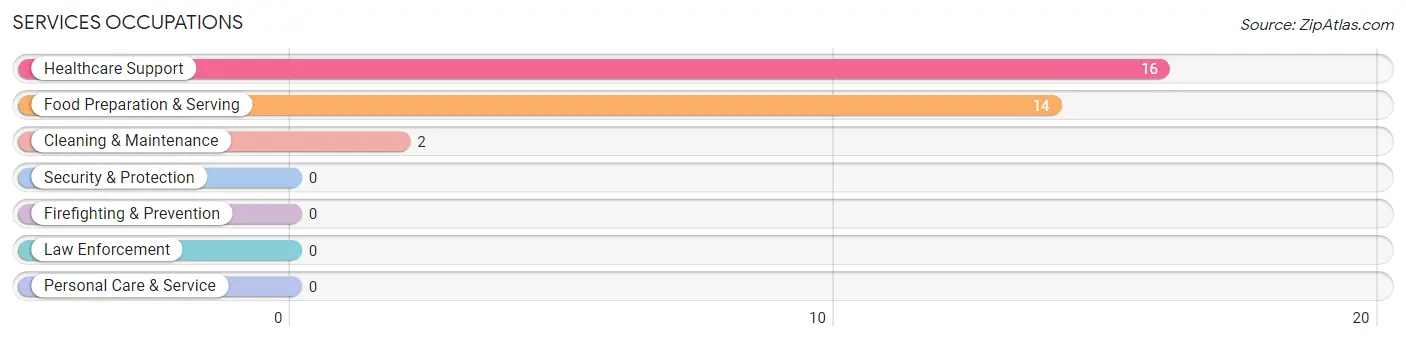
Services Occupations
The most common Services occupations in Barnhill are Healthcare Support (16 | 4.6%), Food Preparation & Serving (14 | 4.0%), and Cleaning & Maintenance (2 | 0.6%).
Services Occupations by Sex
Within the Services occupations in Barnhill, the most male-oriented occupations are Cleaning & Maintenance (100.0%), and Food Preparation & Serving (42.9%), while the most female-oriented occupations are Healthcare Support (100.0%), and Food Preparation & Serving (57.1%).
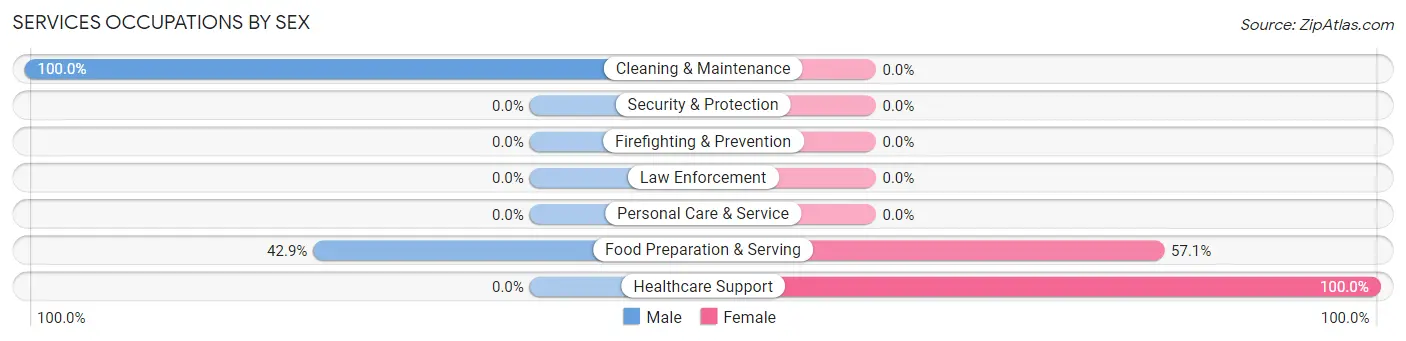
| Occupation | Male | Female |
| Healthcare Support | 0 (0.0%) | 16 (100.0%) |
| Security & Protection | 0 (0.0%) | 0 (0.0%) |
| Firefighting & Prevention | 0 (0.0%) | 0 (0.0%) |
| Law Enforcement | 0 (0.0%) | 0 (0.0%) |
| Food Preparation & Serving | 6 (42.9%) | 8 (57.1%) |
| Cleaning & Maintenance | 2 (100.0%) | 0 (0.0%) |
| Personal Care & Service | 0 (0.0%) | 0 (0.0%) |
| Total (Category) | 8 (25.0%) | 24 (75.0%) |
| Total (Overall) | 224 (64.5%) | 123 (35.4%) |
Sales and Office Occupations
The most common Sales and Office occupations in Barnhill are Office & Administration (29 | 8.4%), and Sales & Related (15 | 4.3%).
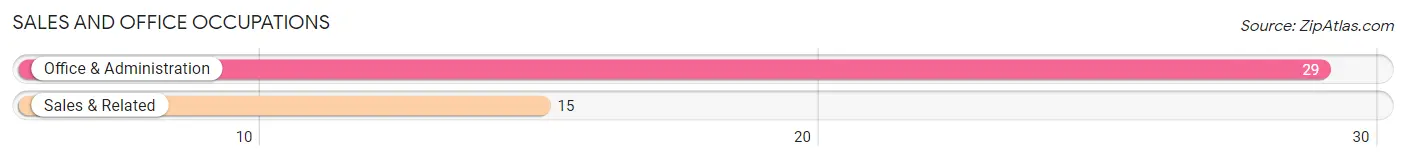
Sales and Office Occupations by Sex

| Occupation | Male | Female |
| Sales & Related | 7 (46.7%) | 8 (53.3%) |
| Office & Administration | 0 (0.0%) | 29 (100.0%) |
| Total (Category) | 7 (15.9%) | 37 (84.1%) |
| Total (Overall) | 224 (64.5%) | 123 (35.4%) |
Natural Resources, Construction and Maintenance Occupations
The most common Natural Resources, Construction and Maintenance occupations in Barnhill are Construction & Extraction (29 | 8.4%), and Installation, Maintenance & Repair (21 | 6.0%).
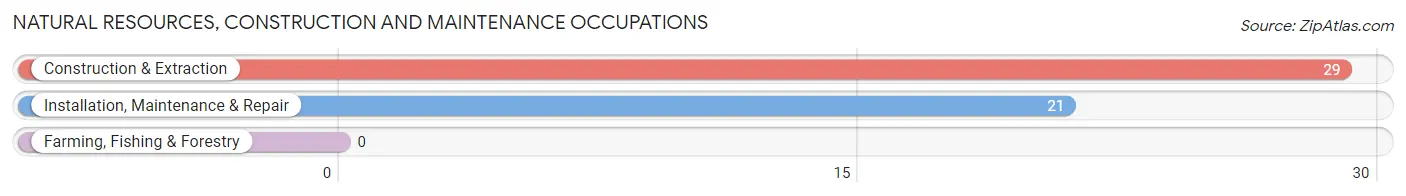
Natural Resources, Construction and Maintenance Occupations by Sex
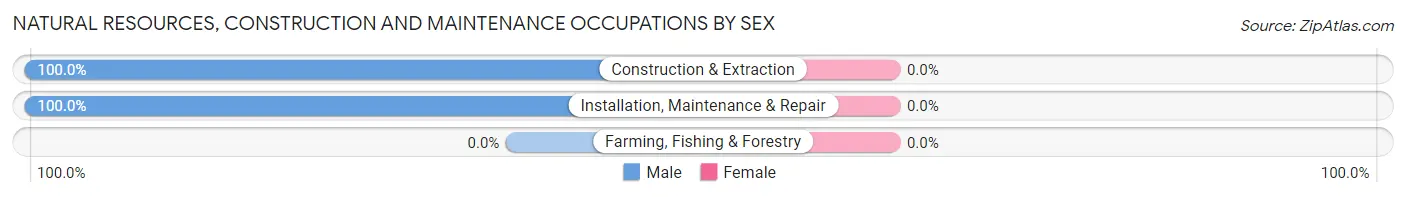
| Occupation | Male | Female |
| Farming, Fishing & Forestry | 0 (0.0%) | 0 (0.0%) |
| Construction & Extraction | 29 (100.0%) | 0 (0.0%) |
| Installation, Maintenance & Repair | 21 (100.0%) | 0 (0.0%) |
| Total (Category) | 50 (100.0%) | 0 (0.0%) |
| Total (Overall) | 224 (64.5%) | 123 (35.4%) |
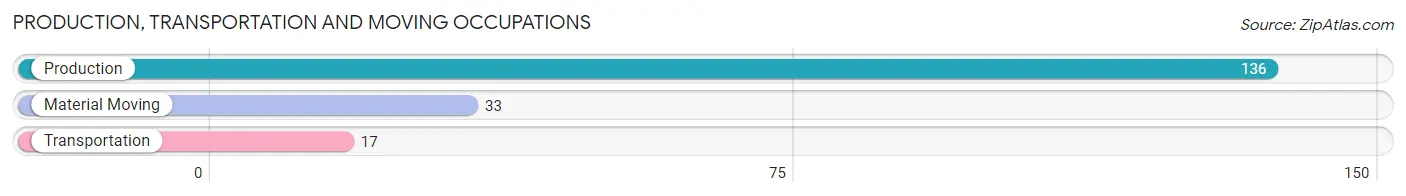
Production, Transportation and Moving Occupations
The most common Production, Transportation and Moving occupations in Barnhill are Production (136 | 39.2%), Material Moving (33 | 9.5%), and Transportation (17 | 4.9%).
Production, Transportation and Moving Occupations by Sex
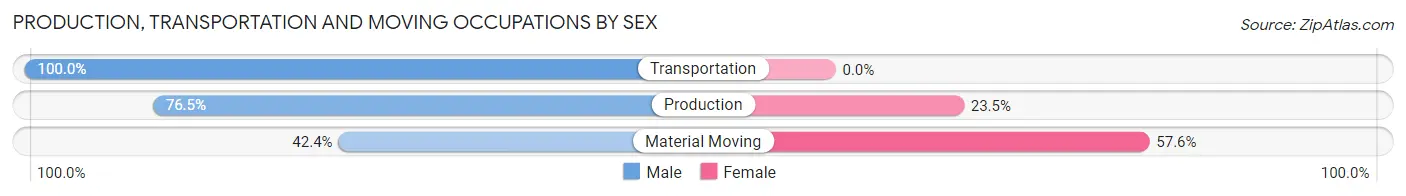
| Occupation | Male | Female |
| Production | 104 (76.5%) | 32 (23.5%) |
| Transportation | 17 (100.0%) | 0 (0.0%) |
| Material Moving | 14 (42.4%) | 19 (57.6%) |
| Total (Category) | 135 (72.6%) | 51 (27.4%) |
| Total (Overall) | 224 (64.5%) | 123 (35.4%) |
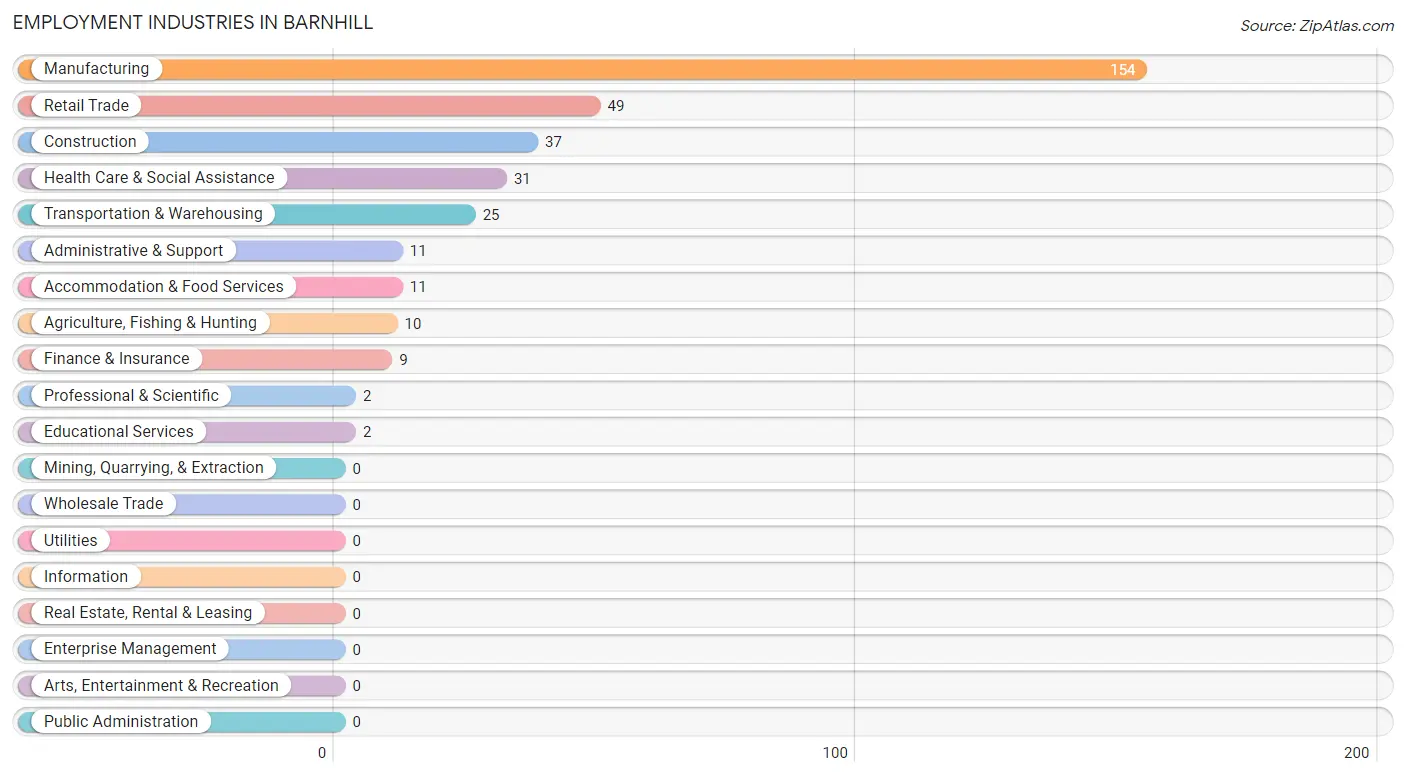
Employment Industries by Sex in Barnhill
Employment Industries in Barnhill
The major employment industries in Barnhill include Manufacturing (154 | 44.4%), Retail Trade (49 | 14.1%), Construction (37 | 10.7%), Health Care & Social Assistance (31 | 8.9%), and Transportation & Warehousing (25 | 7.2%).
Employment Industries by Sex in Barnhill
The Barnhill industries that see more men than women are Agriculture, Fishing & Hunting (100.0%), Construction (100.0%), and Professional & Scientific (100.0%), whereas the industries that tend to have a higher number of women are Finance & Insurance (100.0%), Educational Services (100.0%), and Health Care & Social Assistance (100.0%).
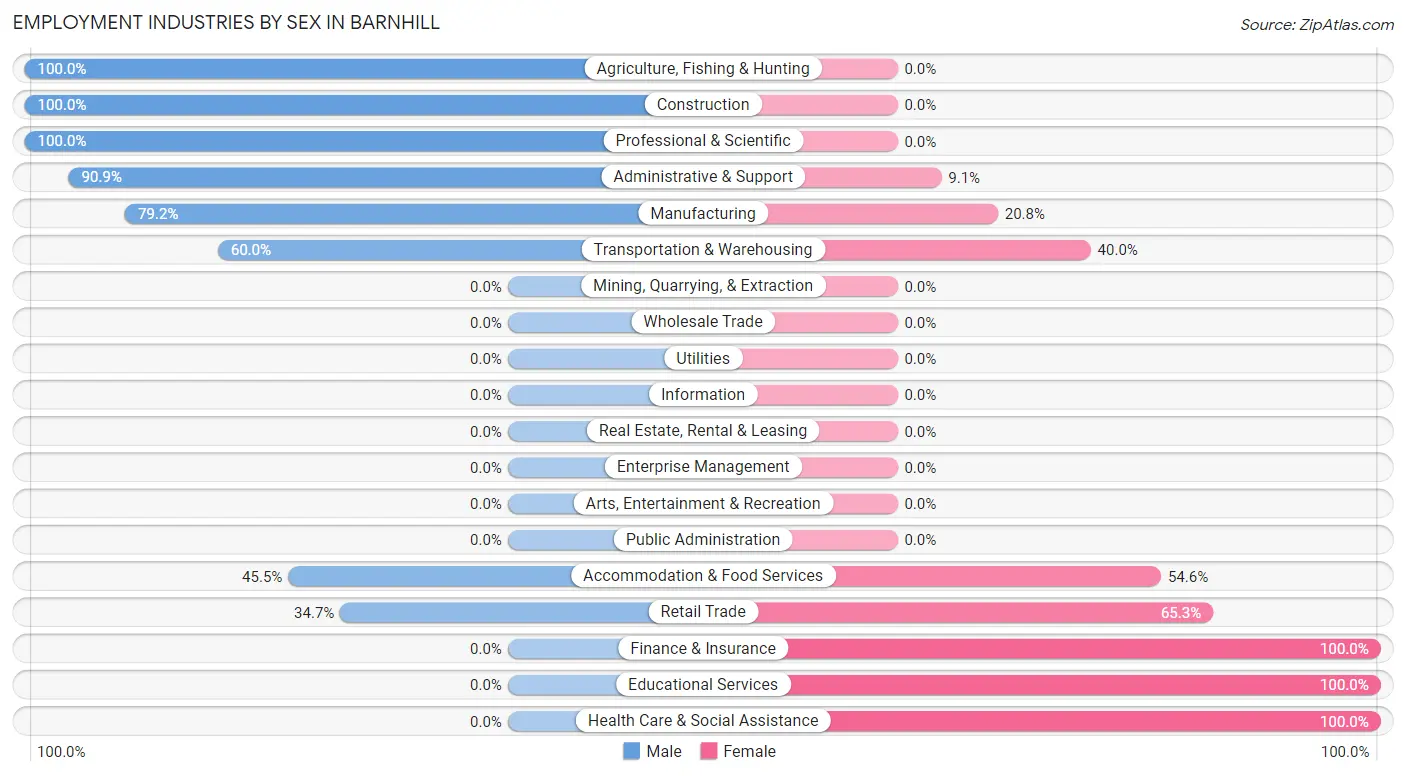
| Industry | Male | Female |
| Agriculture, Fishing & Hunting | 10 (100.0%) | 0 (0.0%) |
| Mining, Quarrying, & Extraction | 0 (0.0%) | 0 (0.0%) |
| Construction | 37 (100.0%) | 0 (0.0%) |
| Manufacturing | 122 (79.2%) | 32 (20.8%) |
| Wholesale Trade | 0 (0.0%) | 0 (0.0%) |
| Retail Trade | 17 (34.7%) | 32 (65.3%) |
| Transportation & Warehousing | 15 (60.0%) | 10 (40.0%) |
| Utilities | 0 (0.0%) | 0 (0.0%) |
| Information | 0 (0.0%) | 0 (0.0%) |
| Finance & Insurance | 0 (0.0%) | 9 (100.0%) |
| Real Estate, Rental & Leasing | 0 (0.0%) | 0 (0.0%) |
| Professional & Scientific | 2 (100.0%) | 0 (0.0%) |
| Enterprise Management | 0 (0.0%) | 0 (0.0%) |
| Administrative & Support | 10 (90.9%) | 1 (9.1%) |
| Educational Services | 0 (0.0%) | 2 (100.0%) |
| Health Care & Social Assistance | 0 (0.0%) | 31 (100.0%) |
| Arts, Entertainment & Recreation | 0 (0.0%) | 0 (0.0%) |
| Accommodation & Food Services | 5 (45.5%) | 6 (54.5%) |
| Public Administration | 0 (0.0%) | 0 (0.0%) |
| Total | 224 (64.5%) | 123 (35.4%) |
Education in Barnhill
School Enrollment in Barnhill
The most common levels of schooling among the 133 students in Barnhill are high school (68 | 51.1%), middle school (37 | 27.8%), and elementary school (13 | 9.8%).
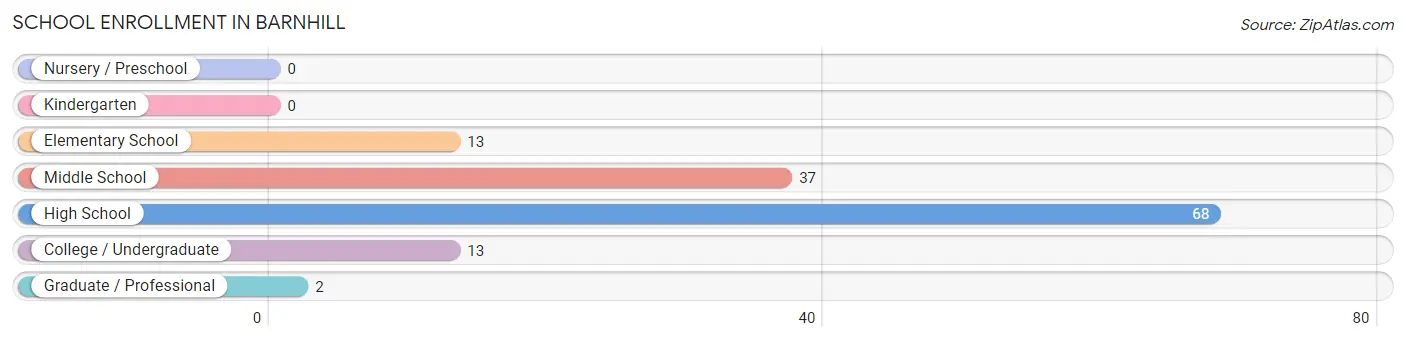
| School Level | # Students | % Students |
| Nursery / Preschool | 0 | 0.0% |
| Kindergarten | 0 | 0.0% |
| Elementary School | 13 | 9.8% |
| Middle School | 37 | 27.8% |
| High School | 68 | 51.1% |
| College / Undergraduate | 13 | 9.8% |
| Graduate / Professional | 2 | 1.5% |
| Total | 133 | 100.0% |
School Enrollment by Age by Funding Source in Barnhill
Out of a total of 133 students who are enrolled in schools in Barnhill, 22 (16.5%) attend a private institution, while the remaining 111 (83.5%) are enrolled in public schools. The age group of 15 to 17 year olds has the highest likelihood of being enrolled in private schools, with 17 (26.6% in the age bracket) enrolled. Conversely, the age group of 5 to 9 year old has the lowest likelihood of being enrolled in a private school, with 10 (100.0% in the age bracket) attending a public institution.
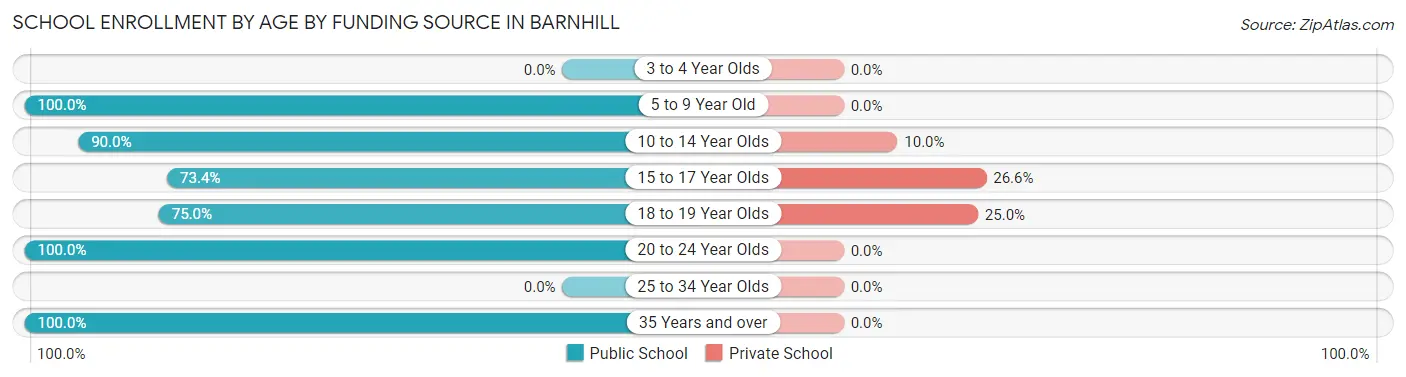
| Age Bracket | Public School | Private School |
| 3 to 4 Year Olds | 0 (0.0%) | 0 (0.0%) |
| 5 to 9 Year Old | 10 (100.0%) | 0 (0.0%) |
| 10 to 14 Year Olds | 36 (90.0%) | 4 (10.0%) |
| 15 to 17 Year Olds | 47 (73.4%) | 17 (26.6%) |
| 18 to 19 Year Olds | 3 (75.0%) | 1 (25.0%) |
| 20 to 24 Year Olds | 8 (100.0%) | 0 (0.0%) |
| 25 to 34 Year Olds | 0 (0.0%) | 0 (0.0%) |
| 35 Years and over | 7 (100.0%) | 0 (0.0%) |
| Total | 111 (83.5%) | 22 (16.5%) |
Educational Attainment by Field of Study in Barnhill
Education (6 | 54.5%), and engineering (5 | 45.5%) are the most common fields of study among 11 individuals in Barnhill who have obtained a bachelor's degree or higher.
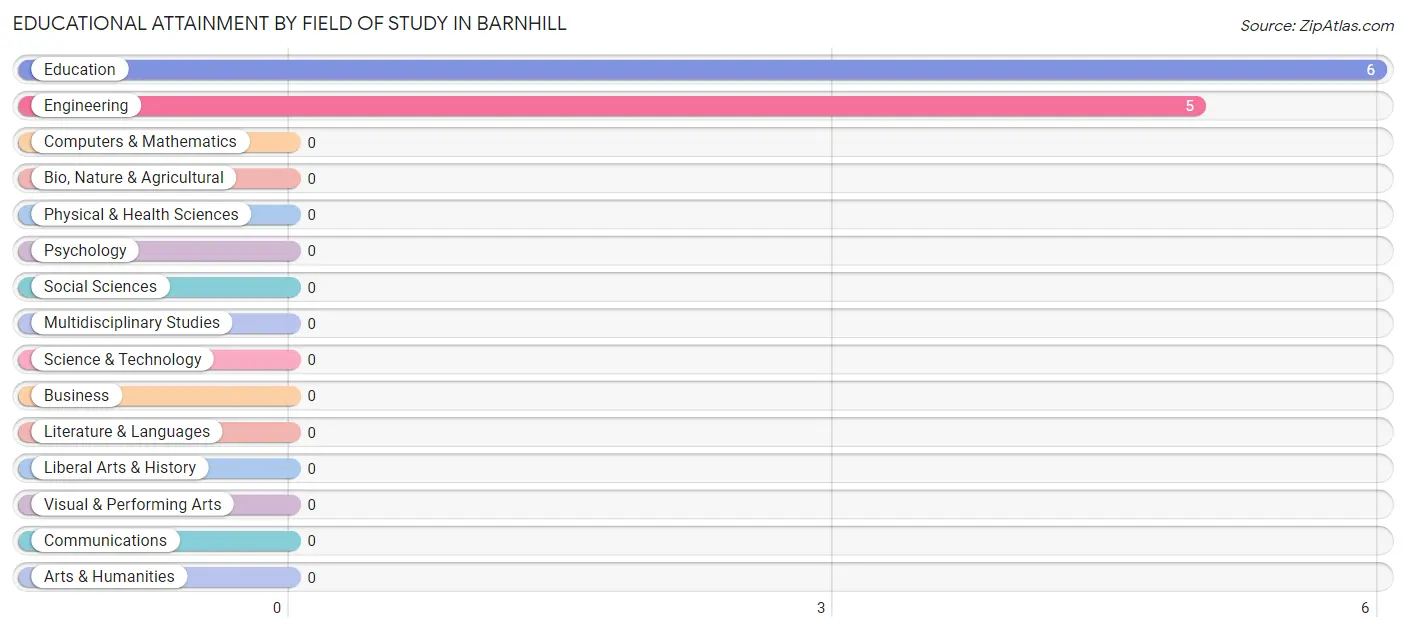
| Field of Study | # Graduates | % Graduates |
| Computers & Mathematics | 0 | 0.0% |
| Bio, Nature & Agricultural | 0 | 0.0% |
| Physical & Health Sciences | 0 | 0.0% |
| Psychology | 0 | 0.0% |
| Social Sciences | 0 | 0.0% |
| Engineering | 5 | 45.5% |
| Multidisciplinary Studies | 0 | 0.0% |
| Science & Technology | 0 | 0.0% |
| Business | 0 | 0.0% |
| Education | 6 | 54.5% |
| Literature & Languages | 0 | 0.0% |
| Liberal Arts & History | 0 | 0.0% |
| Visual & Performing Arts | 0 | 0.0% |
| Communications | 0 | 0.0% |
| Arts & Humanities | 0 | 0.0% |
| Total | 11 | 100.0% |
Transportation & Commute in Barnhill
Vehicle Availability by Sex in Barnhill
The most prevalent vehicle ownership categories in Barnhill are males with 1 vehicle (105, accounting for 47.7%) and females with 1 vehicle (37, making up 85.4%).
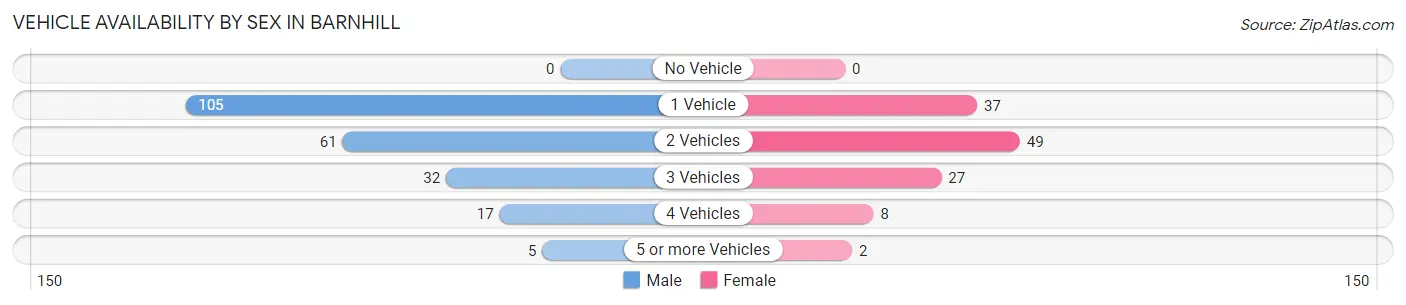
| Vehicles Available | Male | Female |
| No Vehicle | 0 (0.0%) | 0 (0.0%) |
| 1 Vehicle | 105 (47.7%) | 37 (30.1%) |
| 2 Vehicles | 61 (27.7%) | 49 (39.8%) |
| 3 Vehicles | 32 (14.5%) | 27 (22.0%) |
| 4 Vehicles | 17 (7.7%) | 8 (6.5%) |
| 5 or more Vehicles | 5 (2.3%) | 2 (1.6%) |
| Total | 220 (100.0%) | 123 (100.0%) |
Commute Time in Barnhill
The most frequently occuring commute durations in Barnhill are 30 to 34 minutes (124 commuters, 36.1%), 10 to 14 minutes (71 commuters, 20.7%), and 20 to 24 minutes (58 commuters, 16.9%).
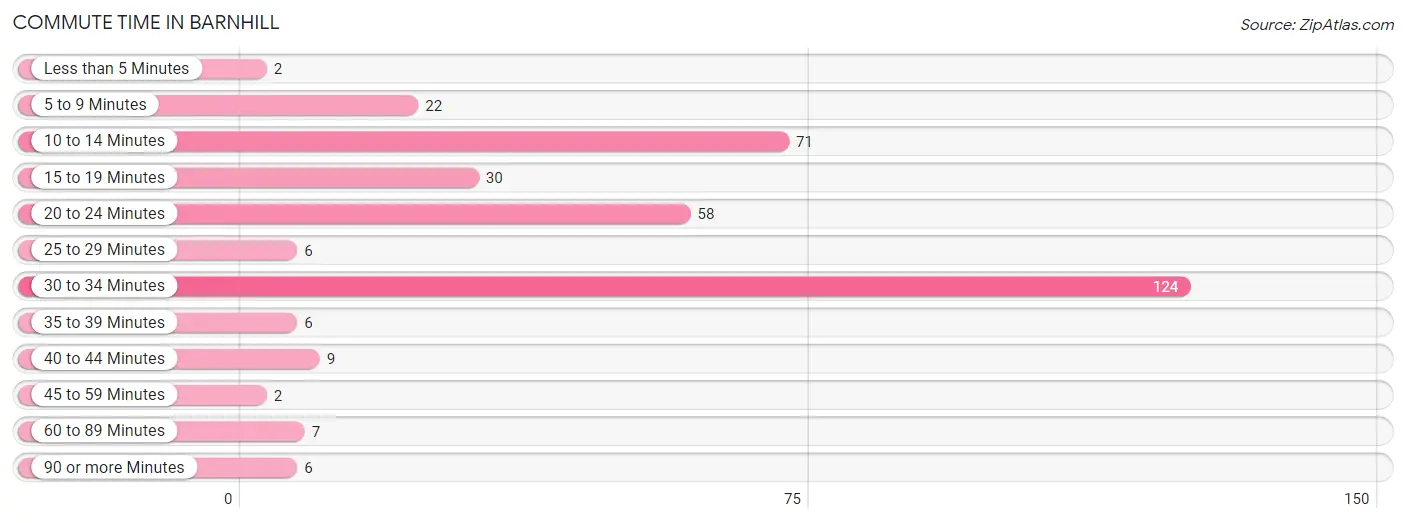
| Commute Time | # Commuters | % Commuters |
| Less than 5 Minutes | 2 | 0.6% |
| 5 to 9 Minutes | 22 | 6.4% |
| 10 to 14 Minutes | 71 | 20.7% |
| 15 to 19 Minutes | 30 | 8.7% |
| 20 to 24 Minutes | 58 | 16.9% |
| 25 to 29 Minutes | 6 | 1.8% |
| 30 to 34 Minutes | 124 | 36.1% |
| 35 to 39 Minutes | 6 | 1.8% |
| 40 to 44 Minutes | 9 | 2.6% |
| 45 to 59 Minutes | 2 | 0.6% |
| 60 to 89 Minutes | 7 | 2.0% |
| 90 or more Minutes | 6 | 1.8% |
Commute Time by Sex in Barnhill
The most common commute times in Barnhill are 30 to 34 minutes (115 commuters, 52.3%) for males and 10 to 14 minutes (50 commuters, 40.6%) for females.
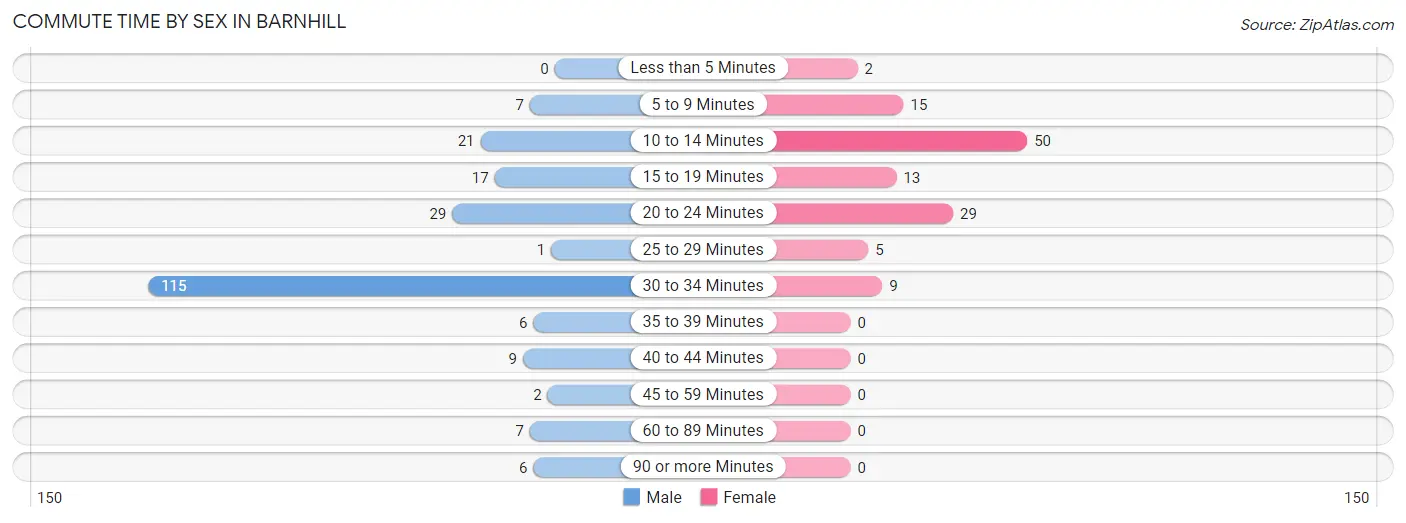
| Commute Time | Male | Female |
| Less than 5 Minutes | 0 (0.0%) | 2 (1.6%) |
| 5 to 9 Minutes | 7 (3.2%) | 15 (12.2%) |
| 10 to 14 Minutes | 21 (9.6%) | 50 (40.6%) |
| 15 to 19 Minutes | 17 (7.7%) | 13 (10.6%) |
| 20 to 24 Minutes | 29 (13.2%) | 29 (23.6%) |
| 25 to 29 Minutes | 1 (0.4%) | 5 (4.1%) |
| 30 to 34 Minutes | 115 (52.3%) | 9 (7.3%) |
| 35 to 39 Minutes | 6 (2.7%) | 0 (0.0%) |
| 40 to 44 Minutes | 9 (4.1%) | 0 (0.0%) |
| 45 to 59 Minutes | 2 (0.9%) | 0 (0.0%) |
| 60 to 89 Minutes | 7 (3.2%) | 0 (0.0%) |
| 90 or more Minutes | 6 (2.7%) | 0 (0.0%) |
Time of Departure to Work by Sex in Barnhill
The most frequent times of departure to work in Barnhill are 6:30 AM to 6:59 AM (133, 60.5%) for males and 7:30 AM to 7:59 AM (37, 30.1%) for females.
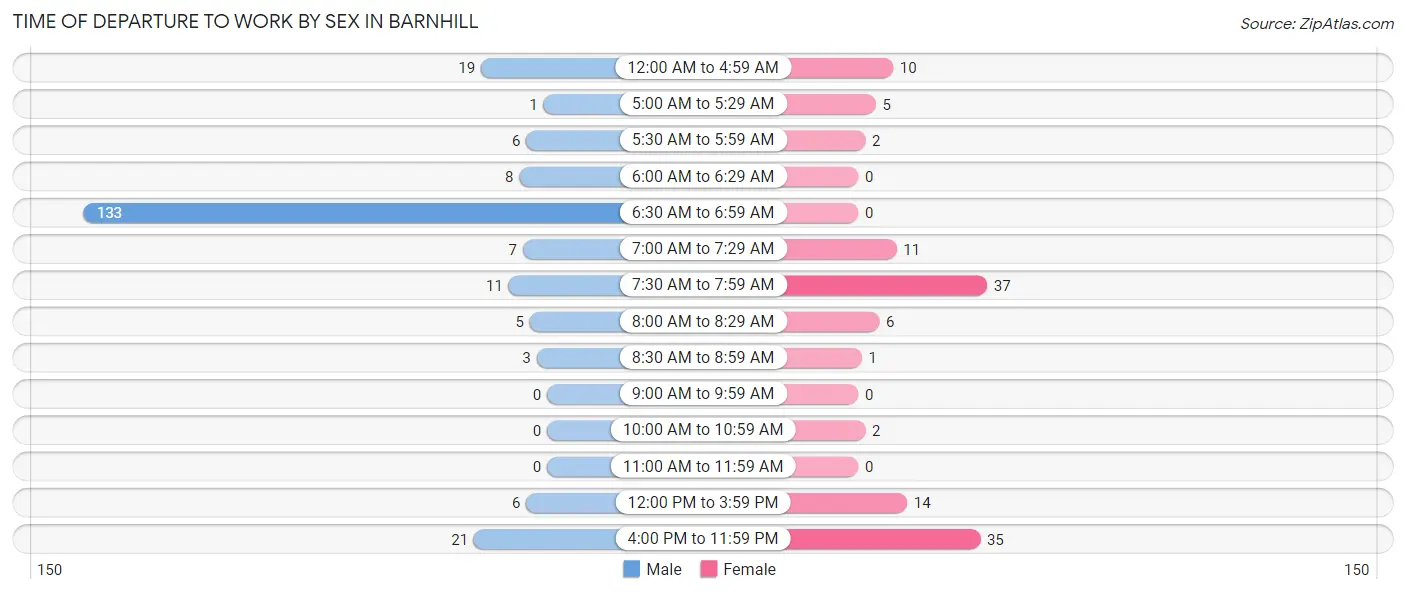
| Time of Departure | Male | Female |
| 12:00 AM to 4:59 AM | 19 (8.6%) | 10 (8.1%) |
| 5:00 AM to 5:29 AM | 1 (0.4%) | 5 (4.1%) |
| 5:30 AM to 5:59 AM | 6 (2.7%) | 2 (1.6%) |
| 6:00 AM to 6:29 AM | 8 (3.6%) | 0 (0.0%) |
| 6:30 AM to 6:59 AM | 133 (60.5%) | 0 (0.0%) |
| 7:00 AM to 7:29 AM | 7 (3.2%) | 11 (8.9%) |
| 7:30 AM to 7:59 AM | 11 (5.0%) | 37 (30.1%) |
| 8:00 AM to 8:29 AM | 5 (2.3%) | 6 (4.9%) |
| 8:30 AM to 8:59 AM | 3 (1.4%) | 1 (0.8%) |
| 9:00 AM to 9:59 AM | 0 (0.0%) | 0 (0.0%) |
| 10:00 AM to 10:59 AM | 0 (0.0%) | 2 (1.6%) |
| 11:00 AM to 11:59 AM | 0 (0.0%) | 0 (0.0%) |
| 12:00 PM to 3:59 PM | 6 (2.7%) | 14 (11.4%) |
| 4:00 PM to 11:59 PM | 21 (9.6%) | 35 (28.5%) |
| Total | 220 (100.0%) | 123 (100.0%) |
Housing Occupancy in Barnhill
Occupancy by Ownership in Barnhill
Of the total 210 dwellings in Barnhill, owner-occupied units account for 180 (85.7%), while renter-occupied units make up 30 (14.3%).
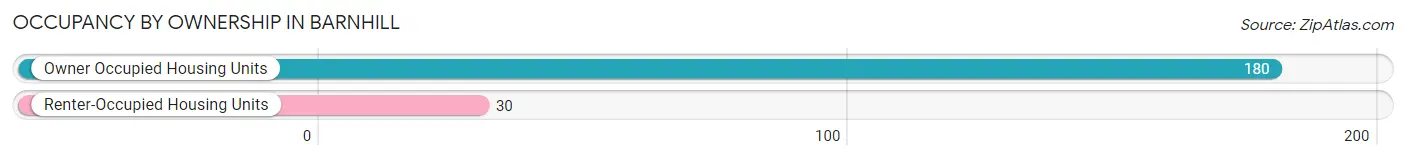
| Occupancy | # Housing Units | % Housing Units |
| Owner Occupied Housing Units | 180 | 85.7% |
| Renter-Occupied Housing Units | 30 | 14.3% |
| Total Occupied Housing Units | 210 | 100.0% |
Occupancy by Household Size in Barnhill
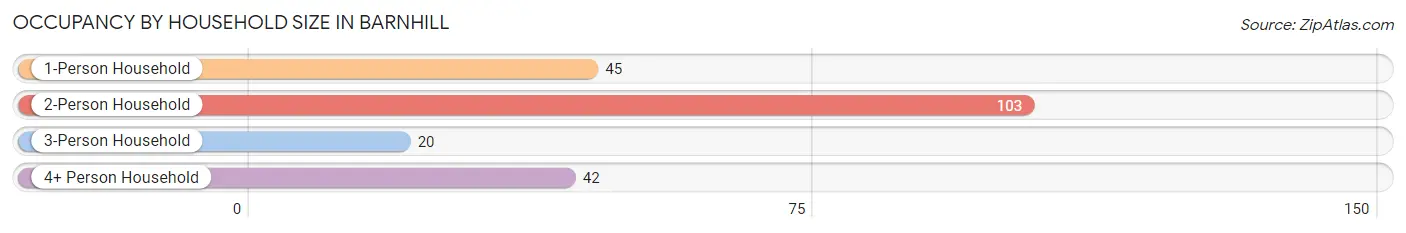
| Household Size | # Housing Units | % Housing Units |
| 1-Person Household | 45 | 21.4% |
| 2-Person Household | 103 | 49.0% |
| 3-Person Household | 20 | 9.5% |
| 4+ Person Household | 42 | 20.0% |
| Total Housing Units | 210 | 100.0% |
Occupancy by Ownership by Household Size in Barnhill
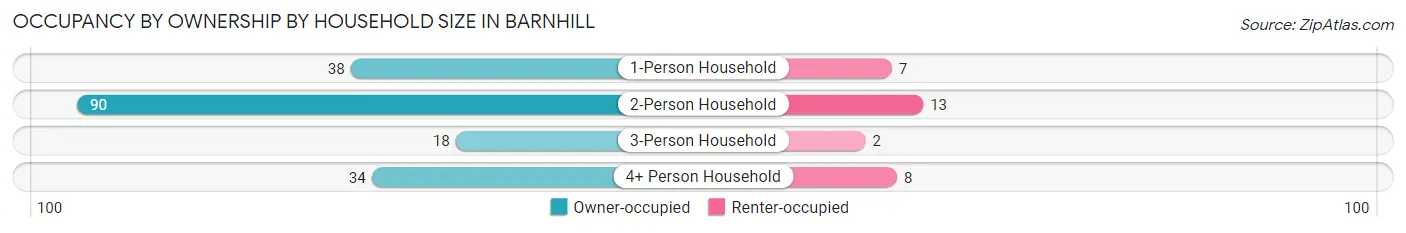
| Household Size | Owner-occupied | Renter-occupied |
| 1-Person Household | 38 (84.4%) | 7 (15.6%) |
| 2-Person Household | 90 (87.4%) | 13 (12.6%) |
| 3-Person Household | 18 (90.0%) | 2 (10.0%) |
| 4+ Person Household | 34 (80.9%) | 8 (19.1%) |
| Total Housing Units | 180 (85.7%) | 30 (14.3%) |
Occupancy by Educational Attainment in Barnhill
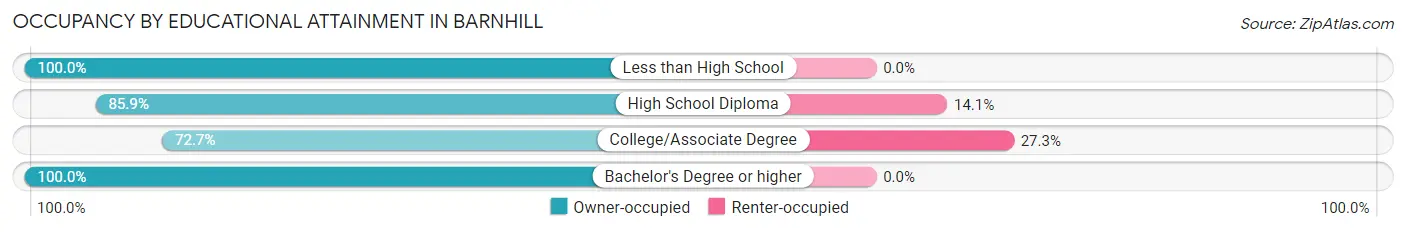
| Household Size | Owner-occupied | Renter-occupied |
| Less than High School | 32 (100.0%) | 0 (0.0%) |
| High School Diploma | 110 (85.9%) | 18 (14.1%) |
| College/Associate Degree | 32 (72.7%) | 12 (27.3%) |
| Bachelor's Degree or higher | 6 (100.0%) | 0 (0.0%) |
Occupancy by Age of Householder in Barnhill
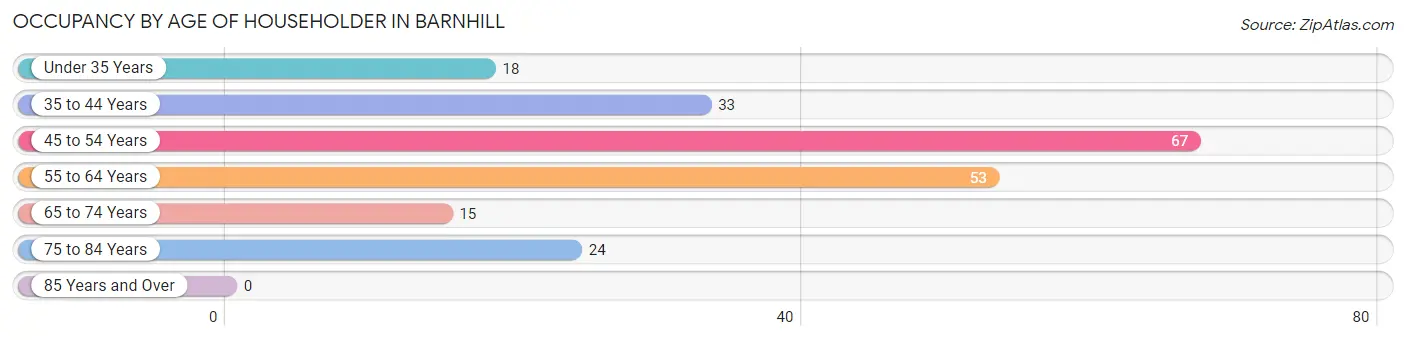
| Age Bracket | # Households | % Households |
| Under 35 Years | 18 | 8.6% |
| 35 to 44 Years | 33 | 15.7% |
| 45 to 54 Years | 67 | 31.9% |
| 55 to 64 Years | 53 | 25.2% |
| 65 to 74 Years | 15 | 7.1% |
| 75 to 84 Years | 24 | 11.4% |
| 85 Years and Over | 0 | 0.0% |
| Total | 210 | 100.0% |
Housing Finances in Barnhill
Median Income by Occupancy in Barnhill
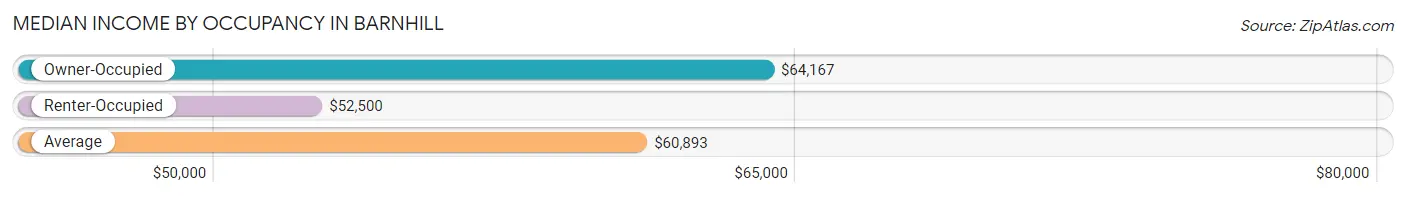
| Occupancy Type | # Households | Median Income |
| Owner-Occupied | 180 (85.7%) | $64,167 |
| Renter-Occupied | 30 (14.3%) | $52,500 |
| Average | 210 (100.0%) | $60,893 |
Occupancy by Householder Income Bracket in Barnhill
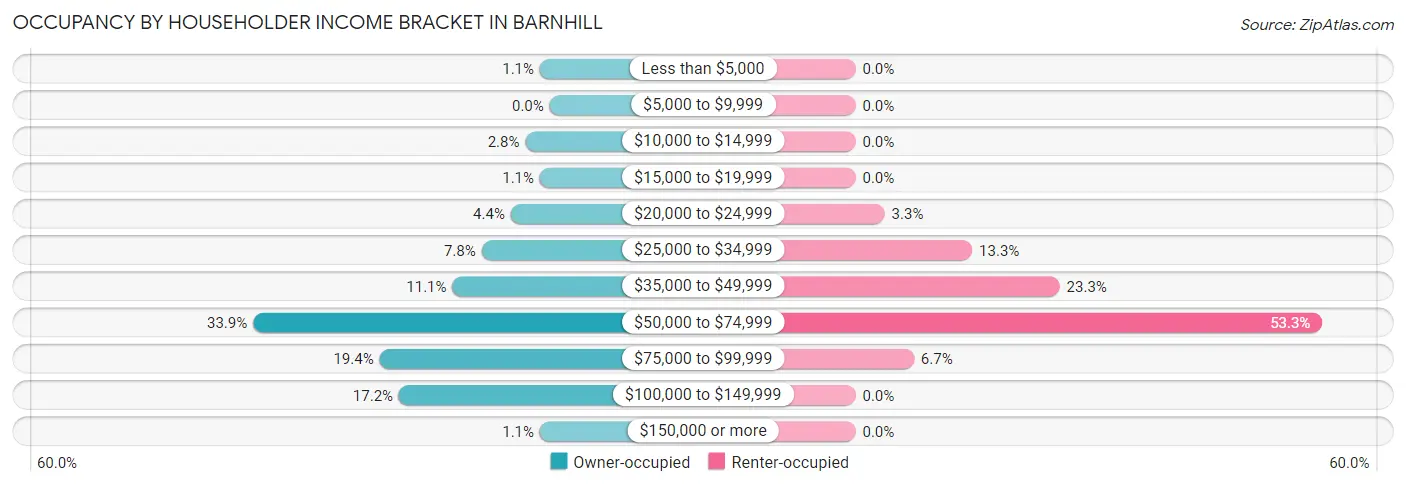
| Income Bracket | Owner-occupied | Renter-occupied |
| Less than $5,000 | 2 (1.1%) | 0 (0.0%) |
| $5,000 to $9,999 | 0 (0.0%) | 0 (0.0%) |
| $10,000 to $14,999 | 5 (2.8%) | 0 (0.0%) |
| $15,000 to $19,999 | 2 (1.1%) | 0 (0.0%) |
| $20,000 to $24,999 | 8 (4.4%) | 1 (3.3%) |
| $25,000 to $34,999 | 14 (7.8%) | 4 (13.3%) |
| $35,000 to $49,999 | 20 (11.1%) | 7 (23.3%) |
| $50,000 to $74,999 | 61 (33.9%) | 16 (53.3%) |
| $75,000 to $99,999 | 35 (19.4%) | 2 (6.7%) |
| $100,000 to $149,999 | 31 (17.2%) | 0 (0.0%) |
| $150,000 or more | 2 (1.1%) | 0 (0.0%) |
| Total | 180 (100.0%) | 30 (100.0%) |
Monthly Housing Cost Tiers in Barnhill
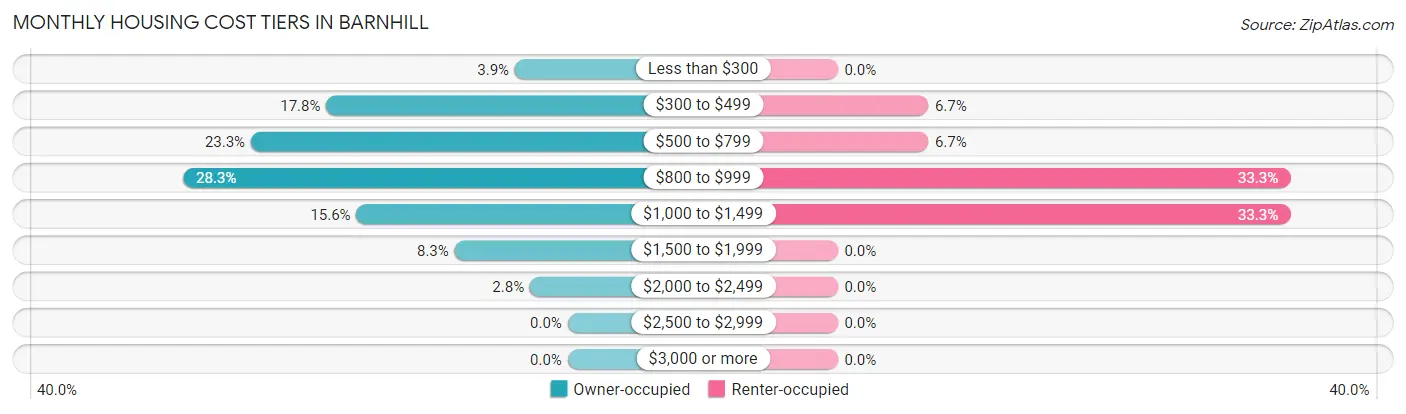
| Monthly Cost | Owner-occupied | Renter-occupied |
| Less than $300 | 7 (3.9%) | 0 (0.0%) |
| $300 to $499 | 32 (17.8%) | 2 (6.7%) |
| $500 to $799 | 42 (23.3%) | 2 (6.7%) |
| $800 to $999 | 51 (28.3%) | 10 (33.3%) |
| $1,000 to $1,499 | 28 (15.6%) | 10 (33.3%) |
| $1,500 to $1,999 | 15 (8.3%) | 0 (0.0%) |
| $2,000 to $2,499 | 5 (2.8%) | 0 (0.0%) |
| $2,500 to $2,999 | 0 (0.0%) | 0 (0.0%) |
| $3,000 or more | 0 (0.0%) | 0 (0.0%) |
| Total | 180 (100.0%) | 30 (100.0%) |
Physical Housing Characteristics in Barnhill
Housing Structures in Barnhill
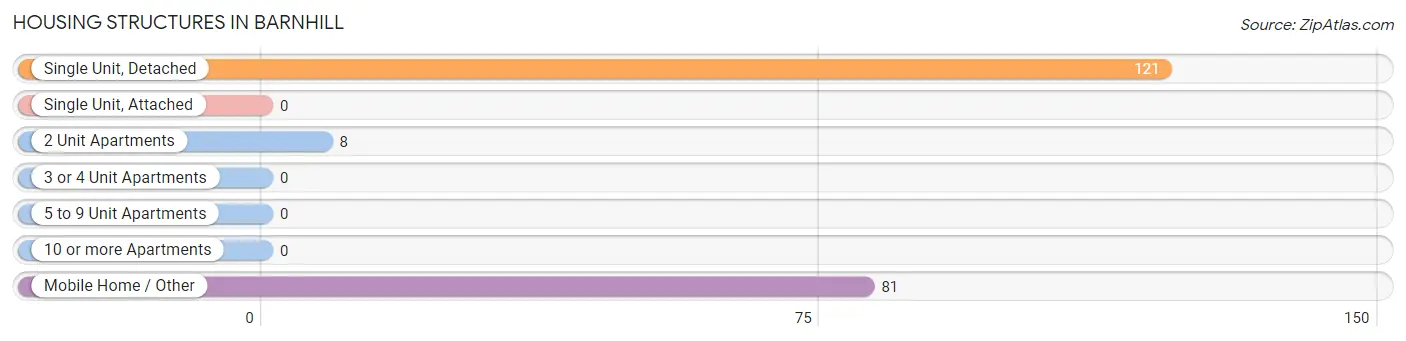
| Structure Type | # Housing Units | % Housing Units |
| Single Unit, Detached | 121 | 57.6% |
| Single Unit, Attached | 0 | 0.0% |
| 2 Unit Apartments | 8 | 3.8% |
| 3 or 4 Unit Apartments | 0 | 0.0% |
| 5 to 9 Unit Apartments | 0 | 0.0% |
| 10 or more Apartments | 0 | 0.0% |
| Mobile Home / Other | 81 | 38.6% |
| Total | 210 | 100.0% |
Housing Structures by Occupancy in Barnhill
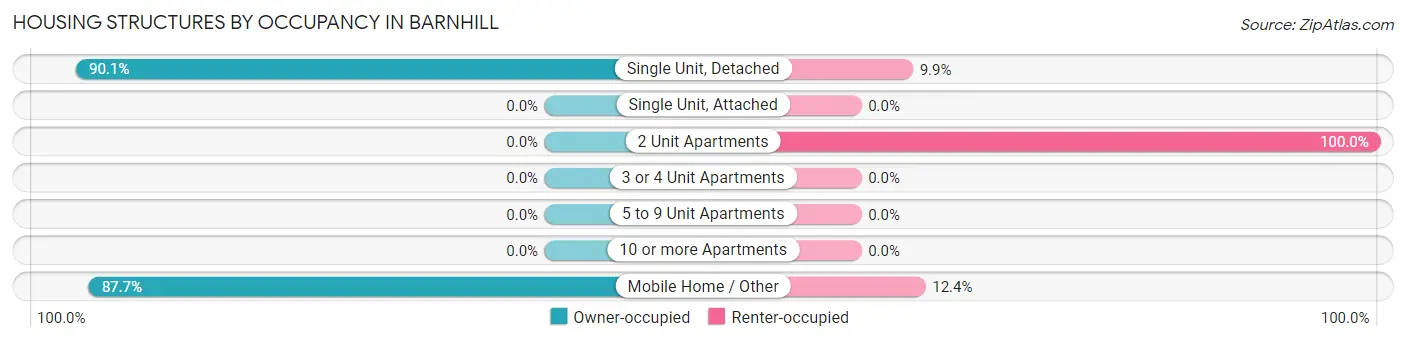
| Structure Type | Owner-occupied | Renter-occupied |
| Single Unit, Detached | 109 (90.1%) | 12 (9.9%) |
| Single Unit, Attached | 0 (0.0%) | 0 (0.0%) |
| 2 Unit Apartments | 0 (0.0%) | 8 (100.0%) |
| 3 or 4 Unit Apartments | 0 (0.0%) | 0 (0.0%) |
| 5 to 9 Unit Apartments | 0 (0.0%) | 0 (0.0%) |
| 10 or more Apartments | 0 (0.0%) | 0 (0.0%) |
| Mobile Home / Other | 71 (87.6%) | 10 (12.3%) |
| Total | 180 (85.7%) | 30 (14.3%) |
Housing Structures by Number of Rooms in Barnhill
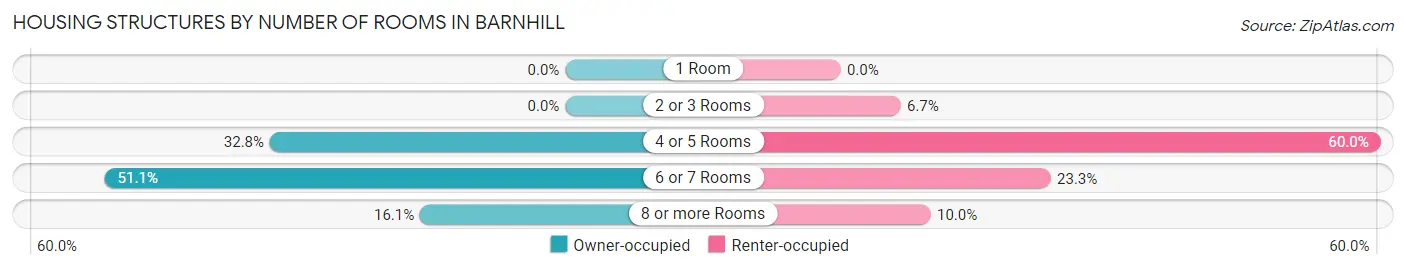
| Number of Rooms | Owner-occupied | Renter-occupied |
| 1 Room | 0 (0.0%) | 0 (0.0%) |
| 2 or 3 Rooms | 0 (0.0%) | 2 (6.7%) |
| 4 or 5 Rooms | 59 (32.8%) | 18 (60.0%) |
| 6 or 7 Rooms | 92 (51.1%) | 7 (23.3%) |
| 8 or more Rooms | 29 (16.1%) | 3 (10.0%) |
| Total | 180 (100.0%) | 30 (100.0%) |
Housing Structure by Heating Type in Barnhill
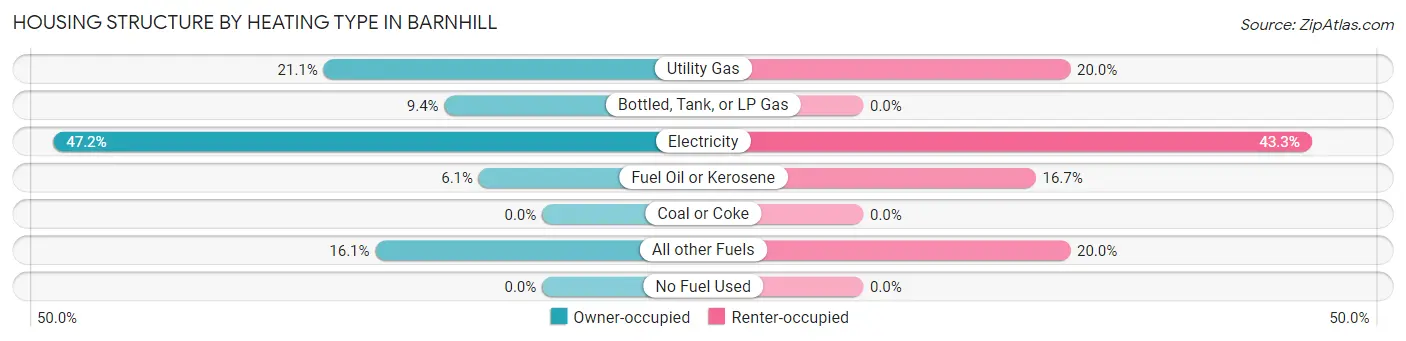
| Heating Type | Owner-occupied | Renter-occupied |
| Utility Gas | 38 (21.1%) | 6 (20.0%) |
| Bottled, Tank, or LP Gas | 17 (9.4%) | 0 (0.0%) |
| Electricity | 85 (47.2%) | 13 (43.3%) |
| Fuel Oil or Kerosene | 11 (6.1%) | 5 (16.7%) |
| Coal or Coke | 0 (0.0%) | 0 (0.0%) |
| All other Fuels | 29 (16.1%) | 6 (20.0%) |
| No Fuel Used | 0 (0.0%) | 0 (0.0%) |
| Total | 180 (100.0%) | 30 (100.0%) |
Household Vehicle Usage in Barnhill
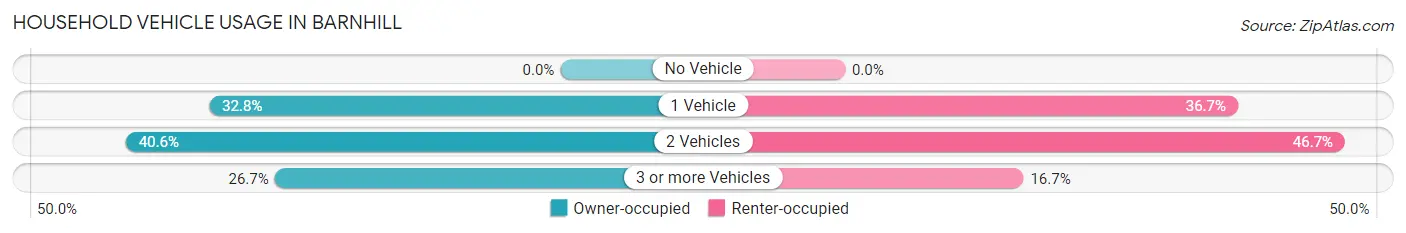
| Vehicles per Household | Owner-occupied | Renter-occupied |
| No Vehicle | 0 (0.0%) | 0 (0.0%) |
| 1 Vehicle | 59 (32.8%) | 11 (36.7%) |
| 2 Vehicles | 73 (40.6%) | 14 (46.7%) |
| 3 or more Vehicles | 48 (26.7%) | 5 (16.7%) |
| Total | 180 (100.0%) | 30 (100.0%) |
Real Estate & Mortgages in Barnhill
Real Estate and Mortgage Overview in Barnhill
| Characteristic | Without Mortgage | With Mortgage |
| Housing Units | 48 | 132 |
| Median Property Value | $58,900 | $126,100 |
| Median Household Income | $43,500 | $2 |
| Monthly Housing Costs | $375 | $0 |
| Real Estate Taxes | $569 | $3 |
Property Value by Mortgage Status in Barnhill
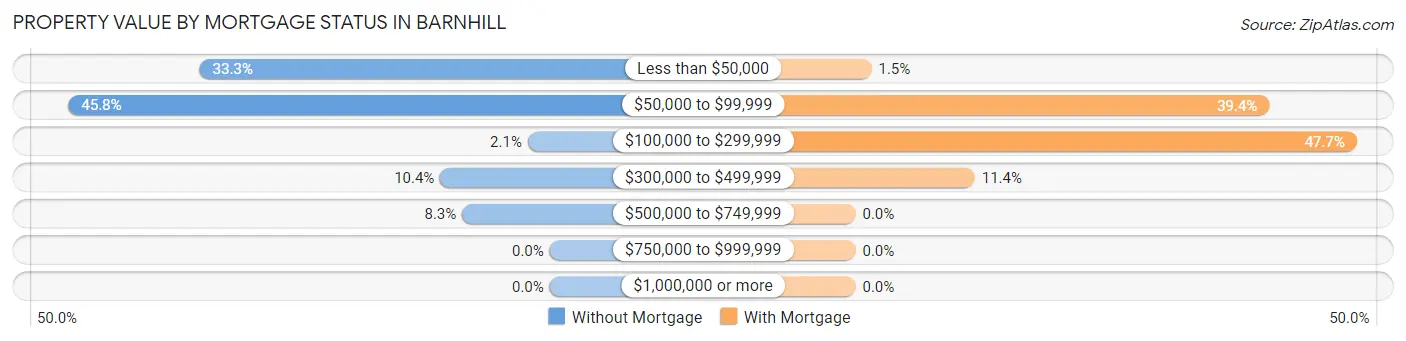
| Property Value | Without Mortgage | With Mortgage |
| Less than $50,000 | 16 (33.3%) | 2 (1.5%) |
| $50,000 to $99,999 | 22 (45.8%) | 52 (39.4%) |
| $100,000 to $299,999 | 1 (2.1%) | 63 (47.7%) |
| $300,000 to $499,999 | 5 (10.4%) | 15 (11.4%) |
| $500,000 to $749,999 | 4 (8.3%) | 0 (0.0%) |
| $750,000 to $999,999 | 0 (0.0%) | 0 (0.0%) |
| $1,000,000 or more | 0 (0.0%) | 0 (0.0%) |
| Total | 48 (100.0%) | 132 (100.0%) |
Household Income by Mortgage Status in Barnhill
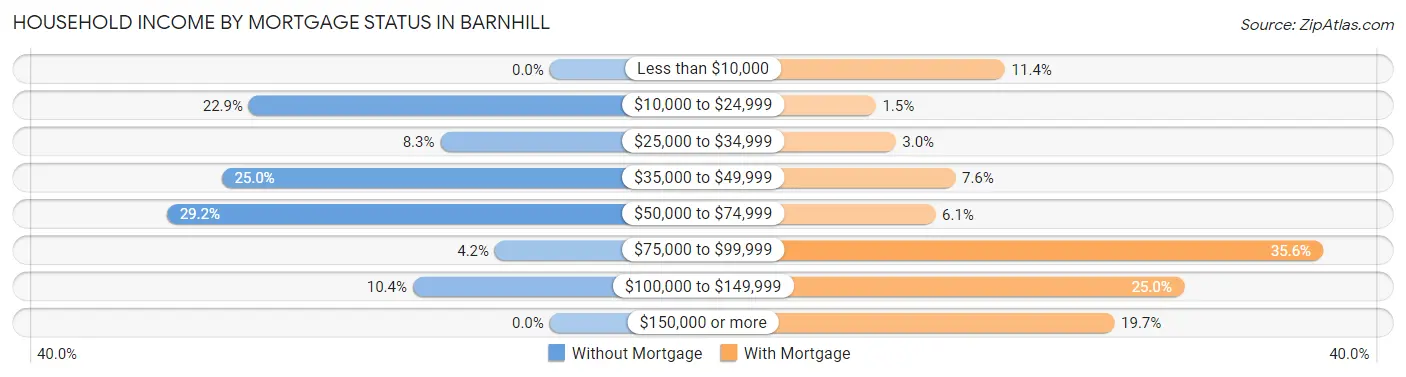
| Household Income | Without Mortgage | With Mortgage |
| Less than $10,000 | 0 (0.0%) | 15 (11.4%) |
| $10,000 to $24,999 | 11 (22.9%) | 2 (1.5%) |
| $25,000 to $34,999 | 4 (8.3%) | 4 (3.0%) |
| $35,000 to $49,999 | 12 (25.0%) | 10 (7.6%) |
| $50,000 to $74,999 | 14 (29.2%) | 8 (6.1%) |
| $75,000 to $99,999 | 2 (4.2%) | 47 (35.6%) |
| $100,000 to $149,999 | 5 (10.4%) | 33 (25.0%) |
| $150,000 or more | 0 (0.0%) | 26 (19.7%) |
| Total | 48 (100.0%) | 132 (100.0%) |
Property Value to Household Income Ratio in Barnhill
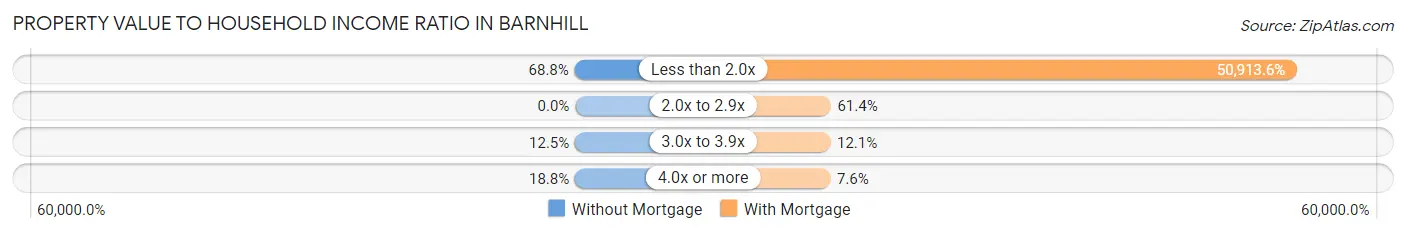
| Value-to-Income Ratio | Without Mortgage | With Mortgage |
| Less than 2.0x | 33 (68.8%) | 67,206 (50,913.6%) |
| 2.0x to 2.9x | 0 (0.0%) | 81 (61.4%) |
| 3.0x to 3.9x | 6 (12.5%) | 16 (12.1%) |
| 4.0x or more | 9 (18.8%) | 10 (7.6%) |
| Total | 48 (100.0%) | 132 (100.0%) |
Real Estate Taxes by Mortgage Status in Barnhill
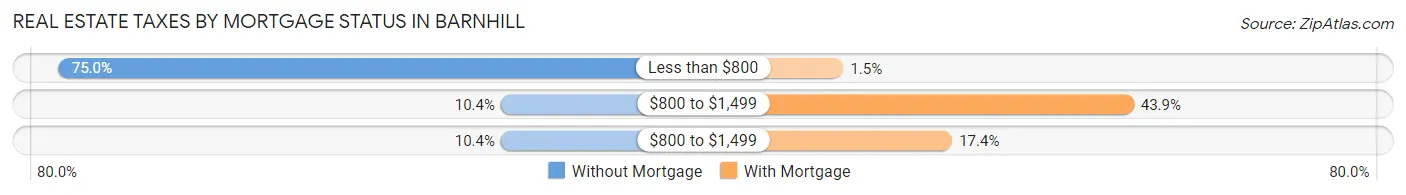
| Property Taxes | Without Mortgage | With Mortgage |
| Less than $800 | 36 (75.0%) | 2 (1.5%) |
| $800 to $1,499 | 5 (10.4%) | 58 (43.9%) |
| $800 to $1,499 | 5 (10.4%) | 23 (17.4%) |
| Total | 48 (100.0%) | 132 (100.0%) |
Health & Disability in Barnhill
Health Insurance Coverage by Age in Barnhill
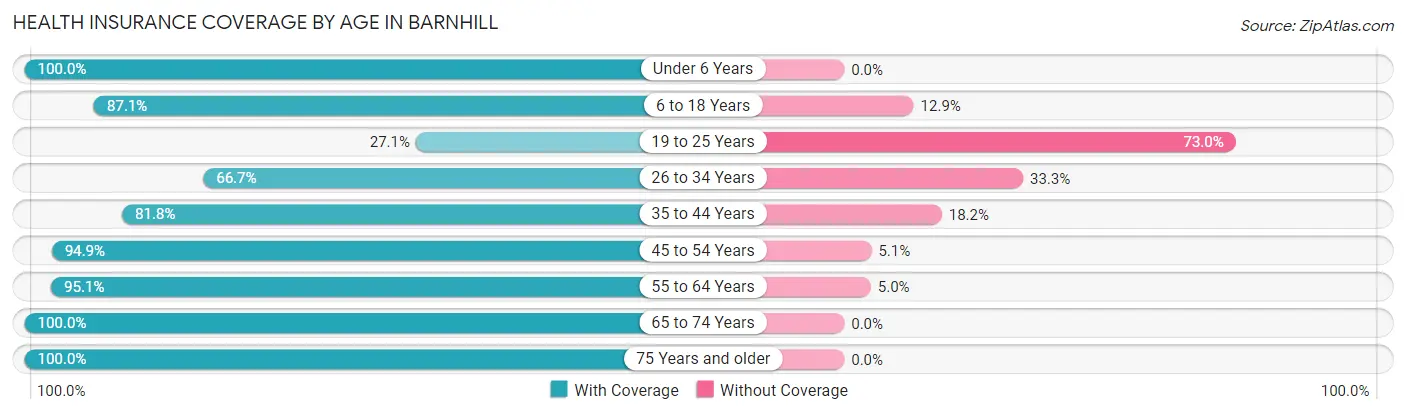
| Age Bracket | With Coverage | Without Coverage |
| Under 6 Years | 13 (100.0%) | 0 (0.0%) |
| 6 to 18 Years | 101 (87.1%) | 15 (12.9%) |
| 19 to 25 Years | 33 (27.1%) | 89 (73.0%) |
| 26 to 34 Years | 30 (66.7%) | 15 (33.3%) |
| 35 to 44 Years | 54 (81.8%) | 12 (18.2%) |
| 45 to 54 Years | 75 (94.9%) | 4 (5.1%) |
| 55 to 64 Years | 96 (95.1%) | 5 (5.0%) |
| 65 to 74 Years | 23 (100.0%) | 0 (0.0%) |
| 75 Years and older | 36 (100.0%) | 0 (0.0%) |
| Total | 461 (76.7%) | 140 (23.3%) |
Health Insurance Coverage by Citizenship Status in Barnhill
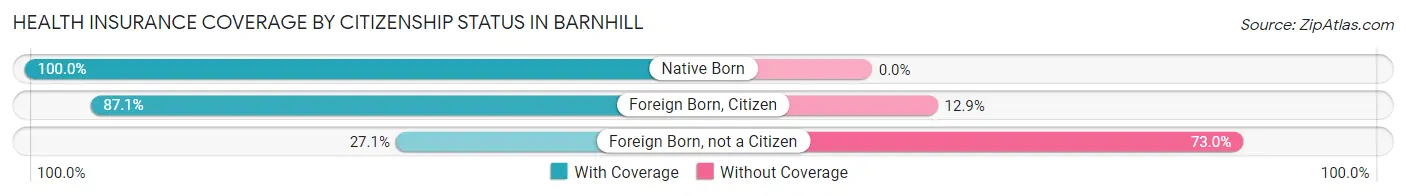
| Citizenship Status | With Coverage | Without Coverage |
| Native Born | 13 (100.0%) | 0 (0.0%) |
| Foreign Born, Citizen | 101 (87.1%) | 15 (12.9%) |
| Foreign Born, not a Citizen | 33 (27.1%) | 89 (73.0%) |
Health Insurance Coverage by Household Income in Barnhill
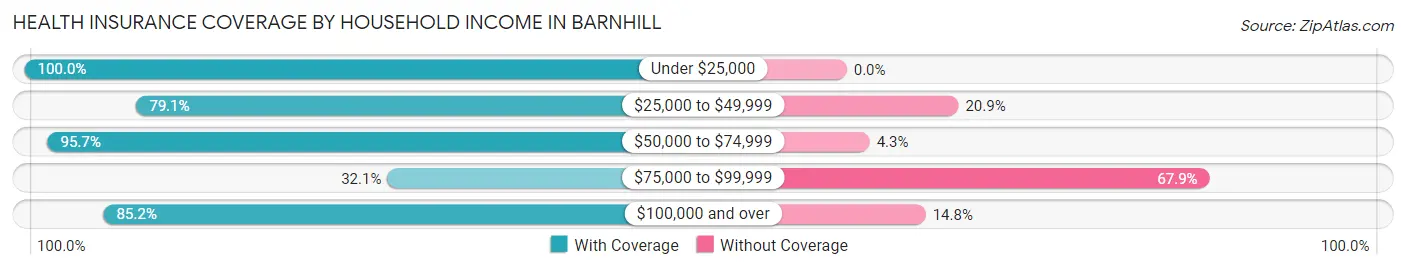
| Household Income | With Coverage | Without Coverage |
| Under $25,000 | 29 (100.0%) | 0 (0.0%) |
| $25,000 to $49,999 | 68 (79.1%) | 18 (20.9%) |
| $50,000 to $74,999 | 178 (95.7%) | 8 (4.3%) |
| $75,000 to $99,999 | 42 (32.1%) | 89 (67.9%) |
| $100,000 and over | 144 (85.2%) | 25 (14.8%) |
Public vs Private Health Insurance Coverage by Age in Barnhill
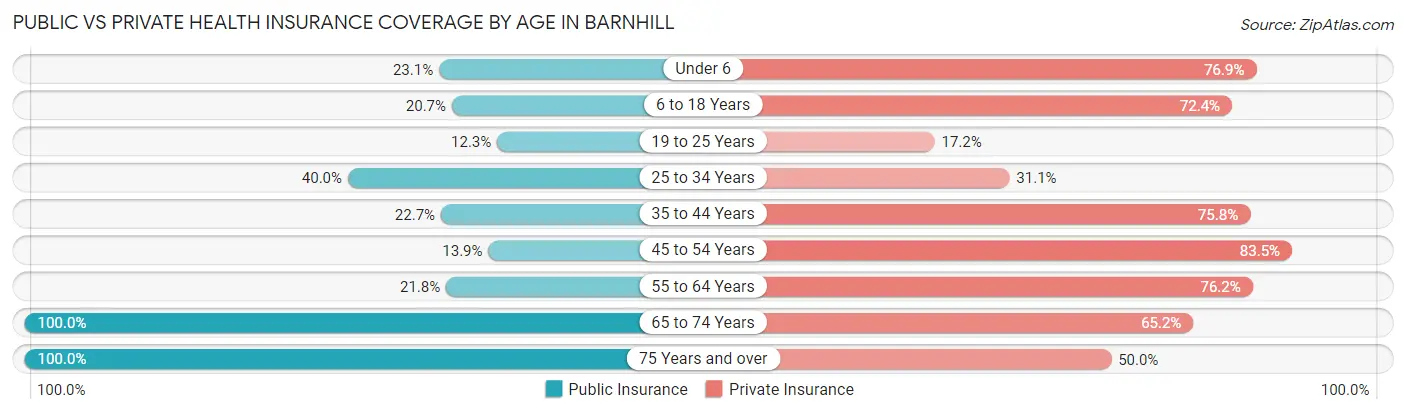
| Age Bracket | Public Insurance | Private Insurance |
| Under 6 | 3 (23.1%) | 10 (76.9%) |
| 6 to 18 Years | 24 (20.7%) | 84 (72.4%) |
| 19 to 25 Years | 15 (12.3%) | 21 (17.2%) |
| 25 to 34 Years | 18 (40.0%) | 14 (31.1%) |
| 35 to 44 Years | 15 (22.7%) | 50 (75.8%) |
| 45 to 54 Years | 11 (13.9%) | 66 (83.5%) |
| 55 to 64 Years | 22 (21.8%) | 77 (76.2%) |
| 65 to 74 Years | 23 (100.0%) | 15 (65.2%) |
| 75 Years and over | 36 (100.0%) | 18 (50.0%) |
| Total | 167 (27.8%) | 355 (59.1%) |
Disability Status by Sex by Age in Barnhill
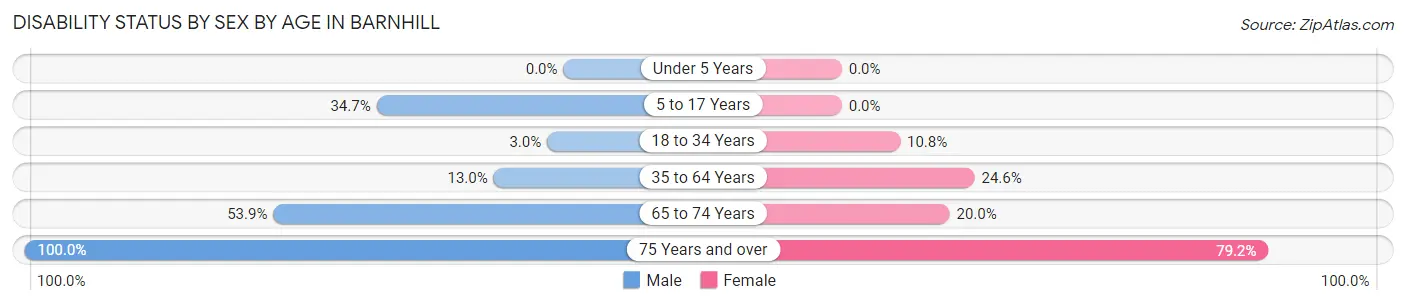
| Age Bracket | Male | Female |
| Under 5 Years | 0 (0.0%) | 0 (0.0%) |
| 5 to 17 Years | 17 (34.7%) | 0 (0.0%) |
| 18 to 34 Years | 4 (3.0%) | 4 (10.8%) |
| 35 to 64 Years | 14 (13.0%) | 34 (24.6%) |
| 65 to 74 Years | 7 (53.8%) | 2 (20.0%) |
| 75 Years and over | 12 (100.0%) | 19 (79.2%) |
Disability Class by Sex by Age in Barnhill
Disability Class: Hearing Difficulty
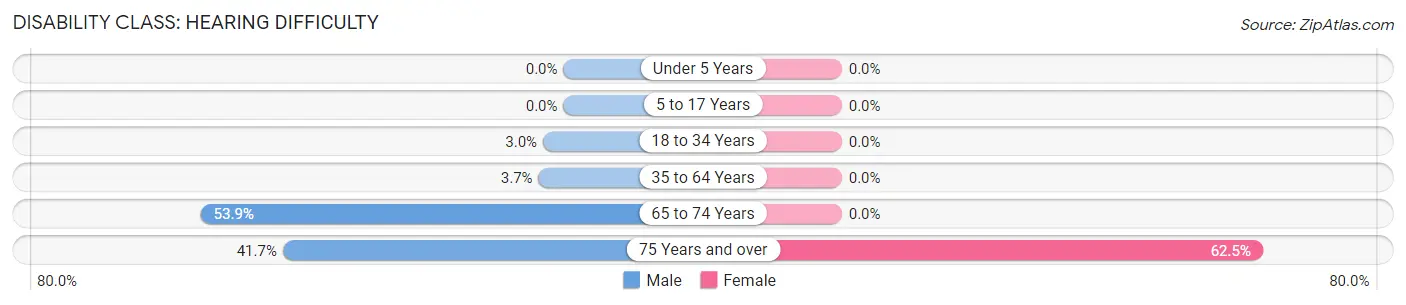
| Age Bracket | Male | Female |
| Under 5 Years | 0 (0.0%) | 0 (0.0%) |
| 5 to 17 Years | 0 (0.0%) | 0 (0.0%) |
| 18 to 34 Years | 4 (3.0%) | 0 (0.0%) |
| 35 to 64 Years | 4 (3.7%) | 0 (0.0%) |
| 65 to 74 Years | 7 (53.8%) | 0 (0.0%) |
| 75 Years and over | 5 (41.7%) | 15 (62.5%) |
Disability Class: Vision Difficulty
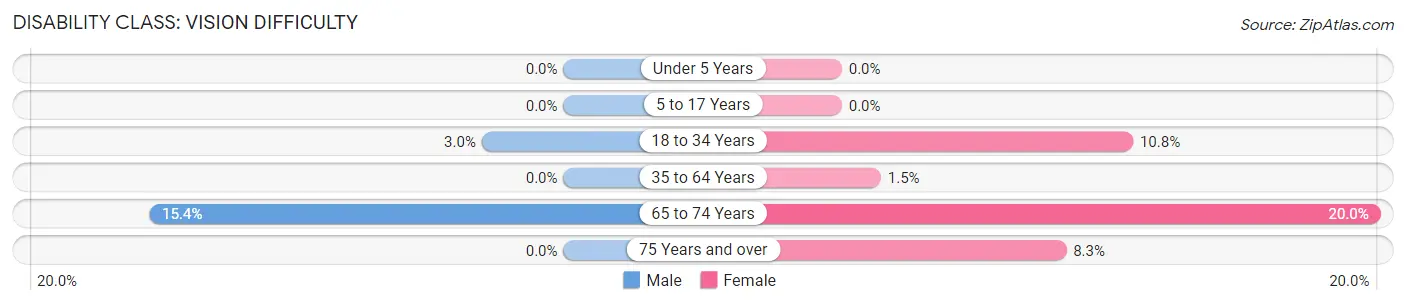
| Age Bracket | Male | Female |
| Under 5 Years | 0 (0.0%) | 0 (0.0%) |
| 5 to 17 Years | 0 (0.0%) | 0 (0.0%) |
| 18 to 34 Years | 4 (3.0%) | 4 (10.8%) |
| 35 to 64 Years | 0 (0.0%) | 2 (1.5%) |
| 65 to 74 Years | 2 (15.4%) | 2 (20.0%) |
| 75 Years and over | 0 (0.0%) | 2 (8.3%) |
Disability Class: Cognitive Difficulty
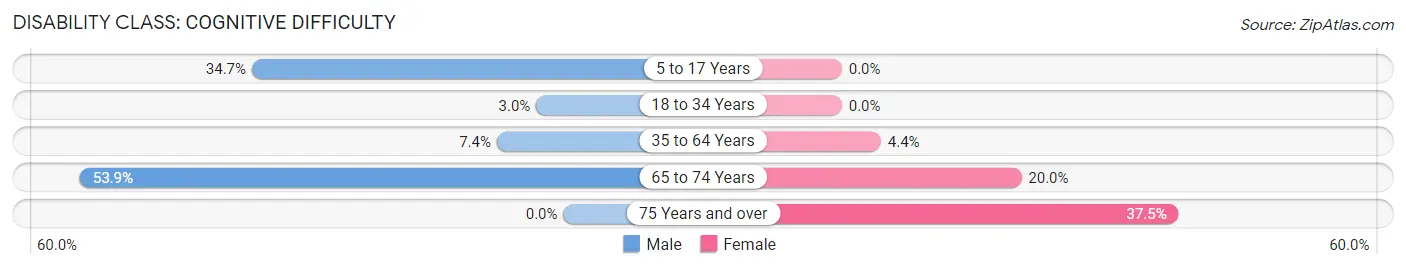
| Age Bracket | Male | Female |
| 5 to 17 Years | 17 (34.7%) | 0 (0.0%) |
| 18 to 34 Years | 4 (3.0%) | 0 (0.0%) |
| 35 to 64 Years | 8 (7.4%) | 6 (4.3%) |
| 65 to 74 Years | 7 (53.8%) | 2 (20.0%) |
| 75 Years and over | 0 (0.0%) | 9 (37.5%) |
Disability Class: Ambulatory Difficulty
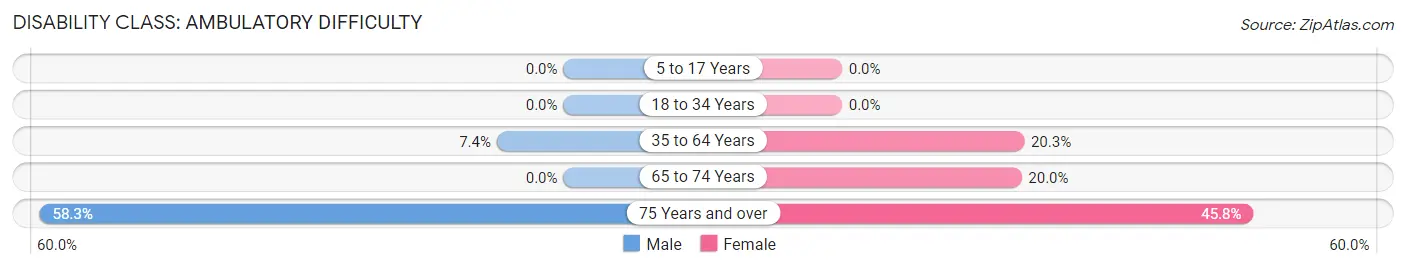
| Age Bracket | Male | Female |
| 5 to 17 Years | 0 (0.0%) | 0 (0.0%) |
| 18 to 34 Years | 0 (0.0%) | 0 (0.0%) |
| 35 to 64 Years | 8 (7.4%) | 28 (20.3%) |
| 65 to 74 Years | 0 (0.0%) | 2 (20.0%) |
| 75 Years and over | 7 (58.3%) | 11 (45.8%) |
Disability Class: Self-Care Difficulty
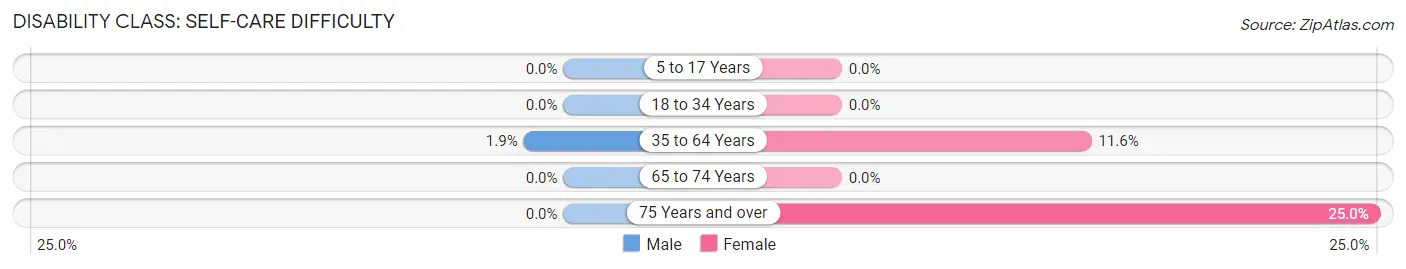
| Age Bracket | Male | Female |
| 5 to 17 Years | 0 (0.0%) | 0 (0.0%) |
| 18 to 34 Years | 0 (0.0%) | 0 (0.0%) |
| 35 to 64 Years | 2 (1.8%) | 16 (11.6%) |
| 65 to 74 Years | 0 (0.0%) | 0 (0.0%) |
| 75 Years and over | 0 (0.0%) | 6 (25.0%) |
Technology Access in Barnhill
Computing Device Access in Barnhill
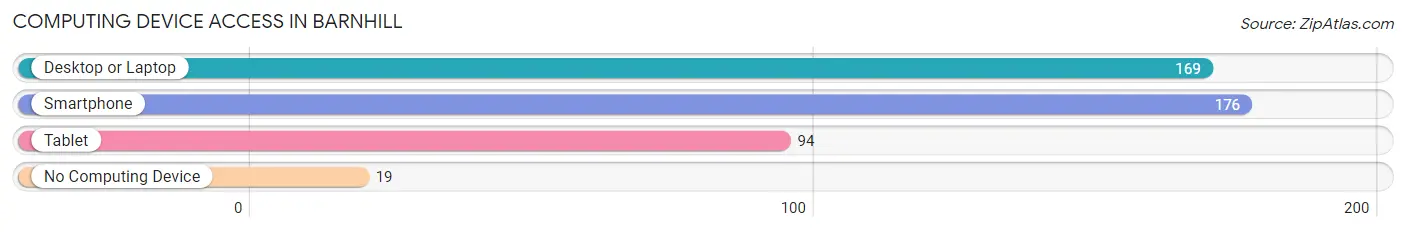
| Device Type | # Households | % Households |
| Desktop or Laptop | 169 | 80.5% |
| Smartphone | 176 | 83.8% |
| Tablet | 94 | 44.8% |
| No Computing Device | 19 | 9.0% |
| Total | 210 | 100.0% |
Internet Access in Barnhill
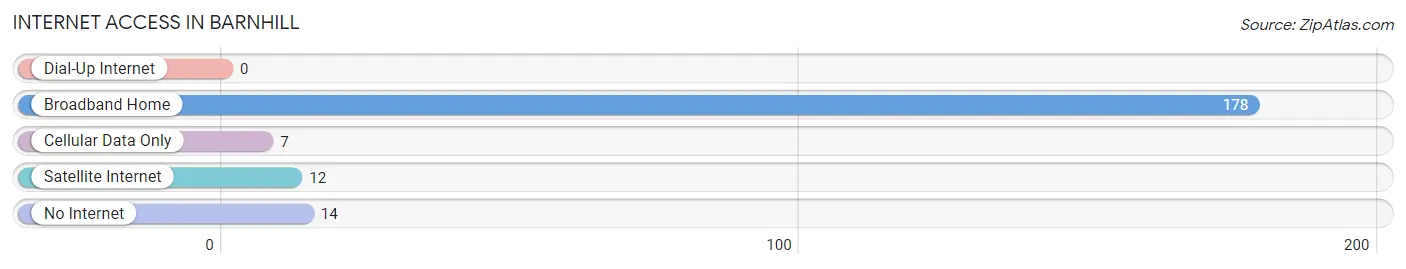
| Internet Type | # Households | % Households |
| Dial-Up Internet | 0 | 0.0% |
| Broadband Home | 178 | 84.8% |
| Cellular Data Only | 7 | 3.3% |
| Satellite Internet | 12 | 5.7% |
| No Internet | 14 | 6.7% |
| Total | 210 | 100.0% |
Barnhill Summary
Hillbarn is a small village located in the state of Ohio, in the United States of America. It is situated in the county of Belmont, and is part of the Wheeling Metropolitan Statistical Area. The village has a population of around 500 people, and is located in the Appalachian region of the state.
History
The village of Hillbarn was founded in 1817 by a group of settlers from Pennsylvania. The settlers were looking for a place to settle and start a new life, and they chose the area around Hillbarn because of its fertile soil and abundant natural resources. The village was originally called “Hilltown”, but the name was changed to Hillbarn in 1820.
The village was a small farming community for many years, and the main crops grown were corn, wheat, and oats. The village also had a few small businesses, such as a general store, a blacksmith, and a sawmill.
In the late 19th century, the village began to grow and develop. The railroad was built through the village in 1881, and this allowed for the transportation of goods and people to and from the village. This helped to spur the growth of the village, and by the early 20th century, Hillbarn had become a thriving community.
Geography
Hillbarn is located in the Appalachian region of Ohio, and is situated in the county of Belmont. The village is located in the northern part of the county, and is bordered by the towns of St. Clairsville, Barnesville, and Bethesda. The village is situated on the banks of the Ohio River, and is surrounded by rolling hills and forests.
The climate in Hillbarn is humid continental, with hot summers and cold winters. The average temperature in the summer is around 75 degrees Fahrenheit, and the average temperature in the winter is around 25 degrees Fahrenheit. The village receives an average of 40 inches of precipitation each year.
Economy
The economy of Hillbarn is largely based on agriculture. The village is home to several farms, and the main crops grown are corn, wheat, and oats. The village also has a few small businesses, such as a general store, a blacksmith, and a sawmill.
The village is also home to a few manufacturing companies, such as a furniture factory and a plastics factory. These companies provide employment for many of the residents of Hillbarn.
Demographics
As of the 2010 census, the population of Hillbarn was 498 people. The racial makeup of the village was 97.6% White, 0.2% African American, 0.2% Native American, 0.4% Asian, and 1.6% from other races. The median household income in Hillbarn was $37,500, and the median family income was $45,000.
The village is home to a few churches, including the Hillbarn United Methodist Church, the Hillbarn Baptist Church, and the Hillbarn Presbyterian Church. The village also has a public library, a post office, and a few restaurants.
Conclusion
Hillbarn is a small village located in the state of Ohio, in the United States of America. It is situated in the county of Belmont, and is part of the Wheeling Metropolitan Statistical Area. The village has a population of around 500 people, and is located in the Appalachian region of the state. The village was founded in 1817 by a group of settlers from Pennsylvania, and has since grown into a thriving community. The economy of Hillbarn is largely based on agriculture, and the village is also home to a few manufacturing companies. The racial makeup of the village is 97.6% White, 0.2% African American, 0.2% Native American, 0.4% Asian, and 1.6% from other races. The median household income in Hillbarn was $37,500, and the median family income was $45,000. The village is home to a few churches, a public library, a post office, and a few restaurants.
Common Questions
What is Per Capita Income in Barnhill?
Per Capita income in Barnhill is $27,238.
What is the Median Family Income in Barnhill?
Median Family Income in Barnhill is $66,838.
What is the Median Household income in Barnhill?
Median Household Income in Barnhill is $60,893.
What is Inequality or Gini Index in Barnhill?
Inequality or Gini Index in Barnhill is 0.27.
What is the Total Population of Barnhill?
Total Population of Barnhill is 601.
What is the Total Male Population of Barnhill?
Total Male Population of Barnhill is 314.
What is the Total Female Population of Barnhill?
Total Female Population of Barnhill is 287.
What is the Ratio of Males per 100 Females in Barnhill?
There are 109.41 Males per 100 Females in Barnhill.
What is the Ratio of Females per 100 Males in Barnhill?
There are 91.40 Females per 100 Males in Barnhill.
What is the Median Population Age in Barnhill?
Median Population Age in Barnhill is 36.0 Years.
What is the Average Family Size in Barnhill
Average Family Size in Barnhill is 3.3 People.
What is the Average Household Size in Barnhill
Average Household Size in Barnhill is 2.9 People.
How Large is the Labor Force in Barnhill?
There are 379 People in the Labor Forcein in Barnhill.
What is the Percentage of People in the Labor Force in Barnhill?
70.7% of People are in the Labor Force in Barnhill.
What is the Unemployment Rate in Barnhill?
Unemployment Rate in Barnhill is 8.4%.