Zip Codes with the Highest Percentage of Population with a Degree in Engineering in Cincinnati, OH
RELATED REPORTS & OPTIONS
Engineering
Cincinnati
Compare Zip Codes
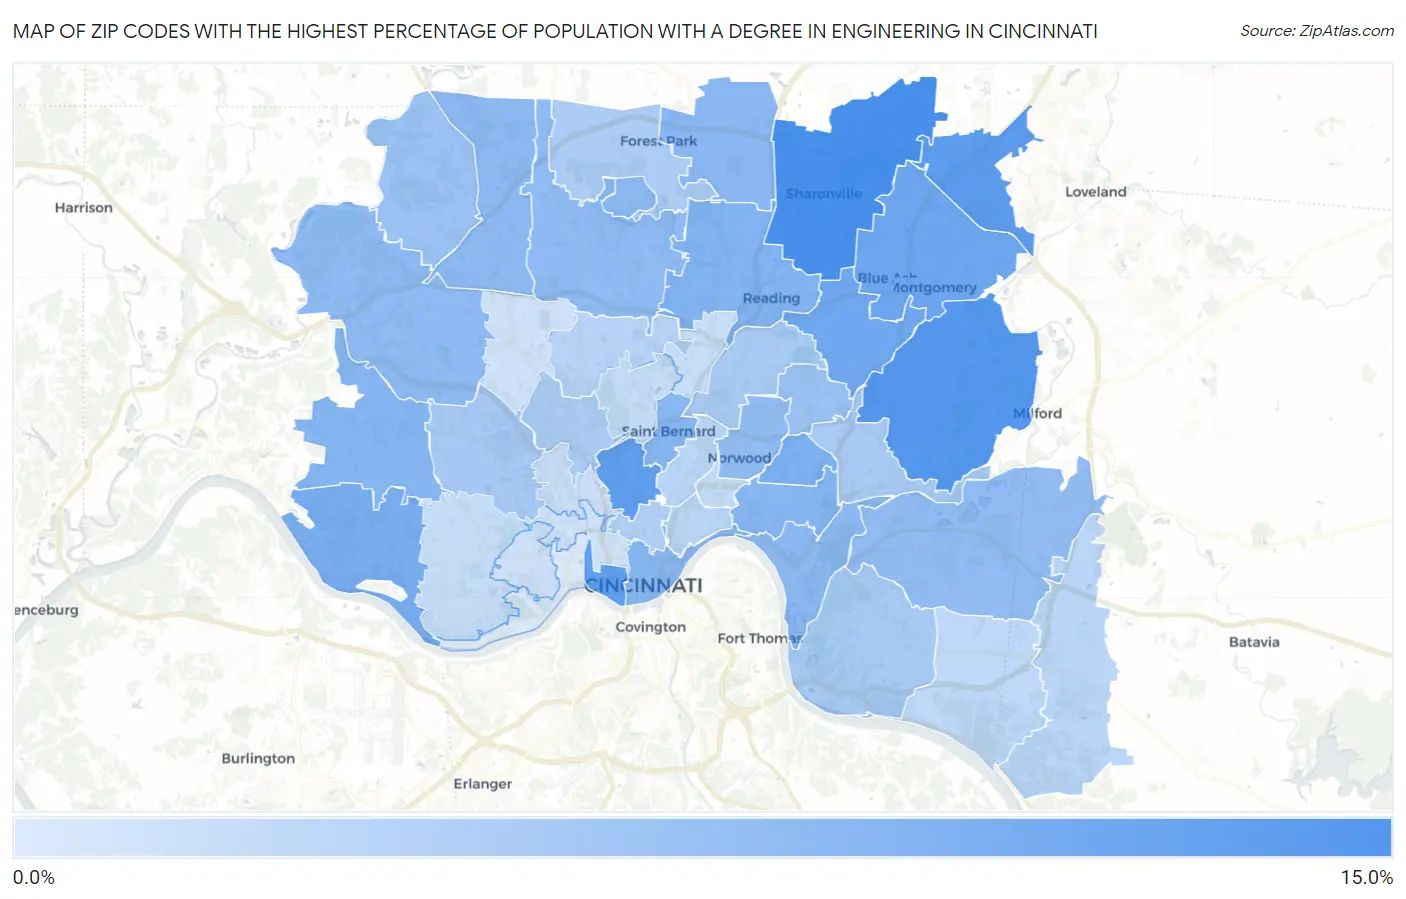
Map of Zip Codes with the Highest Percentage of Population with a Degree in Engineering in Cincinnati
2.3%
13.4%
Zip Codes with the Highest Percentage of Population with a Degree in Engineering in Cincinnati, OH
| Zip Code | % Graduates | vs State | vs National | |
| 1. | 45241 | 13.4% | 7.4%(+6.04)#90 | 7.6%(+5.77)#2,250 |
| 2. | 45243 | 12.3% | 7.4%(+4.92)#112 | 7.6%(+4.64)#2,757 |
| 3. | 45249 | 12.0% | 7.4%(+4.67)#116 | 7.6%(+4.40)#2,864 |
| 4. | 45203 | 11.5% | 7.4%(+4.13)#130 | 7.6%(+3.86)#3,165 |
| 5. | 45220 | 11.4% | 7.4%(+4.04)#135 | 7.6%(+3.77)#3,237 |
| 6. | 45242 | 10.5% | 7.4%(+3.10)#171 | 7.6%(+2.83)#3,998 |
| 7. | 45236 | 10.3% | 7.4%(+2.93)#176 | 7.6%(+2.65)#4,171 |
| 8. | 45233 | 9.7% | 7.4%(+2.37)#203 | 7.6%(+2.09)#4,697 |
| 9. | 45209 | 9.3% | 7.4%(+1.91)#231 | 7.6%(+1.63)#5,226 |
| 10. | 45215 | 9.0% | 7.4%(+1.58)#255 | 7.6%(+1.31)#5,679 |
| 11. | 45248 | 8.7% | 7.4%(+1.28)#274 | 7.6%(+1.00)#6,081 |
| 12. | 45208 | 8.6% | 7.4%(+1.21)#279 | 7.6%(+0.935)#6,166 |
| 13. | 45202 | 8.6% | 7.4%(+1.19)#281 | 7.6%(+0.917)#6,191 |
| 14. | 45217 | 8.5% | 7.4%(+1.15)#283 | 7.6%(+0.874)#6,250 |
| 15. | 45246 | 8.3% | 7.4%(+0.952)#290 | 7.6%(+0.678)#6,554 |
| 16. | 45251 | 8.2% | 7.4%(+0.865)#296 | 7.6%(+0.592)#6,681 |
| 17. | 45218 | 8.1% | 7.4%(+0.734)#305 | 7.6%(+0.461)#6,920 |
| 18. | 45226 | 8.1% | 7.4%(+0.727)#308 | 7.6%(+0.454)#6,931 |
| 19. | 45247 | 8.0% | 7.4%(+0.646)#314 | 7.6%(+0.373)#7,054 |
| 20. | 45231 | 7.9% | 7.4%(+0.542)#322 | 7.6%(+0.269)#7,246 |
| 21. | 45212 | 7.9% | 7.4%(+0.514)#325 | 7.6%(+0.240)#7,302 |
| 22. | 45244 | 7.8% | 7.4%(+0.441)#329 | 7.6%(+0.167)#7,427 |
| 23. | 45252 | 7.1% | 7.4%(-0.305)#383 | 7.6%(-0.578)#8,844 |
| 24. | 45213 | 7.0% | 7.4%(-0.362)#387 | 7.6%(-0.635)#8,952 |
| 25. | 45211 | 6.2% | 7.4%(-1.16)#457 | 7.6%(-1.43)#10,668 |
| 26. | 45230 | 6.2% | 7.4%(-1.20)#463 | 7.6%(-1.47)#10,773 |
| 27. | 45237 | 6.1% | 7.4%(-1.23)#467 | 7.6%(-1.50)#10,842 |
| 28. | 45227 | 6.1% | 7.4%(-1.24)#469 | 7.6%(-1.52)#10,871 |
| 29. | 45223 | 5.8% | 7.4%(-1.56)#498 | 7.6%(-1.83)#11,649 |
| 30. | 45240 | 5.8% | 7.4%(-1.61)#504 | 7.6%(-1.88)#11,776 |
| 31. | 45219 | 5.5% | 7.4%(-1.86)#534 | 7.6%(-2.14)#12,423 |
| 32. | 45224 | 5.0% | 7.4%(-2.37)#574 | 7.6%(-2.64)#13,650 |
| 33. | 45206 | 4.8% | 7.4%(-2.54)#592 | 7.6%(-2.82)#14,175 |
| 34. | 45245 | 4.8% | 7.4%(-2.62)#600 | 7.6%(-2.89)#14,371 |
| 35. | 45229 | 4.7% | 7.4%(-2.63)#601 | 7.6%(-2.90)#14,388 |
| 36. | 45255 | 4.5% | 7.4%(-2.86)#626 | 7.6%(-3.13)#15,013 |
| 37. | 45207 | 4.1% | 7.4%(-3.26)#662 | 7.6%(-3.54)#16,045 |
| 38. | 45232 | 3.9% | 7.4%(-3.45)#677 | 7.6%(-3.72)#16,545 |
| 39. | 45238 | 3.9% | 7.4%(-3.46)#681 | 7.6%(-3.73)#16,574 |
| 40. | 45216 | 3.7% | 7.4%(-3.63)#698 | 7.6%(-3.91)#17,032 |
| 41. | 45225 | 3.7% | 7.4%(-3.69)#703 | 7.6%(-3.96)#17,193 |
| 42. | 45214 | 3.3% | 7.4%(-4.06)#737 | 7.6%(-4.33)#18,101 |
| 43. | 45205 | 3.3% | 7.4%(-4.06)#741 | 7.6%(-4.34)#18,118 |
| 44. | 45239 | 3.2% | 7.4%(-4.14)#748 | 7.6%(-4.41)#18,318 |
| 45. | 45204 | 2.3% | 7.4%(-5.04)#796 | 7.6%(-5.31)#20,316 |
1
Common Questions
What are the Top 10 Zip Codes with the Highest Percentage of Population with a Degree in Engineering in Cincinnati, OH?
Top 10 Zip Codes with the Highest Percentage of Population with a Degree in Engineering in Cincinnati, OH are:
What zip code has the Highest Percentage of Population with a Degree in Engineering in Cincinnati, OH?
45241 has the Highest Percentage of Population with a Degree in Engineering in Cincinnati, OH with 13.4%.
What is the Percentage of Population with a Degree in Engineering in Cincinnati, OH?
Percentage of Population with a Degree in Engineering in Cincinnati is 7.1%.
What is the Percentage of Population with a Degree in Engineering in Ohio?
Percentage of Population with a Degree in Engineering in Ohio is 7.4%.
What is the Percentage of Population with a Degree in Engineering in the United States?
Percentage of Population with a Degree in Engineering in the United States is 7.6%.