Lake Darby, OH Map & Demographics
Lake Darby Map
Lake Darby Overview
$39,675
PER CAPITA INCOME
$117,177
AVG FAMILY INCOME
$90,083
AVG HOUSEHOLD INCOME
34.1%
WAGE / INCOME GAP [ % ]
65.9¢/ $1
WAGE / INCOME GAP [ $ ]
0.38
INEQUALITY / GINI INDEX
4,569
TOTAL POPULATION
2,128
MALE POPULATION
2,441
FEMALE POPULATION
87.18
MALES / 100 FEMALES
114.71
FEMALES / 100 MALES
37.4
MEDIAN AGE
3.3
AVG FAMILY SIZE
2.7
AVG HOUSEHOLD SIZE
2,617
LABOR FORCE [ PEOPLE ]
74.8%
PERCENT IN LABOR FORCE
2.0%
UNEMPLOYMENT RATE
Income in Lake Darby
Income Overview in Lake Darby
Per Capita Income in Lake Darby is $39,675, while median incomes of families and households are $117,177 and $90,083 respectively.
| Characteristic | Number | Measure |
| Per Capita Income | 4,569 | $39,675 |
| Median Family Income | 1,189 | $117,177 |
| Mean Family Income | 1,189 | $125,351 |
| Median Household Income | 1,671 | $90,083 |
| Mean Household Income | 1,671 | $105,337 |
| Income Deficit | 1,189 | $0 |
| Wage / Income Gap (%) | 4,569 | 34.08% |
| Wage / Income Gap ($) | 4,569 | 65.92¢ per $1 |
| Gini / Inequality Index | 4,569 | 0.38 |
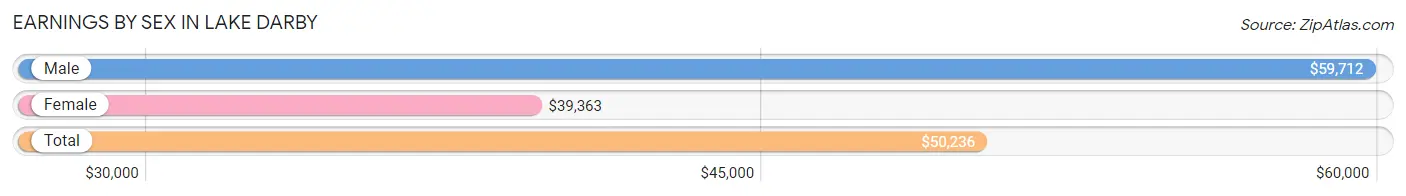
Earnings by Sex in Lake Darby
Average Earnings in Lake Darby are $50,236, $59,712 for men and $39,363 for women, a difference of 34.1%.
| Sex | Number | Average Earnings |
| Male | 1,407 (52.6%) | $59,712 |
| Female | 1,270 (47.4%) | $39,363 |
| Total | 2,677 (100.0%) | $50,236 |
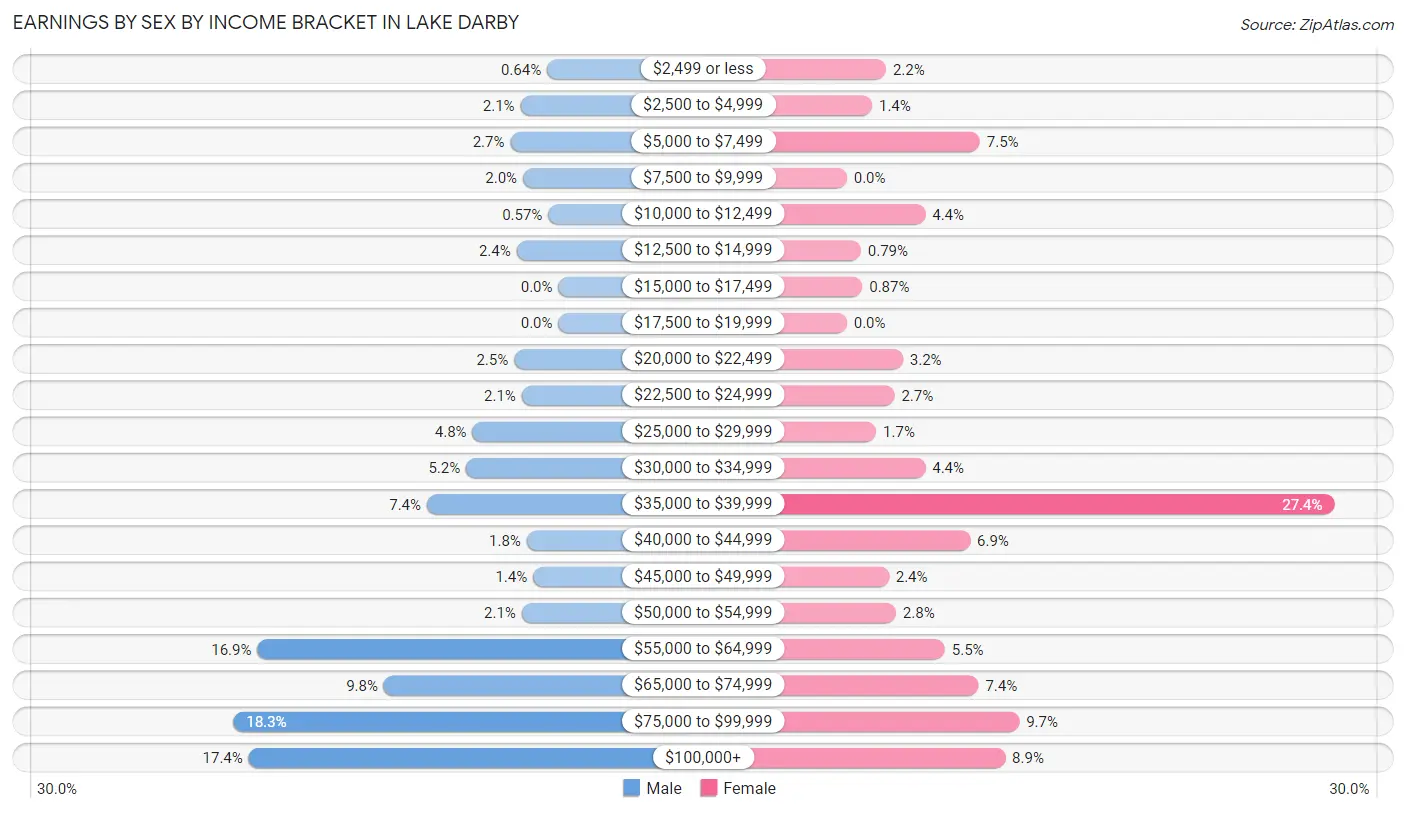
Earnings by Sex by Income Bracket in Lake Darby
The most common earnings brackets in Lake Darby are $75,000 to $99,999 for men (257 | 18.3%) and $35,000 to $39,999 for women (348 | 27.4%).
| Income | Male | Female |
| $2,499 or less | 9 (0.6%) | 28 (2.2%) |
| $2,500 to $4,999 | 30 (2.1%) | 18 (1.4%) |
| $5,000 to $7,499 | 38 (2.7%) | 95 (7.5%) |
| $7,500 to $9,999 | 28 (2.0%) | 0 (0.0%) |
| $10,000 to $12,499 | 8 (0.6%) | 56 (4.4%) |
| $12,500 to $14,999 | 33 (2.4%) | 10 (0.8%) |
| $15,000 to $17,499 | 0 (0.0%) | 11 (0.9%) |
| $17,500 to $19,999 | 0 (0.0%) | 0 (0.0%) |
| $20,000 to $22,499 | 35 (2.5%) | 40 (3.2%) |
| $22,500 to $24,999 | 29 (2.1%) | 34 (2.7%) |
| $25,000 to $29,999 | 68 (4.8%) | 21 (1.7%) |
| $30,000 to $34,999 | 73 (5.2%) | 56 (4.4%) |
| $35,000 to $39,999 | 104 (7.4%) | 348 (27.4%) |
| $40,000 to $44,999 | 25 (1.8%) | 88 (6.9%) |
| $45,000 to $49,999 | 20 (1.4%) | 30 (2.4%) |
| $50,000 to $54,999 | 29 (2.1%) | 35 (2.8%) |
| $55,000 to $64,999 | 238 (16.9%) | 70 (5.5%) |
| $65,000 to $74,999 | 138 (9.8%) | 94 (7.4%) |
| $75,000 to $99,999 | 257 (18.3%) | 123 (9.7%) |
| $100,000+ | 245 (17.4%) | 113 (8.9%) |
| Total | 1,407 (100.0%) | 1,270 (100.0%) |
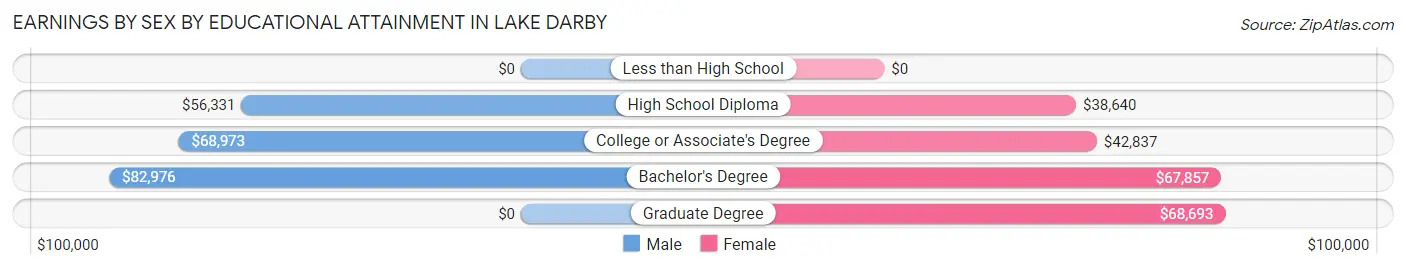
Earnings by Sex by Educational Attainment in Lake Darby
Average earnings in Lake Darby are $64,095 for men and $39,752 for women, a difference of 38.0%. Men with an educational attainment of bachelor's degree enjoy the highest average annual earnings of $82,976, while those with high school diploma education earn the least with $56,331. Women with an educational attainment of graduate degree earn the most with the average annual earnings of $68,693, while those with high school diploma education have the smallest earnings of $38,640.
| Educational Attainment | Male Income | Female Income |
| Less than High School | - | - |
| High School Diploma | $56,331 | $38,640 |
| College or Associate's Degree | $68,973 | $42,837 |
| Bachelor's Degree | $82,976 | $67,857 |
| Graduate Degree | - | - |
| Total | $64,095 | $39,752 |
Family Income in Lake Darby
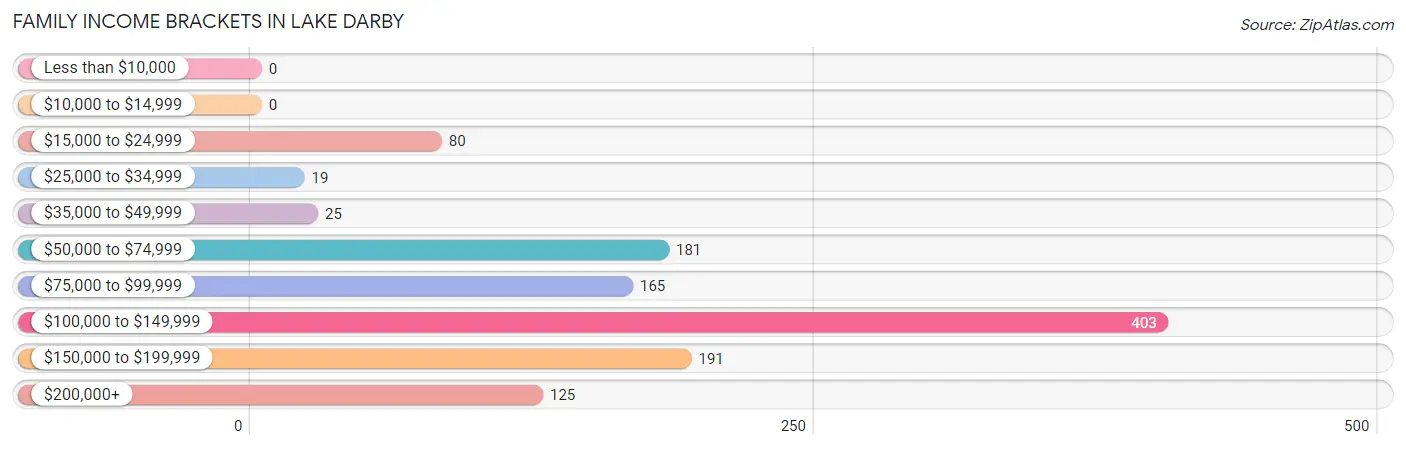
Family Income Brackets in Lake Darby
According to the Lake Darby family income data, there are 403 families falling into the $100,000 to $149,999 income range, which is the most common income bracket and makes up 33.9% of all families.
| Income Bracket | # Families | % Families |
| Less than $10,000 | 0 | 0.0% |
| $10,000 to $14,999 | 0 | 0.0% |
| $15,000 to $24,999 | 80 | 6.7% |
| $25,000 to $34,999 | 19 | 1.6% |
| $35,000 to $49,999 | 25 | 2.1% |
| $50,000 to $74,999 | 181 | 15.2% |
| $75,000 to $99,999 | 165 | 13.9% |
| $100,000 to $149,999 | 403 | 33.9% |
| $150,000 to $199,999 | 191 | 16.1% |
| $200,000+ | 125 | 10.5% |
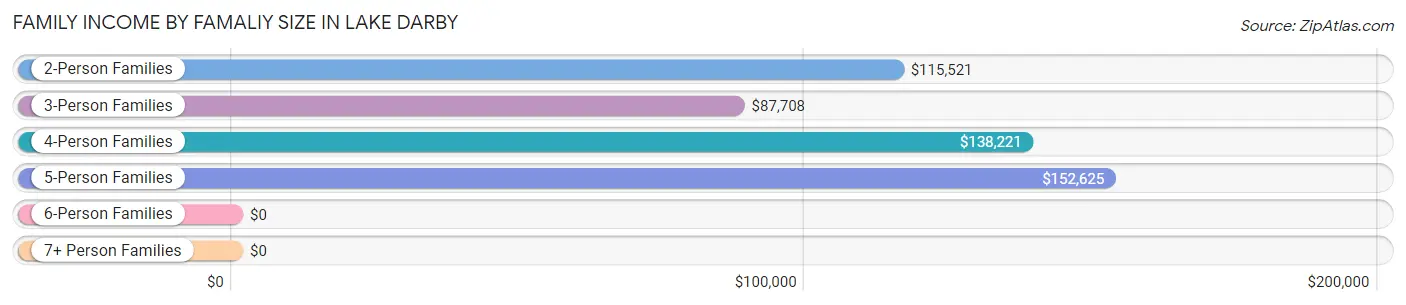
Family Income by Famaliy Size in Lake Darby
5-person families (169 | 14.2%) account for the highest median family income in Lake Darby with $152,625 per family, while 2-person families (448 | 37.7%) have the highest median income of $57,760 per family member.
| Income Bracket | # Families | Median Income |
| 2-Person Families | 448 (37.7%) | $115,521 |
| 3-Person Families | 317 (26.7%) | $87,708 |
| 4-Person Families | 227 (19.1%) | $138,221 |
| 5-Person Families | 169 (14.2%) | $152,625 |
| 6-Person Families | 17 (1.4%) | $0 |
| 7+ Person Families | 11 (0.9%) | $0 |
| Total | 1,189 (100.0%) | $117,177 |
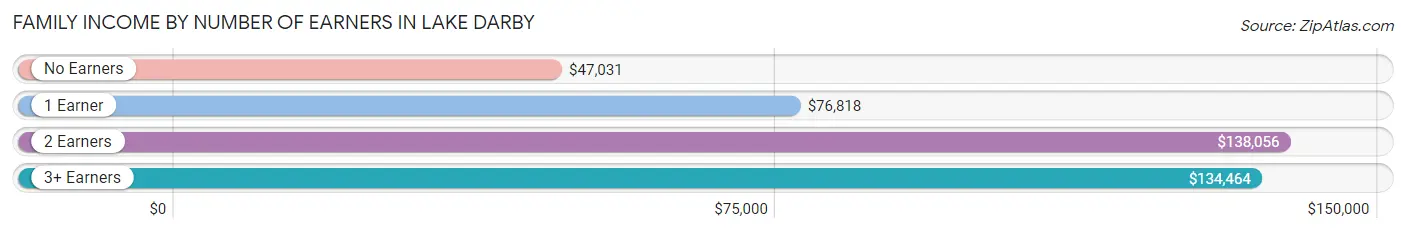
Family Income by Number of Earners in Lake Darby
The median family income in Lake Darby is $117,177, with families comprising 2 earners (490) having the highest median family income of $138,056, while families with no earners (144) have the lowest median family income of $47,031, accounting for 41.2% and 12.1% of families, respectively.
| Number of Earners | # Families | Median Income |
| No Earners | 144 (12.1%) | $47,031 |
| 1 Earner | 308 (25.9%) | $76,818 |
| 2 Earners | 490 (41.2%) | $138,056 |
| 3+ Earners | 247 (20.8%) | $134,464 |
| Total | 1,189 (100.0%) | $117,177 |
Household Income in Lake Darby
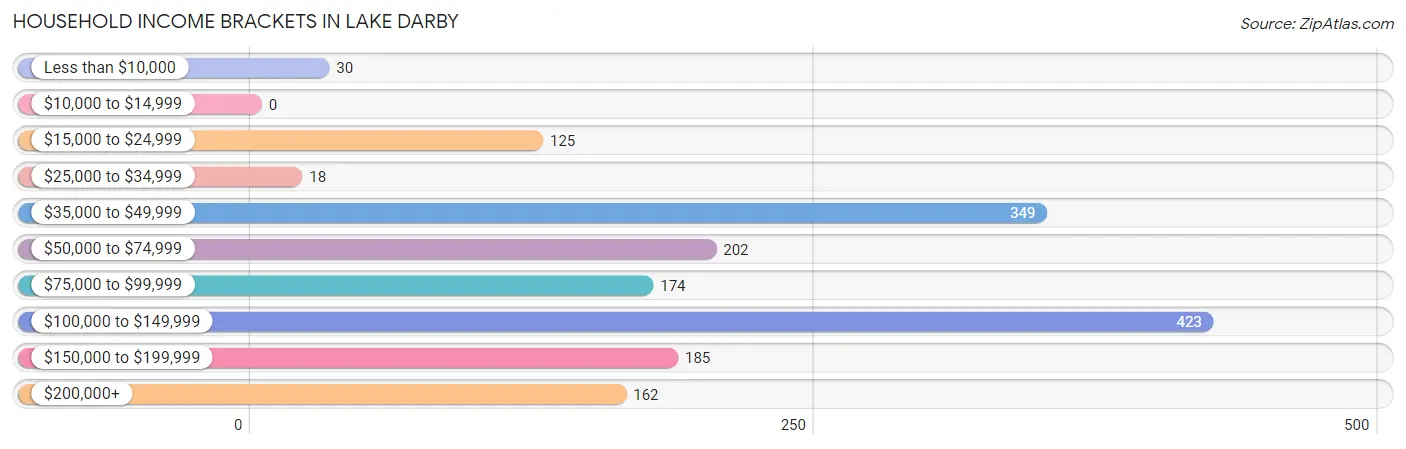
Household Income Brackets in Lake Darby
With 423 households falling in the category, the $100,000 to $149,999 income range is the most frequent in Lake Darby, accounting for 25.3% of all households.
| Income Bracket | # Households | % Households |
| Less than $10,000 | 30 | 1.8% |
| $10,000 to $14,999 | 0 | 0.0% |
| $15,000 to $24,999 | 125 | 7.5% |
| $25,000 to $34,999 | 18 | 1.1% |
| $35,000 to $49,999 | 349 | 20.9% |
| $50,000 to $74,999 | 202 | 12.1% |
| $75,000 to $99,999 | 174 | 10.4% |
| $100,000 to $149,999 | 423 | 25.3% |
| $150,000 to $199,999 | 185 | 11.1% |
| $200,000+ | 162 | 9.7% |
Household Income by Householder Age in Lake Darby
The median household income in Lake Darby is $90,083, with the highest median household income of $117,379 found in the 25 to 44 years age bracket for the primary householder. A total of 629 households (37.6%) fall into this category.
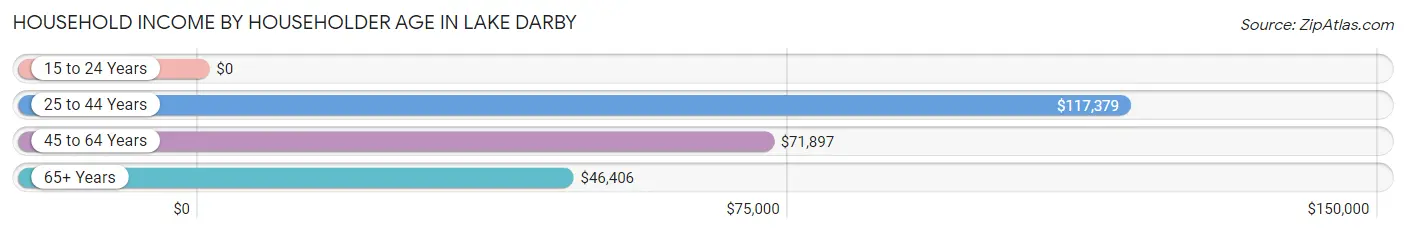
| Income Bracket | # Households | Median Income |
| 15 to 24 Years | 0 (0.0%) | $0 |
| 25 to 44 Years | 629 (37.6%) | $117,379 |
| 45 to 64 Years | 776 (46.4%) | $71,897 |
| 65+ Years | 266 (15.9%) | $46,406 |
| Total | 1,671 (100.0%) | $90,083 |
Poverty in Lake Darby
Income Below Poverty by Sex and Age in Lake Darby
With 3.7% poverty level for males and 3.6% for females among the residents of Lake Darby, 18 to 24 year old males and under 5 year old females are the most vulnerable to poverty, with 19 males (16.2%) and 33 females (18.1%) in their respective age groups living below the poverty level.
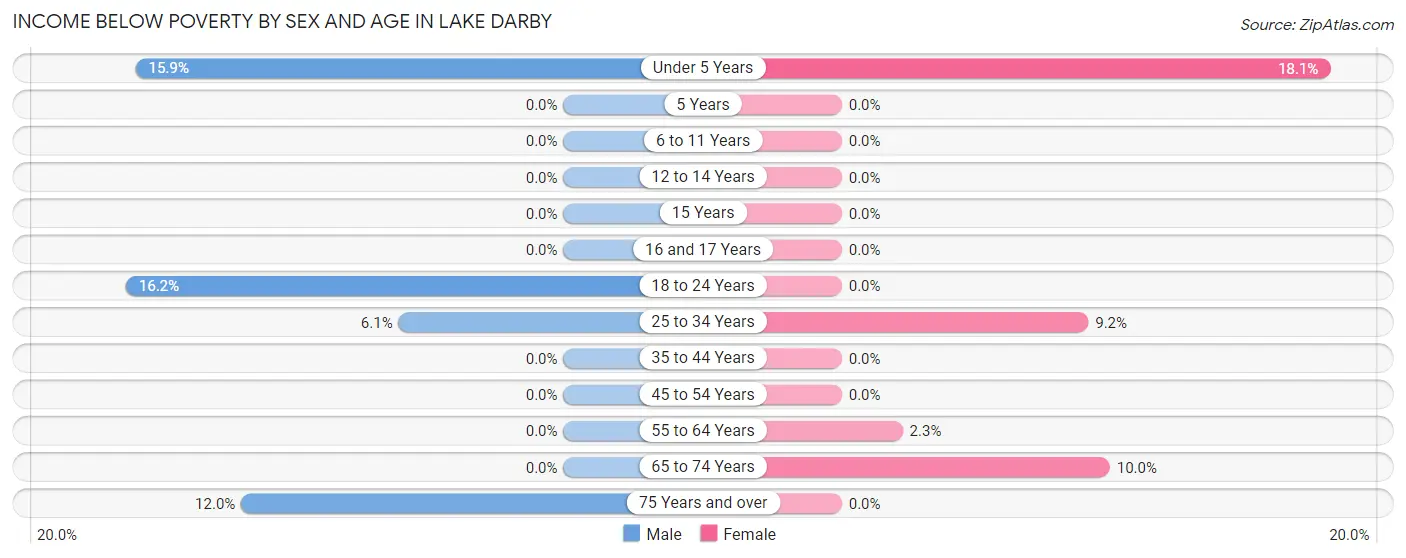
| Age Bracket | Male | Female |
| Under 5 Years | 27 (15.9%) | 33 (18.1%) |
| 5 Years | 0 (0.0%) | 0 (0.0%) |
| 6 to 11 Years | 0 (0.0%) | 0 (0.0%) |
| 12 to 14 Years | 0 (0.0%) | 0 (0.0%) |
| 15 Years | 0 (0.0%) | 0 (0.0%) |
| 16 and 17 Years | 0 (0.0%) | 0 (0.0%) |
| 18 to 24 Years | 19 (16.2%) | 0 (0.0%) |
| 25 to 34 Years | 21 (6.1%) | 26 (9.1%) |
| 35 to 44 Years | 0 (0.0%) | 0 (0.0%) |
| 45 to 54 Years | 0 (0.0%) | 0 (0.0%) |
| 55 to 64 Years | 0 (0.0%) | 11 (2.3%) |
| 65 to 74 Years | 0 (0.0%) | 19 (10.0%) |
| 75 Years and over | 11 (12.0%) | 0 (0.0%) |
| Total | 78 (3.7%) | 89 (3.6%) |
Income Above Poverty by Sex and Age in Lake Darby
According to the poverty statistics in Lake Darby, males aged 5 years and females aged 5 years are the age groups that are most secure financially, with 100.0% of males and 100.0% of females in these age groups living above the poverty line.
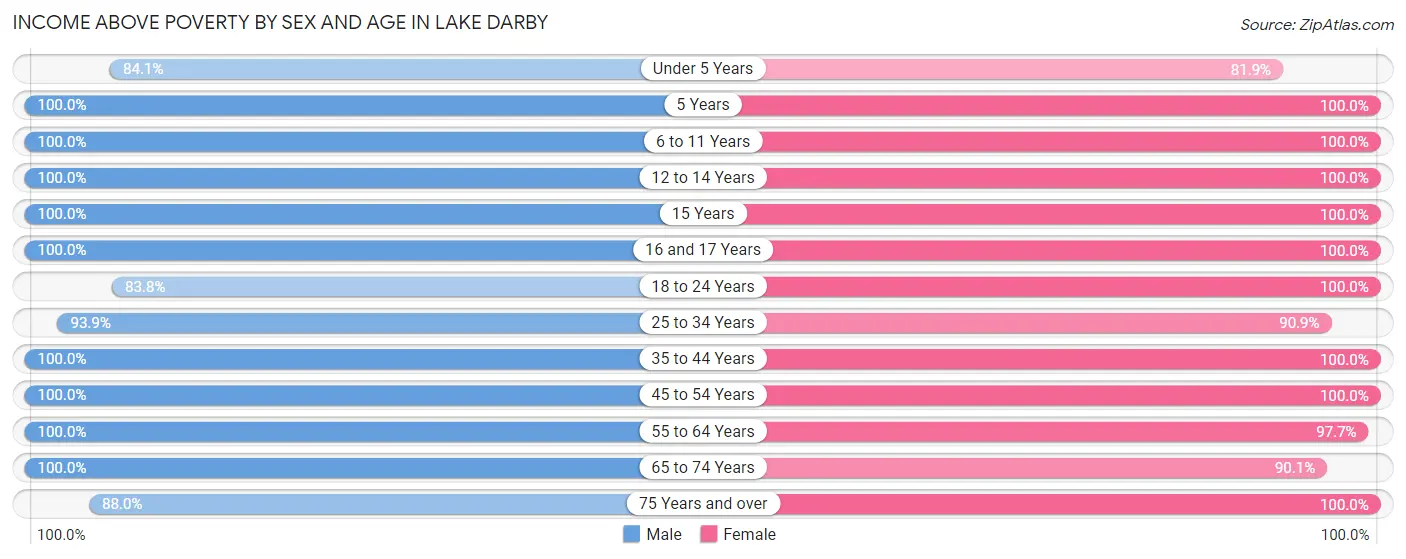
| Age Bracket | Male | Female |
| Under 5 Years | 143 (84.1%) | 149 (81.9%) |
| 5 Years | 11 (100.0%) | 40 (100.0%) |
| 6 to 11 Years | 163 (100.0%) | 274 (100.0%) |
| 12 to 14 Years | 39 (100.0%) | 110 (100.0%) |
| 15 Years | 25 (100.0%) | 57 (100.0%) |
| 16 and 17 Years | 65 (100.0%) | 41 (100.0%) |
| 18 to 24 Years | 98 (83.8%) | 124 (100.0%) |
| 25 to 34 Years | 322 (93.9%) | 258 (90.8%) |
| 35 to 44 Years | 487 (100.0%) | 407 (100.0%) |
| 45 to 54 Years | 280 (100.0%) | 231 (100.0%) |
| 55 to 64 Years | 215 (100.0%) | 476 (97.7%) |
| 65 to 74 Years | 121 (100.0%) | 172 (90.0%) |
| 75 Years and over | 81 (88.0%) | 13 (100.0%) |
| Total | 2,050 (96.3%) | 2,352 (96.4%) |
Income Below Poverty Among Married-Couple Families in Lake Darby
The poverty statistics for married-couple families in Lake Darby show that 2.3% or 21 of the total 903 families live below the poverty line. Families with 1 or 2 children have the highest poverty rate of 6.0%, comprising of 21 families. On the other hand, families with no children have the lowest poverty rate of 0.0%, which includes 0 families.
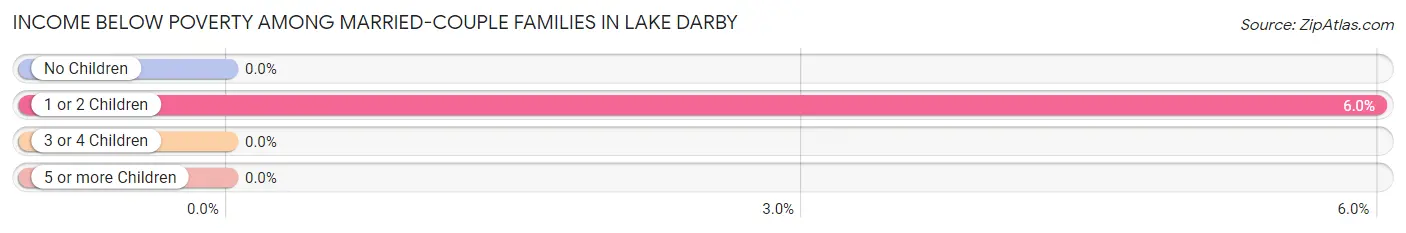
| Children | Above Poverty | Below Poverty |
| No Children | 486 (100.0%) | 0 (0.0%) |
| 1 or 2 Children | 329 (94.0%) | 21 (6.0%) |
| 3 or 4 Children | 56 (100.0%) | 0 (0.0%) |
| 5 or more Children | 11 (100.0%) | 0 (0.0%) |
| Total | 882 (97.7%) | 21 (2.3%) |
Income Below Poverty Among Single-Parent Households in Lake Darby
| Children | Single Father | Single Mother |
| No Children | 0 (0.0%) | 0 (0.0%) |
| 1 or 2 Children | 0 (0.0%) | 0 (0.0%) |
| 3 or 4 Children | 0 (0.0%) | 0 (0.0%) |
| 5 or more Children | 0 (0.0%) | 0 (0.0%) |
| Total | 0 (0.0%) | 0 (0.0%) |
Income Below Poverty Among Married-Couple vs Single-Parent Households in Lake Darby
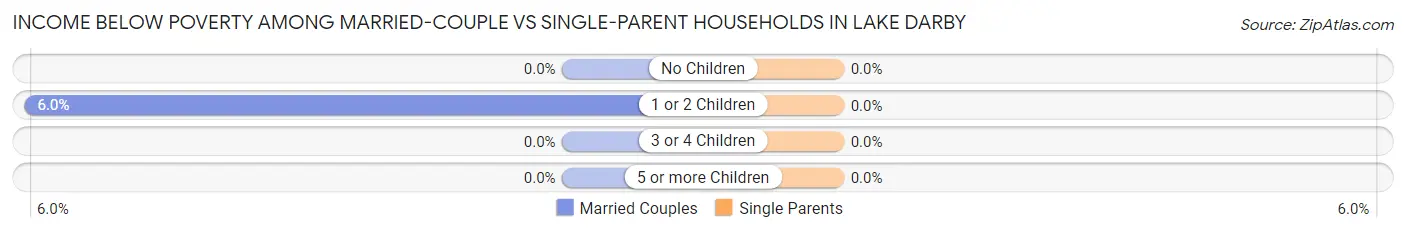
| Children | Married-Couple Families | Single-Parent Households |
| No Children | 0 (0.0%) | 0 (0.0%) |
| 1 or 2 Children | 21 (6.0%) | 0 (0.0%) |
| 3 or 4 Children | 0 (0.0%) | 0 (0.0%) |
| 5 or more Children | 0 (0.0%) | 0 (0.0%) |
| Total | 21 (2.3%) | 0 (0.0%) |
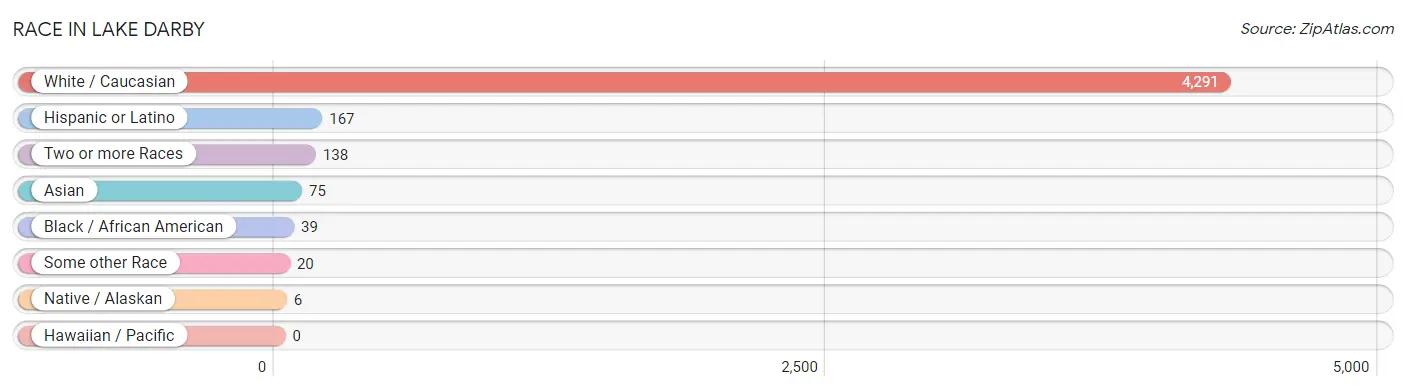
Race in Lake Darby
The most populous races in Lake Darby are White / Caucasian (4,291 | 93.9%), Hispanic or Latino (167 | 3.7%), and Two or more Races (138 | 3.0%).
| Race | # Population | % Population |
| Asian | 75 | 1.6% |
| Black / African American | 39 | 0.9% |
| Hawaiian / Pacific | 0 | 0.0% |
| Hispanic or Latino | 167 | 3.7% |
| Native / Alaskan | 6 | 0.1% |
| White / Caucasian | 4,291 | 93.9% |
| Two or more Races | 138 | 3.0% |
| Some other Race | 20 | 0.4% |
| Total | 4,569 | 100.0% |
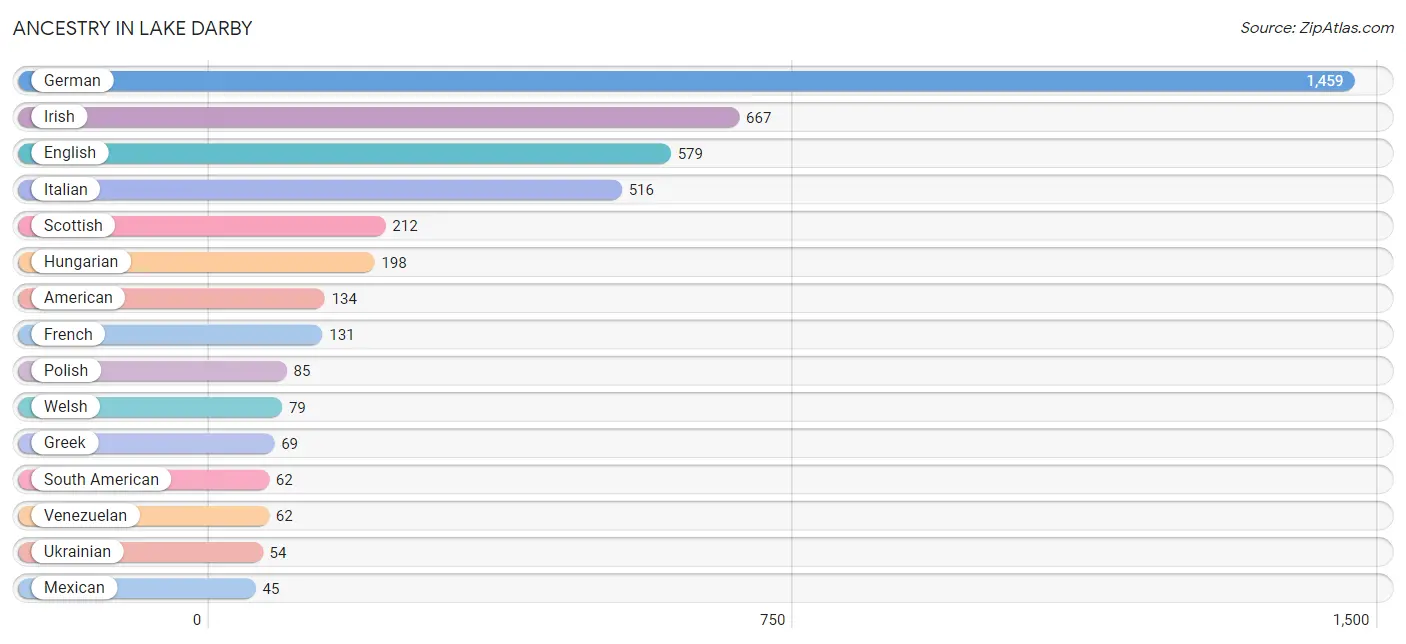
Ancestry in Lake Darby
The most populous ancestries reported in Lake Darby are German (1,459 | 31.9%), Irish (667 | 14.6%), English (579 | 12.7%), Italian (516 | 11.3%), and Scottish (212 | 4.6%), together accounting for 75.1% of all Lake Darby residents.
| Ancestry | # Population | % Population |
| American | 134 | 2.9% |
| Arab | 18 | 0.4% |
| Austrian | 8 | 0.2% |
| British | 13 | 0.3% |
| Bulgarian | 14 | 0.3% |
| Canadian | 7 | 0.2% |
| Cherokee | 19 | 0.4% |
| Czech | 14 | 0.3% |
| Czechoslovakian | 37 | 0.8% |
| Dutch | 22 | 0.5% |
| Eastern European | 15 | 0.3% |
| English | 579 | 12.7% |
| European | 43 | 0.9% |
| French | 131 | 2.9% |
| German | 1,459 | 31.9% |
| Greek | 69 | 1.5% |
| Hungarian | 198 | 4.3% |
| Indian (Asian) | 22 | 0.5% |
| Irish | 667 | 14.6% |
| Italian | 516 | 11.3% |
| Japanese | 13 | 0.3% |
| Korean | 14 | 0.3% |
| Lebanese | 18 | 0.4% |
| Lithuanian | 22 | 0.5% |
| Lumbee | 7 | 0.2% |
| Mexican | 45 | 1.0% |
| Mexican American Indian | 21 | 0.5% |
| Navajo | 5 | 0.1% |
| Norwegian | 44 | 1.0% |
| Pennsylvania German | 26 | 0.6% |
| Polish | 85 | 1.9% |
| Russian | 17 | 0.4% |
| Scandinavian | 22 | 0.5% |
| Scotch-Irish | 22 | 0.5% |
| Scottish | 212 | 4.6% |
| South American | 62 | 1.4% |
| Swedish | 44 | 1.0% |
| Thai | 39 | 0.9% |
| Ukrainian | 54 | 1.2% |
| Venezuelan | 62 | 1.4% |
| Welsh | 79 | 1.7% | View All 41 Rows |
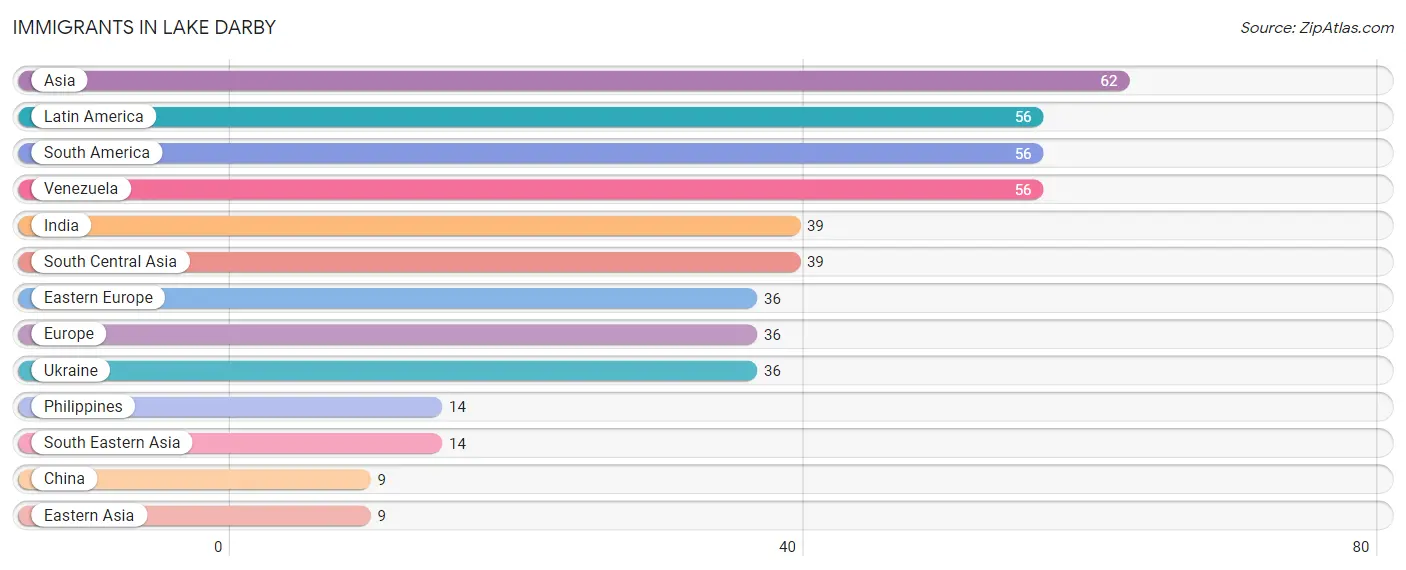
Immigrants in Lake Darby
The most numerous immigrant groups reported in Lake Darby came from Asia (62 | 1.4%), Latin America (56 | 1.2%), South America (56 | 1.2%), Venezuela (56 | 1.2%), and India (39 | 0.9%), together accounting for 5.9% of all Lake Darby residents.
| Immigration Origin | # Population | % Population |
| Asia | 62 | 1.4% |
| China | 9 | 0.2% |
| Eastern Asia | 9 | 0.2% |
| Eastern Europe | 36 | 0.8% |
| Europe | 36 | 0.8% |
| India | 39 | 0.9% |
| Latin America | 56 | 1.2% |
| Philippines | 14 | 0.3% |
| South America | 56 | 1.2% |
| South Central Asia | 39 | 0.9% |
| South Eastern Asia | 14 | 0.3% |
| Ukraine | 36 | 0.8% |
| Venezuela | 56 | 1.2% | View All 13 Rows |
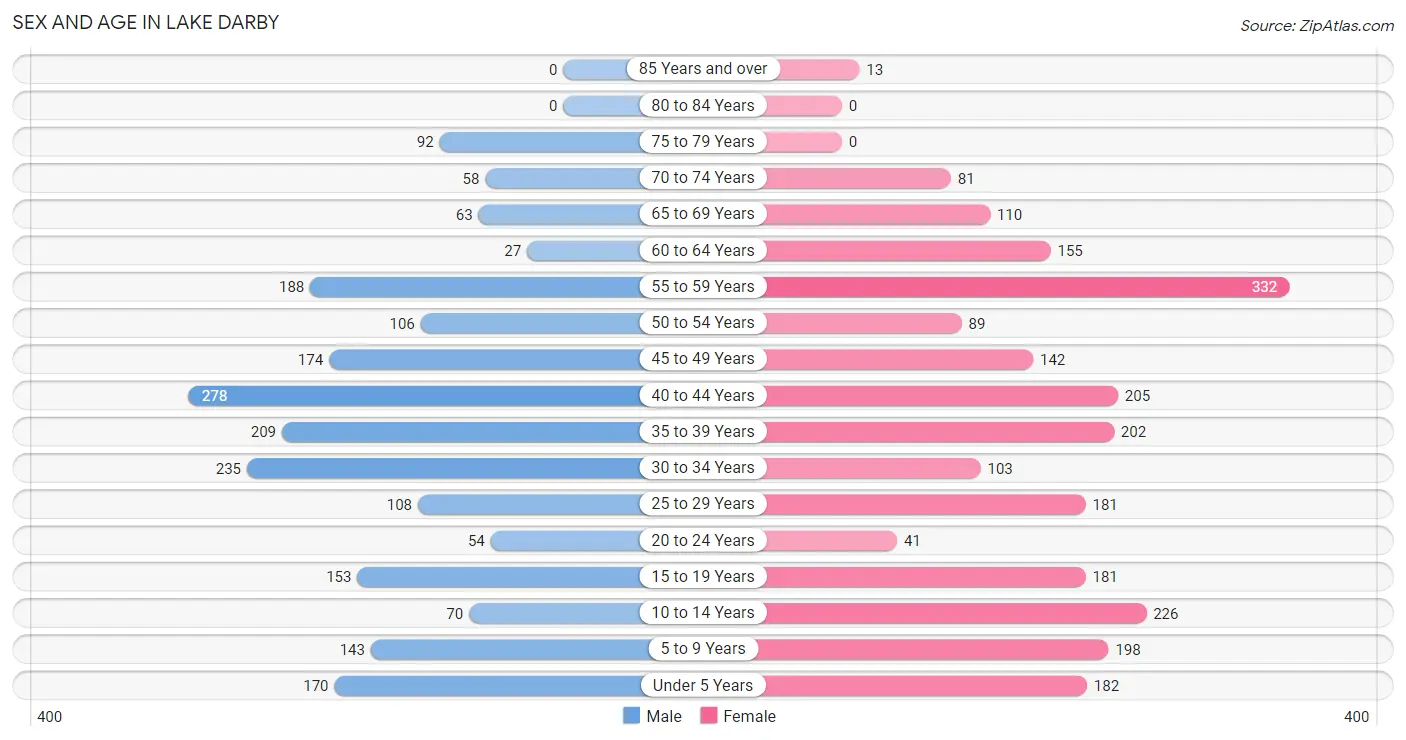
Sex and Age in Lake Darby
Sex and Age in Lake Darby
The most populous age groups in Lake Darby are 40 to 44 Years (278 | 13.1%) for men and 55 to 59 Years (332 | 13.6%) for women.
| Age Bracket | Male | Female |
| Under 5 Years | 170 (8.0%) | 182 (7.5%) |
| 5 to 9 Years | 143 (6.7%) | 198 (8.1%) |
| 10 to 14 Years | 70 (3.3%) | 226 (9.3%) |
| 15 to 19 Years | 153 (7.2%) | 181 (7.4%) |
| 20 to 24 Years | 54 (2.5%) | 41 (1.7%) |
| 25 to 29 Years | 108 (5.1%) | 181 (7.4%) |
| 30 to 34 Years | 235 (11.0%) | 103 (4.2%) |
| 35 to 39 Years | 209 (9.8%) | 202 (8.3%) |
| 40 to 44 Years | 278 (13.1%) | 205 (8.4%) |
| 45 to 49 Years | 174 (8.2%) | 142 (5.8%) |
| 50 to 54 Years | 106 (5.0%) | 89 (3.6%) |
| 55 to 59 Years | 188 (8.8%) | 332 (13.6%) |
| 60 to 64 Years | 27 (1.3%) | 155 (6.4%) |
| 65 to 69 Years | 63 (3.0%) | 110 (4.5%) |
| 70 to 74 Years | 58 (2.7%) | 81 (3.3%) |
| 75 to 79 Years | 92 (4.3%) | 0 (0.0%) |
| 80 to 84 Years | 0 (0.0%) | 0 (0.0%) |
| 85 Years and over | 0 (0.0%) | 13 (0.5%) |
| Total | 2,128 (100.0%) | 2,441 (100.0%) |
Families and Households in Lake Darby
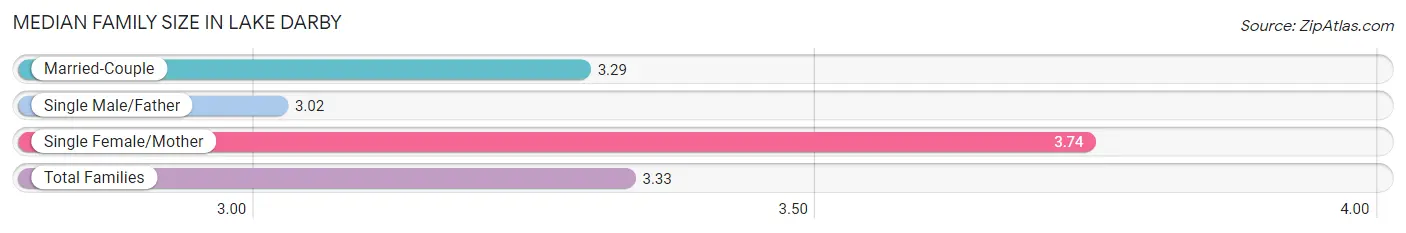
Median Family Size in Lake Darby
The median family size in Lake Darby is 3.33 persons per family, with single female/mother families (171 | 14.4%) accounting for the largest median family size of 3.74 persons per family. On the other hand, single male/father families (115 | 9.7%) represent the smallest median family size with 3.02 persons per family.
| Family Type | # Families | Family Size |
| Married-Couple | 903 (75.9%) | 3.29 |
| Single Male/Father | 115 (9.7%) | 3.02 |
| Single Female/Mother | 171 (14.4%) | 3.74 |
| Total Families | 1,189 (100.0%) | 3.33 |
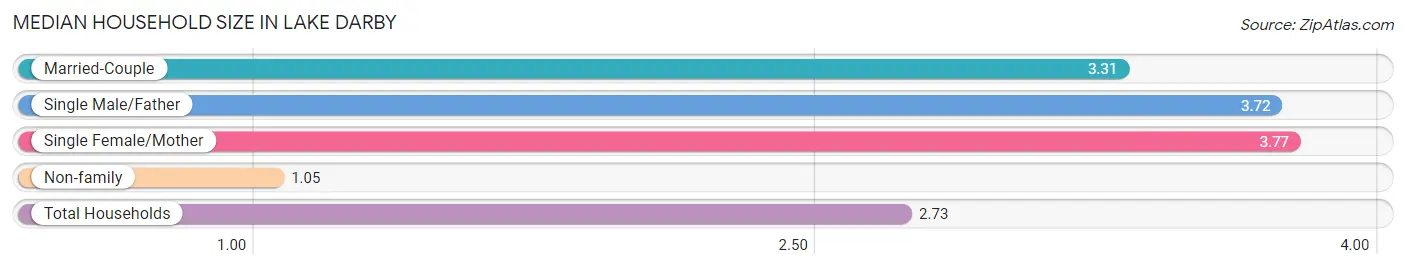
Median Household Size in Lake Darby
The median household size in Lake Darby is 2.73 persons per household, with single female/mother households (171 | 10.2%) accounting for the largest median household size of 3.77 persons per household. non-family households (482 | 28.8%) represent the smallest median household size with 1.05 persons per household.
| Household Type | # Households | Household Size |
| Married-Couple | 903 (54.0%) | 3.31 |
| Single Male/Father | 115 (6.9%) | 3.72 |
| Single Female/Mother | 171 (10.2%) | 3.77 |
| Non-family | 482 (28.8%) | 1.05 |
| Total Households | 1,671 (100.0%) | 2.73 |
Household Size by Marriage Status in Lake Darby
Out of a total of 1,671 households in Lake Darby, 1,189 (71.2%) are family households, while 482 (28.8%) are nonfamily households. The most numerous type of family households are 2-person households, comprising 411, and the most common type of nonfamily households are 1-person households, comprising 461.
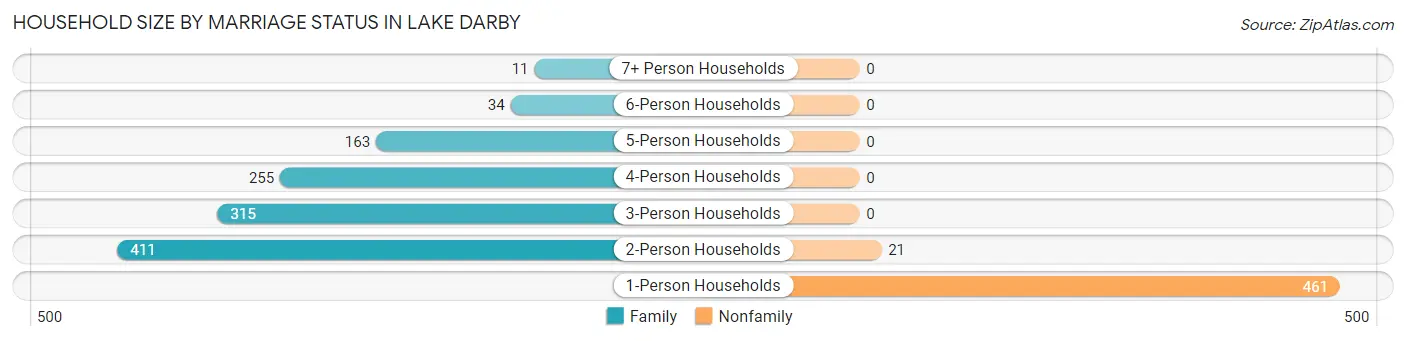
| Household Size | Family Households | Nonfamily Households |
| 1-Person Households | - | 461 (27.6%) |
| 2-Person Households | 411 (24.6%) | 21 (1.3%) |
| 3-Person Households | 315 (18.9%) | 0 (0.0%) |
| 4-Person Households | 255 (15.3%) | 0 (0.0%) |
| 5-Person Households | 163 (9.8%) | 0 (0.0%) |
| 6-Person Households | 34 (2.0%) | 0 (0.0%) |
| 7+ Person Households | 11 (0.7%) | 0 (0.0%) |
| Total | 1,189 (71.2%) | 482 (28.8%) |
Female Fertility in Lake Darby
Fertility by Age in Lake Darby
Average fertility rate in Lake Darby is 72.0 births per 1,000 women. Women in the age bracket of 35 to 50 years have the highest fertility rate with 87.0 births per 1,000 women. Women in the age bracket of 35 to 50 years acount for 63.2% of all women with births.
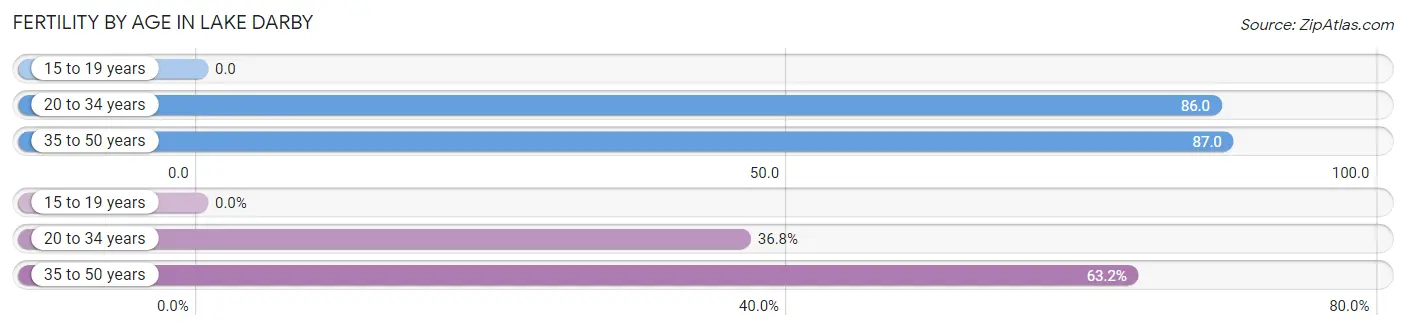
| Age Bracket | Women with Births | Births / 1,000 Women |
| 15 to 19 years | 0 (0.0%) | 0.0 |
| 20 to 34 years | 28 (36.8%) | 86.0 |
| 35 to 50 years | 48 (63.2%) | 87.0 |
| Total | 76 (100.0%) | 72.0 |
Fertility by Age by Marriage Status in Lake Darby
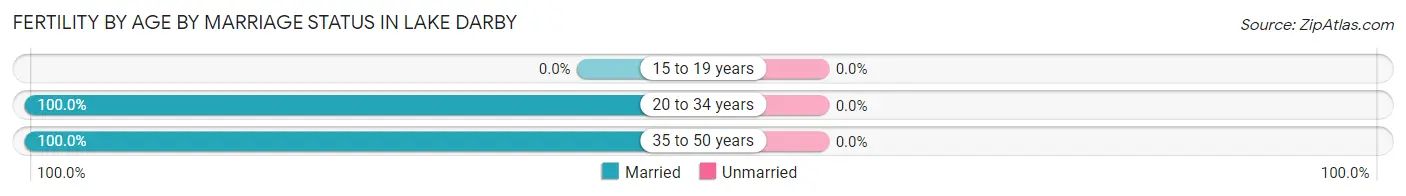
| Age Bracket | Married | Unmarried |
| 15 to 19 years | 0 (0.0%) | 0 (0.0%) |
| 20 to 34 years | 28 (100.0%) | 0 (0.0%) |
| 35 to 50 years | 48 (100.0%) | 0 (0.0%) |
| Total | 76 (100.0%) | 0 (0.0%) |
Fertility by Education in Lake Darby
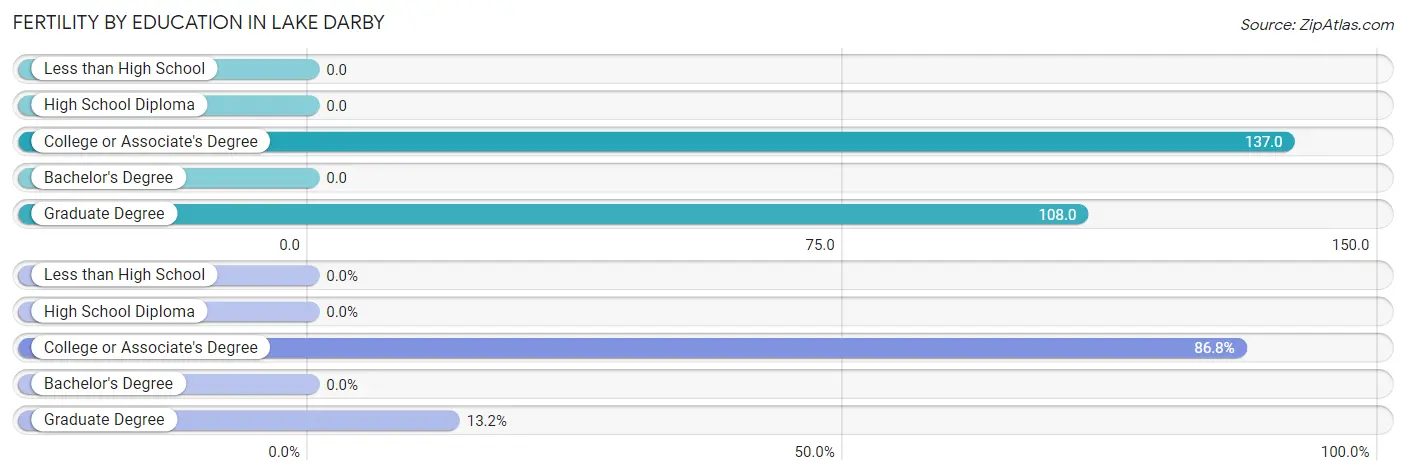
| Educational Attainment | Women with Births | Births / 1,000 Women |
| Less than High School | 0 (0.0%) | 0.0 |
| High School Diploma | 0 (0.0%) | 0.0 |
| College or Associate's Degree | 66 (86.8%) | 137.0 |
| Bachelor's Degree | 0 (0.0%) | 0.0 |
| Graduate Degree | 10 (13.2%) | 108.0 |
| Total | 76 (100.0%) | 72.0 |
Fertility by Education by Marriage Status in Lake Darby
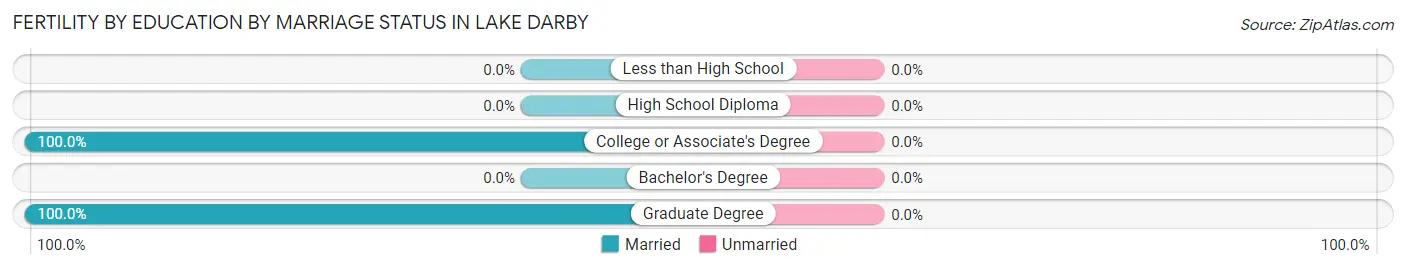
| Educational Attainment | Married | Unmarried |
| Less than High School | 0 (0.0%) | 0 (0.0%) |
| High School Diploma | 0 (0.0%) | 0 (0.0%) |
| College or Associate's Degree | 66 (100.0%) | 0 (0.0%) |
| Bachelor's Degree | 0 (0.0%) | 0 (0.0%) |
| Graduate Degree | 10 (100.0%) | 0 (0.0%) |
| Total | 76 (100.0%) | 0 (0.0%) |
Employment Characteristics in Lake Darby
Employment by Class of Employer in Lake Darby
Among the 2,548 employed individuals in Lake Darby, private company employees (1,856 | 72.8%), not-for-profit organizations (264 | 10.4%), and state government employees (152 | 6.0%) make up the most common classes of employment.
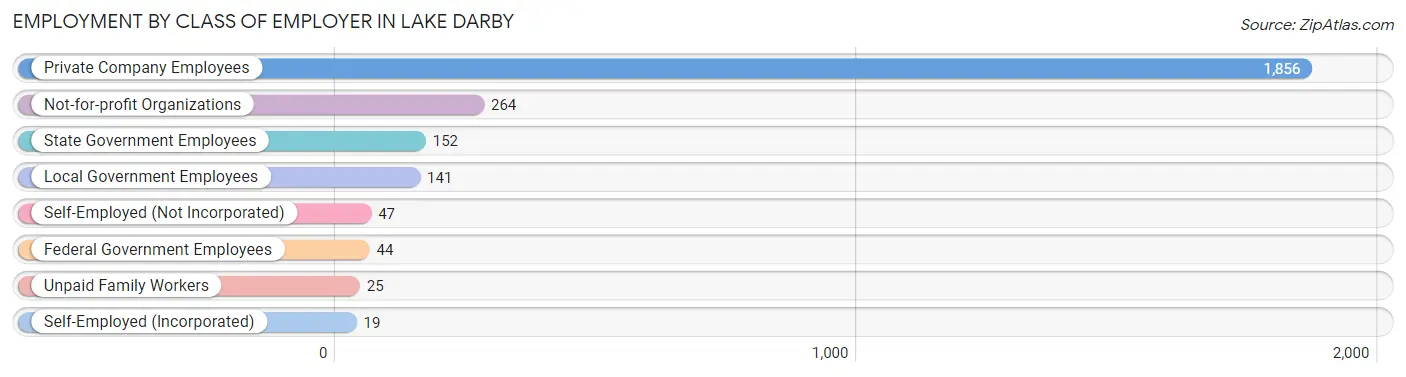
| Employer Class | # Employees | % Employees |
| Private Company Employees | 1,856 | 72.8% |
| Self-Employed (Incorporated) | 19 | 0.7% |
| Self-Employed (Not Incorporated) | 47 | 1.8% |
| Not-for-profit Organizations | 264 | 10.4% |
| Local Government Employees | 141 | 5.5% |
| State Government Employees | 152 | 6.0% |
| Federal Government Employees | 44 | 1.7% |
| Unpaid Family Workers | 25 | 1.0% |
| Total | 2,548 | 100.0% |
Employment Status by Age in Lake Darby
According to the labor force statistics for Lake Darby, out of the total population over 16 years of age (3,498), 74.8% or 2,617 individuals are in the labor force, with 2.0% or 52 of them unemployed. The age group with the highest labor force participation rate is 45 to 54 years, with 96.3% or 492 individuals in the labor force. Within the labor force, the 30 to 34 years age range has the highest percentage of unemployed individuals, with 6.2% or 20 of them being unemployed.
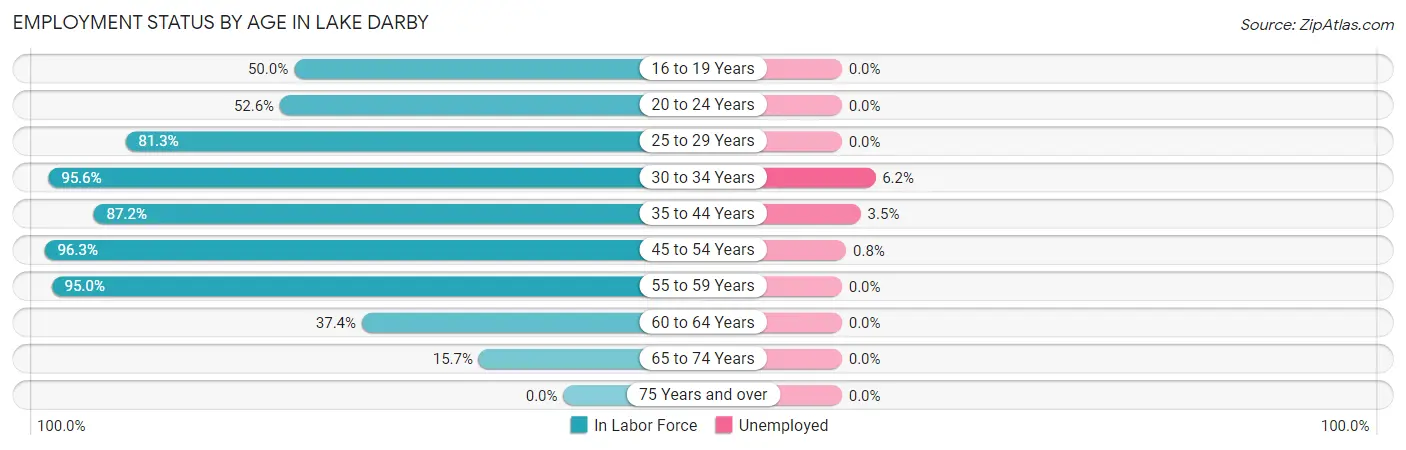
| Age Bracket | In Labor Force | Unemployed |
| 16 to 19 Years | 126 (50.0%) | 0 (0.0%) |
| 20 to 24 Years | 50 (52.6%) | 0 (0.0%) |
| 25 to 29 Years | 235 (81.3%) | 0 (0.0%) |
| 30 to 34 Years | 323 (95.6%) | 20 (6.2%) |
| 35 to 44 Years | 780 (87.2%) | 27 (3.5%) |
| 45 to 54 Years | 492 (96.3%) | 4 (0.8%) |
| 55 to 59 Years | 494 (95.0%) | 0 (0.0%) |
| 60 to 64 Years | 68 (37.4%) | 0 (0.0%) |
| 65 to 74 Years | 49 (15.7%) | 0 (0.0%) |
| 75 Years and over | 0 (0.0%) | 0 (0.0%) |
| Total | 2,617 (74.8%) | 52 (2.0%) |
Employment Status by Educational Attainment in Lake Darby
According to labor force statistics for Lake Darby, 87.5% of individuals (2,392) out of the total population between 25 and 64 years of age (2,734) are in the labor force, with 2.1% or 50 of them being unemployed. The group with the highest labor force participation rate are those with the educational attainment of less than high school, with 100.0% or 48 individuals in the labor force. Within the labor force, individuals with less than high school education have the highest percentage of unemployment, with 41.7% or 20 of them being unemployed.
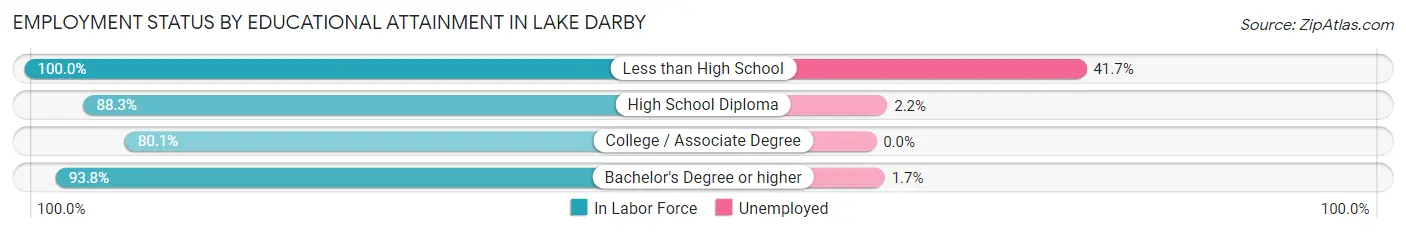
| Educational Attainment | In Labor Force | Unemployed |
| Less than High School | 48 (100.0%) | 20 (41.7%) |
| High School Diploma | 789 (88.3%) | 20 (2.2%) |
| College / Associate Degree | 737 (80.1%) | 0 (0.0%) |
| Bachelor's Degree or higher | 818 (93.8%) | 15 (1.7%) |
| Total | 2,392 (87.5%) | 57 (2.1%) |
Employment Occupations by Sex in Lake Darby
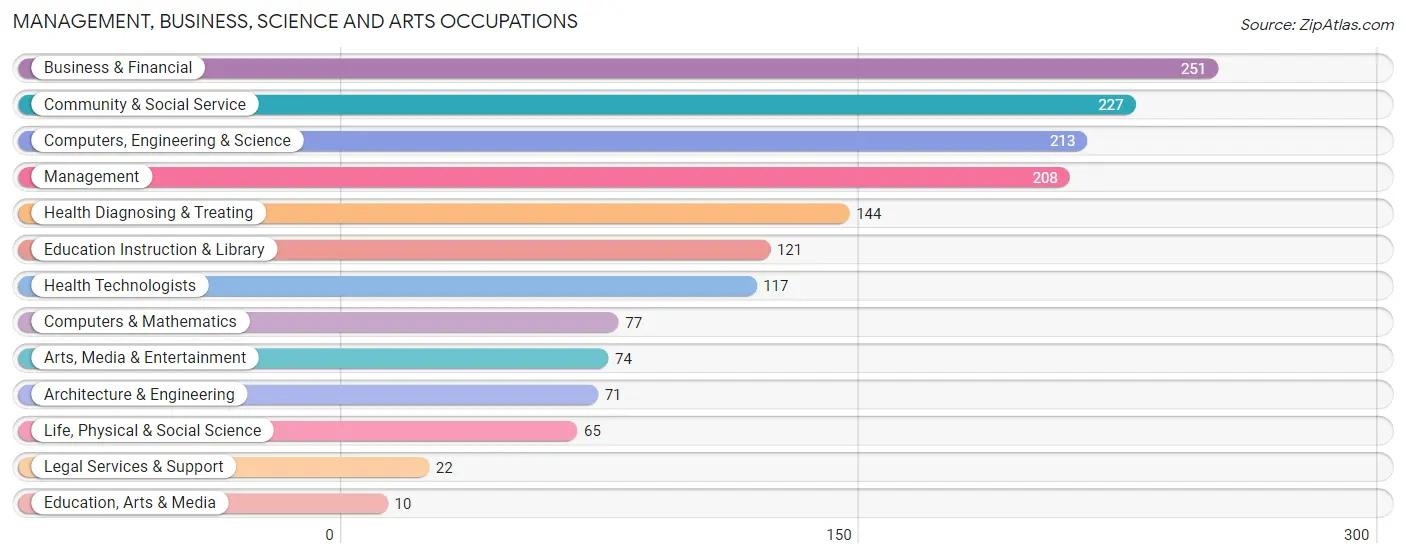
Management, Business, Science and Arts Occupations
The most common Management, Business, Science and Arts occupations in Lake Darby are Business & Financial (251 | 9.8%), Community & Social Service (227 | 8.9%), Computers, Engineering & Science (213 | 8.3%), Management (208 | 8.1%), and Health Diagnosing & Treating (144 | 5.6%).
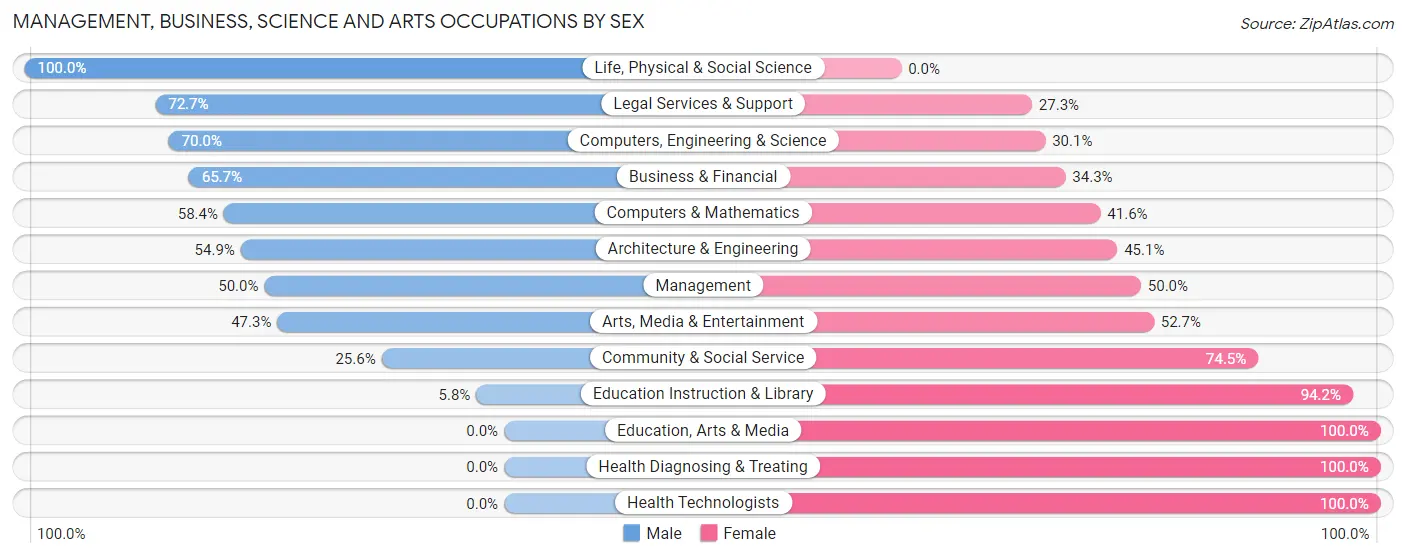
Management, Business, Science and Arts Occupations by Sex
Within the Management, Business, Science and Arts occupations in Lake Darby, the most male-oriented occupations are Life, Physical & Social Science (100.0%), Legal Services & Support (72.7%), and Computers, Engineering & Science (70.0%), while the most female-oriented occupations are Education, Arts & Media (100.0%), Health Diagnosing & Treating (100.0%), and Health Technologists (100.0%).
| Occupation | Male | Female |
| Management | 104 (50.0%) | 104 (50.0%) |
| Business & Financial | 165 (65.7%) | 86 (34.3%) |
| Computers, Engineering & Science | 149 (70.0%) | 64 (30.0%) |
| Computers & Mathematics | 45 (58.4%) | 32 (41.6%) |
| Architecture & Engineering | 39 (54.9%) | 32 (45.1%) |
| Life, Physical & Social Science | 65 (100.0%) | 0 (0.0%) |
| Community & Social Service | 58 (25.6%) | 169 (74.5%) |
| Education, Arts & Media | 0 (0.0%) | 10 (100.0%) |
| Legal Services & Support | 16 (72.7%) | 6 (27.3%) |
| Education Instruction & Library | 7 (5.8%) | 114 (94.2%) |
| Arts, Media & Entertainment | 35 (47.3%) | 39 (52.7%) |
| Health Diagnosing & Treating | 0 (0.0%) | 144 (100.0%) |
| Health Technologists | 0 (0.0%) | 117 (100.0%) |
| Total (Category) | 476 (45.6%) | 567 (54.4%) |
| Total (Overall) | 1,349 (52.7%) | 1,210 (47.3%) |
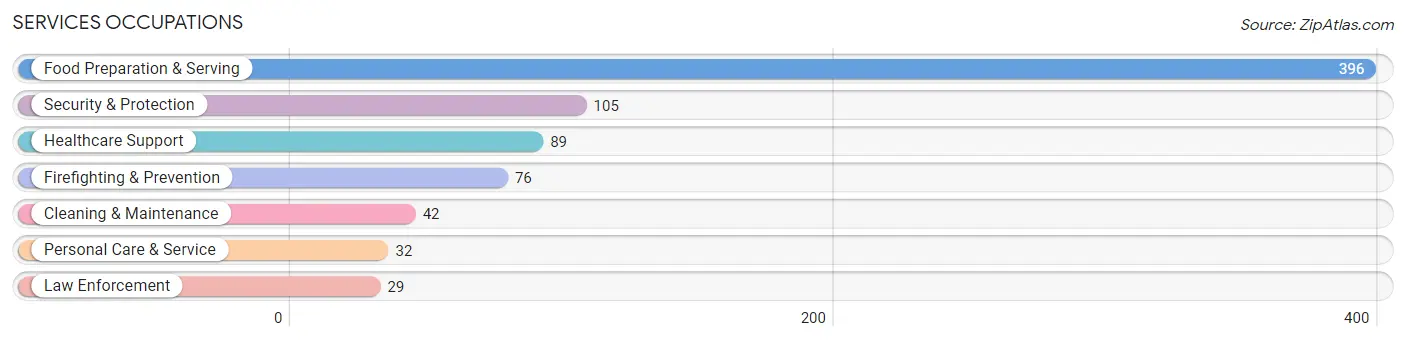
Services Occupations
The most common Services occupations in Lake Darby are Food Preparation & Serving (396 | 15.5%), Security & Protection (105 | 4.1%), Healthcare Support (89 | 3.5%), Firefighting & Prevention (76 | 3.0%), and Cleaning & Maintenance (42 | 1.6%).
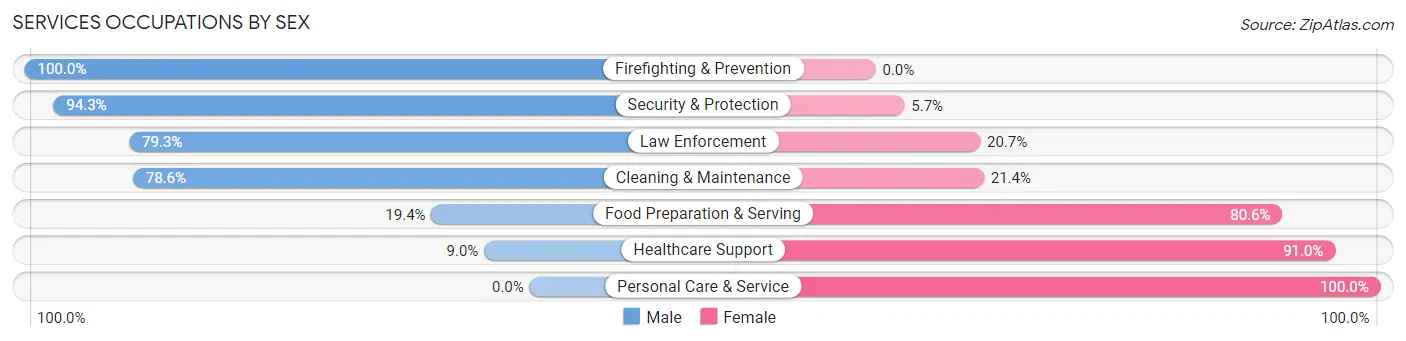
Services Occupations by Sex
Within the Services occupations in Lake Darby, the most male-oriented occupations are Firefighting & Prevention (100.0%), Security & Protection (94.3%), and Law Enforcement (79.3%), while the most female-oriented occupations are Personal Care & Service (100.0%), Healthcare Support (91.0%), and Food Preparation & Serving (80.6%).
| Occupation | Male | Female |
| Healthcare Support | 8 (9.0%) | 81 (91.0%) |
| Security & Protection | 99 (94.3%) | 6 (5.7%) |
| Firefighting & Prevention | 76 (100.0%) | 0 (0.0%) |
| Law Enforcement | 23 (79.3%) | 6 (20.7%) |
| Food Preparation & Serving | 77 (19.4%) | 319 (80.6%) |
| Cleaning & Maintenance | 33 (78.6%) | 9 (21.4%) |
| Personal Care & Service | 0 (0.0%) | 32 (100.0%) |
| Total (Category) | 217 (32.7%) | 447 (67.3%) |
| Total (Overall) | 1,349 (52.7%) | 1,210 (47.3%) |
Sales and Office Occupations
The most common Sales and Office occupations in Lake Darby are Office & Administration (200 | 7.8%), and Sales & Related (119 | 4.6%).
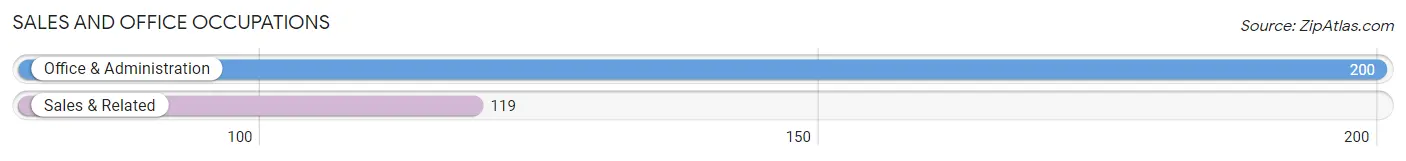
Sales and Office Occupations by Sex

| Occupation | Male | Female |
| Sales & Related | 101 (84.9%) | 18 (15.1%) |
| Office & Administration | 44 (22.0%) | 156 (78.0%) |
| Total (Category) | 145 (45.5%) | 174 (54.5%) |
| Total (Overall) | 1,349 (52.7%) | 1,210 (47.3%) |
Natural Resources, Construction and Maintenance Occupations
The most common Natural Resources, Construction and Maintenance occupations in Lake Darby are Construction & Extraction (154 | 6.0%), and Installation, Maintenance & Repair (71 | 2.8%).
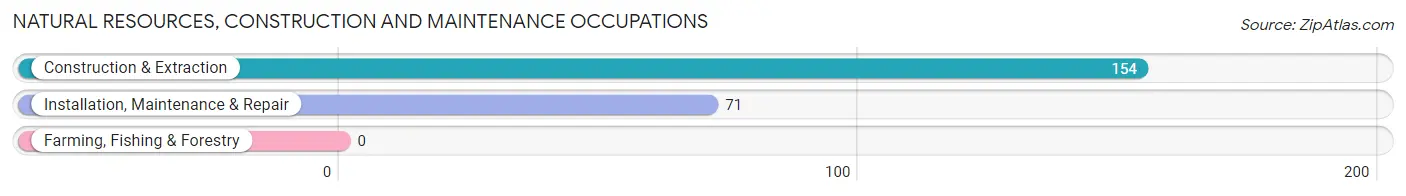
Natural Resources, Construction and Maintenance Occupations by Sex
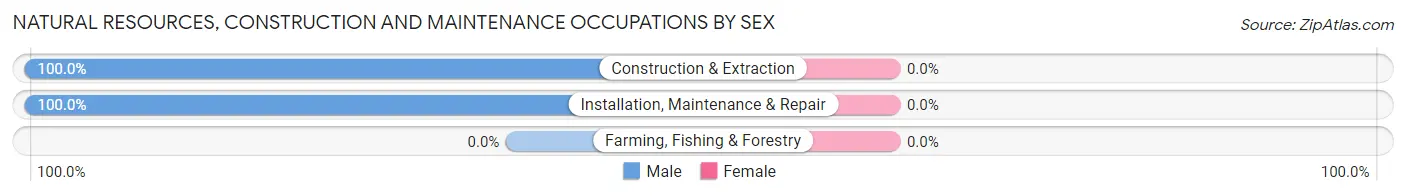
| Occupation | Male | Female |
| Farming, Fishing & Forestry | 0 (0.0%) | 0 (0.0%) |
| Construction & Extraction | 154 (100.0%) | 0 (0.0%) |
| Installation, Maintenance & Repair | 71 (100.0%) | 0 (0.0%) |
| Total (Category) | 225 (100.0%) | 0 (0.0%) |
| Total (Overall) | 1,349 (52.7%) | 1,210 (47.3%) |
Production, Transportation and Moving Occupations
The most common Production, Transportation and Moving occupations in Lake Darby are Transportation (122 | 4.8%), Production (99 | 3.9%), and Material Moving (87 | 3.4%).
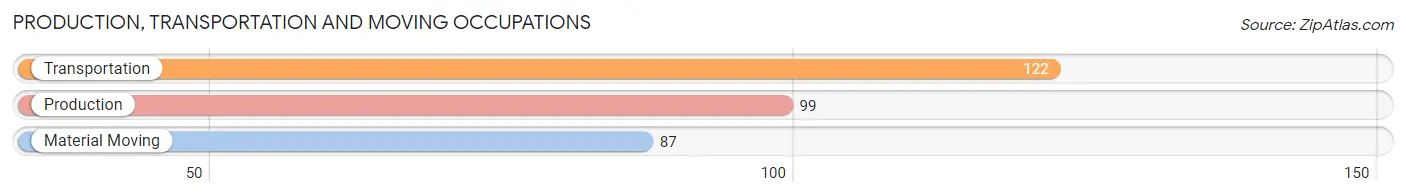
Production, Transportation and Moving Occupations by Sex
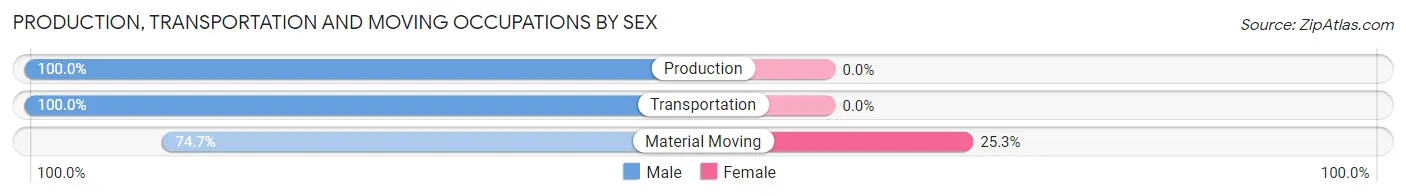
| Occupation | Male | Female |
| Production | 99 (100.0%) | 0 (0.0%) |
| Transportation | 122 (100.0%) | 0 (0.0%) |
| Material Moving | 65 (74.7%) | 22 (25.3%) |
| Total (Category) | 286 (92.9%) | 22 (7.1%) |
| Total (Overall) | 1,349 (52.7%) | 1,210 (47.3%) |
Employment Industries by Sex in Lake Darby
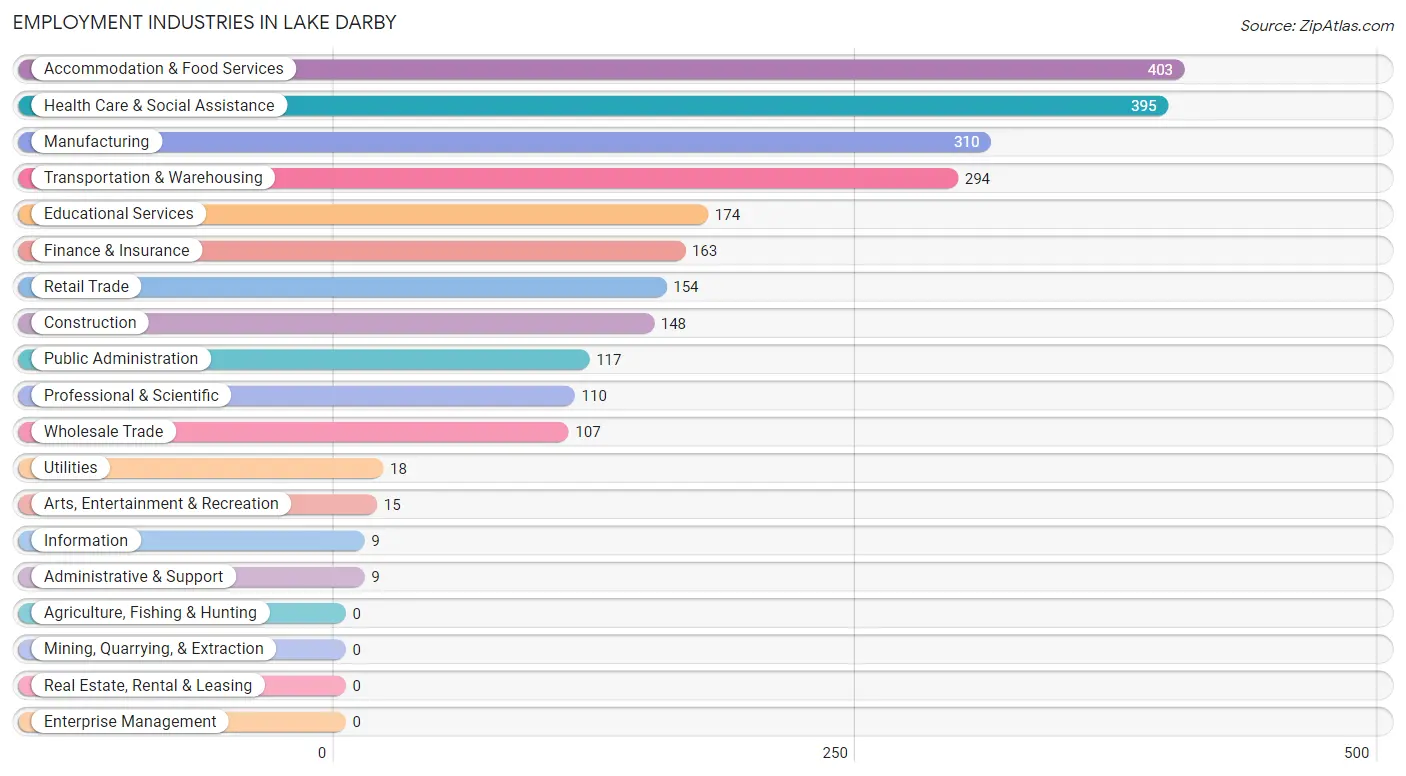
Employment Industries in Lake Darby
The major employment industries in Lake Darby include Accommodation & Food Services (403 | 15.8%), Health Care & Social Assistance (395 | 15.4%), Manufacturing (310 | 12.1%), Transportation & Warehousing (294 | 11.5%), and Educational Services (174 | 6.8%).
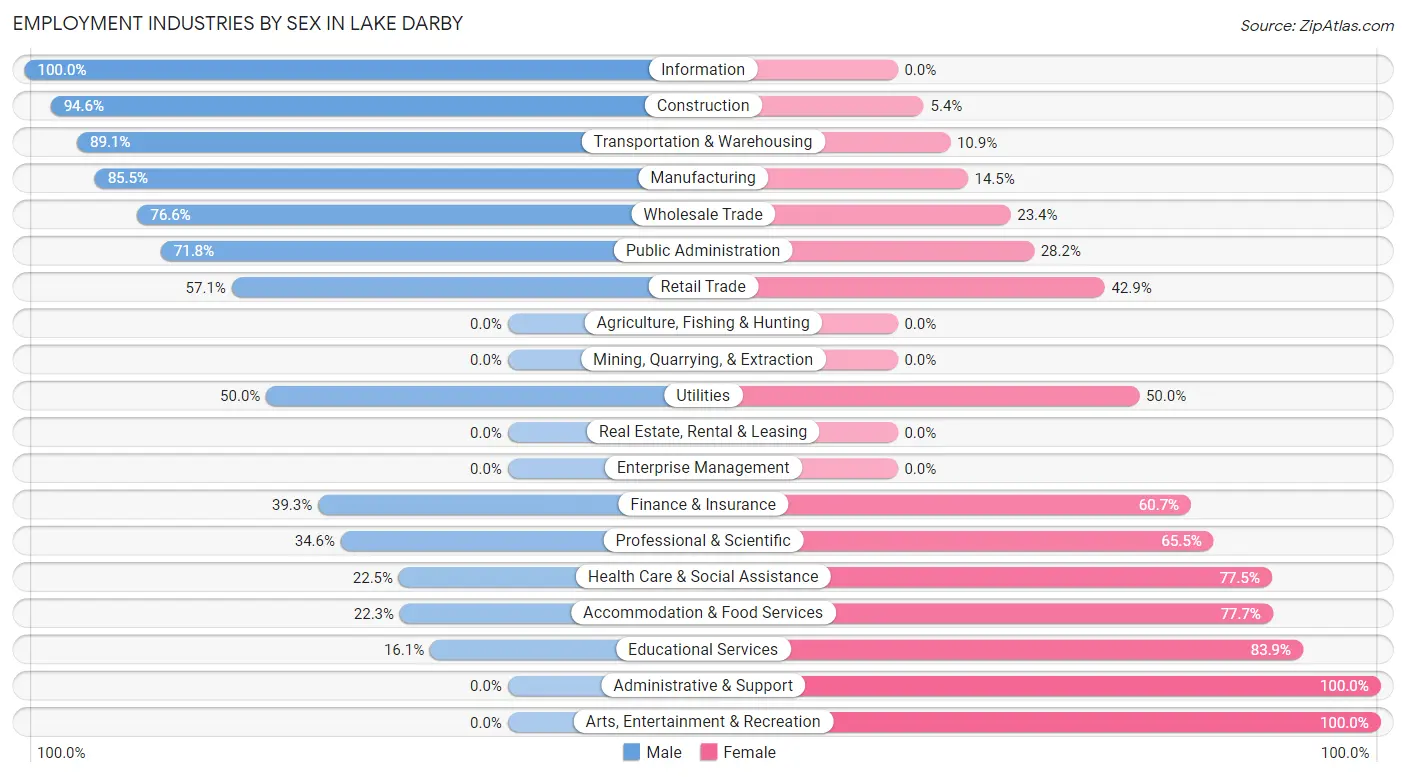
Employment Industries by Sex in Lake Darby
The Lake Darby industries that see more men than women are Information (100.0%), Construction (94.6%), and Transportation & Warehousing (89.1%), whereas the industries that tend to have a higher number of women are Administrative & Support (100.0%), Arts, Entertainment & Recreation (100.0%), and Educational Services (83.9%).
| Industry | Male | Female |
| Agriculture, Fishing & Hunting | 0 (0.0%) | 0 (0.0%) |
| Mining, Quarrying, & Extraction | 0 (0.0%) | 0 (0.0%) |
| Construction | 140 (94.6%) | 8 (5.4%) |
| Manufacturing | 265 (85.5%) | 45 (14.5%) |
| Wholesale Trade | 82 (76.6%) | 25 (23.4%) |
| Retail Trade | 88 (57.1%) | 66 (42.9%) |
| Transportation & Warehousing | 262 (89.1%) | 32 (10.9%) |
| Utilities | 9 (50.0%) | 9 (50.0%) |
| Information | 9 (100.0%) | 0 (0.0%) |
| Finance & Insurance | 64 (39.3%) | 99 (60.7%) |
| Real Estate, Rental & Leasing | 0 (0.0%) | 0 (0.0%) |
| Professional & Scientific | 38 (34.5%) | 72 (65.4%) |
| Enterprise Management | 0 (0.0%) | 0 (0.0%) |
| Administrative & Support | 0 (0.0%) | 9 (100.0%) |
| Educational Services | 28 (16.1%) | 146 (83.9%) |
| Health Care & Social Assistance | 89 (22.5%) | 306 (77.5%) |
| Arts, Entertainment & Recreation | 0 (0.0%) | 15 (100.0%) |
| Accommodation & Food Services | 90 (22.3%) | 313 (77.7%) |
| Public Administration | 84 (71.8%) | 33 (28.2%) |
| Total | 1,349 (52.7%) | 1,210 (47.3%) |
Education in Lake Darby
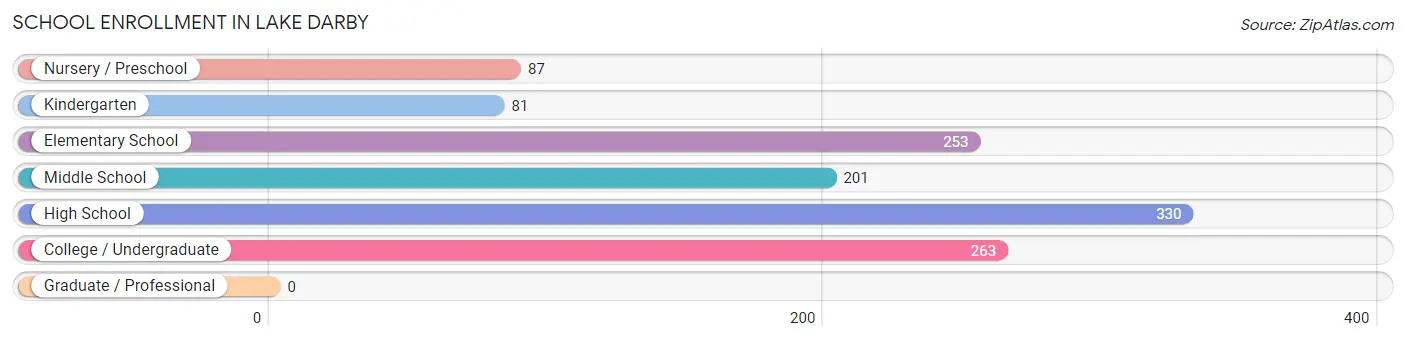
School Enrollment in Lake Darby
The most common levels of schooling among the 1,215 students in Lake Darby are high school (330 | 27.2%), college / undergraduate (263 | 21.6%), and elementary school (253 | 20.8%).
| School Level | # Students | % Students |
| Nursery / Preschool | 87 | 7.2% |
| Kindergarten | 81 | 6.7% |
| Elementary School | 253 | 20.8% |
| Middle School | 201 | 16.5% |
| High School | 330 | 27.2% |
| College / Undergraduate | 263 | 21.6% |
| Graduate / Professional | 0 | 0.0% |
| Total | 1,215 | 100.0% |
School Enrollment by Age by Funding Source in Lake Darby
Out of a total of 1,215 students who are enrolled in schools in Lake Darby, 74 (6.1%) attend a private institution, while the remaining 1,141 (93.9%) are enrolled in public schools. The age group of 3 to 4 year olds has the highest likelihood of being enrolled in private schools, with 41 (61.2% in the age bracket) enrolled. Conversely, the age group of 10 to 14 year olds has the lowest likelihood of being enrolled in a private school, with 296 (100.0% in the age bracket) attending a public institution.
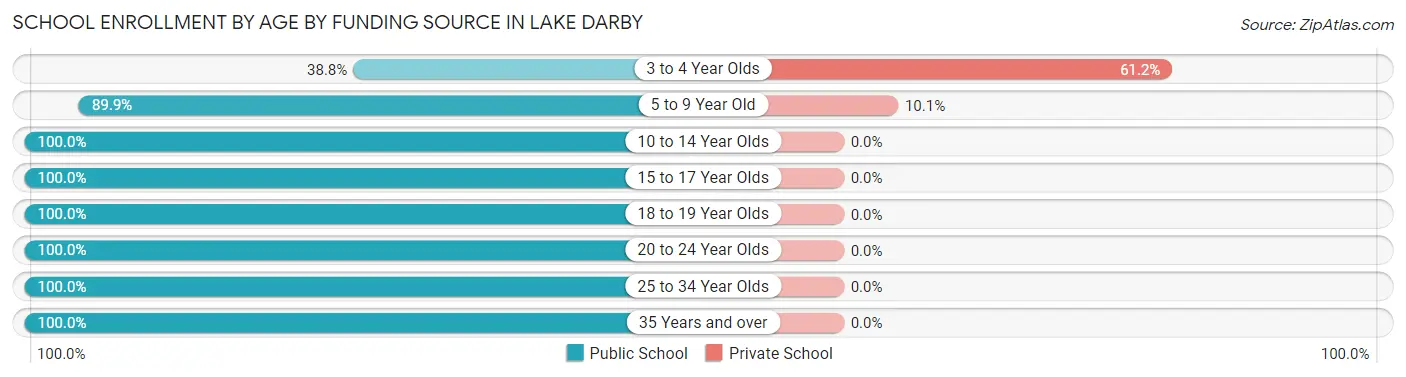
| Age Bracket | Public School | Private School |
| 3 to 4 Year Olds | 26 (38.8%) | 41 (61.2%) |
| 5 to 9 Year Old | 293 (89.9%) | 33 (10.1%) |
| 10 to 14 Year Olds | 296 (100.0%) | 0 (0.0%) |
| 15 to 17 Year Olds | 182 (100.0%) | 0 (0.0%) |
| 18 to 19 Year Olds | 138 (100.0%) | 0 (0.0%) |
| 20 to 24 Year Olds | 60 (100.0%) | 0 (0.0%) |
| 25 to 34 Year Olds | 71 (100.0%) | 0 (0.0%) |
| 35 Years and over | 75 (100.0%) | 0 (0.0%) |
| Total | 1,141 (93.9%) | 74 (6.1%) |
Educational Attainment by Field of Study in Lake Darby
Business (188 | 20.3%), education (175 | 18.9%), communications (89 | 9.6%), engineering (88 | 9.5%), and bio, nature & agricultural (85 | 9.2%) are the most common fields of study among 925 individuals in Lake Darby who have obtained a bachelor's degree or higher.
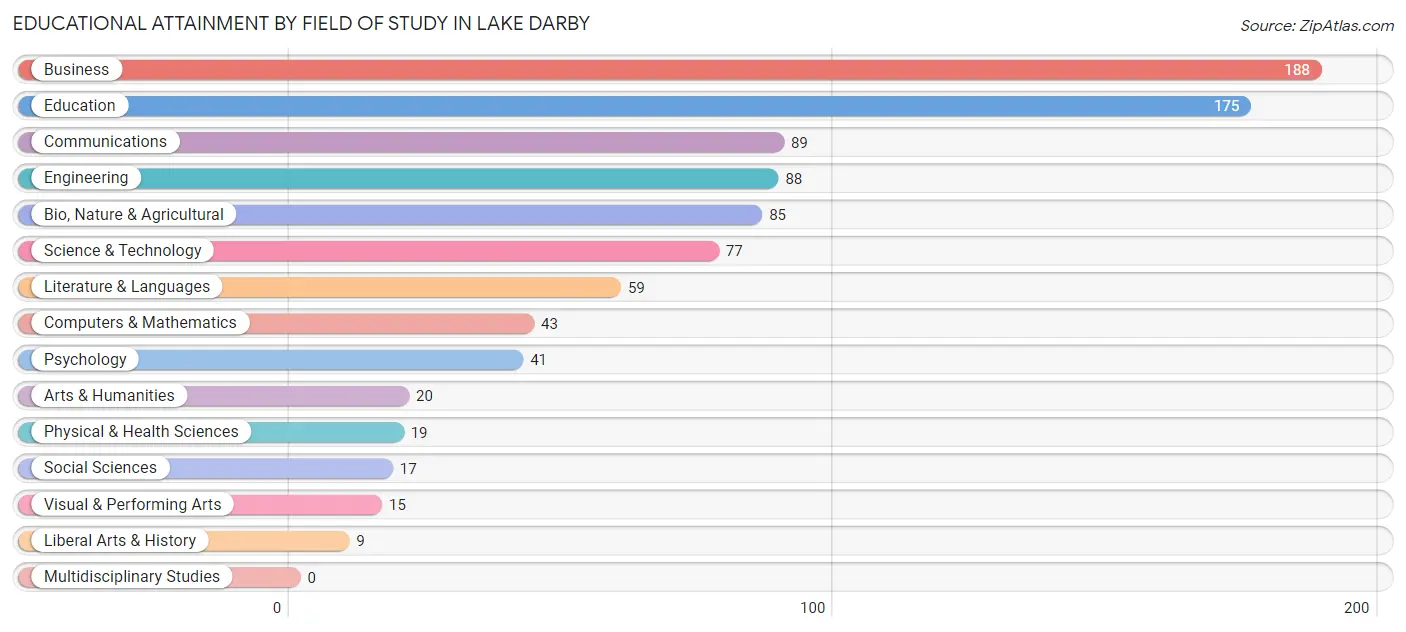
| Field of Study | # Graduates | % Graduates |
| Computers & Mathematics | 43 | 4.6% |
| Bio, Nature & Agricultural | 85 | 9.2% |
| Physical & Health Sciences | 19 | 2.1% |
| Psychology | 41 | 4.4% |
| Social Sciences | 17 | 1.8% |
| Engineering | 88 | 9.5% |
| Multidisciplinary Studies | 0 | 0.0% |
| Science & Technology | 77 | 8.3% |
| Business | 188 | 20.3% |
| Education | 175 | 18.9% |
| Literature & Languages | 59 | 6.4% |
| Liberal Arts & History | 9 | 1.0% |
| Visual & Performing Arts | 15 | 1.6% |
| Communications | 89 | 9.6% |
| Arts & Humanities | 20 | 2.2% |
| Total | 925 | 100.0% |
Transportation & Commute in Lake Darby
Vehicle Availability by Sex in Lake Darby
The most prevalent vehicle ownership categories in Lake Darby are males with 2 vehicles (517, accounting for 38.1%) and females with 2 vehicles (423, making up 43.4%).
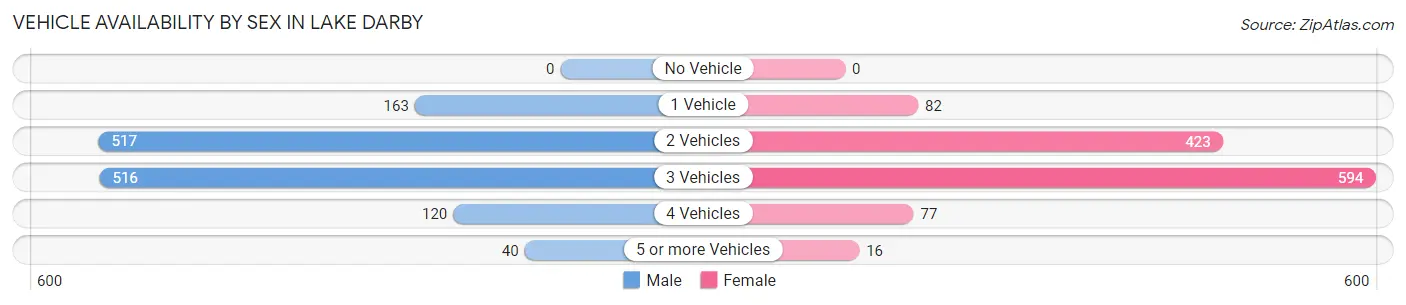
| Vehicles Available | Male | Female |
| No Vehicle | 0 (0.0%) | 0 (0.0%) |
| 1 Vehicle | 163 (12.0%) | 82 (6.9%) |
| 2 Vehicles | 517 (38.1%) | 423 (35.5%) |
| 3 Vehicles | 516 (38.1%) | 594 (49.8%) |
| 4 Vehicles | 120 (8.8%) | 77 (6.5%) |
| 5 or more Vehicles | 40 (2.9%) | 16 (1.3%) |
| Total | 1,356 (100.0%) | 1,192 (100.0%) |
Commute Time in Lake Darby
The most frequently occuring commute durations in Lake Darby are 30 to 34 minutes (460 commuters, 19.9%), 20 to 24 minutes (387 commuters, 16.8%), and 5 to 9 minutes (276 commuters, 12.0%).
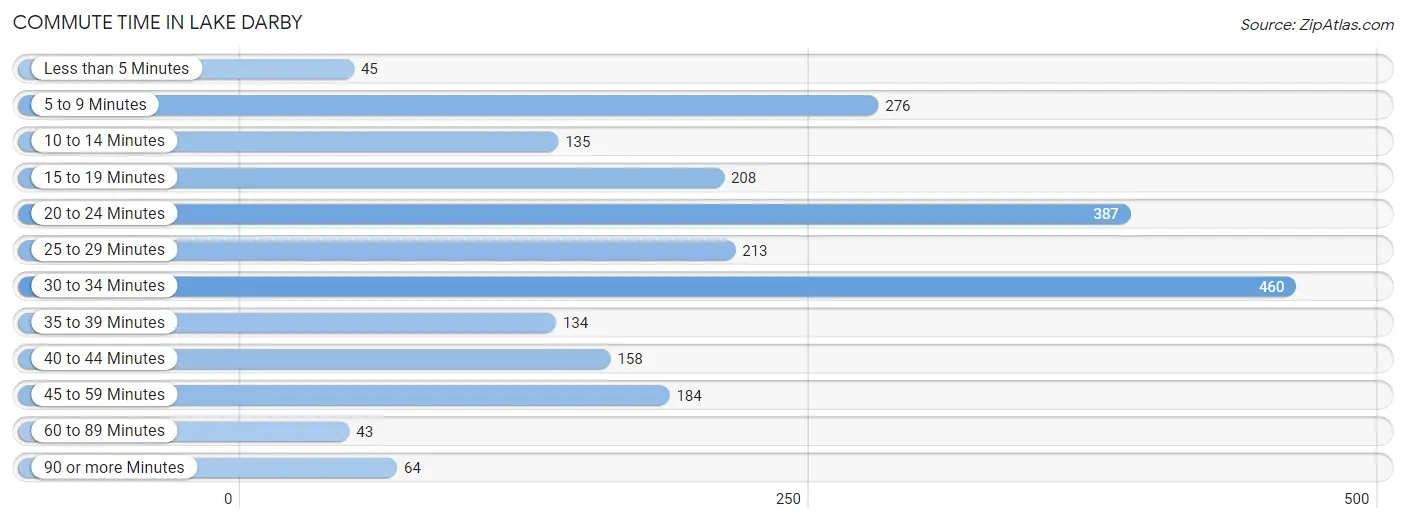
| Commute Time | # Commuters | % Commuters |
| Less than 5 Minutes | 45 | 1.9% |
| 5 to 9 Minutes | 276 | 12.0% |
| 10 to 14 Minutes | 135 | 5.9% |
| 15 to 19 Minutes | 208 | 9.0% |
| 20 to 24 Minutes | 387 | 16.8% |
| 25 to 29 Minutes | 213 | 9.2% |
| 30 to 34 Minutes | 460 | 19.9% |
| 35 to 39 Minutes | 134 | 5.8% |
| 40 to 44 Minutes | 158 | 6.9% |
| 45 to 59 Minutes | 184 | 8.0% |
| 60 to 89 Minutes | 43 | 1.9% |
| 90 or more Minutes | 64 | 2.8% |
Commute Time by Sex in Lake Darby
The most common commute times in Lake Darby are 30 to 34 minutes (317 commuters, 25.3%) for males and 5 to 9 minutes (250 commuters, 23.7%) for females.
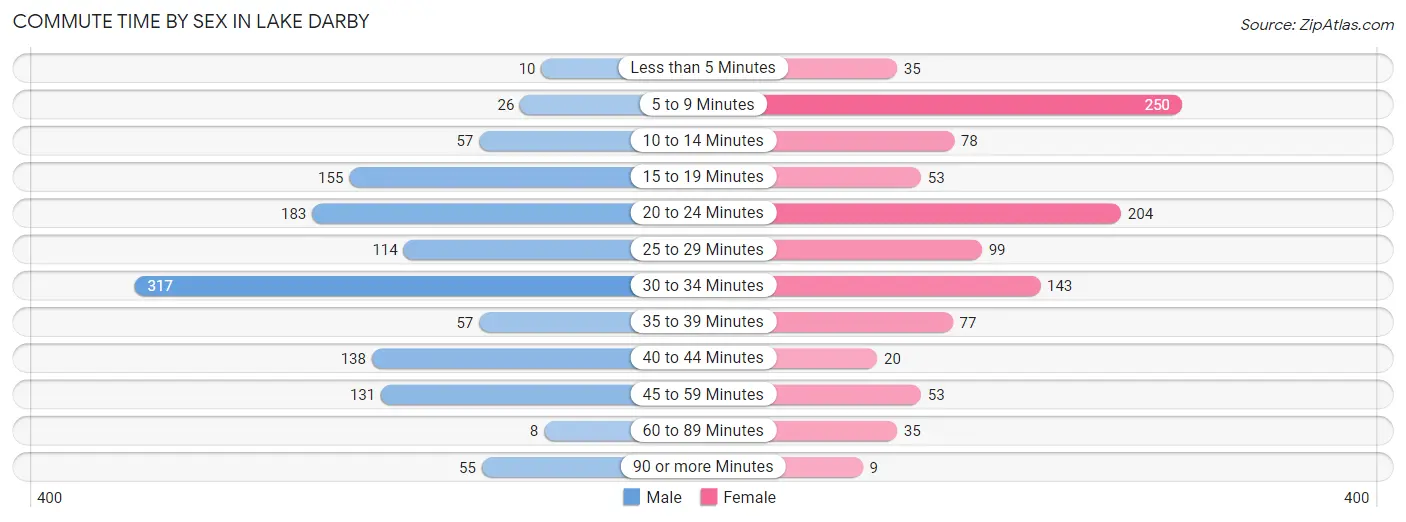
| Commute Time | Male | Female |
| Less than 5 Minutes | 10 (0.8%) | 35 (3.3%) |
| 5 to 9 Minutes | 26 (2.1%) | 250 (23.7%) |
| 10 to 14 Minutes | 57 (4.6%) | 78 (7.4%) |
| 15 to 19 Minutes | 155 (12.4%) | 53 (5.0%) |
| 20 to 24 Minutes | 183 (14.6%) | 204 (19.3%) |
| 25 to 29 Minutes | 114 (9.1%) | 99 (9.4%) |
| 30 to 34 Minutes | 317 (25.3%) | 143 (13.5%) |
| 35 to 39 Minutes | 57 (4.6%) | 77 (7.3%) |
| 40 to 44 Minutes | 138 (11.0%) | 20 (1.9%) |
| 45 to 59 Minutes | 131 (10.5%) | 53 (5.0%) |
| 60 to 89 Minutes | 8 (0.6%) | 35 (3.3%) |
| 90 or more Minutes | 55 (4.4%) | 9 (0.9%) |
Time of Departure to Work by Sex in Lake Darby
The most frequent times of departure to work in Lake Darby are 6:30 AM to 6:59 AM (263, 21.0%) for males and 5:00 AM to 5:29 AM (261, 24.7%) for females.
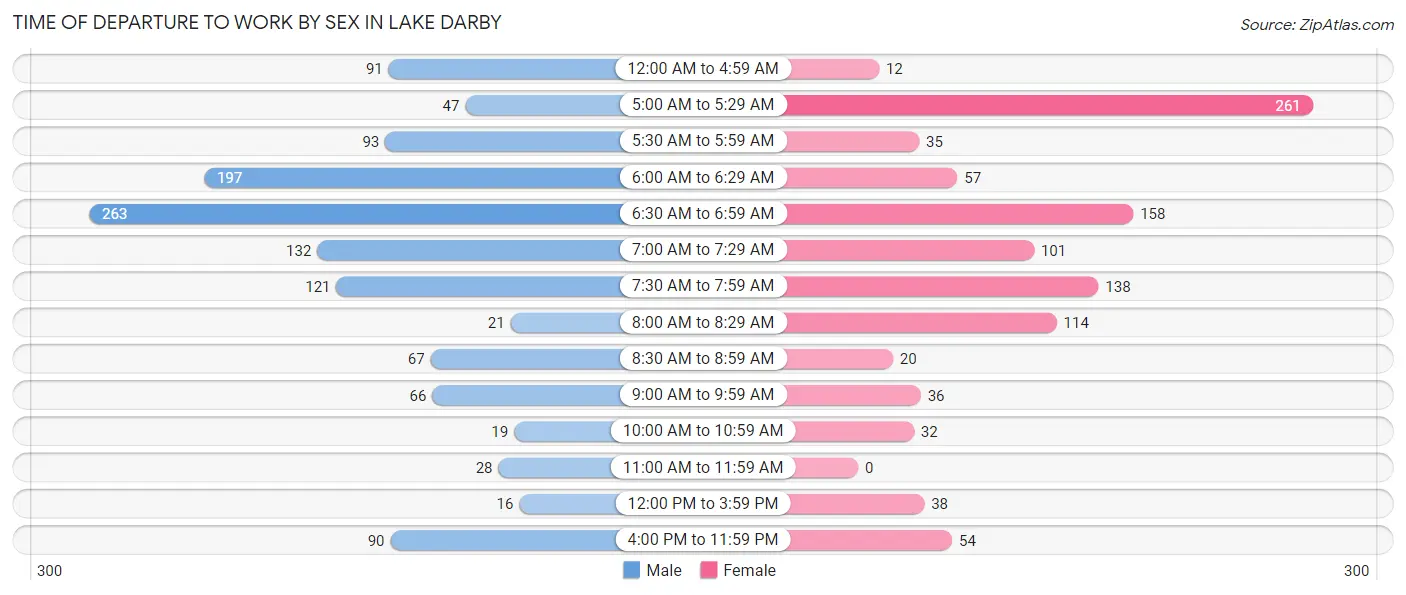
| Time of Departure | Male | Female |
| 12:00 AM to 4:59 AM | 91 (7.3%) | 12 (1.1%) |
| 5:00 AM to 5:29 AM | 47 (3.8%) | 261 (24.7%) |
| 5:30 AM to 5:59 AM | 93 (7.4%) | 35 (3.3%) |
| 6:00 AM to 6:29 AM | 197 (15.8%) | 57 (5.4%) |
| 6:30 AM to 6:59 AM | 263 (21.0%) | 158 (15.0%) |
| 7:00 AM to 7:29 AM | 132 (10.5%) | 101 (9.6%) |
| 7:30 AM to 7:59 AM | 121 (9.7%) | 138 (13.1%) |
| 8:00 AM to 8:29 AM | 21 (1.7%) | 114 (10.8%) |
| 8:30 AM to 8:59 AM | 67 (5.4%) | 20 (1.9%) |
| 9:00 AM to 9:59 AM | 66 (5.3%) | 36 (3.4%) |
| 10:00 AM to 10:59 AM | 19 (1.5%) | 32 (3.0%) |
| 11:00 AM to 11:59 AM | 28 (2.2%) | 0 (0.0%) |
| 12:00 PM to 3:59 PM | 16 (1.3%) | 38 (3.6%) |
| 4:00 PM to 11:59 PM | 90 (7.2%) | 54 (5.1%) |
| Total | 1,251 (100.0%) | 1,056 (100.0%) |
Housing Occupancy in Lake Darby
Occupancy by Ownership in Lake Darby
Of the total 1,671 dwellings in Lake Darby, owner-occupied units account for 1,585 (94.9%), while renter-occupied units make up 86 (5.1%).
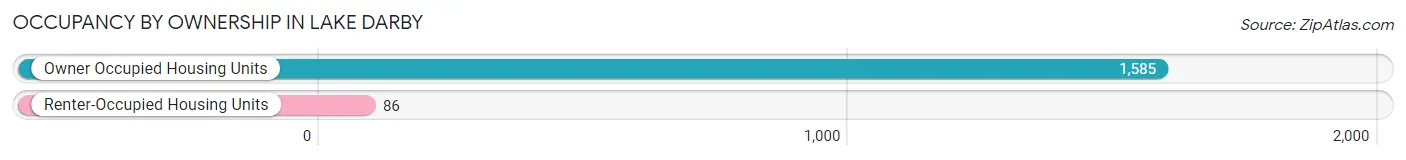
| Occupancy | # Housing Units | % Housing Units |
| Owner Occupied Housing Units | 1,585 | 94.9% |
| Renter-Occupied Housing Units | 86 | 5.1% |
| Total Occupied Housing Units | 1,671 | 100.0% |
Occupancy by Household Size in Lake Darby
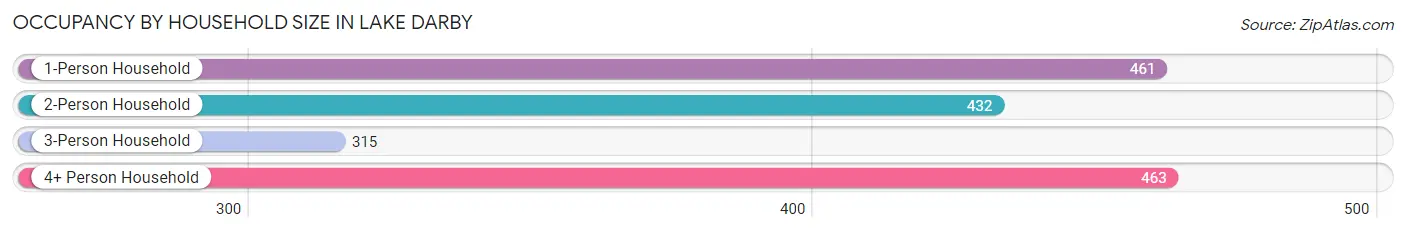
| Household Size | # Housing Units | % Housing Units |
| 1-Person Household | 461 | 27.6% |
| 2-Person Household | 432 | 25.9% |
| 3-Person Household | 315 | 18.9% |
| 4+ Person Household | 463 | 27.7% |
| Total Housing Units | 1,671 | 100.0% |
Occupancy by Ownership by Household Size in Lake Darby
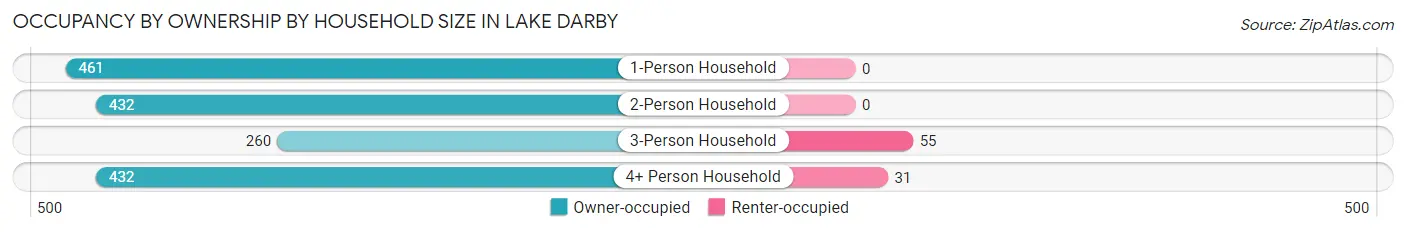
| Household Size | Owner-occupied | Renter-occupied |
| 1-Person Household | 461 (100.0%) | 0 (0.0%) |
| 2-Person Household | 432 (100.0%) | 0 (0.0%) |
| 3-Person Household | 260 (82.5%) | 55 (17.5%) |
| 4+ Person Household | 432 (93.3%) | 31 (6.7%) |
| Total Housing Units | 1,585 (94.9%) | 86 (5.1%) |
Occupancy by Educational Attainment in Lake Darby
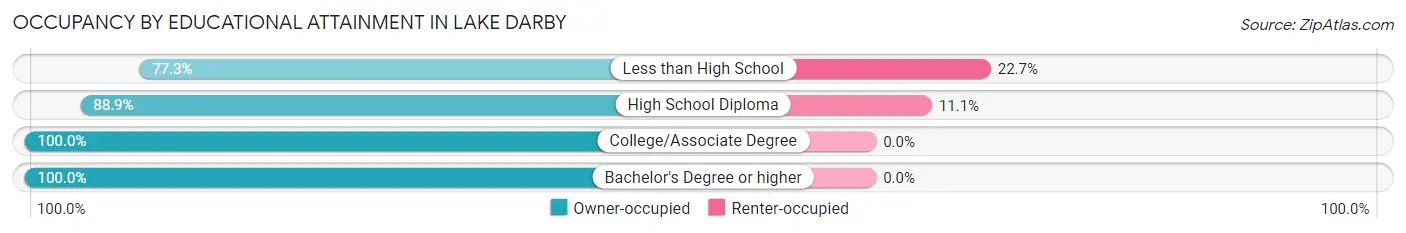
| Household Size | Owner-occupied | Renter-occupied |
| Less than High School | 34 (77.3%) | 10 (22.7%) |
| High School Diploma | 611 (88.9%) | 76 (11.1%) |
| College/Associate Degree | 410 (100.0%) | 0 (0.0%) |
| Bachelor's Degree or higher | 530 (100.0%) | 0 (0.0%) |
Occupancy by Age of Householder in Lake Darby
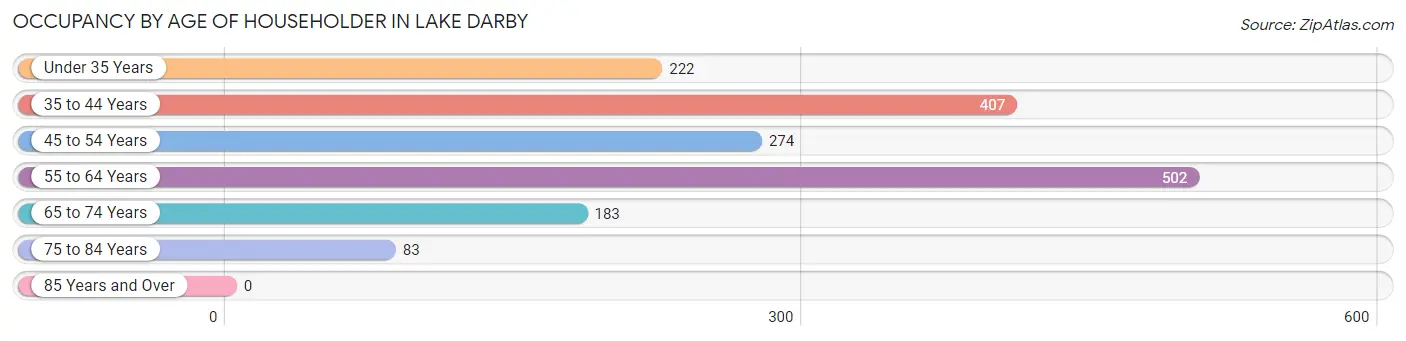
| Age Bracket | # Households | % Households |
| Under 35 Years | 222 | 13.3% |
| 35 to 44 Years | 407 | 24.4% |
| 45 to 54 Years | 274 | 16.4% |
| 55 to 64 Years | 502 | 30.0% |
| 65 to 74 Years | 183 | 11.0% |
| 75 to 84 Years | 83 | 5.0% |
| 85 Years and Over | 0 | 0.0% |
| Total | 1,671 | 100.0% |
Housing Finances in Lake Darby
Median Income by Occupancy in Lake Darby
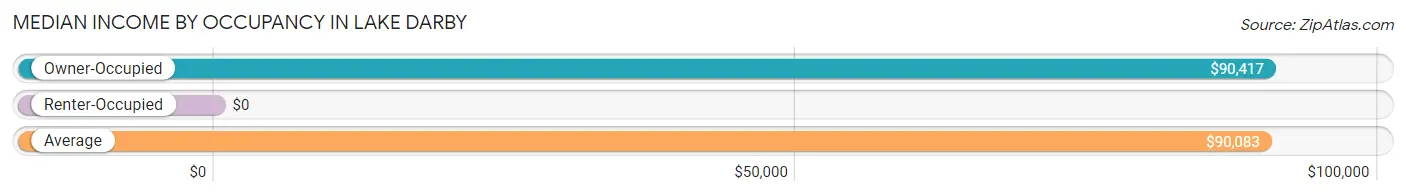
| Occupancy Type | # Households | Median Income |
| Owner-Occupied | 1,585 (94.9%) | $90,417 |
| Renter-Occupied | 86 (5.1%) | $0 |
| Average | 1,671 (100.0%) | $90,083 |
Occupancy by Householder Income Bracket in Lake Darby
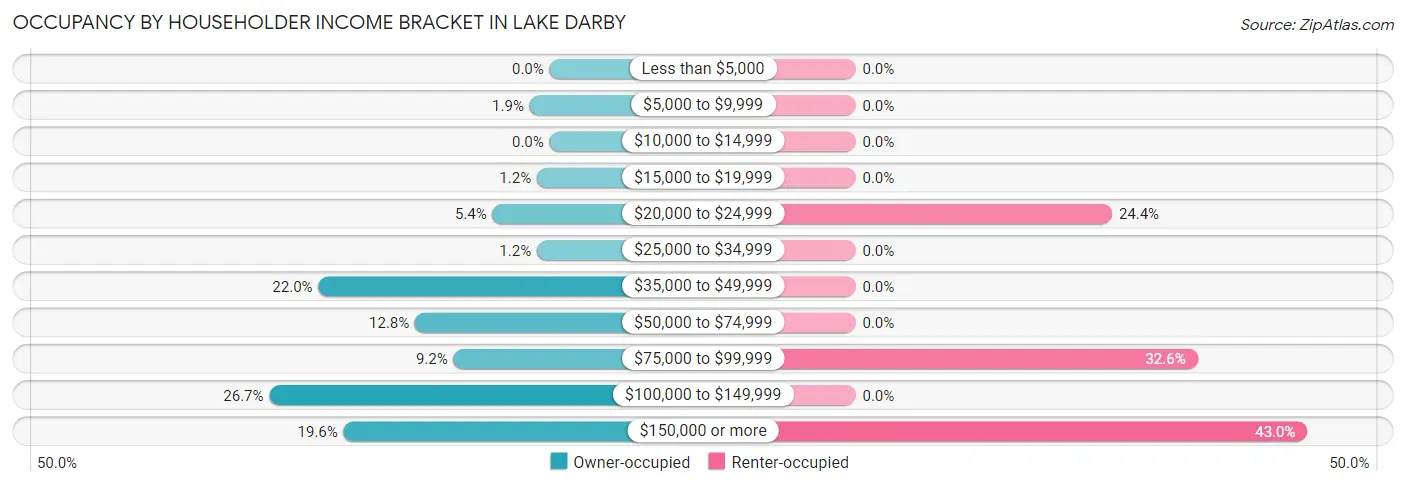
| Income Bracket | Owner-occupied | Renter-occupied |
| Less than $5,000 | 0 (0.0%) | 0 (0.0%) |
| $5,000 to $9,999 | 30 (1.9%) | 0 (0.0%) |
| $10,000 to $14,999 | 0 (0.0%) | 0 (0.0%) |
| $15,000 to $19,999 | 19 (1.2%) | 0 (0.0%) |
| $20,000 to $24,999 | 86 (5.4%) | 21 (24.4%) |
| $25,000 to $34,999 | 19 (1.2%) | 0 (0.0%) |
| $35,000 to $49,999 | 349 (22.0%) | 0 (0.0%) |
| $50,000 to $74,999 | 203 (12.8%) | 0 (0.0%) |
| $75,000 to $99,999 | 145 (9.1%) | 28 (32.6%) |
| $100,000 to $149,999 | 423 (26.7%) | 0 (0.0%) |
| $150,000 or more | 311 (19.6%) | 37 (43.0%) |
| Total | 1,585 (100.0%) | 86 (100.0%) |
Monthly Housing Cost Tiers in Lake Darby
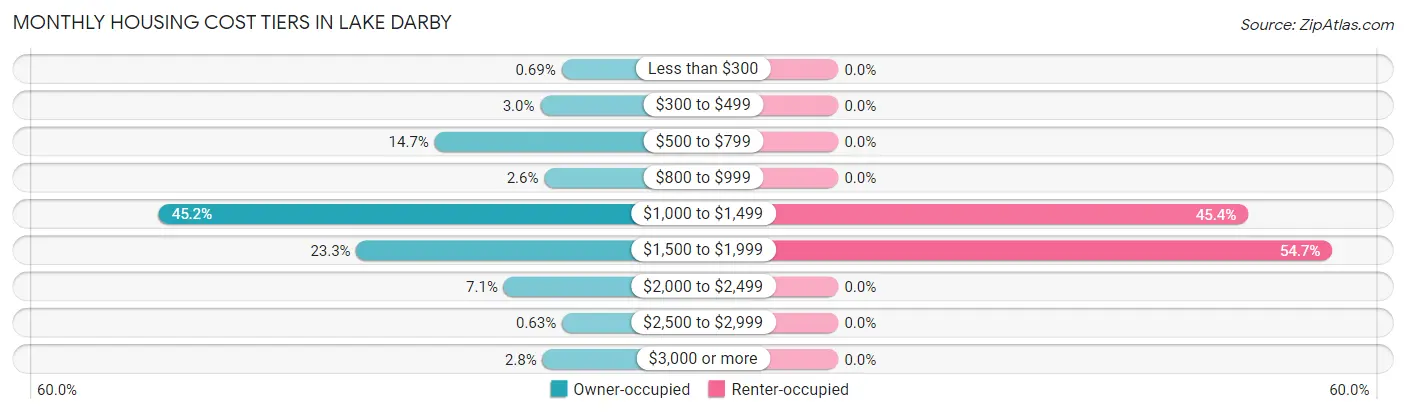
| Monthly Cost | Owner-occupied | Renter-occupied |
| Less than $300 | 11 (0.7%) | 0 (0.0%) |
| $300 to $499 | 48 (3.0%) | 0 (0.0%) |
| $500 to $799 | 233 (14.7%) | 0 (0.0%) |
| $800 to $999 | 41 (2.6%) | 0 (0.0%) |
| $1,000 to $1,499 | 716 (45.2%) | 39 (45.4%) |
| $1,500 to $1,999 | 370 (23.3%) | 47 (54.6%) |
| $2,000 to $2,499 | 112 (7.1%) | 0 (0.0%) |
| $2,500 to $2,999 | 10 (0.6%) | 0 (0.0%) |
| $3,000 or more | 44 (2.8%) | 0 (0.0%) |
| Total | 1,585 (100.0%) | 86 (100.0%) |
Physical Housing Characteristics in Lake Darby
Housing Structures in Lake Darby
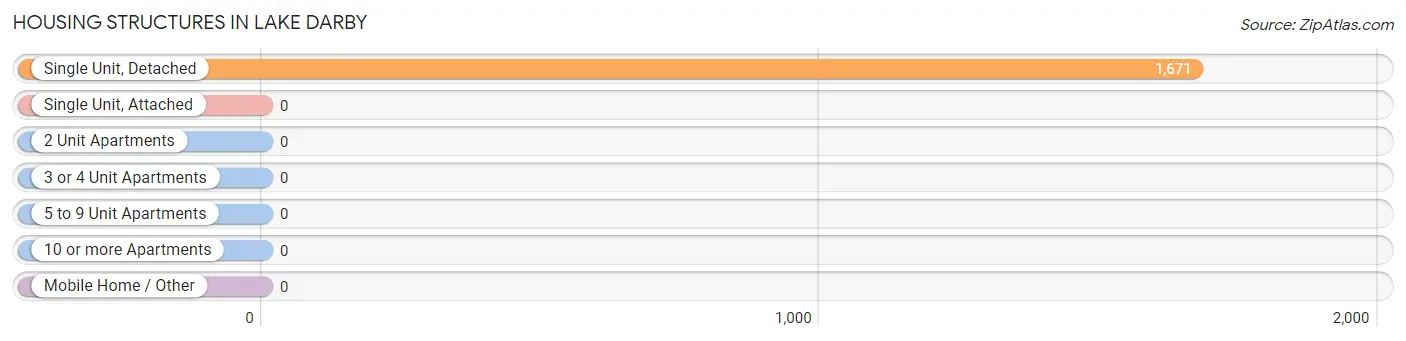
| Structure Type | # Housing Units | % Housing Units |
| Single Unit, Detached | 1,671 | 100.0% |
| Single Unit, Attached | 0 | 0.0% |
| 2 Unit Apartments | 0 | 0.0% |
| 3 or 4 Unit Apartments | 0 | 0.0% |
| 5 to 9 Unit Apartments | 0 | 0.0% |
| 10 or more Apartments | 0 | 0.0% |
| Mobile Home / Other | 0 | 0.0% |
| Total | 1,671 | 100.0% |
Housing Structures by Occupancy in Lake Darby
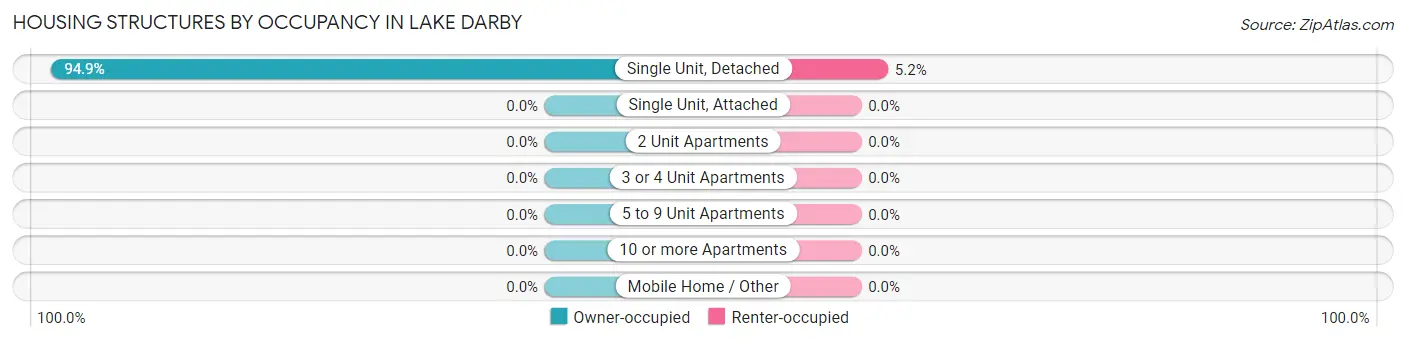
| Structure Type | Owner-occupied | Renter-occupied |
| Single Unit, Detached | 1,585 (94.9%) | 86 (5.1%) |
| Single Unit, Attached | 0 (0.0%) | 0 (0.0%) |
| 2 Unit Apartments | 0 (0.0%) | 0 (0.0%) |
| 3 or 4 Unit Apartments | 0 (0.0%) | 0 (0.0%) |
| 5 to 9 Unit Apartments | 0 (0.0%) | 0 (0.0%) |
| 10 or more Apartments | 0 (0.0%) | 0 (0.0%) |
| Mobile Home / Other | 0 (0.0%) | 0 (0.0%) |
| Total | 1,585 (94.9%) | 86 (5.1%) |
Housing Structures by Number of Rooms in Lake Darby
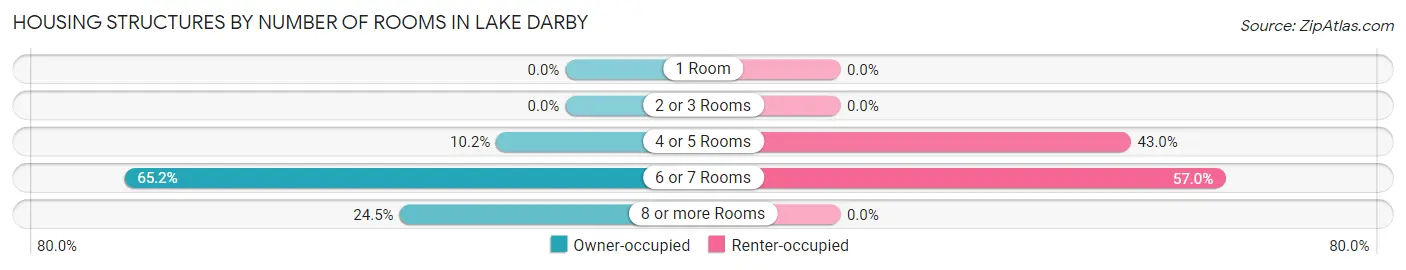
| Number of Rooms | Owner-occupied | Renter-occupied |
| 1 Room | 0 (0.0%) | 0 (0.0%) |
| 2 or 3 Rooms | 0 (0.0%) | 0 (0.0%) |
| 4 or 5 Rooms | 162 (10.2%) | 37 (43.0%) |
| 6 or 7 Rooms | 1,034 (65.2%) | 49 (57.0%) |
| 8 or more Rooms | 389 (24.5%) | 0 (0.0%) |
| Total | 1,585 (100.0%) | 86 (100.0%) |
Housing Structure by Heating Type in Lake Darby
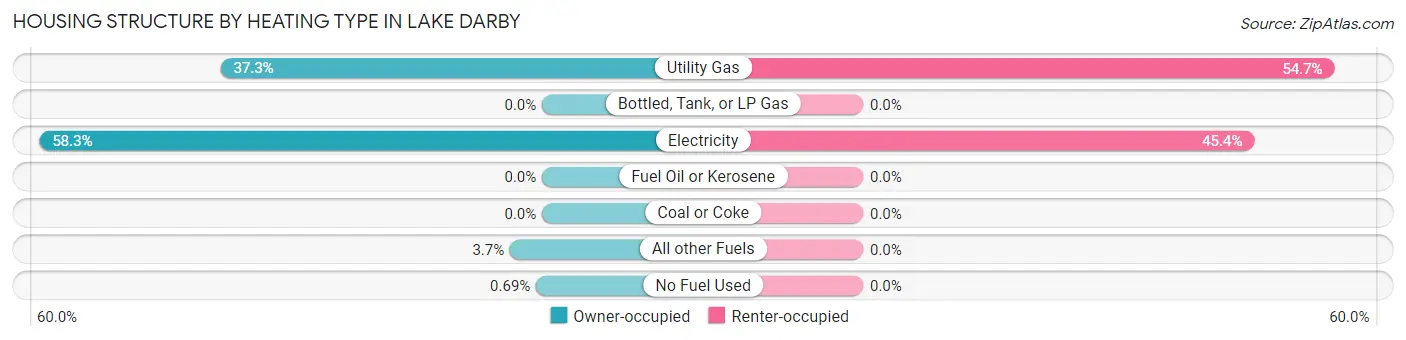
| Heating Type | Owner-occupied | Renter-occupied |
| Utility Gas | 591 (37.3%) | 47 (54.6%) |
| Bottled, Tank, or LP Gas | 0 (0.0%) | 0 (0.0%) |
| Electricity | 924 (58.3%) | 39 (45.4%) |
| Fuel Oil or Kerosene | 0 (0.0%) | 0 (0.0%) |
| Coal or Coke | 0 (0.0%) | 0 (0.0%) |
| All other Fuels | 59 (3.7%) | 0 (0.0%) |
| No Fuel Used | 11 (0.7%) | 0 (0.0%) |
| Total | 1,585 (100.0%) | 86 (100.0%) |
Household Vehicle Usage in Lake Darby
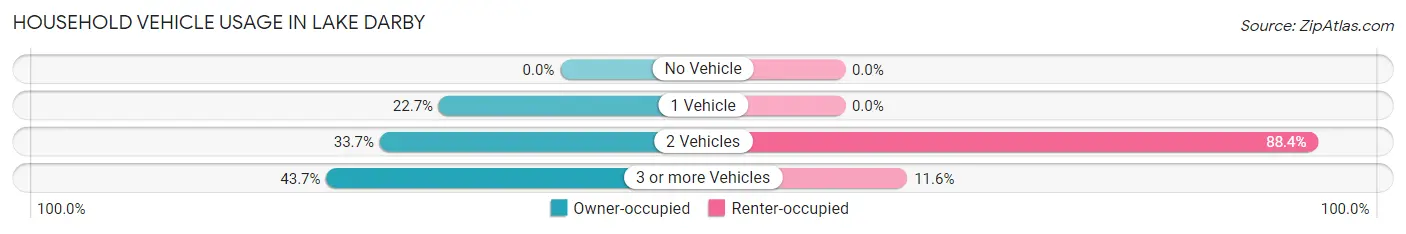
| Vehicles per Household | Owner-occupied | Renter-occupied |
| No Vehicle | 0 (0.0%) | 0 (0.0%) |
| 1 Vehicle | 359 (22.7%) | 0 (0.0%) |
| 2 Vehicles | 534 (33.7%) | 76 (88.4%) |
| 3 or more Vehicles | 692 (43.7%) | 10 (11.6%) |
| Total | 1,585 (100.0%) | 86 (100.0%) |
Real Estate & Mortgages in Lake Darby
Real Estate and Mortgage Overview in Lake Darby
| Characteristic | Without Mortgage | With Mortgage |
| Housing Units | 603 | 982 |
| Median Property Value | $206,300 | $206,700 |
| Median Household Income | $39,655 | $276 |
| Monthly Housing Costs | $881 | $44 |
| Real Estate Taxes | $5,320 | $13 |
Property Value by Mortgage Status in Lake Darby
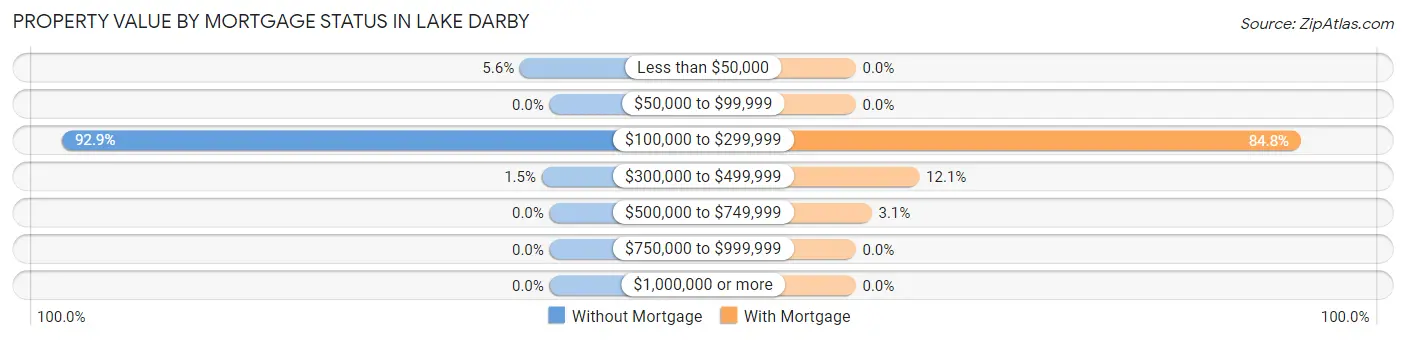
| Property Value | Without Mortgage | With Mortgage |
| Less than $50,000 | 34 (5.6%) | 0 (0.0%) |
| $50,000 to $99,999 | 0 (0.0%) | 0 (0.0%) |
| $100,000 to $299,999 | 560 (92.9%) | 833 (84.8%) |
| $300,000 to $499,999 | 9 (1.5%) | 119 (12.1%) |
| $500,000 to $749,999 | 0 (0.0%) | 30 (3.0%) |
| $750,000 to $999,999 | 0 (0.0%) | 0 (0.0%) |
| $1,000,000 or more | 0 (0.0%) | 0 (0.0%) |
| Total | 603 (100.0%) | 982 (100.0%) |
Household Income by Mortgage Status in Lake Darby
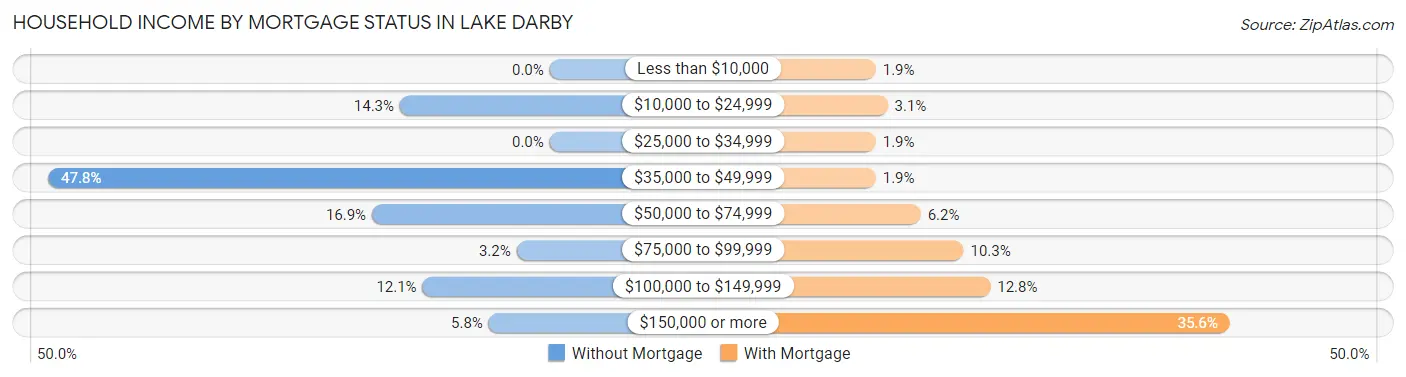
| Household Income | Without Mortgage | With Mortgage |
| Less than $10,000 | 0 (0.0%) | 19 (1.9%) |
| $10,000 to $24,999 | 86 (14.3%) | 30 (3.0%) |
| $25,000 to $34,999 | 0 (0.0%) | 19 (1.9%) |
| $35,000 to $49,999 | 288 (47.8%) | 19 (1.9%) |
| $50,000 to $74,999 | 102 (16.9%) | 61 (6.2%) |
| $75,000 to $99,999 | 19 (3.2%) | 101 (10.3%) |
| $100,000 to $149,999 | 73 (12.1%) | 126 (12.8%) |
| $150,000 or more | 35 (5.8%) | 350 (35.6%) |
| Total | 603 (100.0%) | 982 (100.0%) |
Property Value to Household Income Ratio in Lake Darby
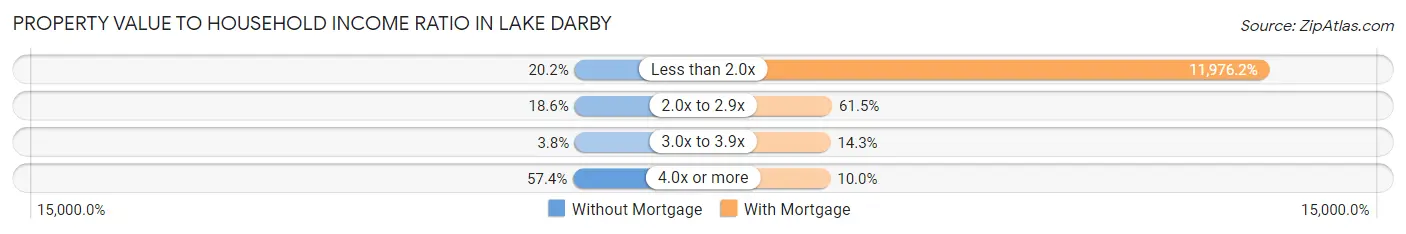
| Value-to-Income Ratio | Without Mortgage | With Mortgage |
| Less than 2.0x | 122 (20.2%) | 117,606 (11,976.2%) |
| 2.0x to 2.9x | 112 (18.6%) | 604 (61.5%) |
| 3.0x to 3.9x | 23 (3.8%) | 140 (14.3%) |
| 4.0x or more | 346 (57.4%) | 98 (10.0%) |
| Total | 603 (100.0%) | 982 (100.0%) |
Real Estate Taxes by Mortgage Status in Lake Darby
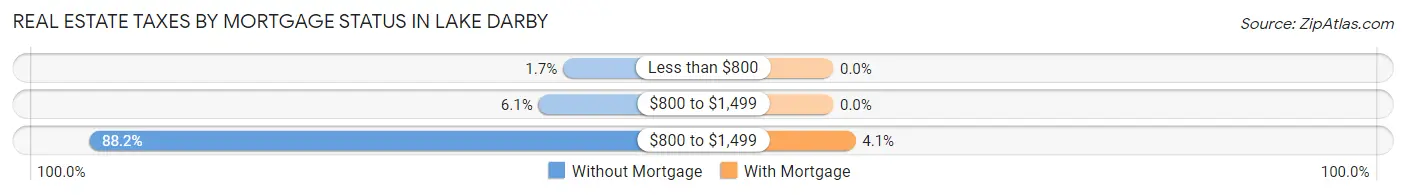
| Property Taxes | Without Mortgage | With Mortgage |
| Less than $800 | 10 (1.7%) | 0 (0.0%) |
| $800 to $1,499 | 37 (6.1%) | 0 (0.0%) |
| $800 to $1,499 | 532 (88.2%) | 40 (4.1%) |
| Total | 603 (100.0%) | 982 (100.0%) |
Health & Disability in Lake Darby
Health Insurance Coverage by Age in Lake Darby
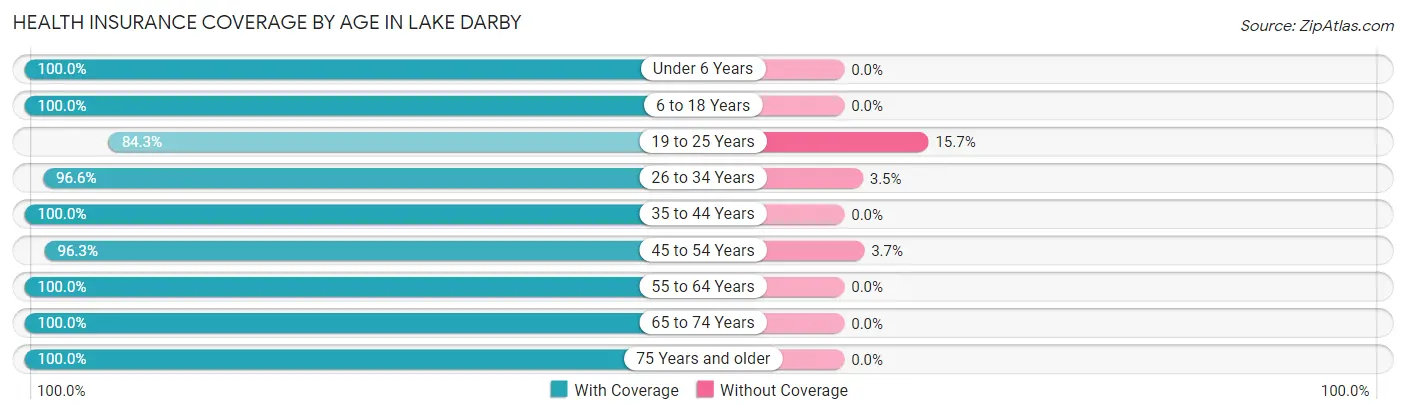
| Age Bracket | With Coverage | Without Coverage |
| Under 6 Years | 403 (100.0%) | 0 (0.0%) |
| 6 to 18 Years | 855 (100.0%) | 0 (0.0%) |
| 19 to 25 Years | 145 (84.3%) | 27 (15.7%) |
| 26 to 34 Years | 587 (96.6%) | 21 (3.5%) |
| 35 to 44 Years | 894 (100.0%) | 0 (0.0%) |
| 45 to 54 Years | 492 (96.3%) | 19 (3.7%) |
| 55 to 64 Years | 702 (100.0%) | 0 (0.0%) |
| 65 to 74 Years | 312 (100.0%) | 0 (0.0%) |
| 75 Years and older | 105 (100.0%) | 0 (0.0%) |
| Total | 4,495 (98.5%) | 67 (1.5%) |
Health Insurance Coverage by Citizenship Status in Lake Darby
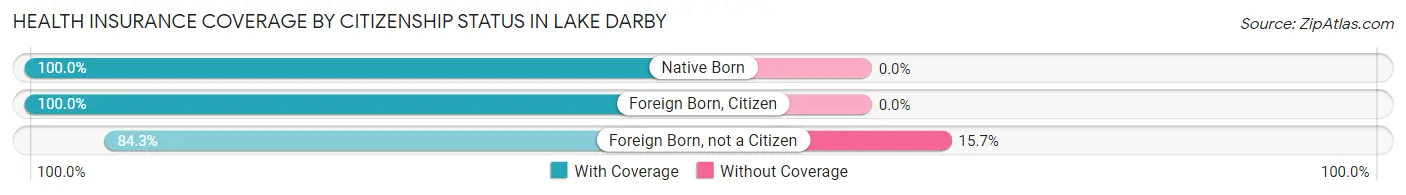
| Citizenship Status | With Coverage | Without Coverage |
| Native Born | 403 (100.0%) | 0 (0.0%) |
| Foreign Born, Citizen | 855 (100.0%) | 0 (0.0%) |
| Foreign Born, not a Citizen | 145 (84.3%) | 27 (15.7%) |
Health Insurance Coverage by Household Income in Lake Darby
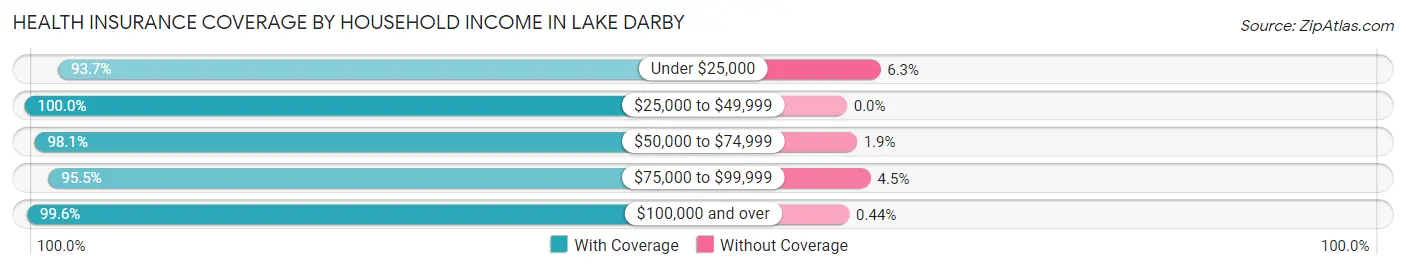
| Household Income | With Coverage | Without Coverage |
| Under $25,000 | 284 (93.7%) | 19 (6.3%) |
| $25,000 to $49,999 | 420 (100.0%) | 0 (0.0%) |
| $50,000 to $74,999 | 475 (98.1%) | 9 (1.9%) |
| $75,000 to $99,999 | 577 (95.5%) | 27 (4.5%) |
| $100,000 and over | 2,739 (99.6%) | 12 (0.4%) |
Public vs Private Health Insurance Coverage by Age in Lake Darby
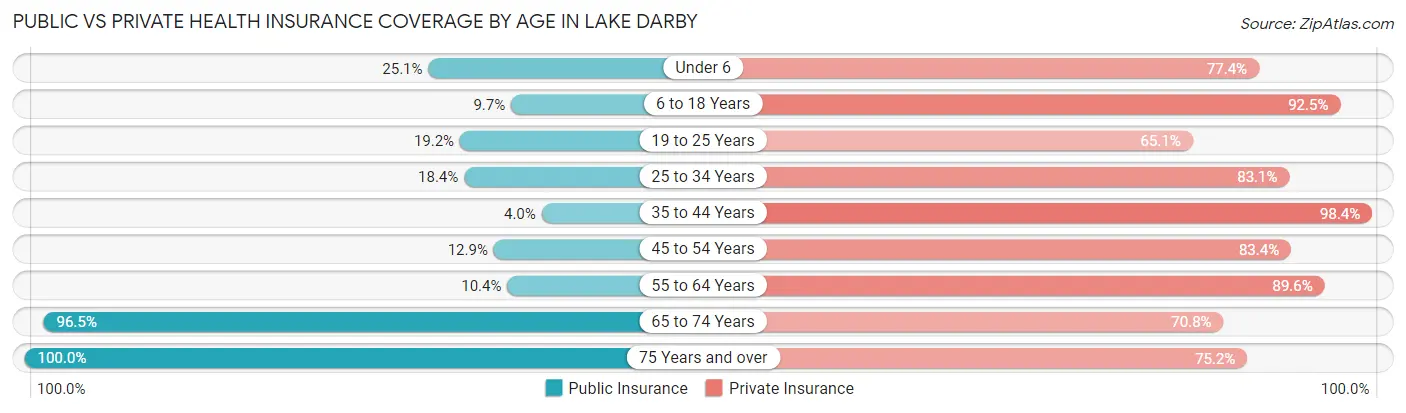
| Age Bracket | Public Insurance | Private Insurance |
| Under 6 | 101 (25.1%) | 312 (77.4%) |
| 6 to 18 Years | 83 (9.7%) | 791 (92.5%) |
| 19 to 25 Years | 33 (19.2%) | 112 (65.1%) |
| 25 to 34 Years | 112 (18.4%) | 505 (83.1%) |
| 35 to 44 Years | 36 (4.0%) | 880 (98.4%) |
| 45 to 54 Years | 66 (12.9%) | 426 (83.4%) |
| 55 to 64 Years | 73 (10.4%) | 629 (89.6%) |
| 65 to 74 Years | 301 (96.5%) | 221 (70.8%) |
| 75 Years and over | 105 (100.0%) | 79 (75.2%) |
| Total | 910 (20.0%) | 3,955 (86.7%) |
Disability Status by Sex by Age in Lake Darby
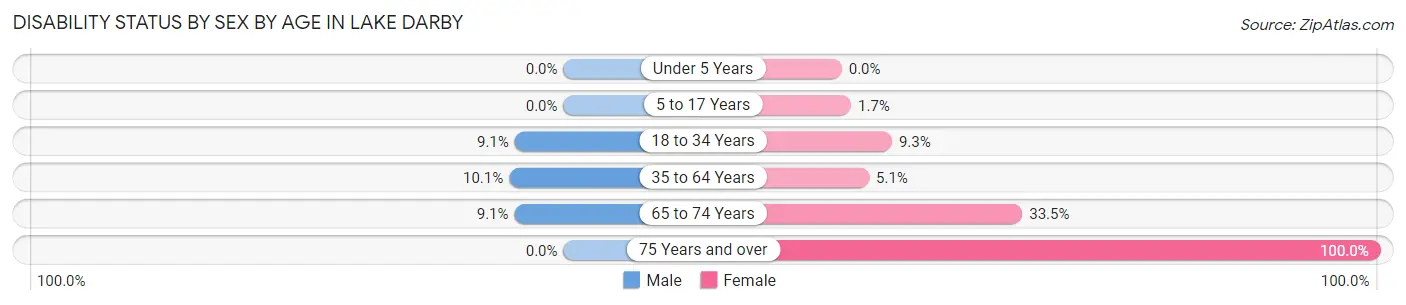
| Age Bracket | Male | Female |
| Under 5 Years | 0 (0.0%) | 0 (0.0%) |
| 5 to 17 Years | 0 (0.0%) | 9 (1.7%) |
| 18 to 34 Years | 41 (9.0%) | 38 (9.3%) |
| 35 to 64 Years | 99 (10.1%) | 57 (5.1%) |
| 65 to 74 Years | 11 (9.1%) | 64 (33.5%) |
| 75 Years and over | 0 (0.0%) | 13 (100.0%) |
Disability Class by Sex by Age in Lake Darby
Disability Class: Hearing Difficulty
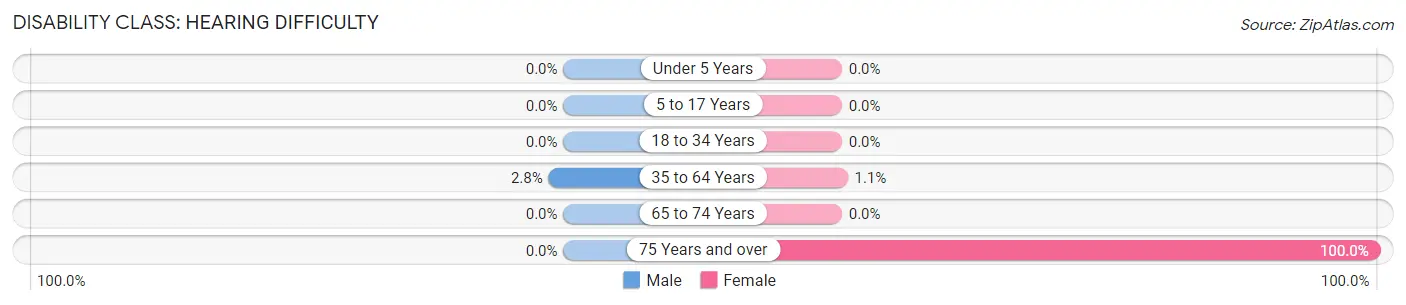
| Age Bracket | Male | Female |
| Under 5 Years | 0 (0.0%) | 0 (0.0%) |
| 5 to 17 Years | 0 (0.0%) | 0 (0.0%) |
| 18 to 34 Years | 0 (0.0%) | 0 (0.0%) |
| 35 to 64 Years | 27 (2.8%) | 12 (1.1%) |
| 65 to 74 Years | 0 (0.0%) | 0 (0.0%) |
| 75 Years and over | 0 (0.0%) | 13 (100.0%) |
Disability Class: Vision Difficulty
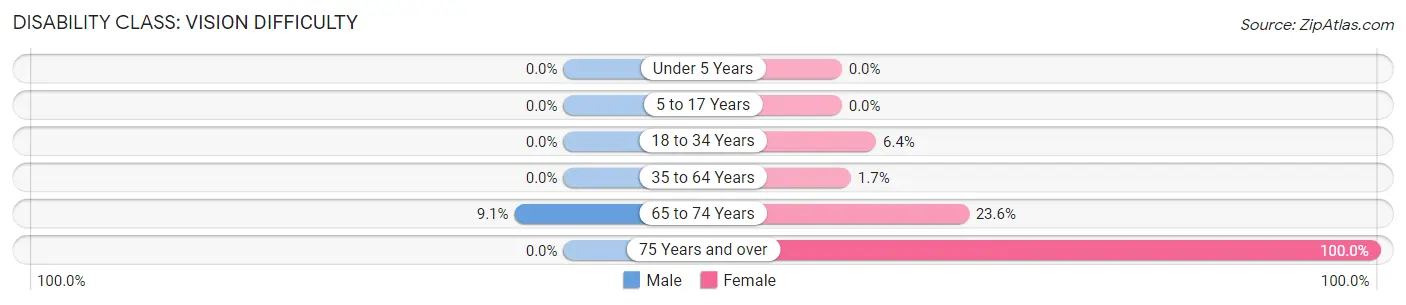
| Age Bracket | Male | Female |
| Under 5 Years | 0 (0.0%) | 0 (0.0%) |
| 5 to 17 Years | 0 (0.0%) | 0 (0.0%) |
| 18 to 34 Years | 0 (0.0%) | 26 (6.4%) |
| 35 to 64 Years | 0 (0.0%) | 19 (1.7%) |
| 65 to 74 Years | 11 (9.1%) | 45 (23.6%) |
| 75 Years and over | 0 (0.0%) | 13 (100.0%) |
Disability Class: Cognitive Difficulty
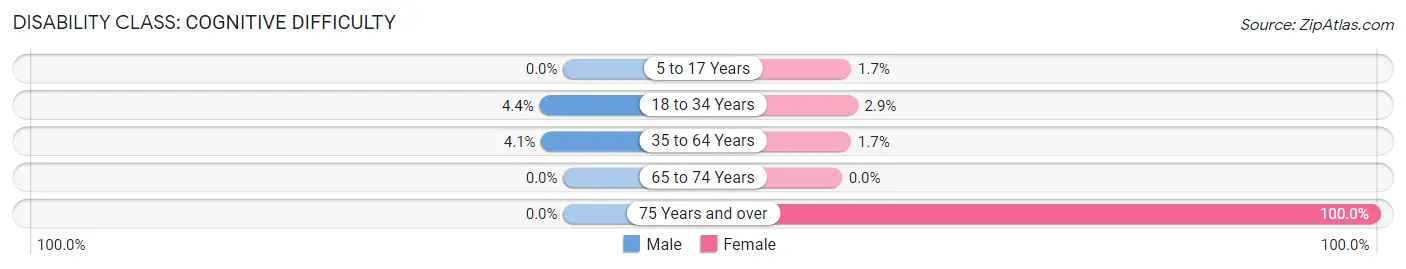
| Age Bracket | Male | Female |
| 5 to 17 Years | 0 (0.0%) | 9 (1.7%) |
| 18 to 34 Years | 20 (4.4%) | 12 (2.9%) |
| 35 to 64 Years | 40 (4.1%) | 19 (1.7%) |
| 65 to 74 Years | 0 (0.0%) | 0 (0.0%) |
| 75 Years and over | 0 (0.0%) | 13 (100.0%) |
Disability Class: Ambulatory Difficulty
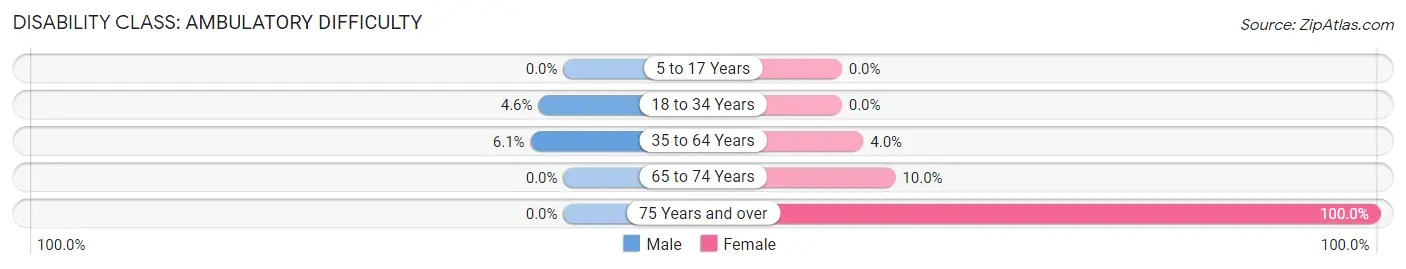
| Age Bracket | Male | Female |
| 5 to 17 Years | 0 (0.0%) | 0 (0.0%) |
| 18 to 34 Years | 21 (4.6%) | 0 (0.0%) |
| 35 to 64 Years | 60 (6.1%) | 45 (4.0%) |
| 65 to 74 Years | 0 (0.0%) | 19 (10.0%) |
| 75 Years and over | 0 (0.0%) | 13 (100.0%) |
Disability Class: Self-Care Difficulty
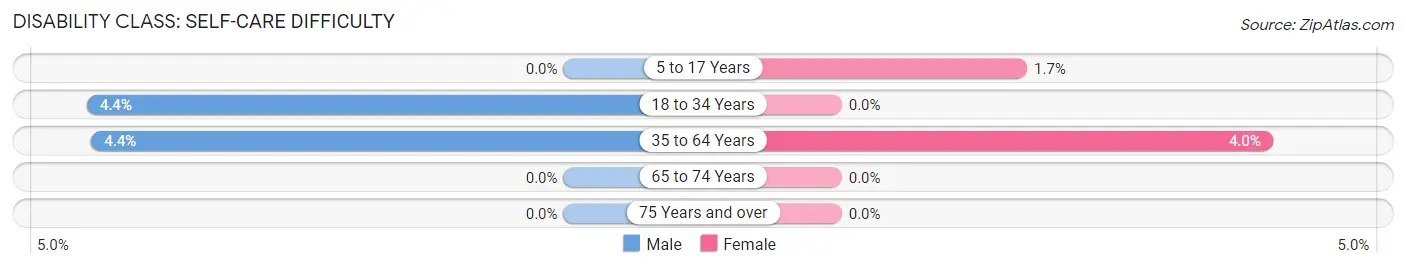
| Age Bracket | Male | Female |
| 5 to 17 Years | 0 (0.0%) | 9 (1.7%) |
| 18 to 34 Years | 20 (4.4%) | 0 (0.0%) |
| 35 to 64 Years | 43 (4.4%) | 45 (4.0%) |
| 65 to 74 Years | 0 (0.0%) | 0 (0.0%) |
| 75 Years and over | 0 (0.0%) | 0 (0.0%) |
Technology Access in Lake Darby
Computing Device Access in Lake Darby
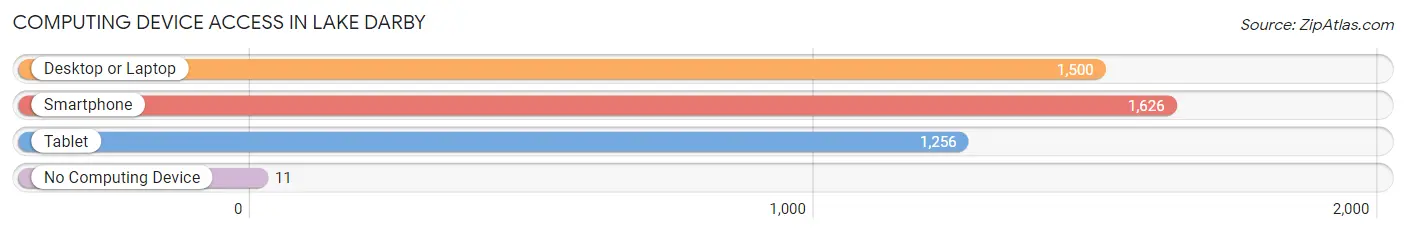
| Device Type | # Households | % Households |
| Desktop or Laptop | 1,500 | 89.8% |
| Smartphone | 1,626 | 97.3% |
| Tablet | 1,256 | 75.2% |
| No Computing Device | 11 | 0.7% |
| Total | 1,671 | 100.0% |
Internet Access in Lake Darby
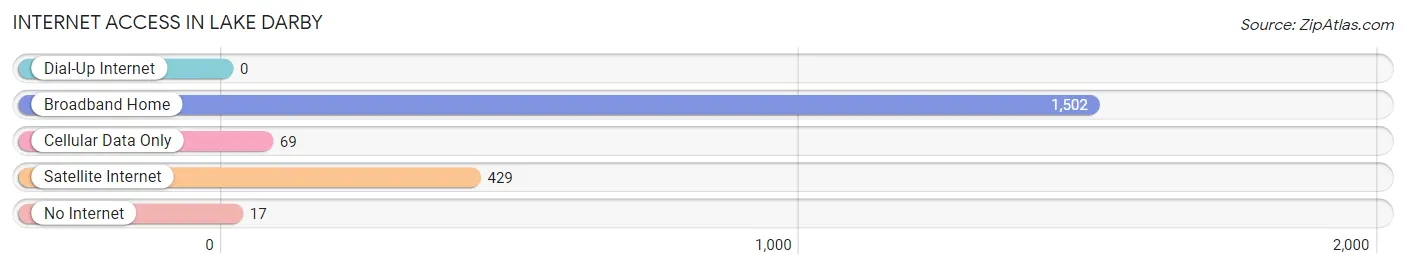
| Internet Type | # Households | % Households |
| Dial-Up Internet | 0 | 0.0% |
| Broadband Home | 1,502 | 89.9% |
| Cellular Data Only | 69 | 4.1% |
| Satellite Internet | 429 | 25.7% |
| No Internet | 17 | 1.0% |
| Total | 1,671 | 100.0% |
Lake Darby Summary
History
Lake Darby is a small unincorporated community located in Franklin County, Ohio. It is situated on the western edge of the city of Columbus, Ohio, and is part of the Columbus Metropolitan Statistical Area. The community was first settled in the early 1800s by a group of settlers from Pennsylvania. The settlers were attracted to the area due to its abundance of natural resources, including the nearby Darby Creek. The creek was named after the Darby family, who were among the first settlers in the area.
The community was originally known as Darbyville, but the name was changed to Lake Darby in the late 1800s when a man-made lake was created in the area. The lake was created to provide water for the local residents and to provide a recreational area for the community. The lake was also used to power a grist mill, which was built in the late 1800s.
The community of Lake Darby has remained relatively small and rural throughout its history. It is home to a few small businesses, including a general store, a post office, and a few restaurants. The community is also home to a small church, which was built in the late 1800s.
Geography
Lake Darby is located in Franklin County, Ohio, on the western edge of the city of Columbus. It is situated on the banks of Darby Creek, which is a tributary of the Scioto River. The community is located in a rural area, and is surrounded by farmland and wooded areas. The area is also home to several small lakes, including the man-made Lake Darby.
The climate in Lake Darby is typical of the Midwest, with hot summers and cold winters. The average temperature in the summer is around 75 degrees Fahrenheit, and the average temperature in the winter is around 30 degrees Fahrenheit. The area receives an average of 40 inches of precipitation per year.
Economy
The economy of Lake Darby is largely based on agriculture and tourism. The area is home to several small farms, which produce a variety of crops, including corn, soybeans, and wheat. The area is also home to several small businesses, including a general store, a post office, and a few restaurants.
The area is also a popular destination for tourists, due to its proximity to the city of Columbus. The area is home to several parks and recreational areas, including the man-made Lake Darby. The lake is a popular destination for fishing, boating, and swimming.
Demographics
As of the 2010 census, the population of Lake Darby was 1,845. The population is largely white, with a small percentage of African Americans and Hispanics. The median household income in the area is $50,000, and the median home value is $150,000. The area is largely rural, with a few small businesses and a few restaurants. The area is served by the Columbus City School District.
Common Questions
What is Per Capita Income in Lake Darby?
Per Capita income in Lake Darby is $39,675.
What is the Median Family Income in Lake Darby?
Median Family Income in Lake Darby is $117,177.
What is the Median Household income in Lake Darby?
Median Household Income in Lake Darby is $90,083.
What is Income or Wage Gap in Lake Darby?
Income or Wage Gap in Lake Darby is 34.1%.
Women in Lake Darby earn 65.9 cents for every dollar earned by a man.
What is Inequality or Gini Index in Lake Darby?
Inequality or Gini Index in Lake Darby is 0.38.
What is the Total Population of Lake Darby?
Total Population of Lake Darby is 4,569.
What is the Total Male Population of Lake Darby?
Total Male Population of Lake Darby is 2,128.
What is the Total Female Population of Lake Darby?
Total Female Population of Lake Darby is 2,441.
What is the Ratio of Males per 100 Females in Lake Darby?
There are 87.18 Males per 100 Females in Lake Darby.
What is the Ratio of Females per 100 Males in Lake Darby?
There are 114.71 Females per 100 Males in Lake Darby.
What is the Median Population Age in Lake Darby?
Median Population Age in Lake Darby is 37.4 Years.
What is the Average Family Size in Lake Darby
Average Family Size in Lake Darby is 3.3 People.
What is the Average Household Size in Lake Darby
Average Household Size in Lake Darby is 2.7 People.
How Large is the Labor Force in Lake Darby?
There are 2,617 People in the Labor Forcein in Lake Darby.
What is the Percentage of People in the Labor Force in Lake Darby?
74.8% of People are in the Labor Force in Lake Darby.
What is the Unemployment Rate in Lake Darby?
Unemployment Rate in Lake Darby is 2.0%.