Lyons, OH Map & Demographics
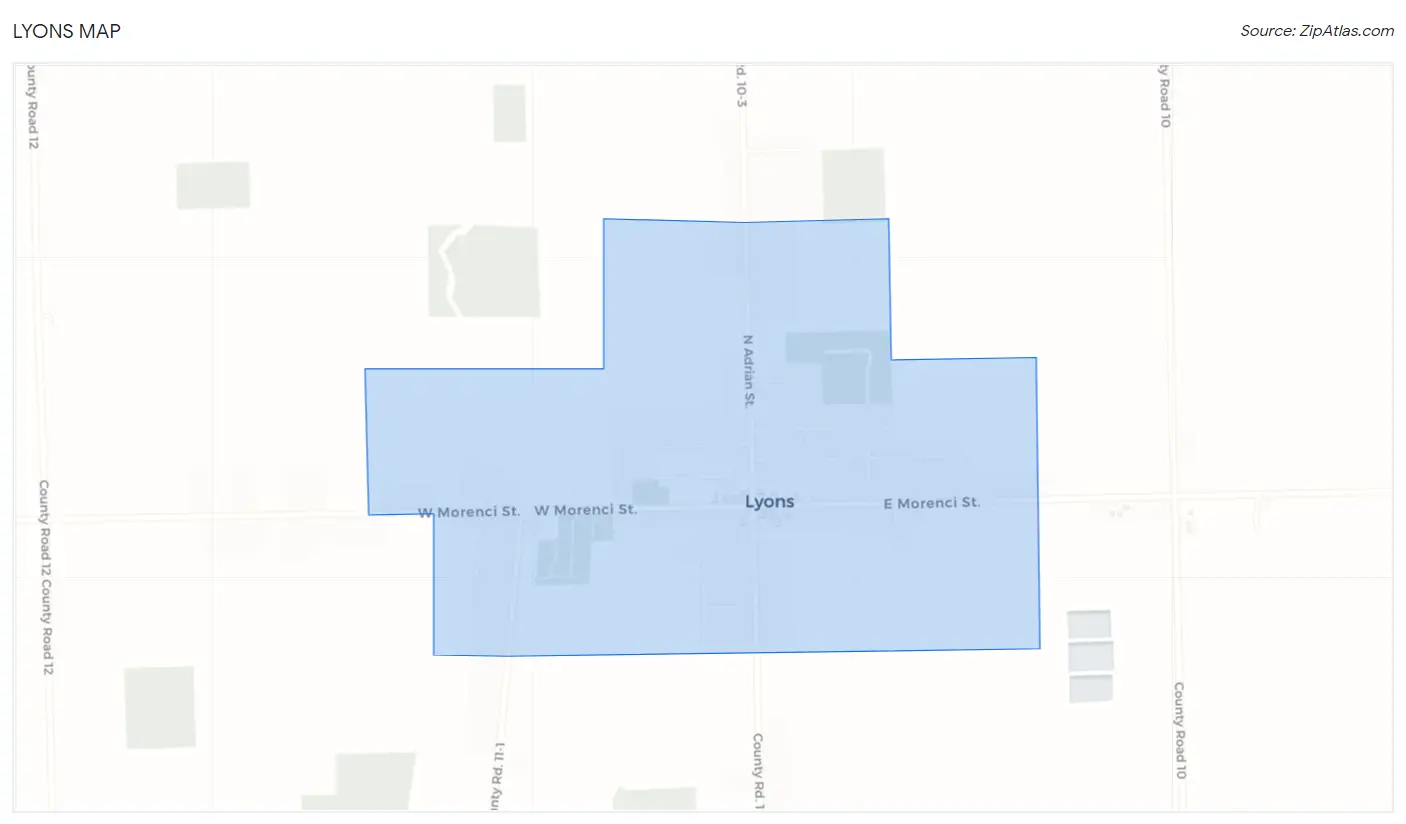
Lyons Map
Lyons Overview
$30,333
PER CAPITA INCOME
$63,542
AVG FAMILY INCOME
$62,143
AVG HOUSEHOLD INCOME
52.5%
WAGE / INCOME GAP [ % ]
47.5¢/ $1
WAGE / INCOME GAP [ $ ]
0.41
INEQUALITY / GINI INDEX
785
TOTAL POPULATION
355
MALE POPULATION
430
FEMALE POPULATION
82.56
MALES / 100 FEMALES
121.13
FEMALES / 100 MALES
33.0
MEDIAN AGE
2.8
AVG FAMILY SIZE
2.3
AVG HOUSEHOLD SIZE
400
LABOR FORCE [ PEOPLE ]
69.0%
PERCENT IN LABOR FORCE
2.8%
UNEMPLOYMENT RATE
Lyons Zip Codes
Lyons Area Codes
Income in Lyons
Income Overview in Lyons
Per Capita Income in Lyons is $30,333, while median incomes of families and households are $63,542 and $62,143 respectively.
| Characteristic | Number | Measure |
| Per Capita Income | 785 | $30,333 |
| Median Family Income | 235 | $63,542 |
| Mean Family Income | 235 | $72,023 |
| Median Household Income | 346 | $62,143 |
| Mean Household Income | 346 | $66,938 |
| Income Deficit | 235 | $0 |
| Wage / Income Gap (%) | 785 | 52.51% |
| Wage / Income Gap ($) | 785 | 47.49¢ per $1 |
| Gini / Inequality Index | 785 | 0.41 |
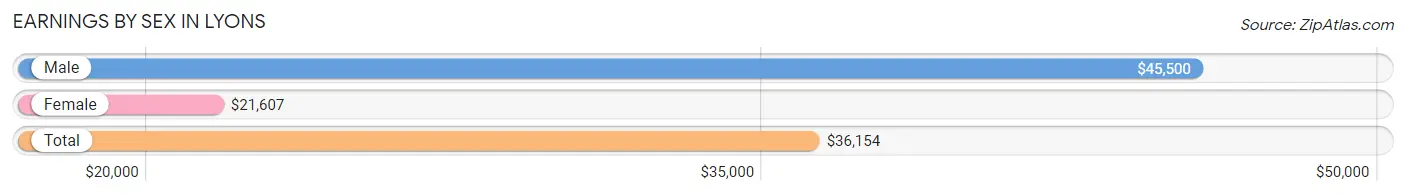
Earnings by Sex in Lyons
Average Earnings in Lyons are $36,154, $45,500 for men and $21,607 for women, a difference of 52.5%.
| Sex | Number | Average Earnings |
| Male | 204 (47.7%) | $45,500 |
| Female | 224 (52.3%) | $21,607 |
| Total | 428 (100.0%) | $36,154 |
Earnings by Sex by Income Bracket in Lyons
The most common earnings brackets in Lyons are $40,000 to $44,999 for men (34 | 16.7%) and $15,000 to $17,499 for women (62 | 27.7%).
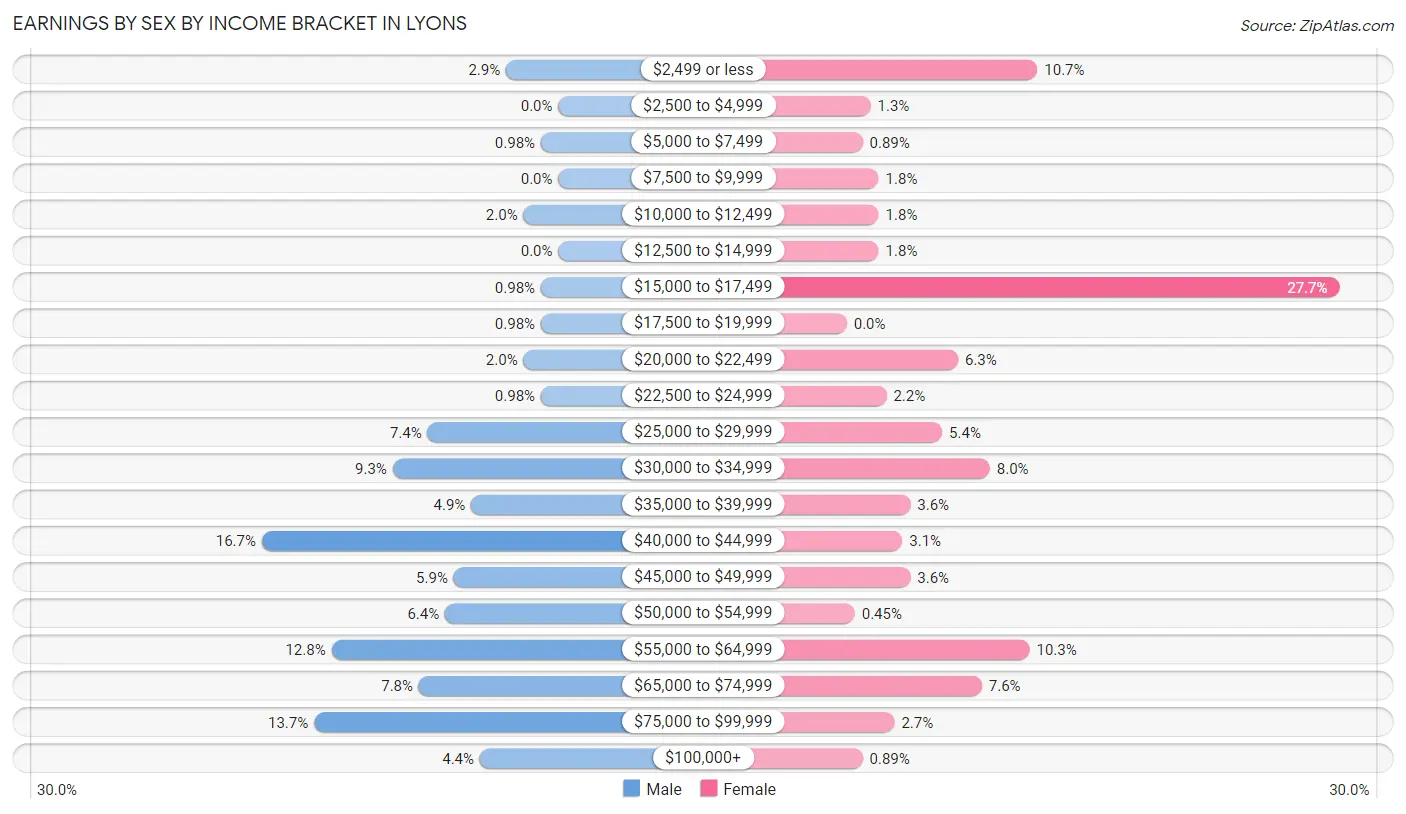
| Income | Male | Female |
| $2,499 or less | 6 (2.9%) | 24 (10.7%) |
| $2,500 to $4,999 | 0 (0.0%) | 3 (1.3%) |
| $5,000 to $7,499 | 2 (1.0%) | 2 (0.9%) |
| $7,500 to $9,999 | 0 (0.0%) | 4 (1.8%) |
| $10,000 to $12,499 | 4 (2.0%) | 4 (1.8%) |
| $12,500 to $14,999 | 0 (0.0%) | 4 (1.8%) |
| $15,000 to $17,499 | 2 (1.0%) | 62 (27.7%) |
| $17,500 to $19,999 | 2 (1.0%) | 0 (0.0%) |
| $20,000 to $22,499 | 4 (2.0%) | 14 (6.2%) |
| $22,500 to $24,999 | 2 (1.0%) | 5 (2.2%) |
| $25,000 to $29,999 | 15 (7.3%) | 12 (5.4%) |
| $30,000 to $34,999 | 19 (9.3%) | 18 (8.0%) |
| $35,000 to $39,999 | 10 (4.9%) | 8 (3.6%) |
| $40,000 to $44,999 | 34 (16.7%) | 7 (3.1%) |
| $45,000 to $49,999 | 12 (5.9%) | 8 (3.6%) |
| $50,000 to $54,999 | 13 (6.4%) | 1 (0.4%) |
| $55,000 to $64,999 | 26 (12.8%) | 23 (10.3%) |
| $65,000 to $74,999 | 16 (7.8%) | 17 (7.6%) |
| $75,000 to $99,999 | 28 (13.7%) | 6 (2.7%) |
| $100,000+ | 9 (4.4%) | 2 (0.9%) |
| Total | 204 (100.0%) | 224 (100.0%) |
Earnings by Sex by Educational Attainment in Lyons
Average earnings in Lyons are $46,250 for men and $22,361 for women, a difference of 51.6%. Men with an educational attainment of bachelor's degree enjoy the highest average annual earnings of $50,625, while those with college or associate's degree education earn the least with $40,833. Women with an educational attainment of bachelor's degree earn the most with the average annual earnings of $70,074, while those with college or associate's degree education have the smallest earnings of $16,875.
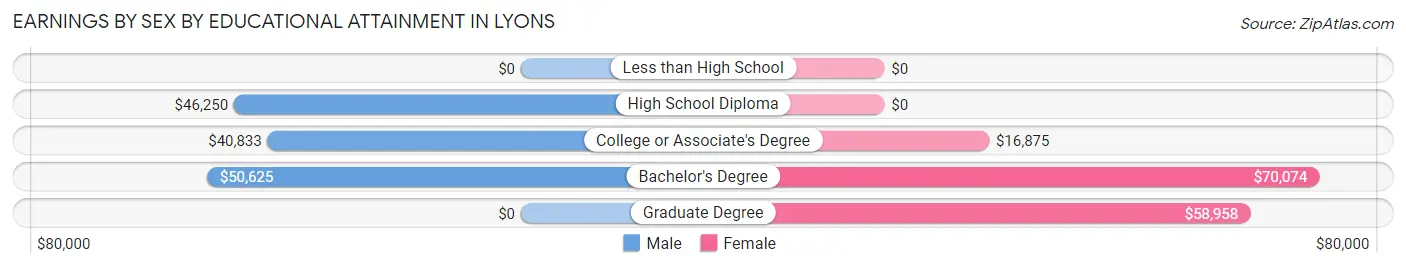
| Educational Attainment | Male Income | Female Income |
| Less than High School | - | - |
| High School Diploma | $46,250 | $0 |
| College or Associate's Degree | $40,833 | $16,875 |
| Bachelor's Degree | $50,625 | $70,074 |
| Graduate Degree | - | - |
| Total | $46,250 | $22,361 |
Family Income in Lyons
Family Income Brackets in Lyons
According to the Lyons family income data, there are 64 families falling into the $15,000 to $24,999 income range, which is the most common income bracket and makes up 27.2% of all families. Conversely, the less than $10,000 income bracket is the least frequent group with only 3 families (1.3%) belonging to this category.
| Income Bracket | # Families | % Families |
| Less than $10,000 | 3 | 1.3% |
| $10,000 to $14,999 | 3 | 1.3% |
| $15,000 to $24,999 | 64 | 27.2% |
| $25,000 to $34,999 | 29 | 12.3% |
| $35,000 to $49,999 | 9 | 3.8% |
| $50,000 to $74,999 | 28 | 11.9% |
| $75,000 to $99,999 | 37 | 15.7% |
| $100,000 to $149,999 | 45 | 19.1% |
| $150,000 to $199,999 | 9 | 3.8% |
| $200,000+ | 8 | 3.4% |
Family Income by Famaliy Size in Lyons
4-person families (14 | 6.0%) account for the highest median family income in Lyons with $101,250 per family, while 2-person families (60 | 25.5%) have the highest median income of $37,500 per family member.
| Income Bracket | # Families | Median Income |
| 2-Person Families | 60 (25.5%) | $75,000 |
| 3-Person Families | 138 (58.7%) | $0 |
| 4-Person Families | 14 (6.0%) | $101,250 |
| 5-Person Families | 19 (8.1%) | $0 |
| 6-Person Families | 2 (0.9%) | $0 |
| 7+ Person Families | 2 (0.9%) | $0 |
| Total | 235 (100.0%) | $63,542 |
Family Income by Number of Earners in Lyons
| Number of Earners | # Families | Median Income |
| No Earners | 18 (7.7%) | $51,250 |
| 1 Earner | 106 (45.1%) | $0 |
| 2 Earners | 102 (43.4%) | $98,750 |
| 3+ Earners | 9 (3.8%) | $160,417 |
| Total | 235 (100.0%) | $63,542 |
Household Income in Lyons
Household Income Brackets in Lyons
With 82 households falling in the category, the $15,000 to $24,999 income range is the most frequent in Lyons, accounting for 23.7% of all households. In contrast, only 6 households (1.7%) fall into the less than $10,000 income bracket, making it the least populous group.
| Income Bracket | # Households | % Households |
| Less than $10,000 | 6 | 1.7% |
| $10,000 to $14,999 | 11 | 3.2% |
| $15,000 to $24,999 | 82 | 23.7% |
| $25,000 to $34,999 | 25 | 7.2% |
| $35,000 to $49,999 | 34 | 9.8% |
| $50,000 to $74,999 | 59 | 17.1% |
| $75,000 to $99,999 | 60 | 17.3% |
| $100,000 to $149,999 | 52 | 15.0% |
| $150,000 to $199,999 | 9 | 2.6% |
| $200,000+ | 8 | 2.3% |
Household Income by Householder Age in Lyons
The median household income in Lyons is $62,143, with the highest median household income of $71,944 found in the 25 to 44 years age bracket for the primary householder. A total of 184 households (53.2%) fall into this category. Meanwhile, the 15 to 24 years age bracket for the primary householder has the lowest median household income of $0, with 10 households (2.9%) in this group.
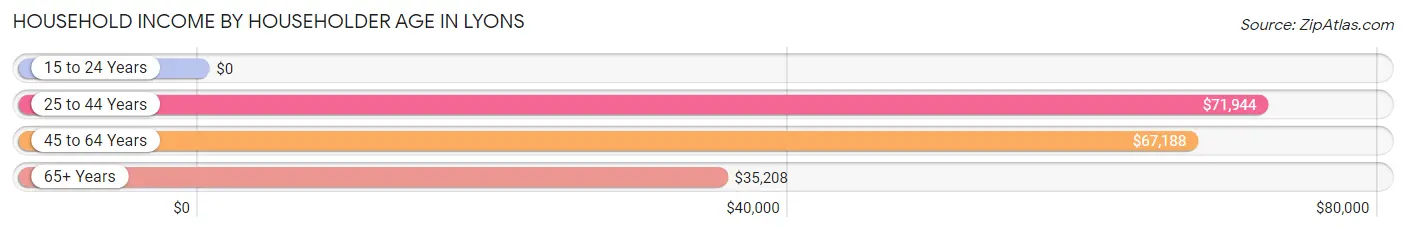
| Income Bracket | # Households | Median Income |
| 15 to 24 Years | 10 (2.9%) | $0 |
| 25 to 44 Years | 184 (53.2%) | $71,944 |
| 45 to 64 Years | 45 (13.0%) | $67,188 |
| 65+ Years | 107 (30.9%) | $35,208 |
| Total | 346 (100.0%) | $62,143 |
Poverty in Lyons
Income Below Poverty by Sex and Age in Lyons
With 12.1% poverty level for males and 30.5% for females among the residents of Lyons, 6 to 11 year old males and 35 to 44 year old females are the most vulnerable to poverty, with 22 males (47.8%) and 69 females (81.2%) in their respective age groups living below the poverty level.
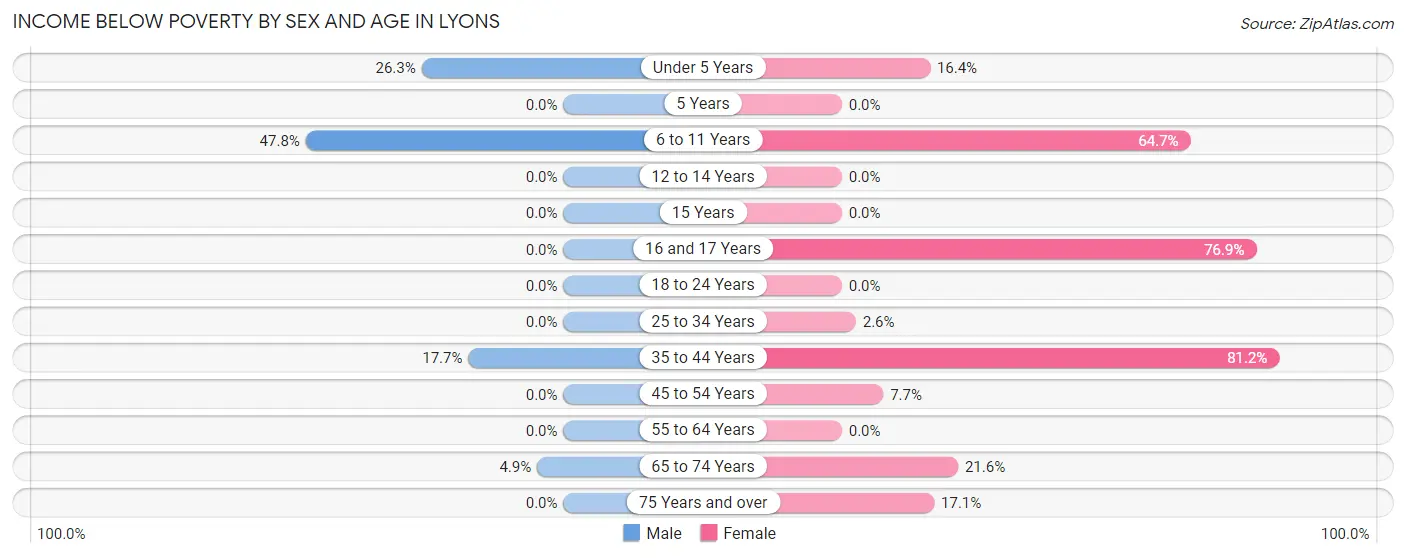
| Age Bracket | Male | Female |
| Under 5 Years | 10 (26.3%) | 9 (16.4%) |
| 5 Years | 0 (0.0%) | 0 (0.0%) |
| 6 to 11 Years | 22 (47.8%) | 22 (64.7%) |
| 12 to 14 Years | 0 (0.0%) | 0 (0.0%) |
| 15 Years | 0 (0.0%) | 0 (0.0%) |
| 16 and 17 Years | 0 (0.0%) | 10 (76.9%) |
| 18 to 24 Years | 0 (0.0%) | 0 (0.0%) |
| 25 to 34 Years | 0 (0.0%) | 2 (2.6%) |
| 35 to 44 Years | 9 (17.6%) | 69 (81.2%) |
| 45 to 54 Years | 0 (0.0%) | 2 (7.7%) |
| 55 to 64 Years | 0 (0.0%) | 0 (0.0%) |
| 65 to 74 Years | 2 (4.9%) | 11 (21.6%) |
| 75 Years and over | 0 (0.0%) | 6 (17.1%) |
| Total | 43 (12.1%) | 131 (30.5%) |
Income Above Poverty by Sex and Age in Lyons
According to the poverty statistics in Lyons, males aged 5 years and females aged 5 years are the age groups that are most secure financially, with 100.0% of males and 100.0% of females in these age groups living above the poverty line.
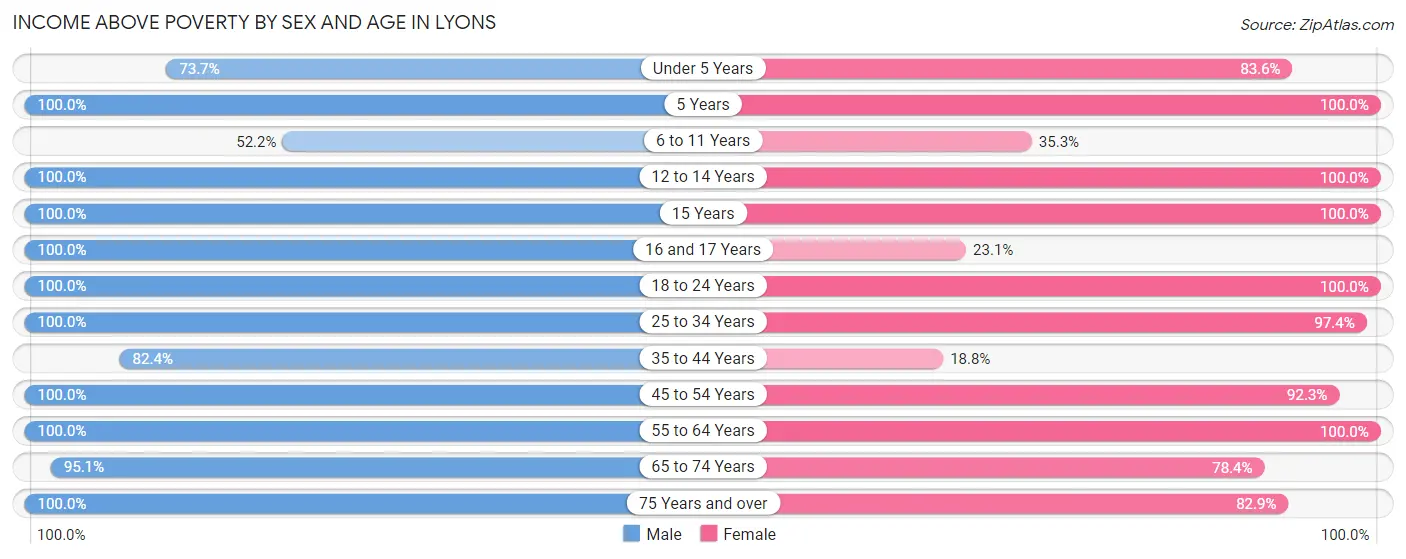
| Age Bracket | Male | Female |
| Under 5 Years | 28 (73.7%) | 46 (83.6%) |
| 5 Years | 2 (100.0%) | 8 (100.0%) |
| 6 to 11 Years | 24 (52.2%) | 12 (35.3%) |
| 12 to 14 Years | 6 (100.0%) | 2 (100.0%) |
| 15 Years | 13 (100.0%) | 1 (100.0%) |
| 16 and 17 Years | 5 (100.0%) | 3 (23.1%) |
| 18 to 24 Years | 13 (100.0%) | 11 (100.0%) |
| 25 to 34 Years | 89 (100.0%) | 75 (97.4%) |
| 35 to 44 Years | 42 (82.4%) | 16 (18.8%) |
| 45 to 54 Years | 19 (100.0%) | 24 (92.3%) |
| 55 to 64 Years | 24 (100.0%) | 32 (100.0%) |
| 65 to 74 Years | 39 (95.1%) | 40 (78.4%) |
| 75 Years and over | 8 (100.0%) | 29 (82.9%) |
| Total | 312 (87.9%) | 299 (69.5%) |
Income Below Poverty Among Married-Couple Families in Lyons
The poverty statistics for married-couple families in Lyons show that 8.5% or 12 of the total 141 families live below the poverty line. Families with 3 or 4 children have the highest poverty rate of 52.9%, comprising of 9 families. On the other hand, families with 1 or 2 children have the lowest poverty rate of 0.0%, which includes 0 families.
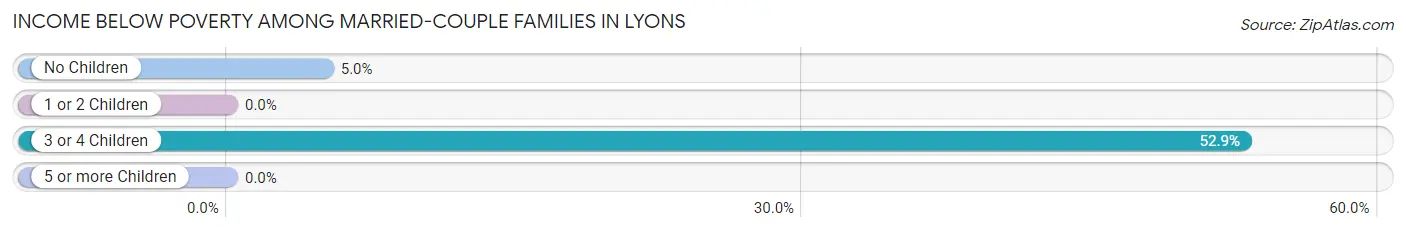
| Children | Above Poverty | Below Poverty |
| No Children | 57 (95.0%) | 3 (5.0%) |
| 1 or 2 Children | 64 (100.0%) | 0 (0.0%) |
| 3 or 4 Children | 8 (47.1%) | 9 (52.9%) |
| 5 or more Children | 0 (0.0%) | 0 (0.0%) |
| Total | 129 (91.5%) | 12 (8.5%) |
Income Below Poverty Among Single-Parent Households in Lyons
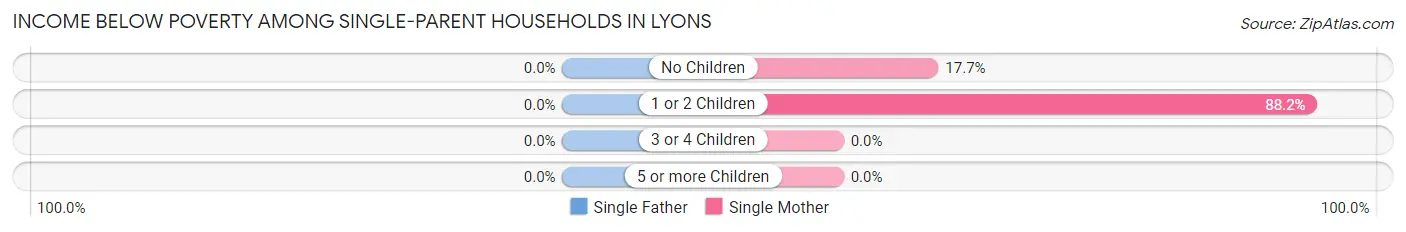
| Children | Single Father | Single Mother |
| No Children | 0 (0.0%) | 3 (17.6%) |
| 1 or 2 Children | 0 (0.0%) | 60 (88.2%) |
| 3 or 4 Children | 0 (0.0%) | 0 (0.0%) |
| 5 or more Children | 0 (0.0%) | 0 (0.0%) |
| Total | 0 (0.0%) | 63 (72.4%) |
Income Below Poverty Among Married-Couple vs Single-Parent Households in Lyons
The poverty data for Lyons shows that 12 of the married-couple family households (8.5%) and 63 of the single-parent households (67.0%) are living below the poverty level. Within the married-couple family households, those with 3 or 4 children have the highest poverty rate, with 9 households (52.9%) falling below the poverty line. Among the single-parent households, those with 1 or 2 children have the highest poverty rate, with 60 household (80.0%) living below poverty.
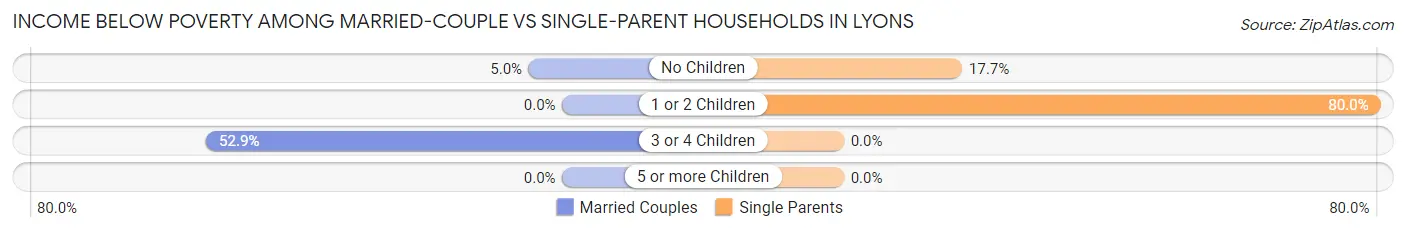
| Children | Married-Couple Families | Single-Parent Households |
| No Children | 3 (5.0%) | 3 (17.6%) |
| 1 or 2 Children | 0 (0.0%) | 60 (80.0%) |
| 3 or 4 Children | 9 (52.9%) | 0 (0.0%) |
| 5 or more Children | 0 (0.0%) | 0 (0.0%) |
| Total | 12 (8.5%) | 63 (67.0%) |
Race in Lyons
The most populous races in Lyons are White / Caucasian (654 | 83.3%), Two or more Races (117 | 14.9%), and Hispanic or Latino (17 | 2.2%).
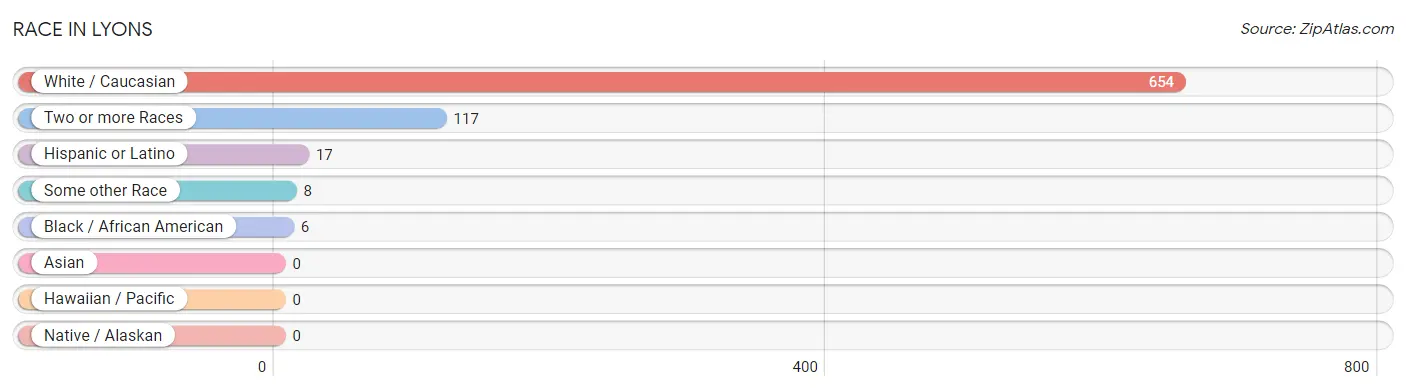
| Race | # Population | % Population |
| Asian | 0 | 0.0% |
| Black / African American | 6 | 0.8% |
| Hawaiian / Pacific | 0 | 0.0% |
| Hispanic or Latino | 17 | 2.2% |
| Native / Alaskan | 0 | 0.0% |
| White / Caucasian | 654 | 83.3% |
| Two or more Races | 117 | 14.9% |
| Some other Race | 8 | 1.0% |
| Total | 785 | 100.0% |
Ancestry in Lyons
The most populous ancestries reported in Lyons are German (285 | 36.3%), English (182 | 23.2%), Irish (105 | 13.4%), American (53 | 6.8%), and Czech (35 | 4.5%), together accounting for 84.1% of all Lyons residents.
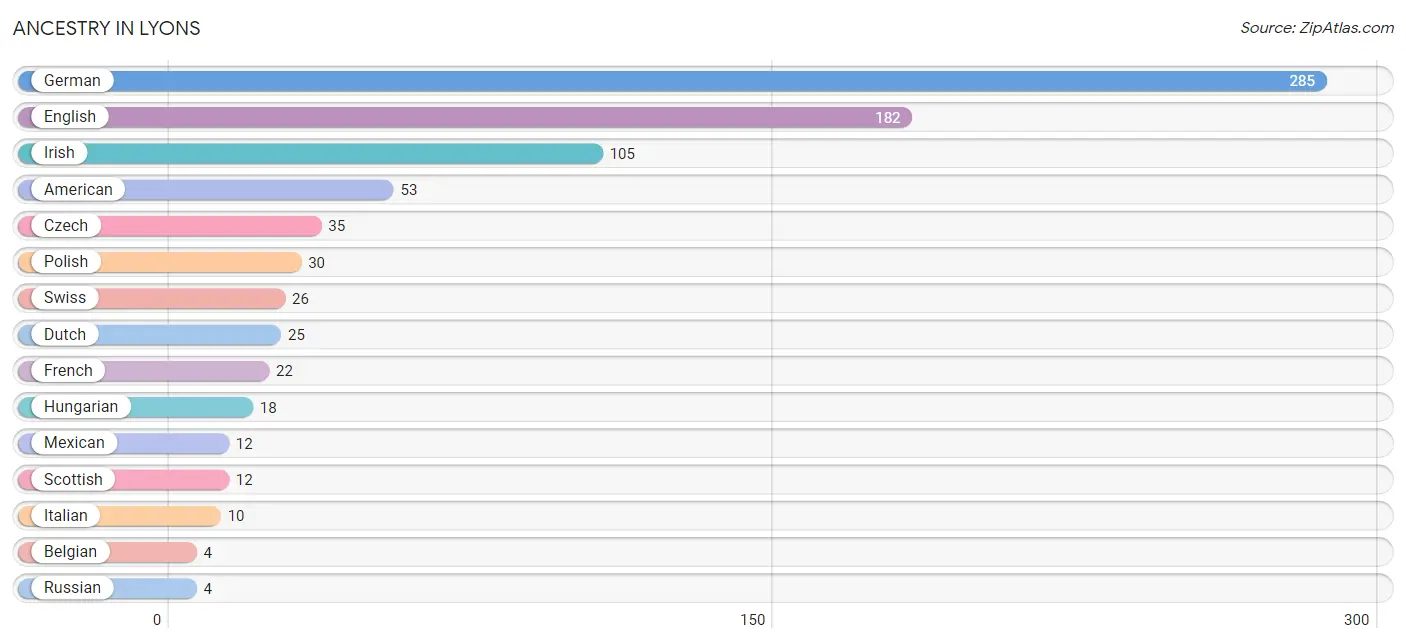
| Ancestry | # Population | % Population |
| American | 53 | 6.8% |
| Belgian | 4 | 0.5% |
| Czech | 35 | 4.5% |
| Czechoslovakian | 2 | 0.3% |
| Danish | 3 | 0.4% |
| Dutch | 25 | 3.2% |
| English | 182 | 23.2% |
| European | 2 | 0.3% |
| French | 22 | 2.8% |
| German | 285 | 36.3% |
| Hungarian | 18 | 2.3% |
| Irish | 105 | 13.4% |
| Italian | 10 | 1.3% |
| Mexican | 12 | 1.5% |
| Polish | 30 | 3.8% |
| Russian | 4 | 0.5% |
| Scandinavian | 3 | 0.4% |
| Scotch-Irish | 3 | 0.4% |
| Scottish | 12 | 1.5% |
| Slavic | 2 | 0.3% |
| Swiss | 26 | 3.3% |
| Ukrainian | 4 | 0.5% | View All 22 Rows |
Immigrants in Lyons
The most numerous immigrant groups reported in Lyons came from Europe (7 | 0.9%), Germany (7 | 0.9%), and Western Europe (7 | 0.9%), together accounting for 2.7% of all Lyons residents.
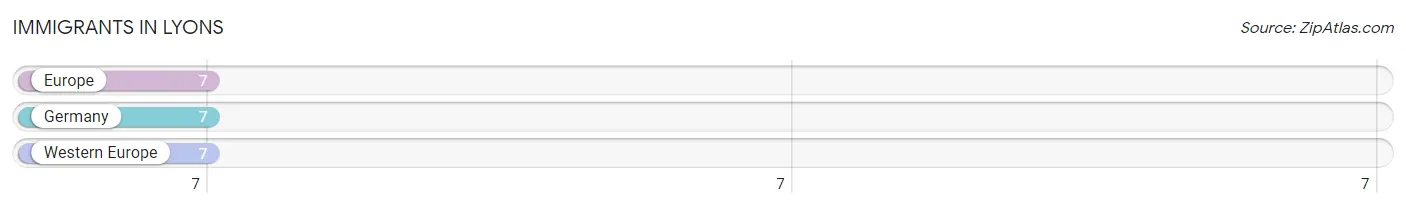
| Immigration Origin | # Population | % Population |
| Europe | 7 | 0.9% |
| Germany | 7 | 0.9% |
| Western Europe | 7 | 0.9% | View All 3 Rows |
Sex and Age in Lyons
Sex and Age in Lyons
The most populous age groups in Lyons are 30 to 34 Years (49 | 13.8%) for men and 40 to 44 Years (70 | 16.3%) for women.
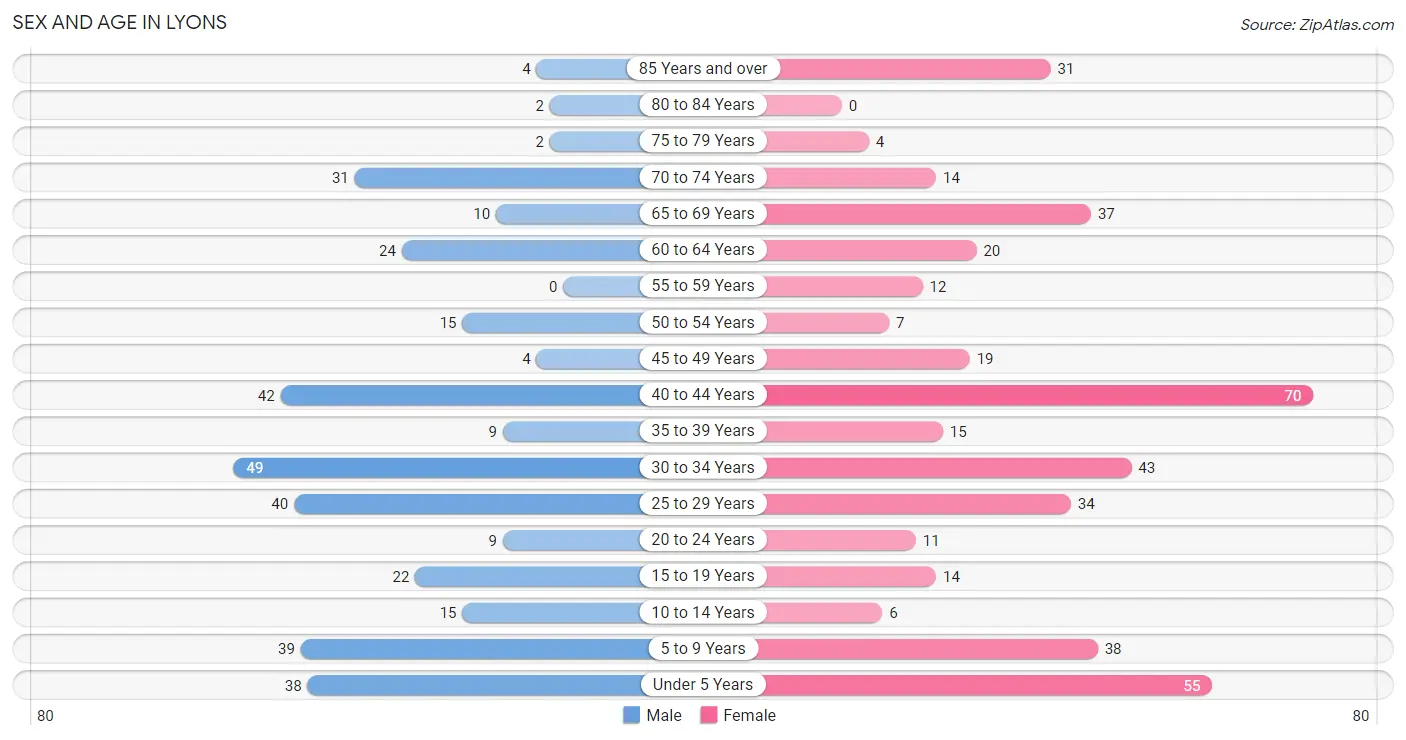
| Age Bracket | Male | Female |
| Under 5 Years | 38 (10.7%) | 55 (12.8%) |
| 5 to 9 Years | 39 (11.0%) | 38 (8.8%) |
| 10 to 14 Years | 15 (4.2%) | 6 (1.4%) |
| 15 to 19 Years | 22 (6.2%) | 14 (3.3%) |
| 20 to 24 Years | 9 (2.5%) | 11 (2.6%) |
| 25 to 29 Years | 40 (11.3%) | 34 (7.9%) |
| 30 to 34 Years | 49 (13.8%) | 43 (10.0%) |
| 35 to 39 Years | 9 (2.5%) | 15 (3.5%) |
| 40 to 44 Years | 42 (11.8%) | 70 (16.3%) |
| 45 to 49 Years | 4 (1.1%) | 19 (4.4%) |
| 50 to 54 Years | 15 (4.2%) | 7 (1.6%) |
| 55 to 59 Years | 0 (0.0%) | 12 (2.8%) |
| 60 to 64 Years | 24 (6.8%) | 20 (4.6%) |
| 65 to 69 Years | 10 (2.8%) | 37 (8.6%) |
| 70 to 74 Years | 31 (8.7%) | 14 (3.3%) |
| 75 to 79 Years | 2 (0.6%) | 4 (0.9%) |
| 80 to 84 Years | 2 (0.6%) | 0 (0.0%) |
| 85 Years and over | 4 (1.1%) | 31 (7.2%) |
| Total | 355 (100.0%) | 430 (100.0%) |
Families and Households in Lyons
Median Family Size in Lyons
The median family size in Lyons is 2.77 persons per family, with married-couple families (141 | 60.0%) accounting for the largest median family size of 3.29 persons per family. On the other hand, single female/mother families (87 | 37.0%) represent the smallest median family size with 1.98 persons per family.
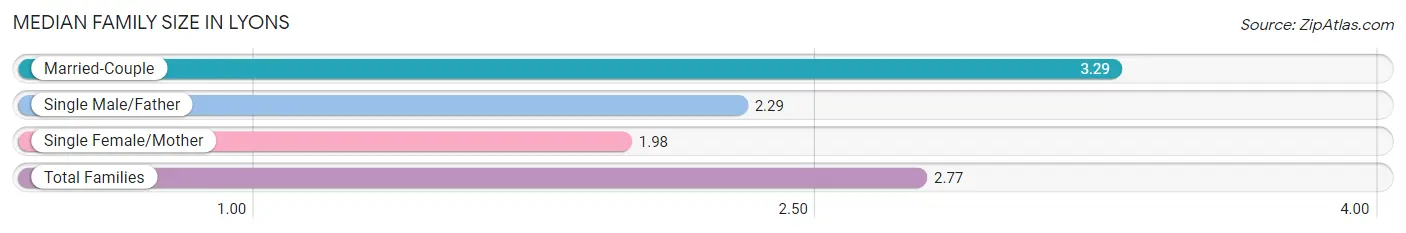
| Family Type | # Families | Family Size |
| Married-Couple | 141 (60.0%) | 3.29 |
| Single Male/Father | 7 (3.0%) | 2.29 |
| Single Female/Mother | 87 (37.0%) | 1.98 |
| Total Families | 235 (100.0%) | 2.77 |
Median Household Size in Lyons
The median household size in Lyons is 2.27 persons per household, with married-couple households (141 | 40.7%) accounting for the largest median household size of 3.3 persons per household. non-family households (111 | 32.1%) represent the smallest median household size with 1.07 persons per household.
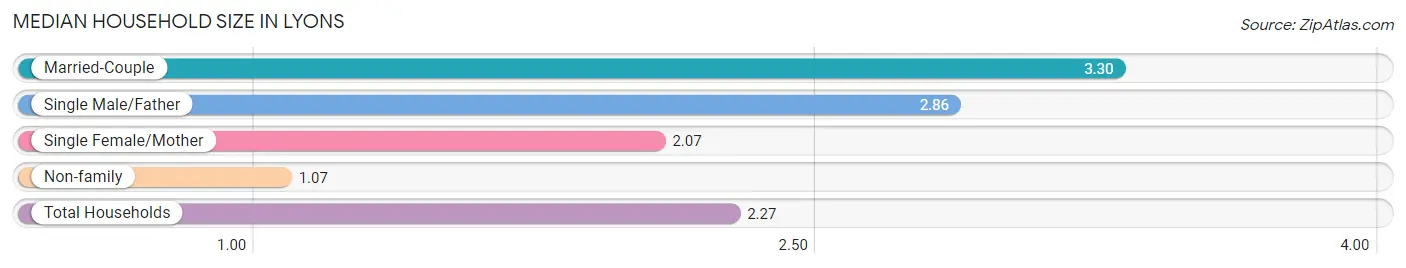
| Household Type | # Households | Household Size |
| Married-Couple | 141 (40.7%) | 3.30 |
| Single Male/Father | 7 (2.0%) | 2.86 |
| Single Female/Mother | 87 (25.1%) | 2.07 |
| Non-family | 111 (32.1%) | 1.07 |
| Total Households | 346 (100.0%) | 2.27 |
Household Size by Marriage Status in Lyons
Out of a total of 346 households in Lyons, 235 (67.9%) are family households, while 111 (32.1%) are nonfamily households. The most numerous type of family households are 3-person households, comprising 128, and the most common type of nonfamily households are 1-person households, comprising 103.
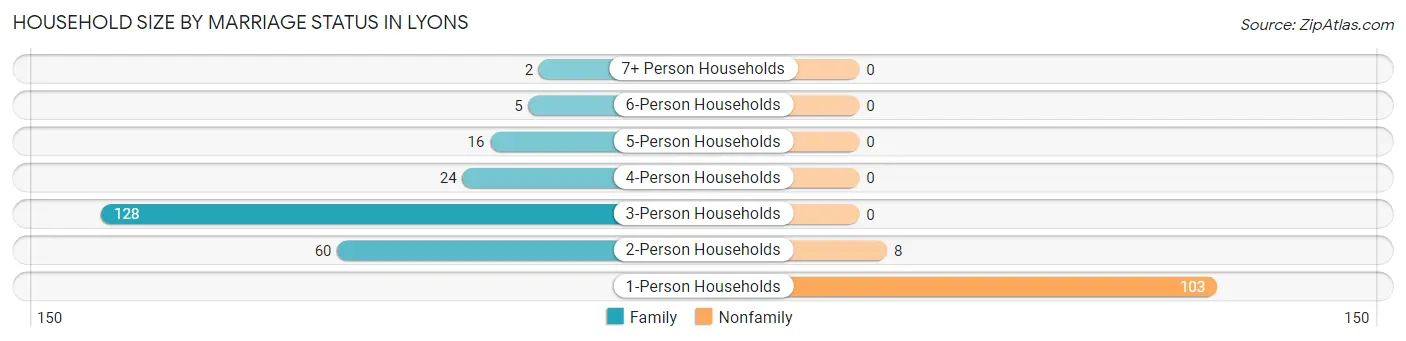
| Household Size | Family Households | Nonfamily Households |
| 1-Person Households | - | 103 (29.8%) |
| 2-Person Households | 60 (17.3%) | 8 (2.3%) |
| 3-Person Households | 128 (37.0%) | 0 (0.0%) |
| 4-Person Households | 24 (6.9%) | 0 (0.0%) |
| 5-Person Households | 16 (4.6%) | 0 (0.0%) |
| 6-Person Households | 5 (1.5%) | 0 (0.0%) |
| 7+ Person Households | 2 (0.6%) | 0 (0.0%) |
| Total | 235 (67.9%) | 111 (32.1%) |
Female Fertility in Lyons
Fertility by Age in Lyons
Average fertility rate in Lyons is 149.0 births per 1,000 women. Women in the age bracket of 20 to 34 years have the highest fertility rate with 352.0 births per 1,000 women. Women in the age bracket of 20 to 34 years acount for 100.0% of all women with births.
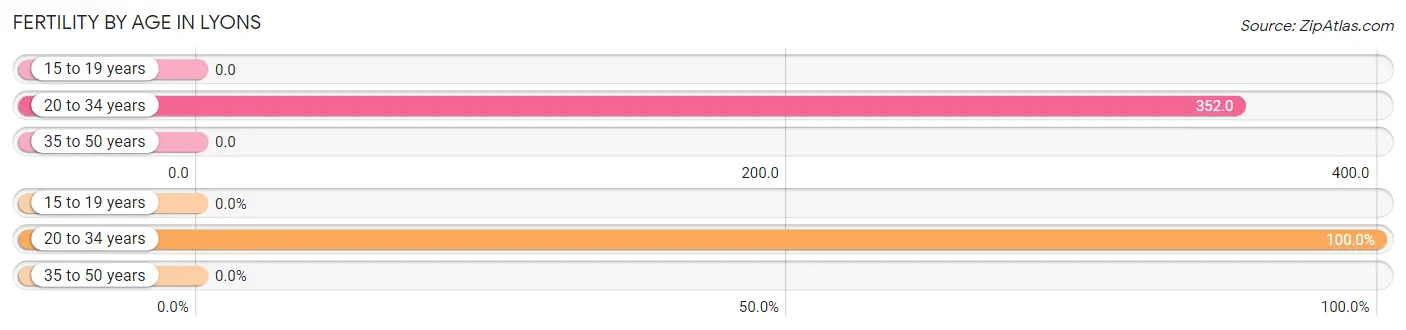
| Age Bracket | Women with Births | Births / 1,000 Women |
| 15 to 19 years | 0 (0.0%) | 0.0 |
| 20 to 34 years | 31 (100.0%) | 352.0 |
| 35 to 50 years | 0 (0.0%) | 0.0 |
| Total | 31 (100.0%) | 149.0 |
Fertility by Age by Marriage Status in Lyons
87.1% of women with births (31) in Lyons are married. The highest percentage of unmarried women with births falls into 20 to 34 years age bracket with 12.9% of them unmarried at the time of birth, while the lowest percentage of unmarried women with births belong to 20 to 34 years age bracket with 12.9% of them unmarried.
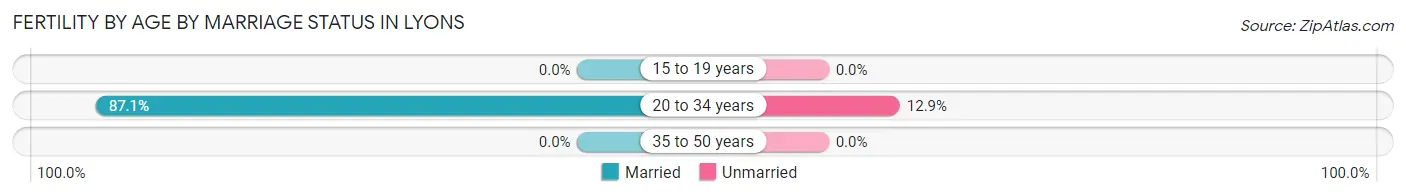
| Age Bracket | Married | Unmarried |
| 15 to 19 years | 0 (0.0%) | 0 (0.0%) |
| 20 to 34 years | 27 (87.1%) | 4 (12.9%) |
| 35 to 50 years | 0 (0.0%) | 0 (0.0%) |
| Total | 27 (87.1%) | 4 (12.9%) |
Fertility by Education in Lyons
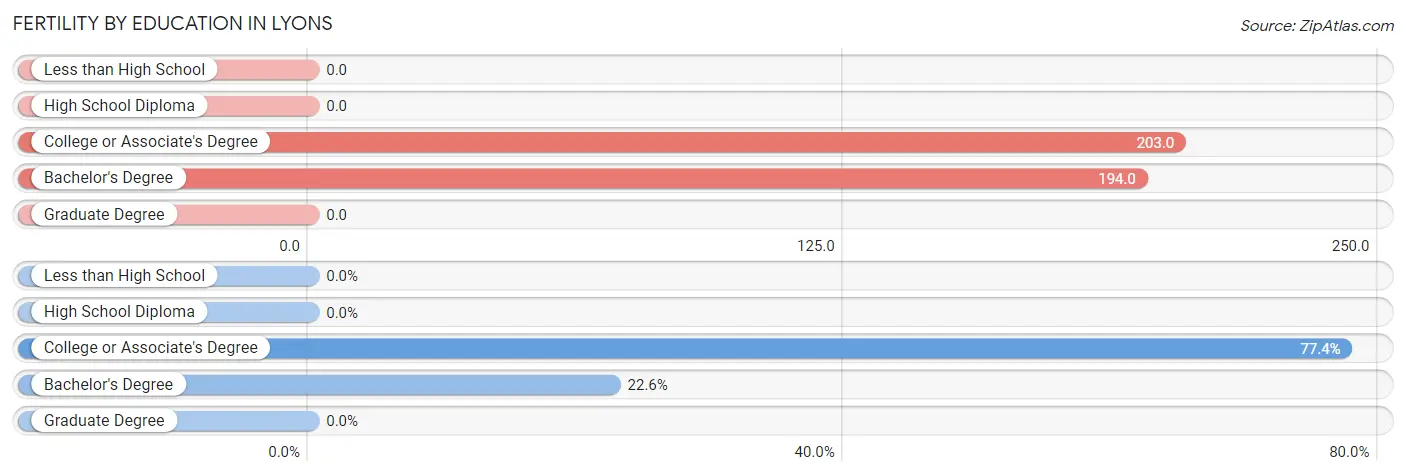
| Educational Attainment | Women with Births | Births / 1,000 Women |
| Less than High School | 0 (0.0%) | 0.0 |
| High School Diploma | 0 (0.0%) | 0.0 |
| College or Associate's Degree | 24 (77.4%) | 203.0 |
| Bachelor's Degree | 7 (22.6%) | 194.0 |
| Graduate Degree | 0 (0.0%) | 0.0 |
| Total | 31 (100.0%) | 149.0 |
Fertility by Education by Marriage Status in Lyons
12.9% of women with births in Lyons are unmarried. Women with the educational attainment of bachelor's degree are most likely to be married with 100.0% of them married at childbirth, while women with the educational attainment of college or associate's degree are least likely to be married with 16.7% of them unmarried at childbirth.
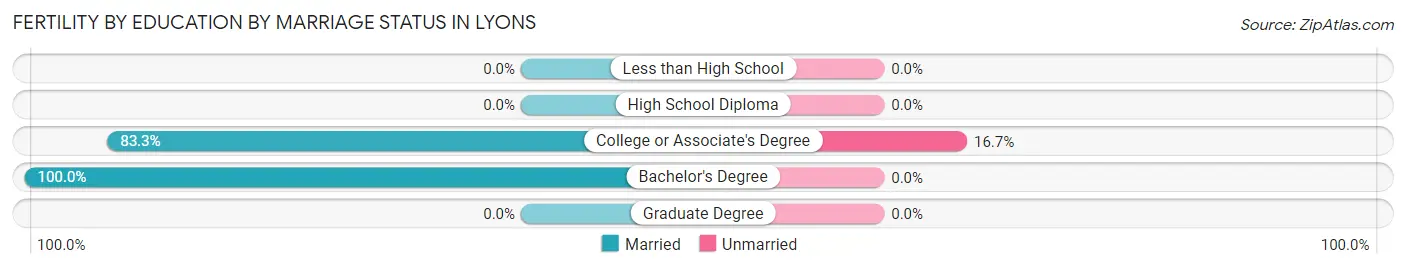
| Educational Attainment | Married | Unmarried |
| Less than High School | 0 (0.0%) | 0 (0.0%) |
| High School Diploma | 0 (0.0%) | 0 (0.0%) |
| College or Associate's Degree | 20 (83.3%) | 4 (16.7%) |
| Bachelor's Degree | 7 (100.0%) | 0 (0.0%) |
| Graduate Degree | 0 (0.0%) | 0 (0.0%) |
| Total | 27 (87.1%) | 4 (12.9%) |
Employment Characteristics in Lyons
Employment by Class of Employer in Lyons
Among the 366 employed individuals in Lyons, private company employees (284 | 77.6%), not-for-profit organizations (38 | 10.4%), and federal government employees (23 | 6.3%) make up the most common classes of employment.
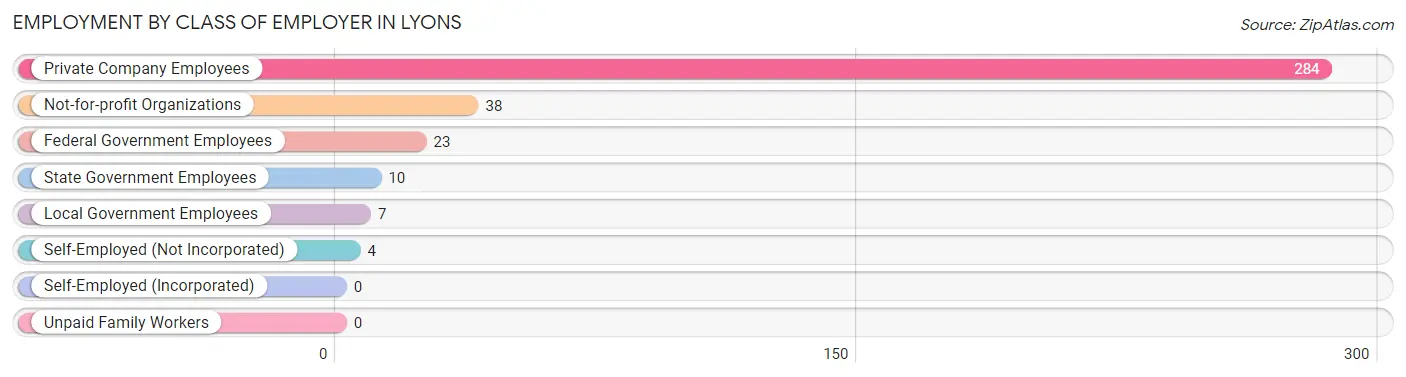
| Employer Class | # Employees | % Employees |
| Private Company Employees | 284 | 77.6% |
| Self-Employed (Incorporated) | 0 | 0.0% |
| Self-Employed (Not Incorporated) | 4 | 1.1% |
| Not-for-profit Organizations | 38 | 10.4% |
| Local Government Employees | 7 | 1.9% |
| State Government Employees | 10 | 2.7% |
| Federal Government Employees | 23 | 6.3% |
| Unpaid Family Workers | 0 | 0.0% |
| Total | 366 | 100.0% |
Employment Status by Age in Lyons
According to the labor force statistics for Lyons, out of the total population over 16 years of age (580), 69.0% or 400 individuals are in the labor force, with 2.8% or 11 of them unemployed. The age group with the highest labor force participation rate is 25 to 29 years, with 95.9% or 71 individuals in the labor force. Within the labor force, the 75 years and over age range has the highest percentage of unemployed individuals, with 50.0% or 2 of them being unemployed.
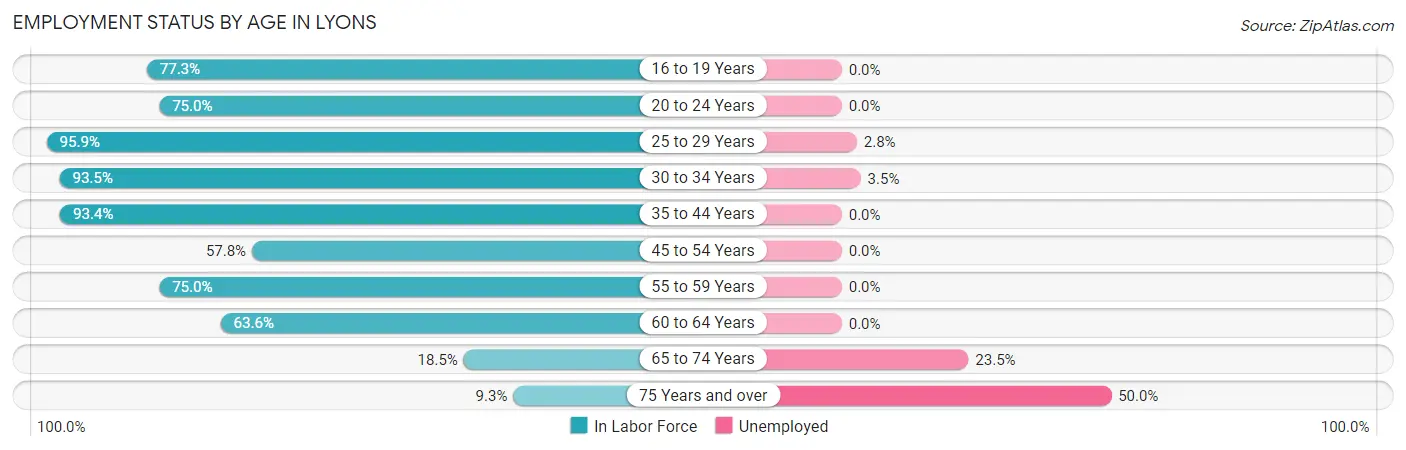
| Age Bracket | In Labor Force | Unemployed |
| 16 to 19 Years | 17 (77.3%) | 0 (0.0%) |
| 20 to 24 Years | 15 (75.0%) | 0 (0.0%) |
| 25 to 29 Years | 71 (95.9%) | 2 (2.8%) |
| 30 to 34 Years | 86 (93.5%) | 3 (3.5%) |
| 35 to 44 Years | 127 (93.4%) | 0 (0.0%) |
| 45 to 54 Years | 26 (57.8%) | 0 (0.0%) |
| 55 to 59 Years | 9 (75.0%) | 0 (0.0%) |
| 60 to 64 Years | 28 (63.6%) | 0 (0.0%) |
| 65 to 74 Years | 17 (18.5%) | 4 (23.5%) |
| 75 Years and over | 4 (9.3%) | 2 (50.0%) |
| Total | 400 (69.0%) | 11 (2.8%) |
Employment Status by Educational Attainment in Lyons
According to labor force statistics for Lyons, 86.1% of individuals (347) out of the total population between 25 and 64 years of age (403) are in the labor force, with 1.4% or 5 of them being unemployed. The group with the highest labor force participation rate are those with the educational attainment of bachelor's degree or higher, with 97.0% or 64 individuals in the labor force. Within the labor force, individuals with college / associate degree education have the highest percentage of unemployment, with 1.8% or 3 of them being unemployed.
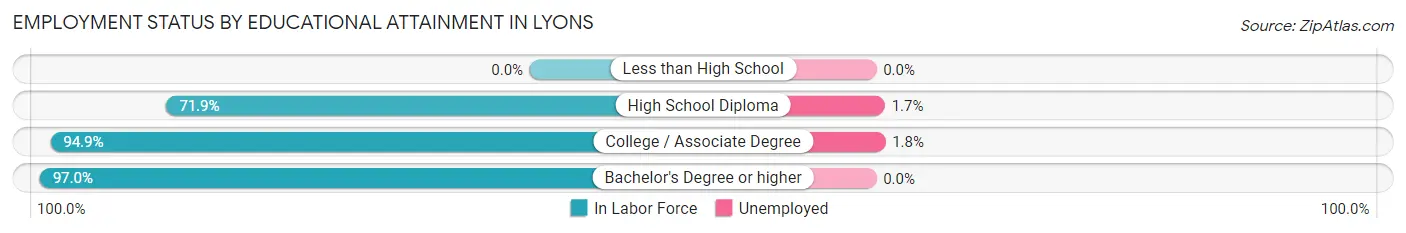
| Educational Attainment | In Labor Force | Unemployed |
| Less than High School | 0 (0.0%) | 0 (0.0%) |
| High School Diploma | 115 (71.9%) | 3 (1.7%) |
| College / Associate Degree | 168 (94.9%) | 3 (1.8%) |
| Bachelor's Degree or higher | 64 (97.0%) | 0 (0.0%) |
| Total | 347 (86.1%) | 6 (1.4%) |
Employment Occupations by Sex in Lyons
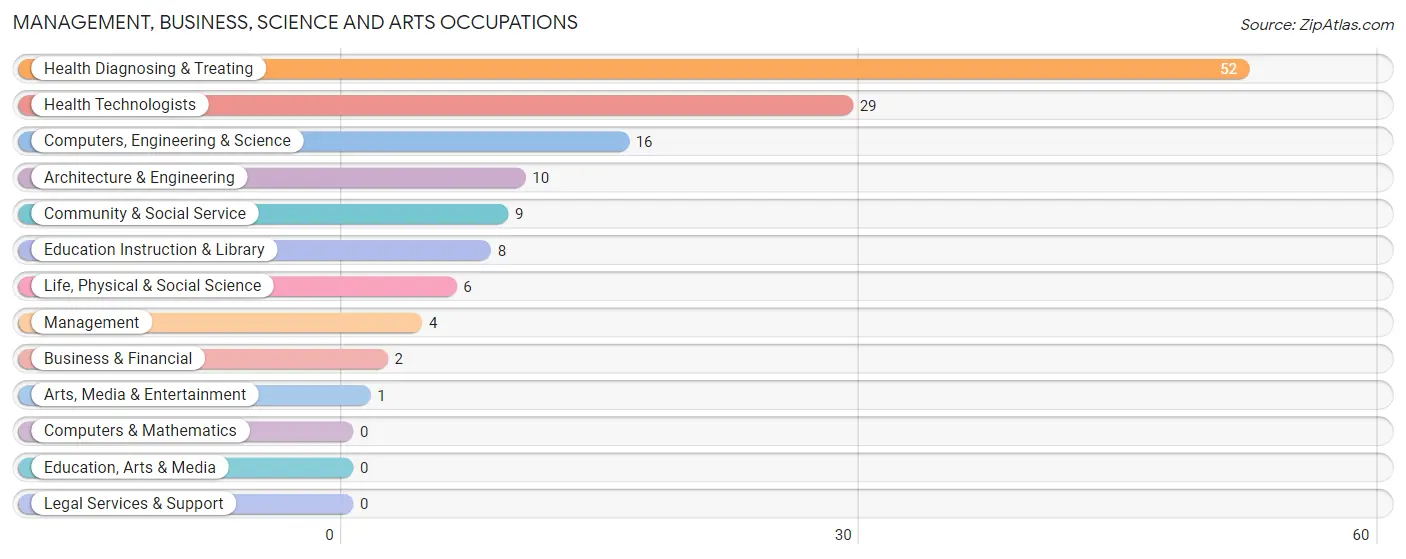
Management, Business, Science and Arts Occupations
The most common Management, Business, Science and Arts occupations in Lyons are Health Diagnosing & Treating (52 | 13.4%), Health Technologists (29 | 7.5%), Computers, Engineering & Science (16 | 4.1%), Architecture & Engineering (10 | 2.6%), and Community & Social Service (9 | 2.3%).
Management, Business, Science and Arts Occupations by Sex
Within the Management, Business, Science and Arts occupations in Lyons, the most male-oriented occupations are Architecture & Engineering (100.0%), Arts, Media & Entertainment (100.0%), and Computers, Engineering & Science (62.5%), while the most female-oriented occupations are Business & Financial (100.0%), Life, Physical & Social Science (100.0%), and Education Instruction & Library (100.0%).
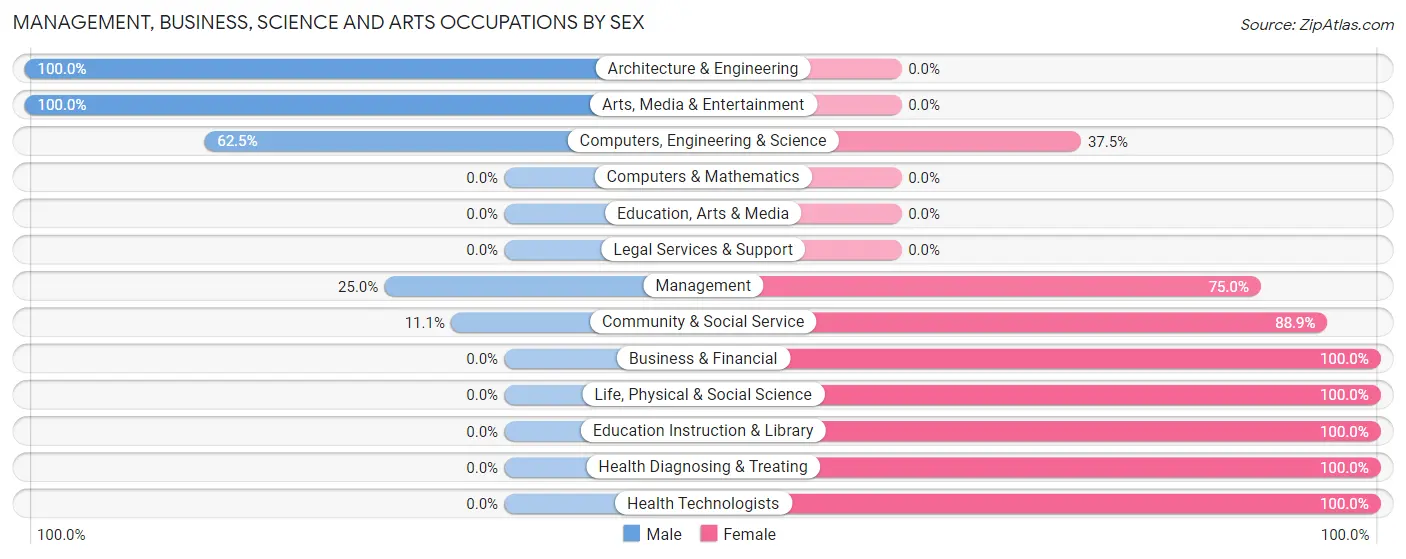
| Occupation | Male | Female |
| Management | 1 (25.0%) | 3 (75.0%) |
| Business & Financial | 0 (0.0%) | 2 (100.0%) |
| Computers, Engineering & Science | 10 (62.5%) | 6 (37.5%) |
| Computers & Mathematics | 0 (0.0%) | 0 (0.0%) |
| Architecture & Engineering | 10 (100.0%) | 0 (0.0%) |
| Life, Physical & Social Science | 0 (0.0%) | 6 (100.0%) |
| Community & Social Service | 1 (11.1%) | 8 (88.9%) |
| Education, Arts & Media | 0 (0.0%) | 0 (0.0%) |
| Legal Services & Support | 0 (0.0%) | 0 (0.0%) |
| Education Instruction & Library | 0 (0.0%) | 8 (100.0%) |
| Arts, Media & Entertainment | 1 (100.0%) | 0 (0.0%) |
| Health Diagnosing & Treating | 0 (0.0%) | 52 (100.0%) |
| Health Technologists | 0 (0.0%) | 29 (100.0%) |
| Total (Category) | 12 (14.5%) | 71 (85.5%) |
| Total (Overall) | 187 (48.1%) | 202 (51.9%) |
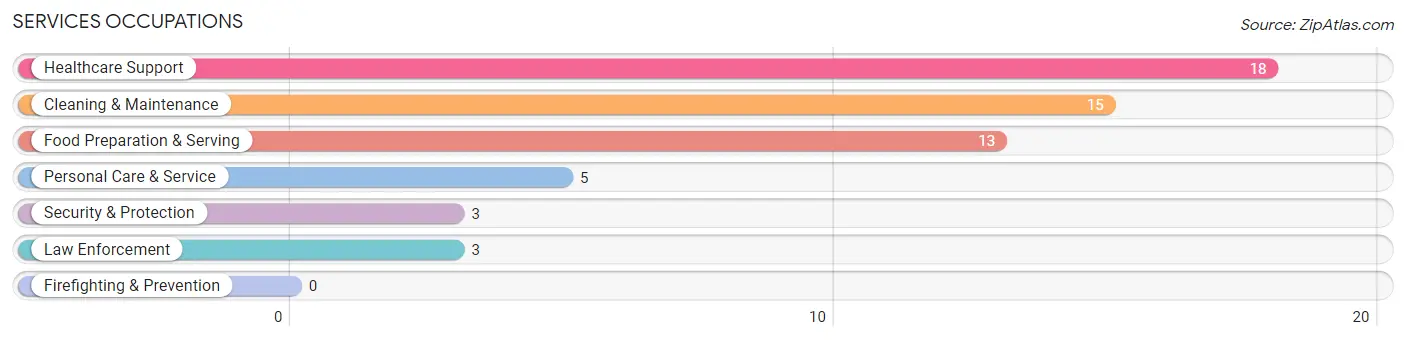
Services Occupations
The most common Services occupations in Lyons are Healthcare Support (18 | 4.6%), Cleaning & Maintenance (15 | 3.9%), Food Preparation & Serving (13 | 3.3%), Personal Care & Service (5 | 1.3%), and Security & Protection (3 | 0.8%).
Services Occupations by Sex
Within the Services occupations in Lyons, the most male-oriented occupations are Security & Protection (100.0%), Law Enforcement (100.0%), and Cleaning & Maintenance (100.0%), while the most female-oriented occupations are Healthcare Support (100.0%), Food Preparation & Serving (76.9%), and Personal Care & Service (60.0%).
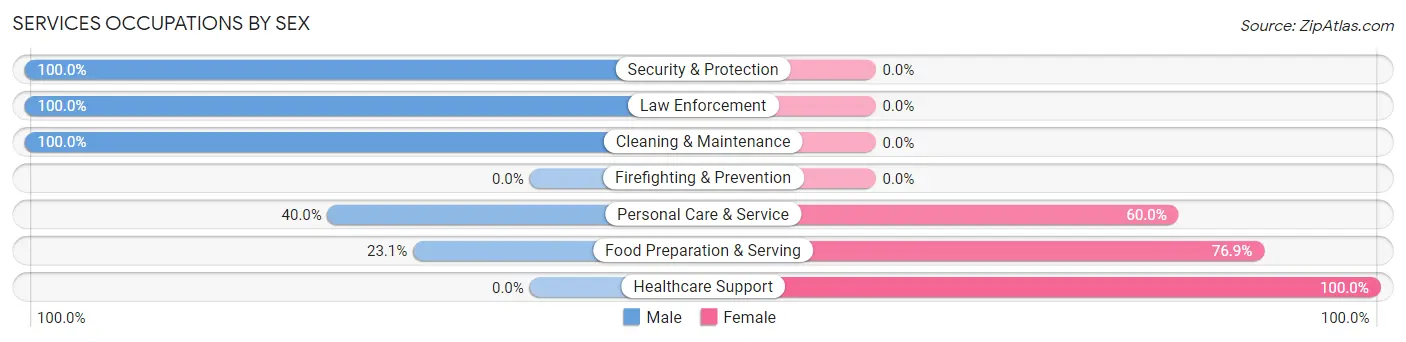
| Occupation | Male | Female |
| Healthcare Support | 0 (0.0%) | 18 (100.0%) |
| Security & Protection | 3 (100.0%) | 0 (0.0%) |
| Firefighting & Prevention | 0 (0.0%) | 0 (0.0%) |
| Law Enforcement | 3 (100.0%) | 0 (0.0%) |
| Food Preparation & Serving | 3 (23.1%) | 10 (76.9%) |
| Cleaning & Maintenance | 15 (100.0%) | 0 (0.0%) |
| Personal Care & Service | 2 (40.0%) | 3 (60.0%) |
| Total (Category) | 23 (42.6%) | 31 (57.4%) |
| Total (Overall) | 187 (48.1%) | 202 (51.9%) |
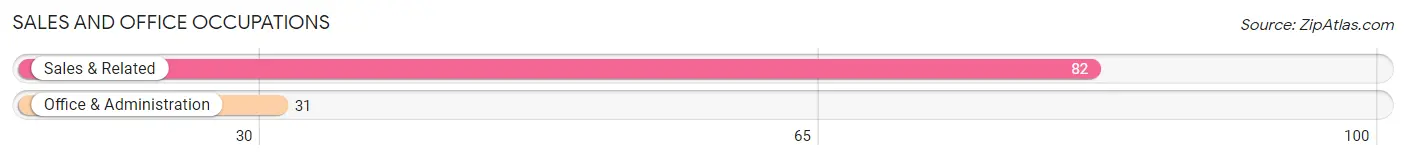
Sales and Office Occupations
The most common Sales and Office occupations in Lyons are Sales & Related (82 | 21.1%), and Office & Administration (31 | 8.0%).
Sales and Office Occupations by Sex
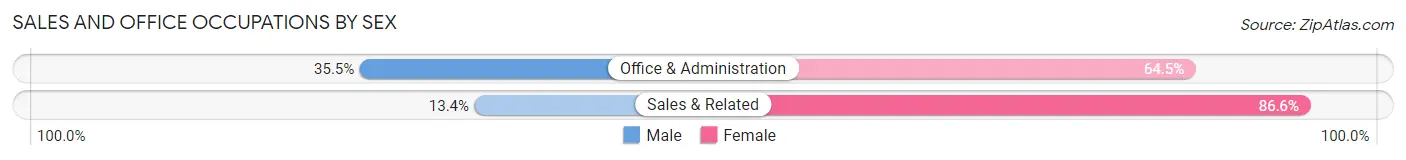
| Occupation | Male | Female |
| Sales & Related | 11 (13.4%) | 71 (86.6%) |
| Office & Administration | 11 (35.5%) | 20 (64.5%) |
| Total (Category) | 22 (19.5%) | 91 (80.5%) |
| Total (Overall) | 187 (48.1%) | 202 (51.9%) |
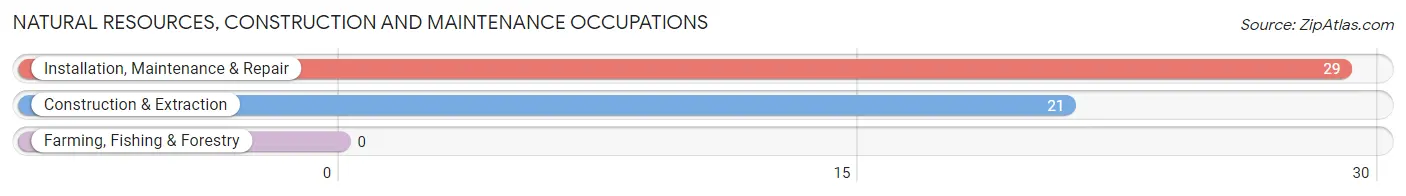
Natural Resources, Construction and Maintenance Occupations
The most common Natural Resources, Construction and Maintenance occupations in Lyons are Installation, Maintenance & Repair (29 | 7.5%), and Construction & Extraction (21 | 5.4%).
Natural Resources, Construction and Maintenance Occupations by Sex
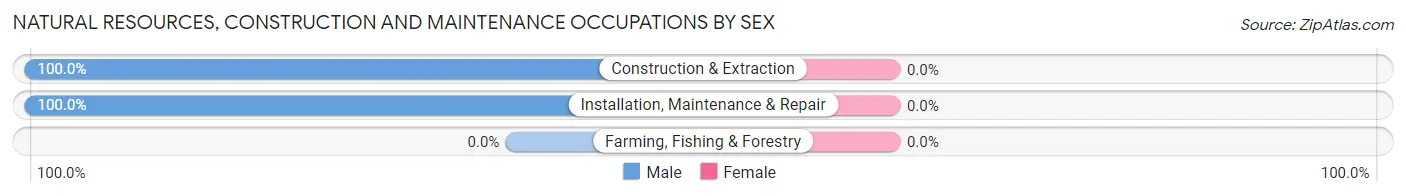
| Occupation | Male | Female |
| Farming, Fishing & Forestry | 0 (0.0%) | 0 (0.0%) |
| Construction & Extraction | 21 (100.0%) | 0 (0.0%) |
| Installation, Maintenance & Repair | 29 (100.0%) | 0 (0.0%) |
| Total (Category) | 50 (100.0%) | 0 (0.0%) |
| Total (Overall) | 187 (48.1%) | 202 (51.9%) |
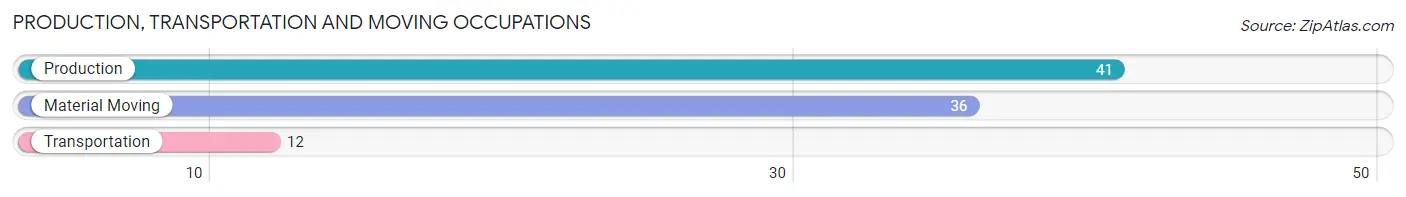
Production, Transportation and Moving Occupations
The most common Production, Transportation and Moving occupations in Lyons are Production (41 | 10.5%), Material Moving (36 | 9.2%), and Transportation (12 | 3.1%).
Production, Transportation and Moving Occupations by Sex
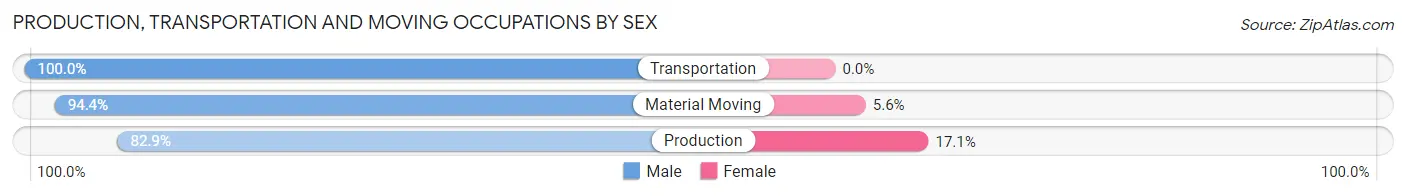
| Occupation | Male | Female |
| Production | 34 (82.9%) | 7 (17.1%) |
| Transportation | 12 (100.0%) | 0 (0.0%) |
| Material Moving | 34 (94.4%) | 2 (5.6%) |
| Total (Category) | 80 (89.9%) | 9 (10.1%) |
| Total (Overall) | 187 (48.1%) | 202 (51.9%) |
Employment Industries by Sex in Lyons
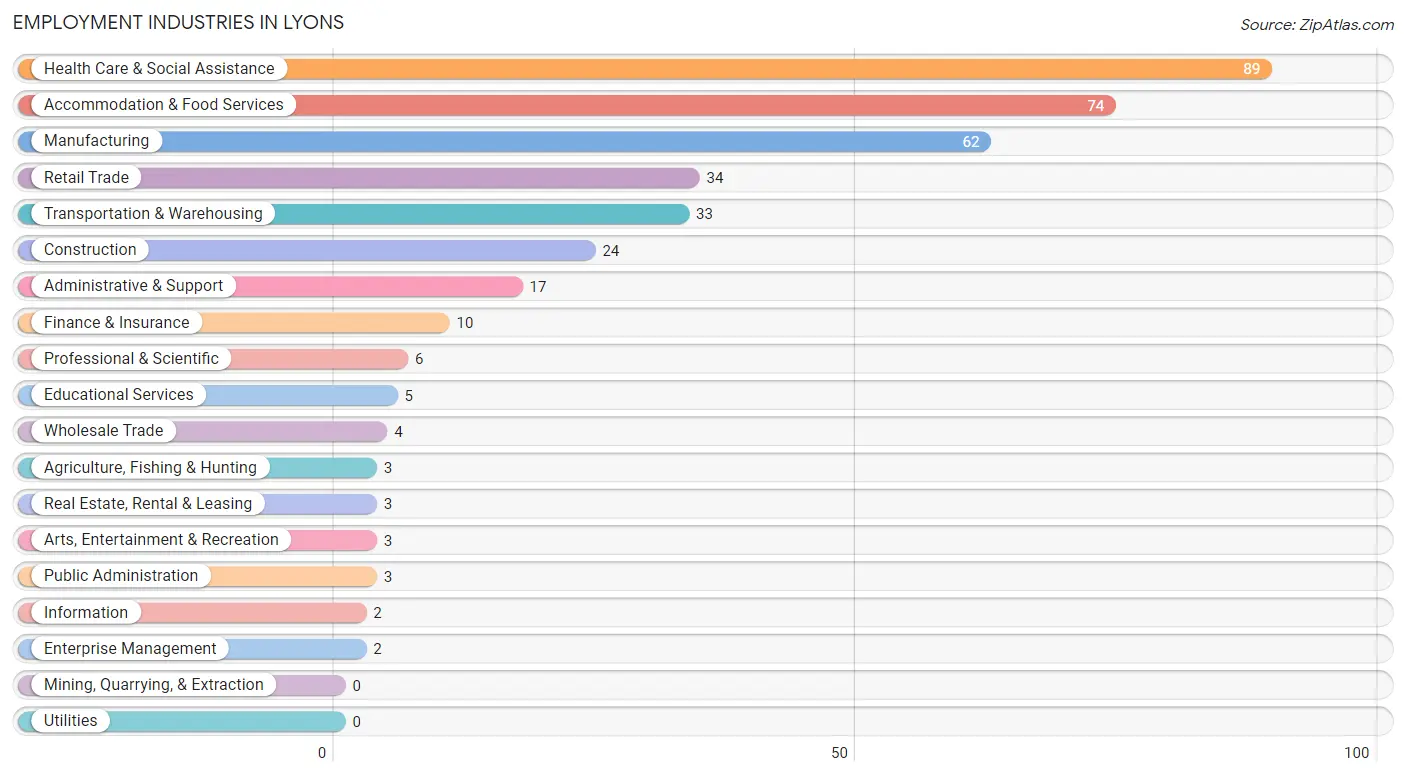
Employment Industries in Lyons
The major employment industries in Lyons include Health Care & Social Assistance (89 | 22.9%), Accommodation & Food Services (74 | 19.0%), Manufacturing (62 | 15.9%), Retail Trade (34 | 8.7%), and Transportation & Warehousing (33 | 8.5%).
Employment Industries by Sex in Lyons
The Lyons industries that see more men than women are Agriculture, Fishing & Hunting (100.0%), Construction (100.0%), and Transportation & Warehousing (100.0%), whereas the industries that tend to have a higher number of women are Real Estate, Rental & Leasing (100.0%), Enterprise Management (100.0%), and Educational Services (100.0%).
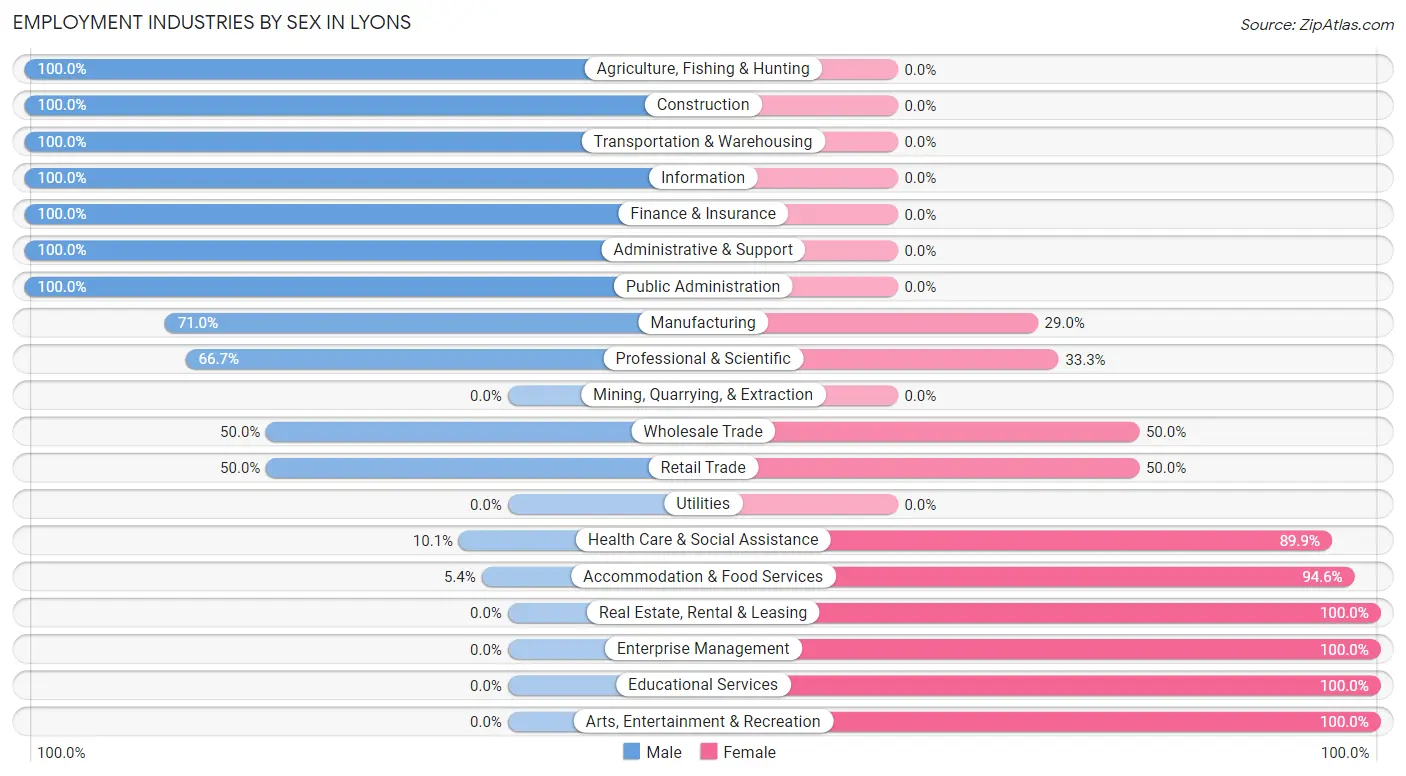
| Industry | Male | Female |
| Agriculture, Fishing & Hunting | 3 (100.0%) | 0 (0.0%) |
| Mining, Quarrying, & Extraction | 0 (0.0%) | 0 (0.0%) |
| Construction | 24 (100.0%) | 0 (0.0%) |
| Manufacturing | 44 (71.0%) | 18 (29.0%) |
| Wholesale Trade | 2 (50.0%) | 2 (50.0%) |
| Retail Trade | 17 (50.0%) | 17 (50.0%) |
| Transportation & Warehousing | 33 (100.0%) | 0 (0.0%) |
| Utilities | 0 (0.0%) | 0 (0.0%) |
| Information | 2 (100.0%) | 0 (0.0%) |
| Finance & Insurance | 10 (100.0%) | 0 (0.0%) |
| Real Estate, Rental & Leasing | 0 (0.0%) | 3 (100.0%) |
| Professional & Scientific | 4 (66.7%) | 2 (33.3%) |
| Enterprise Management | 0 (0.0%) | 2 (100.0%) |
| Administrative & Support | 17 (100.0%) | 0 (0.0%) |
| Educational Services | 0 (0.0%) | 5 (100.0%) |
| Health Care & Social Assistance | 9 (10.1%) | 80 (89.9%) |
| Arts, Entertainment & Recreation | 0 (0.0%) | 3 (100.0%) |
| Accommodation & Food Services | 4 (5.4%) | 70 (94.6%) |
| Public Administration | 3 (100.0%) | 0 (0.0%) |
| Total | 187 (48.1%) | 202 (51.9%) |
Education in Lyons
School Enrollment in Lyons
The most common levels of schooling among the 154 students in Lyons are elementary school (59 | 38.3%), high school (32 | 20.8%), and middle school (21 | 13.6%).
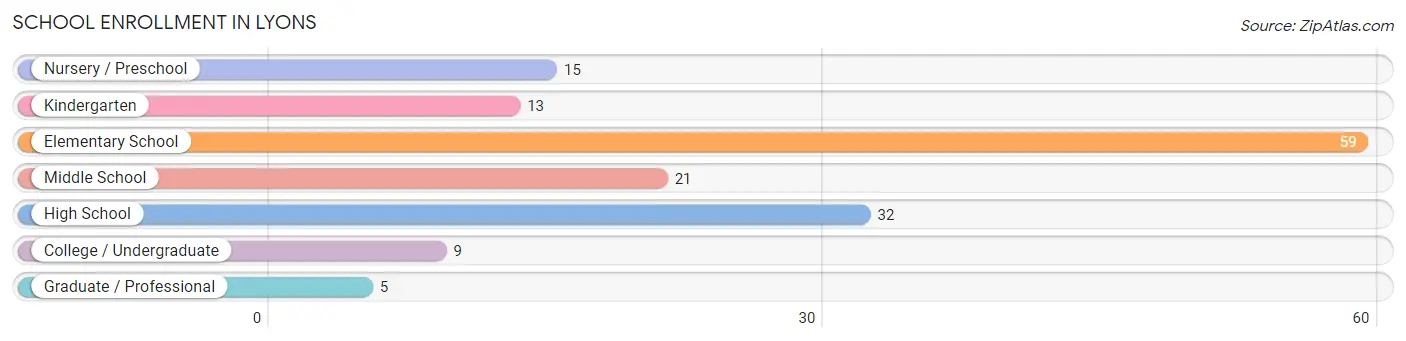
| School Level | # Students | % Students |
| Nursery / Preschool | 15 | 9.7% |
| Kindergarten | 13 | 8.4% |
| Elementary School | 59 | 38.3% |
| Middle School | 21 | 13.6% |
| High School | 32 | 20.8% |
| College / Undergraduate | 9 | 5.8% |
| Graduate / Professional | 5 | 3.3% |
| Total | 154 | 100.0% |
School Enrollment by Age by Funding Source in Lyons
Out of a total of 154 students who are enrolled in schools in Lyons, 8 (5.2%) attend a private institution, while the remaining 146 (94.8%) are enrolled in public schools. The age group of 35 years and over has the highest likelihood of being enrolled in private schools, with 5 (100.0% in the age bracket) enrolled. Conversely, the age group of 3 to 4 year olds has the lowest likelihood of being enrolled in a private school, with 10 (100.0% in the age bracket) attending a public institution.
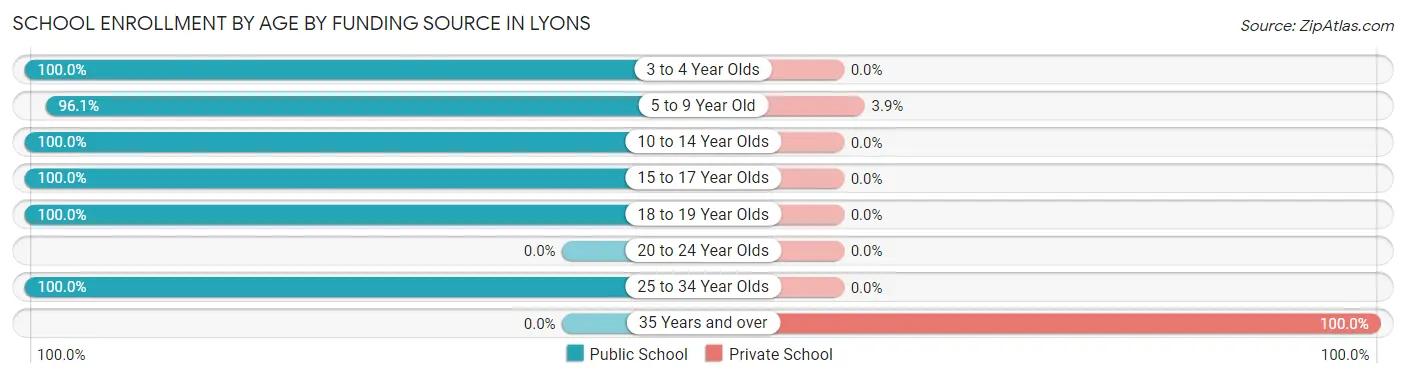
| Age Bracket | Public School | Private School |
| 3 to 4 Year Olds | 10 (100.0%) | 0 (0.0%) |
| 5 to 9 Year Old | 74 (96.1%) | 3 (3.9%) |
| 10 to 14 Year Olds | 21 (100.0%) | 0 (0.0%) |
| 15 to 17 Year Olds | 32 (100.0%) | 0 (0.0%) |
| 18 to 19 Year Olds | 4 (100.0%) | 0 (0.0%) |
| 20 to 24 Year Olds | 0 (0.0%) | 0 (0.0%) |
| 25 to 34 Year Olds | 5 (100.0%) | 0 (0.0%) |
| 35 Years and over | 0 (0.0%) | 5 (100.0%) |
| Total | 146 (94.8%) | 8 (5.2%) |
Educational Attainment by Field of Study in Lyons
Science & technology (28 | 38.4%), education (8 | 11.0%), business (7 | 9.6%), engineering (6 | 8.2%), and bio, nature & agricultural (5 | 6.9%) are the most common fields of study among 73 individuals in Lyons who have obtained a bachelor's degree or higher.
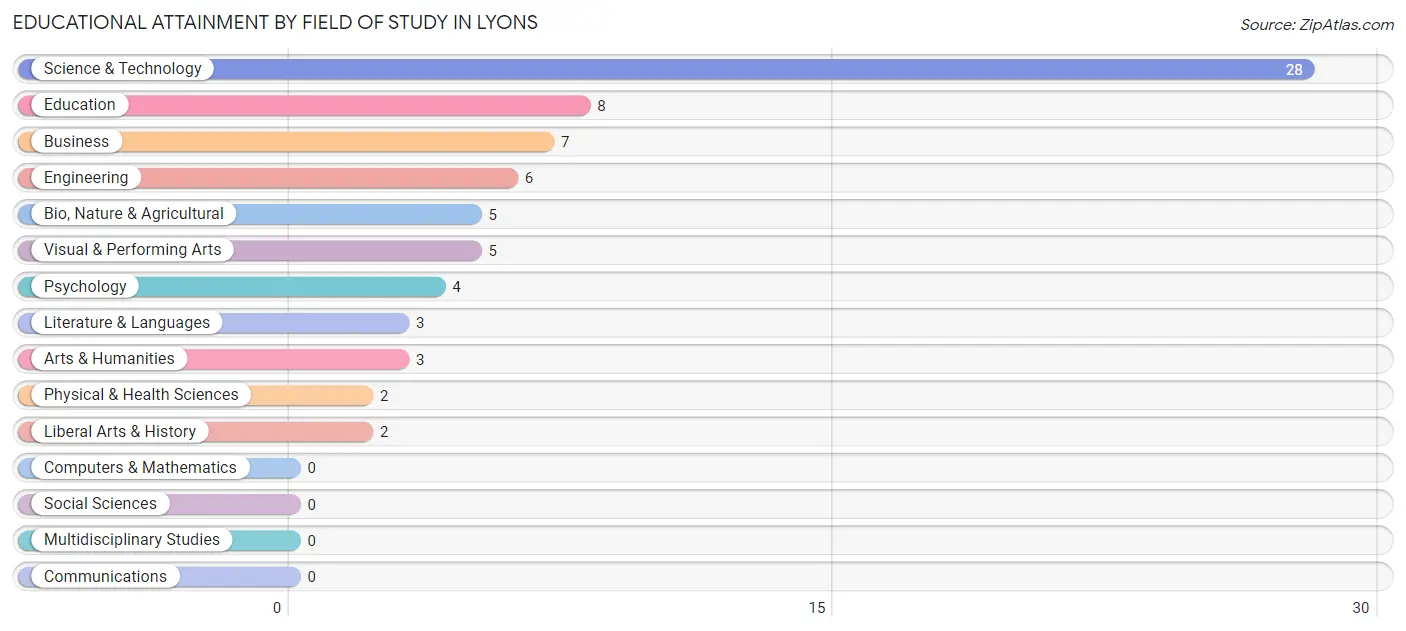
| Field of Study | # Graduates | % Graduates |
| Computers & Mathematics | 0 | 0.0% |
| Bio, Nature & Agricultural | 5 | 6.9% |
| Physical & Health Sciences | 2 | 2.7% |
| Psychology | 4 | 5.5% |
| Social Sciences | 0 | 0.0% |
| Engineering | 6 | 8.2% |
| Multidisciplinary Studies | 0 | 0.0% |
| Science & Technology | 28 | 38.4% |
| Business | 7 | 9.6% |
| Education | 8 | 11.0% |
| Literature & Languages | 3 | 4.1% |
| Liberal Arts & History | 2 | 2.7% |
| Visual & Performing Arts | 5 | 6.9% |
| Communications | 0 | 0.0% |
| Arts & Humanities | 3 | 4.1% |
| Total | 73 | 100.0% |
Transportation & Commute in Lyons
Vehicle Availability by Sex in Lyons
The most prevalent vehicle ownership categories in Lyons are males with 2 vehicles (101, accounting for 54.9%) and females with 2 vehicles (82, making up 55.5%).
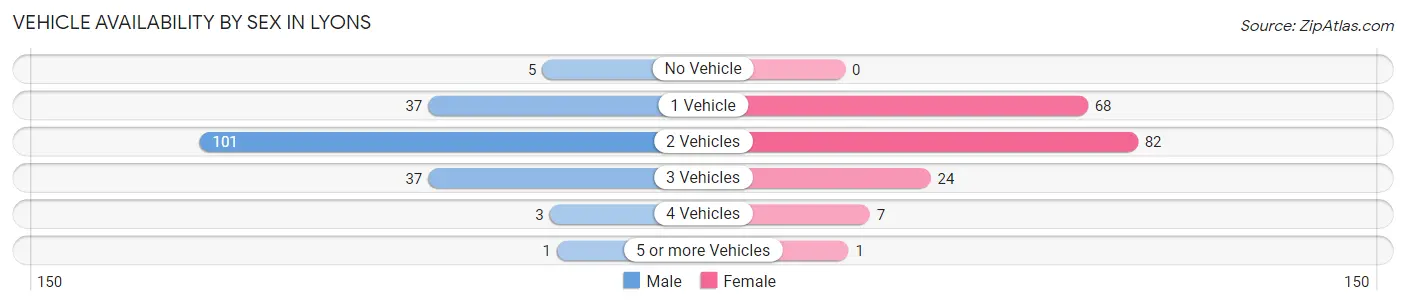
| Vehicles Available | Male | Female |
| No Vehicle | 5 (2.7%) | 0 (0.0%) |
| 1 Vehicle | 37 (20.1%) | 68 (37.4%) |
| 2 Vehicles | 101 (54.9%) | 82 (45.1%) |
| 3 Vehicles | 37 (20.1%) | 24 (13.2%) |
| 4 Vehicles | 3 (1.6%) | 7 (3.8%) |
| 5 or more Vehicles | 1 (0.5%) | 1 (0.5%) |
| Total | 184 (100.0%) | 182 (100.0%) |
Commute Time in Lyons
The most frequently occuring commute durations in Lyons are 5 to 9 minutes (61 commuters, 17.1%), 40 to 44 minutes (51 commuters, 14.3%), and less than 5 minutes (40 commuters, 11.2%).
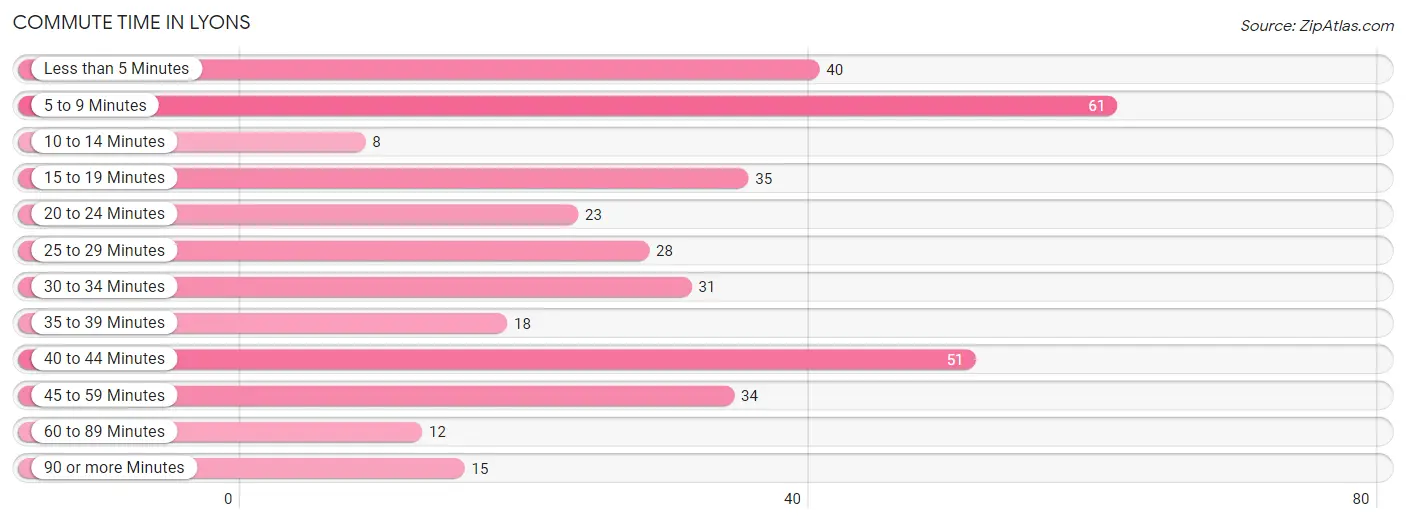
| Commute Time | # Commuters | % Commuters |
| Less than 5 Minutes | 40 | 11.2% |
| 5 to 9 Minutes | 61 | 17.1% |
| 10 to 14 Minutes | 8 | 2.2% |
| 15 to 19 Minutes | 35 | 9.8% |
| 20 to 24 Minutes | 23 | 6.5% |
| 25 to 29 Minutes | 28 | 7.9% |
| 30 to 34 Minutes | 31 | 8.7% |
| 35 to 39 Minutes | 18 | 5.1% |
| 40 to 44 Minutes | 51 | 14.3% |
| 45 to 59 Minutes | 34 | 9.6% |
| 60 to 89 Minutes | 12 | 3.4% |
| 90 or more Minutes | 15 | 4.2% |
Commute Time by Sex in Lyons
The most common commute times in Lyons are 40 to 44 minutes (37 commuters, 20.2%) for males and 5 to 9 minutes (60 commuters, 34.7%) for females.
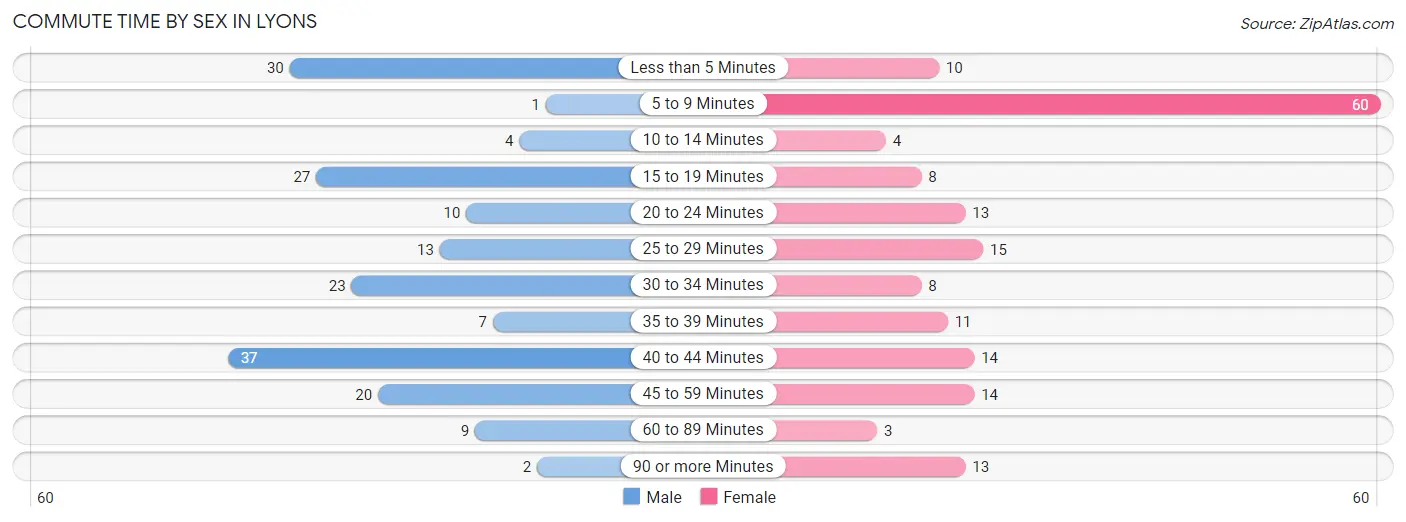
| Commute Time | Male | Female |
| Less than 5 Minutes | 30 (16.4%) | 10 (5.8%) |
| 5 to 9 Minutes | 1 (0.5%) | 60 (34.7%) |
| 10 to 14 Minutes | 4 (2.2%) | 4 (2.3%) |
| 15 to 19 Minutes | 27 (14.7%) | 8 (4.6%) |
| 20 to 24 Minutes | 10 (5.5%) | 13 (7.5%) |
| 25 to 29 Minutes | 13 (7.1%) | 15 (8.7%) |
| 30 to 34 Minutes | 23 (12.6%) | 8 (4.6%) |
| 35 to 39 Minutes | 7 (3.8%) | 11 (6.4%) |
| 40 to 44 Minutes | 37 (20.2%) | 14 (8.1%) |
| 45 to 59 Minutes | 20 (10.9%) | 14 (8.1%) |
| 60 to 89 Minutes | 9 (4.9%) | 3 (1.7%) |
| 90 or more Minutes | 2 (1.1%) | 13 (7.5%) |
Time of Departure to Work by Sex in Lyons
The most frequent times of departure to work in Lyons are 5:30 AM to 5:59 AM (36, 19.7%) for males and 8:30 AM to 8:59 AM (60, 34.7%) for females.
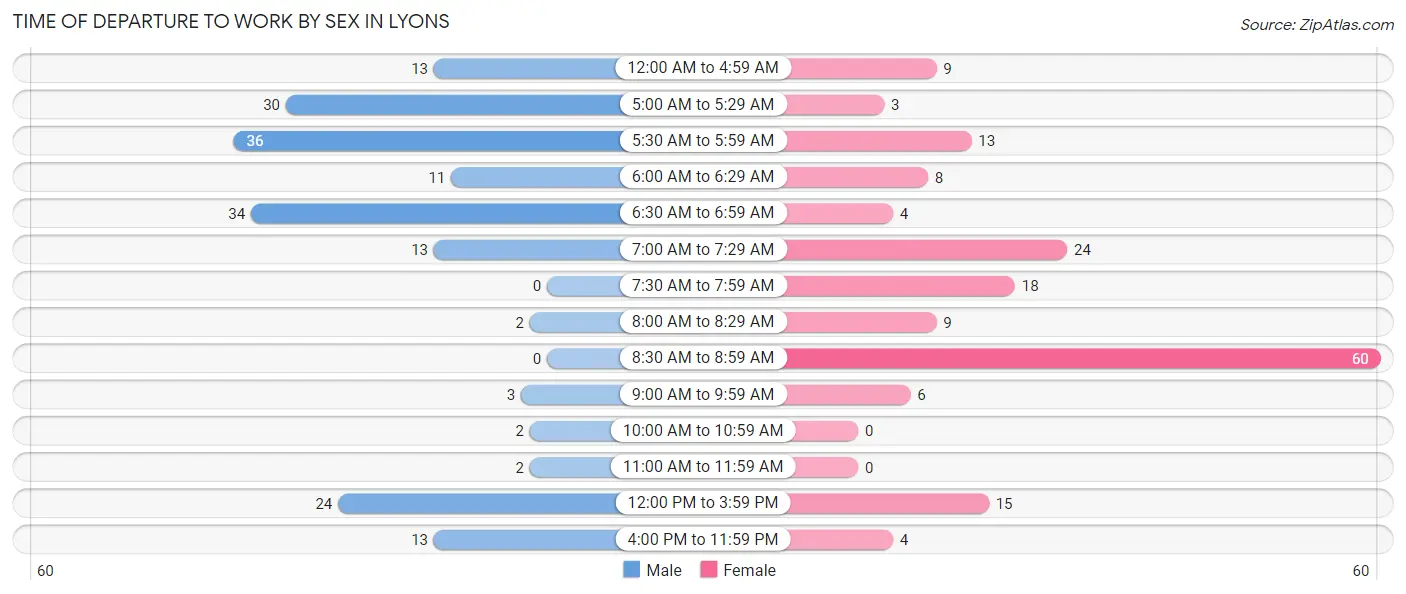
| Time of Departure | Male | Female |
| 12:00 AM to 4:59 AM | 13 (7.1%) | 9 (5.2%) |
| 5:00 AM to 5:29 AM | 30 (16.4%) | 3 (1.7%) |
| 5:30 AM to 5:59 AM | 36 (19.7%) | 13 (7.5%) |
| 6:00 AM to 6:29 AM | 11 (6.0%) | 8 (4.6%) |
| 6:30 AM to 6:59 AM | 34 (18.6%) | 4 (2.3%) |
| 7:00 AM to 7:29 AM | 13 (7.1%) | 24 (13.9%) |
| 7:30 AM to 7:59 AM | 0 (0.0%) | 18 (10.4%) |
| 8:00 AM to 8:29 AM | 2 (1.1%) | 9 (5.2%) |
| 8:30 AM to 8:59 AM | 0 (0.0%) | 60 (34.7%) |
| 9:00 AM to 9:59 AM | 3 (1.6%) | 6 (3.5%) |
| 10:00 AM to 10:59 AM | 2 (1.1%) | 0 (0.0%) |
| 11:00 AM to 11:59 AM | 2 (1.1%) | 0 (0.0%) |
| 12:00 PM to 3:59 PM | 24 (13.1%) | 15 (8.7%) |
| 4:00 PM to 11:59 PM | 13 (7.1%) | 4 (2.3%) |
| Total | 183 (100.0%) | 173 (100.0%) |
Housing Occupancy in Lyons
Occupancy by Ownership in Lyons
Of the total 346 dwellings in Lyons, owner-occupied units account for 235 (67.9%), while renter-occupied units make up 111 (32.1%).
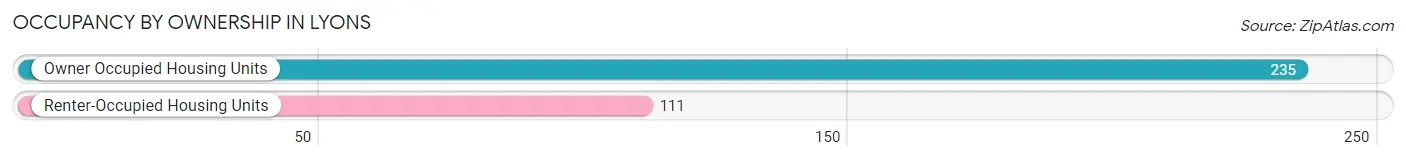
| Occupancy | # Housing Units | % Housing Units |
| Owner Occupied Housing Units | 235 | 67.9% |
| Renter-Occupied Housing Units | 111 | 32.1% |
| Total Occupied Housing Units | 346 | 100.0% |
Occupancy by Household Size in Lyons
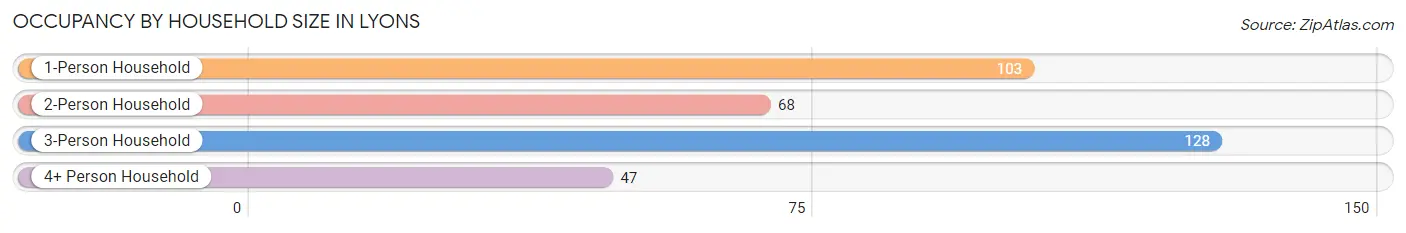
| Household Size | # Housing Units | % Housing Units |
| 1-Person Household | 103 | 29.8% |
| 2-Person Household | 68 | 19.7% |
| 3-Person Household | 128 | 37.0% |
| 4+ Person Household | 47 | 13.6% |
| Total Housing Units | 346 | 100.0% |
Occupancy by Ownership by Household Size in Lyons
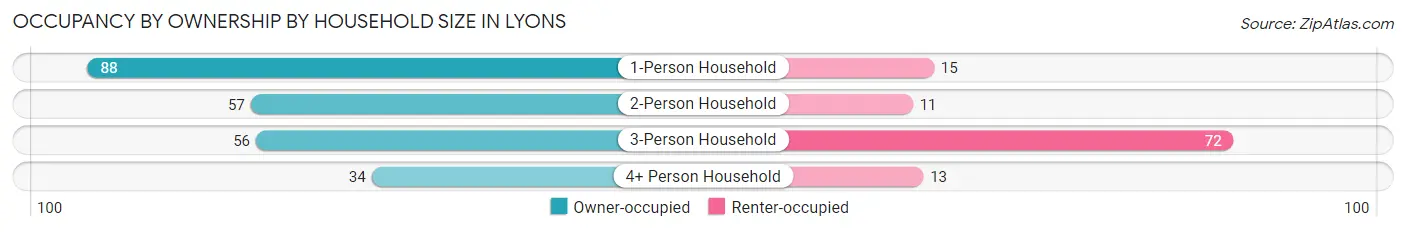
| Household Size | Owner-occupied | Renter-occupied |
| 1-Person Household | 88 (85.4%) | 15 (14.6%) |
| 2-Person Household | 57 (83.8%) | 11 (16.2%) |
| 3-Person Household | 56 (43.8%) | 72 (56.2%) |
| 4+ Person Household | 34 (72.3%) | 13 (27.7%) |
| Total Housing Units | 235 (67.9%) | 111 (32.1%) |
Occupancy by Educational Attainment in Lyons
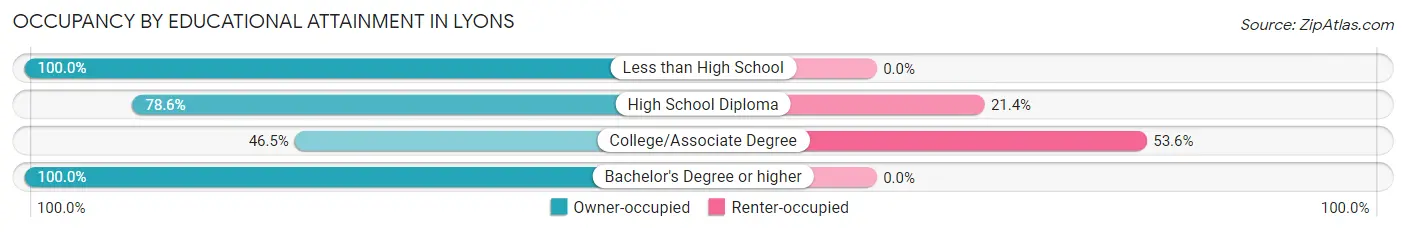
| Household Size | Owner-occupied | Renter-occupied |
| Less than High School | 19 (100.0%) | 0 (0.0%) |
| High School Diploma | 103 (78.6%) | 28 (21.4%) |
| College/Associate Degree | 72 (46.5%) | 83 (53.5%) |
| Bachelor's Degree or higher | 41 (100.0%) | 0 (0.0%) |
Occupancy by Age of Householder in Lyons
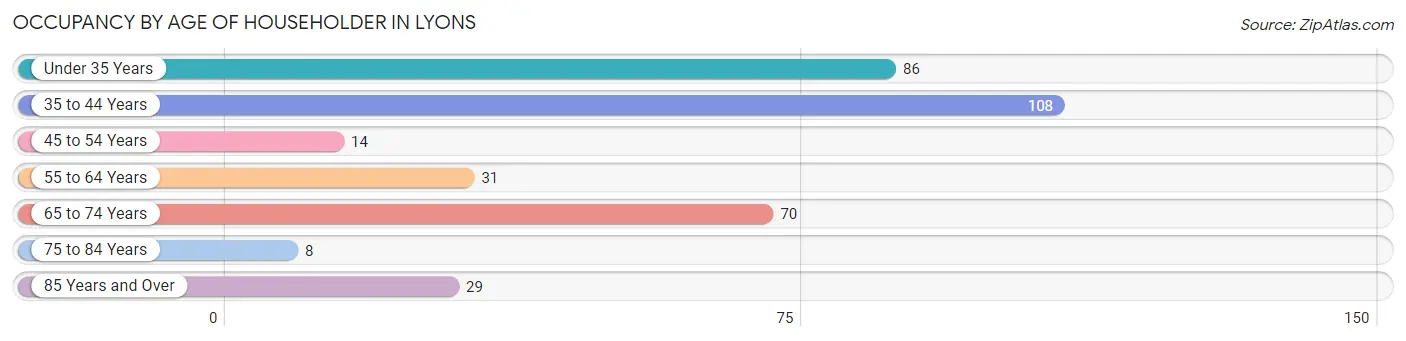
| Age Bracket | # Households | % Households |
| Under 35 Years | 86 | 24.9% |
| 35 to 44 Years | 108 | 31.2% |
| 45 to 54 Years | 14 | 4.1% |
| 55 to 64 Years | 31 | 9.0% |
| 65 to 74 Years | 70 | 20.2% |
| 75 to 84 Years | 8 | 2.3% |
| 85 Years and Over | 29 | 8.4% |
| Total | 346 | 100.0% |
Housing Finances in Lyons
Median Income by Occupancy in Lyons
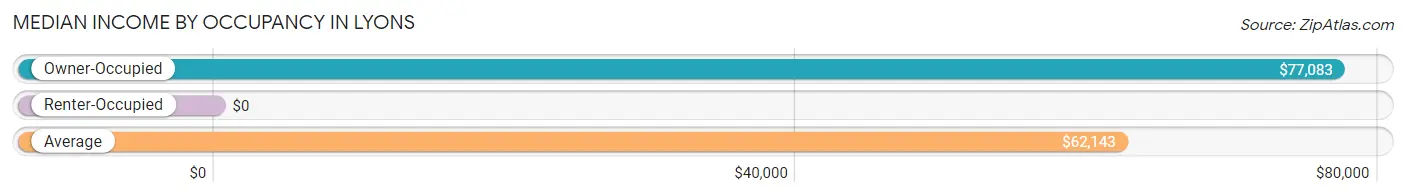
| Occupancy Type | # Households | Median Income |
| Owner-Occupied | 235 (67.9%) | $77,083 |
| Renter-Occupied | 111 (32.1%) | $0 |
| Average | 346 (100.0%) | $62,143 |
Occupancy by Householder Income Bracket in Lyons
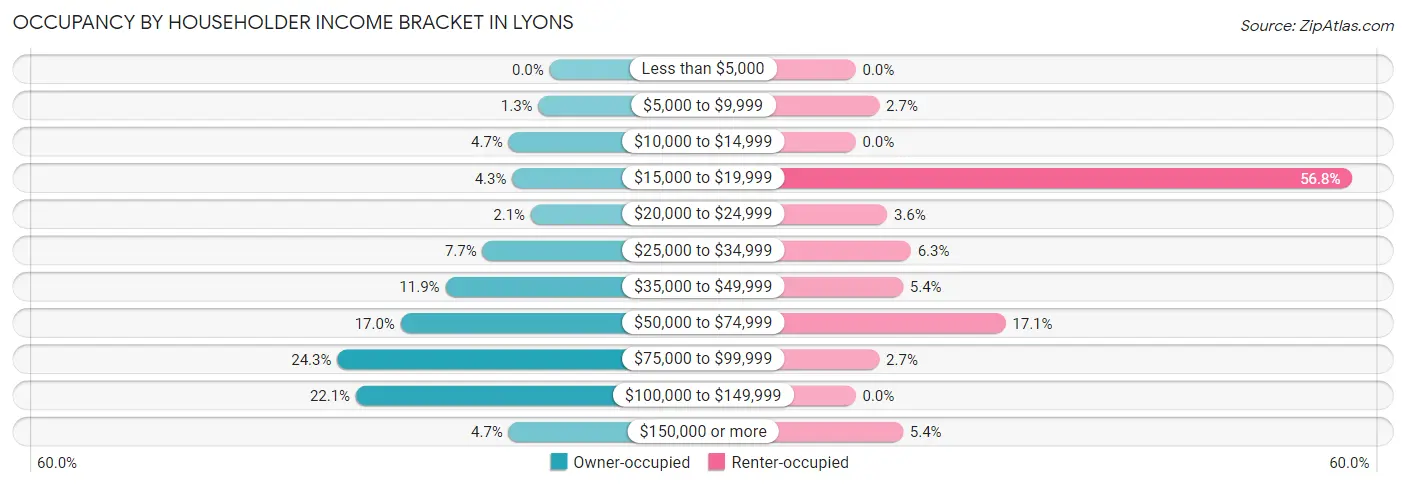
| Income Bracket | Owner-occupied | Renter-occupied |
| Less than $5,000 | 0 (0.0%) | 0 (0.0%) |
| $5,000 to $9,999 | 3 (1.3%) | 3 (2.7%) |
| $10,000 to $14,999 | 11 (4.7%) | 0 (0.0%) |
| $15,000 to $19,999 | 10 (4.3%) | 63 (56.8%) |
| $20,000 to $24,999 | 5 (2.1%) | 4 (3.6%) |
| $25,000 to $34,999 | 18 (7.7%) | 7 (6.3%) |
| $35,000 to $49,999 | 28 (11.9%) | 6 (5.4%) |
| $50,000 to $74,999 | 40 (17.0%) | 19 (17.1%) |
| $75,000 to $99,999 | 57 (24.3%) | 3 (2.7%) |
| $100,000 to $149,999 | 52 (22.1%) | 0 (0.0%) |
| $150,000 or more | 11 (4.7%) | 6 (5.4%) |
| Total | 235 (100.0%) | 111 (100.0%) |
Monthly Housing Cost Tiers in Lyons
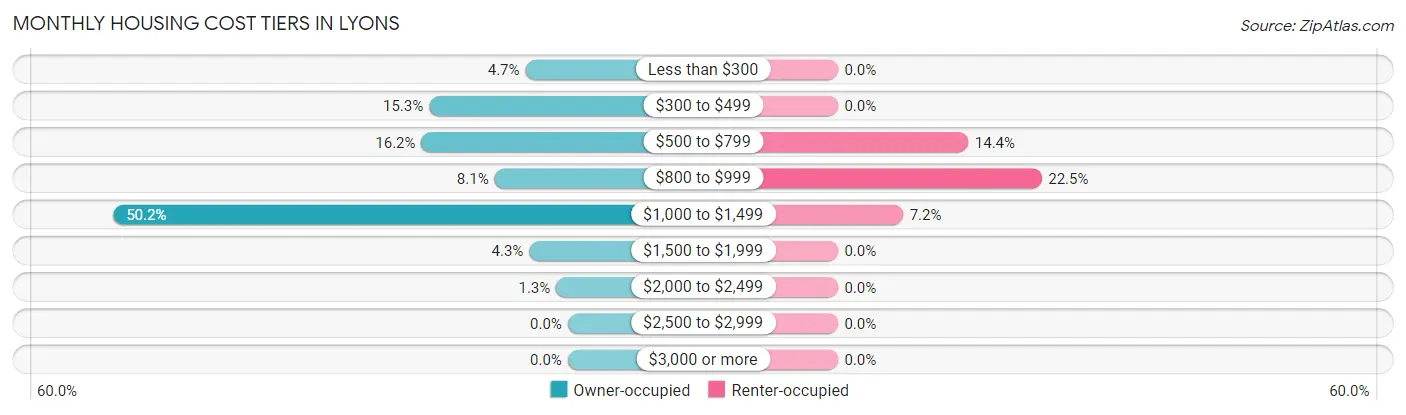
| Monthly Cost | Owner-occupied | Renter-occupied |
| Less than $300 | 11 (4.7%) | 0 (0.0%) |
| $300 to $499 | 36 (15.3%) | 0 (0.0%) |
| $500 to $799 | 38 (16.2%) | 16 (14.4%) |
| $800 to $999 | 19 (8.1%) | 25 (22.5%) |
| $1,000 to $1,499 | 118 (50.2%) | 8 (7.2%) |
| $1,500 to $1,999 | 10 (4.3%) | 0 (0.0%) |
| $2,000 to $2,499 | 3 (1.3%) | 0 (0.0%) |
| $2,500 to $2,999 | 0 (0.0%) | 0 (0.0%) |
| $3,000 or more | 0 (0.0%) | 0 (0.0%) |
| Total | 235 (100.0%) | 111 (100.0%) |
Physical Housing Characteristics in Lyons
Housing Structures in Lyons
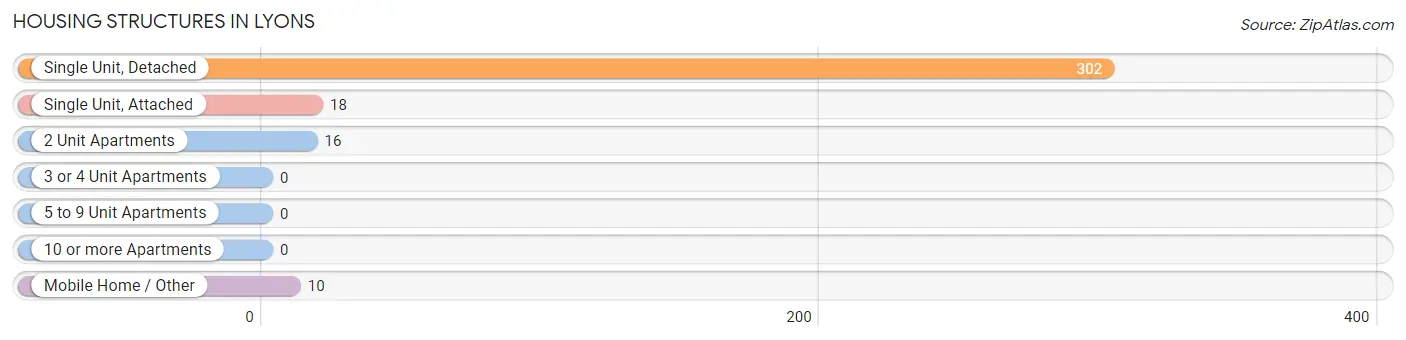
| Structure Type | # Housing Units | % Housing Units |
| Single Unit, Detached | 302 | 87.3% |
| Single Unit, Attached | 18 | 5.2% |
| 2 Unit Apartments | 16 | 4.6% |
| 3 or 4 Unit Apartments | 0 | 0.0% |
| 5 to 9 Unit Apartments | 0 | 0.0% |
| 10 or more Apartments | 0 | 0.0% |
| Mobile Home / Other | 10 | 2.9% |
| Total | 346 | 100.0% |
Housing Structures by Occupancy in Lyons
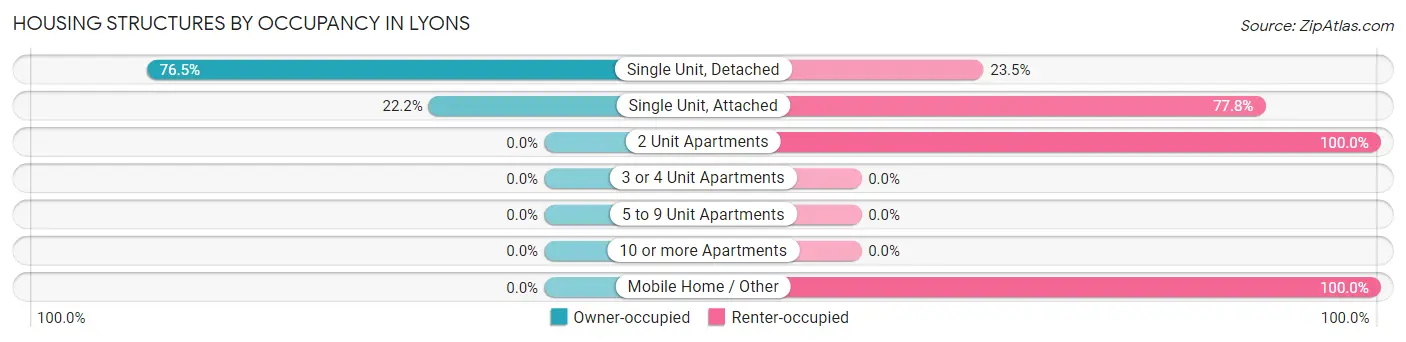
| Structure Type | Owner-occupied | Renter-occupied |
| Single Unit, Detached | 231 (76.5%) | 71 (23.5%) |
| Single Unit, Attached | 4 (22.2%) | 14 (77.8%) |
| 2 Unit Apartments | 0 (0.0%) | 16 (100.0%) |
| 3 or 4 Unit Apartments | 0 (0.0%) | 0 (0.0%) |
| 5 to 9 Unit Apartments | 0 (0.0%) | 0 (0.0%) |
| 10 or more Apartments | 0 (0.0%) | 0 (0.0%) |
| Mobile Home / Other | 0 (0.0%) | 10 (100.0%) |
| Total | 235 (67.9%) | 111 (32.1%) |
Housing Structures by Number of Rooms in Lyons
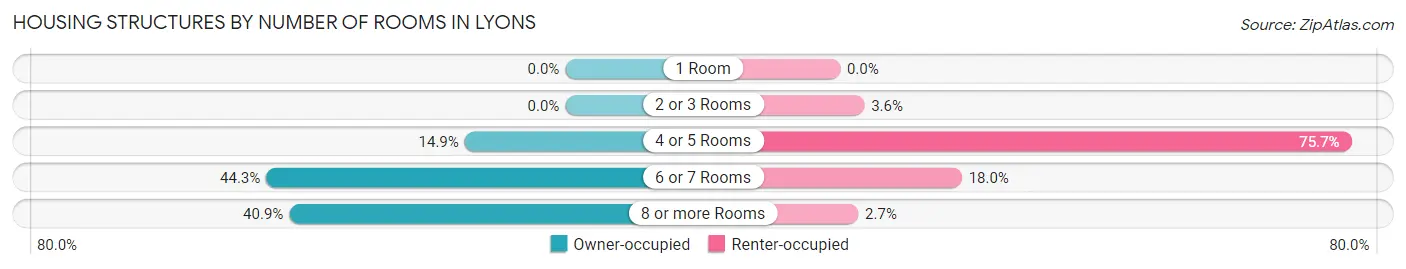
| Number of Rooms | Owner-occupied | Renter-occupied |
| 1 Room | 0 (0.0%) | 0 (0.0%) |
| 2 or 3 Rooms | 0 (0.0%) | 4 (3.6%) |
| 4 or 5 Rooms | 35 (14.9%) | 84 (75.7%) |
| 6 or 7 Rooms | 104 (44.3%) | 20 (18.0%) |
| 8 or more Rooms | 96 (40.8%) | 3 (2.7%) |
| Total | 235 (100.0%) | 111 (100.0%) |
Housing Structure by Heating Type in Lyons
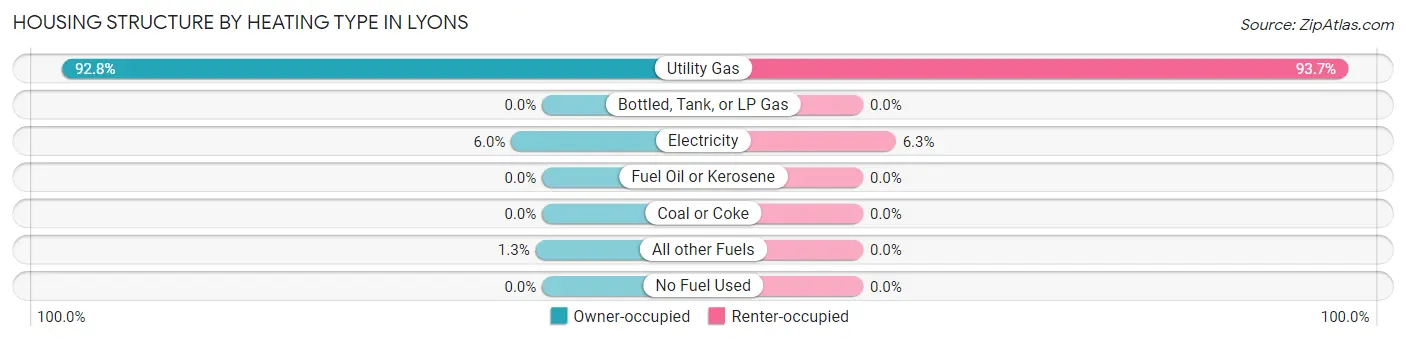
| Heating Type | Owner-occupied | Renter-occupied |
| Utility Gas | 218 (92.8%) | 104 (93.7%) |
| Bottled, Tank, or LP Gas | 0 (0.0%) | 0 (0.0%) |
| Electricity | 14 (6.0%) | 7 (6.3%) |
| Fuel Oil or Kerosene | 0 (0.0%) | 0 (0.0%) |
| Coal or Coke | 0 (0.0%) | 0 (0.0%) |
| All other Fuels | 3 (1.3%) | 0 (0.0%) |
| No Fuel Used | 0 (0.0%) | 0 (0.0%) |
| Total | 235 (100.0%) | 111 (100.0%) |
Household Vehicle Usage in Lyons
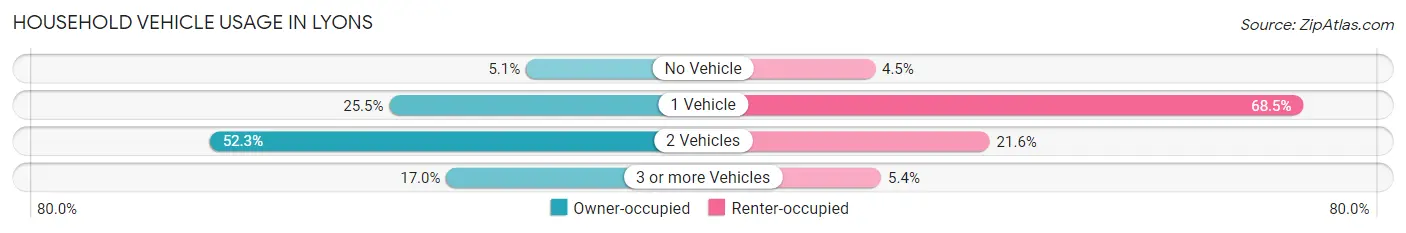
| Vehicles per Household | Owner-occupied | Renter-occupied |
| No Vehicle | 12 (5.1%) | 5 (4.5%) |
| 1 Vehicle | 60 (25.5%) | 76 (68.5%) |
| 2 Vehicles | 123 (52.3%) | 24 (21.6%) |
| 3 or more Vehicles | 40 (17.0%) | 6 (5.4%) |
| Total | 235 (100.0%) | 111 (100.0%) |
Real Estate & Mortgages in Lyons
Real Estate and Mortgage Overview in Lyons
| Characteristic | Without Mortgage | With Mortgage |
| Housing Units | 59 | 176 |
| Median Property Value | $122,100 | $132,100 |
| Median Household Income | $65,417 | $10 |
| Monthly Housing Costs | $413 | $0 |
| Real Estate Taxes | $1,604 | $0 |
Property Value by Mortgage Status in Lyons
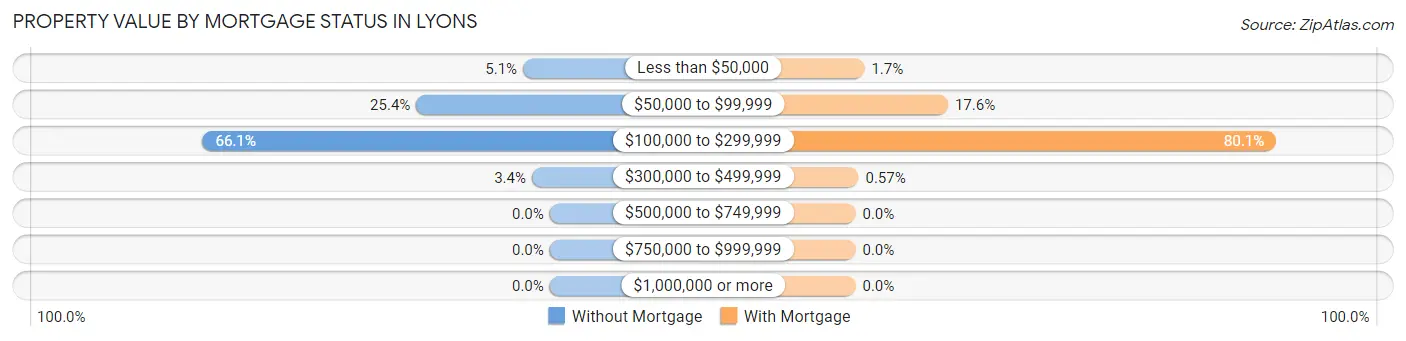
| Property Value | Without Mortgage | With Mortgage |
| Less than $50,000 | 3 (5.1%) | 3 (1.7%) |
| $50,000 to $99,999 | 15 (25.4%) | 31 (17.6%) |
| $100,000 to $299,999 | 39 (66.1%) | 141 (80.1%) |
| $300,000 to $499,999 | 2 (3.4%) | 1 (0.6%) |
| $500,000 to $749,999 | 0 (0.0%) | 0 (0.0%) |
| $750,000 to $999,999 | 0 (0.0%) | 0 (0.0%) |
| $1,000,000 or more | 0 (0.0%) | 0 (0.0%) |
| Total | 59 (100.0%) | 176 (100.0%) |
Household Income by Mortgage Status in Lyons
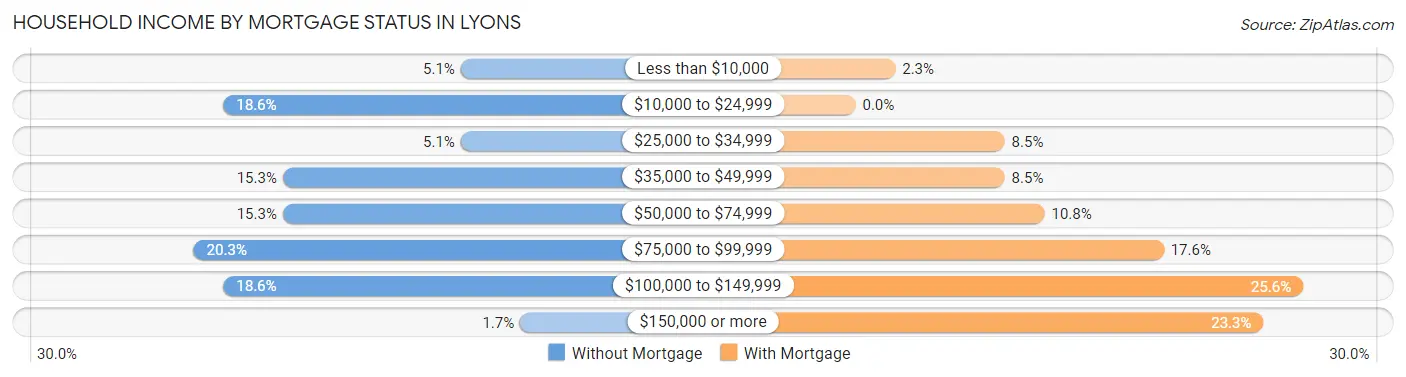
| Household Income | Without Mortgage | With Mortgage |
| Less than $10,000 | 3 (5.1%) | 4 (2.3%) |
| $10,000 to $24,999 | 11 (18.6%) | 0 (0.0%) |
| $25,000 to $34,999 | 3 (5.1%) | 15 (8.5%) |
| $35,000 to $49,999 | 9 (15.2%) | 15 (8.5%) |
| $50,000 to $74,999 | 9 (15.2%) | 19 (10.8%) |
| $75,000 to $99,999 | 12 (20.3%) | 31 (17.6%) |
| $100,000 to $149,999 | 11 (18.6%) | 45 (25.6%) |
| $150,000 or more | 1 (1.7%) | 41 (23.3%) |
| Total | 59 (100.0%) | 176 (100.0%) |
Property Value to Household Income Ratio in Lyons
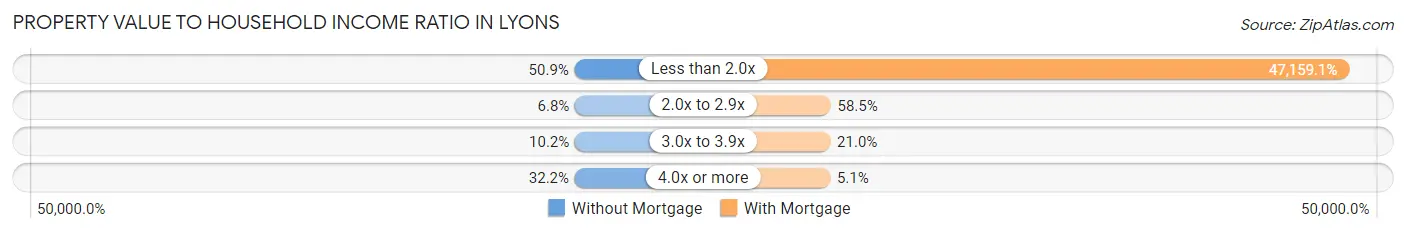
| Value-to-Income Ratio | Without Mortgage | With Mortgage |
| Less than 2.0x | 30 (50.8%) | 83,000 (47,159.1%) |
| 2.0x to 2.9x | 4 (6.8%) | 103 (58.5%) |
| 3.0x to 3.9x | 6 (10.2%) | 37 (21.0%) |
| 4.0x or more | 19 (32.2%) | 9 (5.1%) |
| Total | 59 (100.0%) | 176 (100.0%) |
Real Estate Taxes by Mortgage Status in Lyons
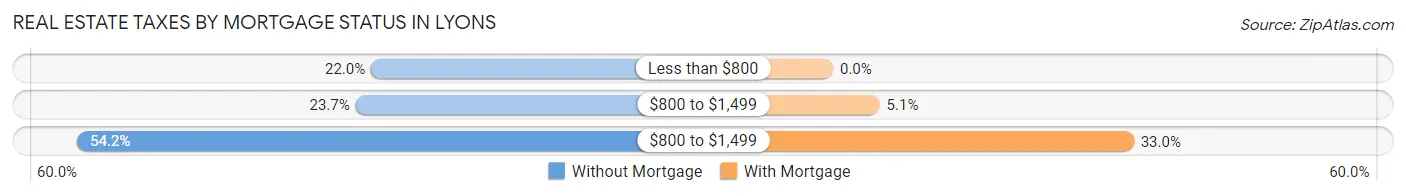
| Property Taxes | Without Mortgage | With Mortgage |
| Less than $800 | 13 (22.0%) | 0 (0.0%) |
| $800 to $1,499 | 14 (23.7%) | 9 (5.1%) |
| $800 to $1,499 | 32 (54.2%) | 58 (33.0%) |
| Total | 59 (100.0%) | 176 (100.0%) |
Health & Disability in Lyons
Health Insurance Coverage by Age in Lyons
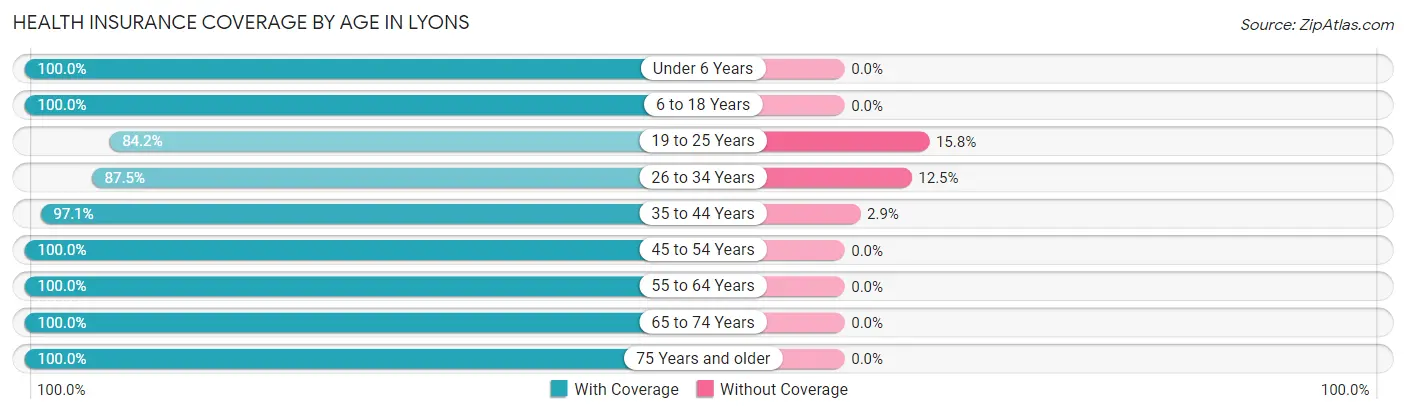
| Age Bracket | With Coverage | Without Coverage |
| Under 6 Years | 103 (100.0%) | 0 (0.0%) |
| 6 to 18 Years | 120 (100.0%) | 0 (0.0%) |
| 19 to 25 Years | 32 (84.2%) | 6 (15.8%) |
| 26 to 34 Years | 133 (87.5%) | 19 (12.5%) |
| 35 to 44 Years | 132 (97.1%) | 4 (2.9%) |
| 45 to 54 Years | 45 (100.0%) | 0 (0.0%) |
| 55 to 64 Years | 56 (100.0%) | 0 (0.0%) |
| 65 to 74 Years | 92 (100.0%) | 0 (0.0%) |
| 75 Years and older | 43 (100.0%) | 0 (0.0%) |
| Total | 756 (96.3%) | 29 (3.7%) |
Health Insurance Coverage by Citizenship Status in Lyons
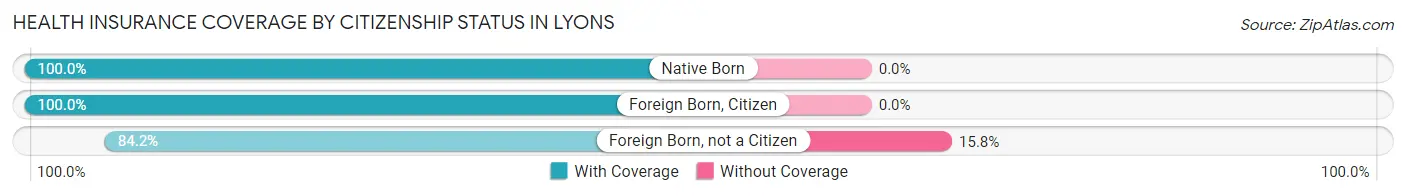
| Citizenship Status | With Coverage | Without Coverage |
| Native Born | 103 (100.0%) | 0 (0.0%) |
| Foreign Born, Citizen | 120 (100.0%) | 0 (0.0%) |
| Foreign Born, not a Citizen | 32 (84.2%) | 6 (15.8%) |
Health Insurance Coverage by Household Income in Lyons
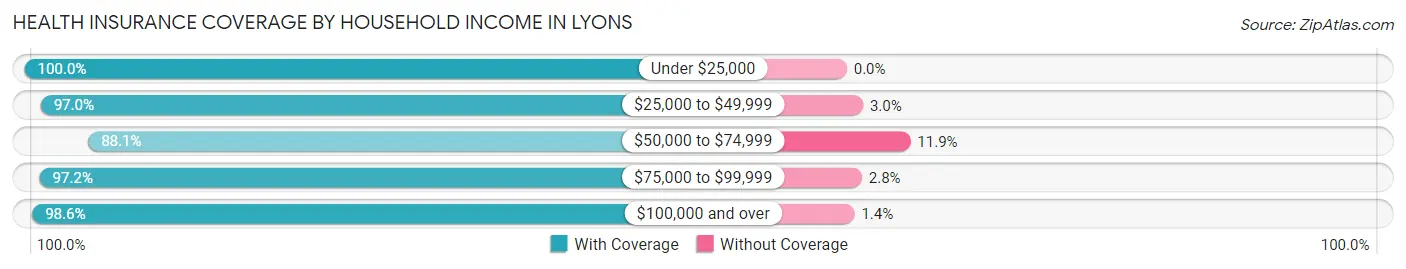
| Household Income | With Coverage | Without Coverage |
| Under $25,000 | 151 (100.0%) | 0 (0.0%) |
| $25,000 to $49,999 | 128 (97.0%) | 4 (3.0%) |
| $50,000 to $74,999 | 133 (88.1%) | 18 (11.9%) |
| $75,000 to $99,999 | 138 (97.2%) | 4 (2.8%) |
| $100,000 and over | 206 (98.6%) | 3 (1.4%) |
Public vs Private Health Insurance Coverage by Age in Lyons
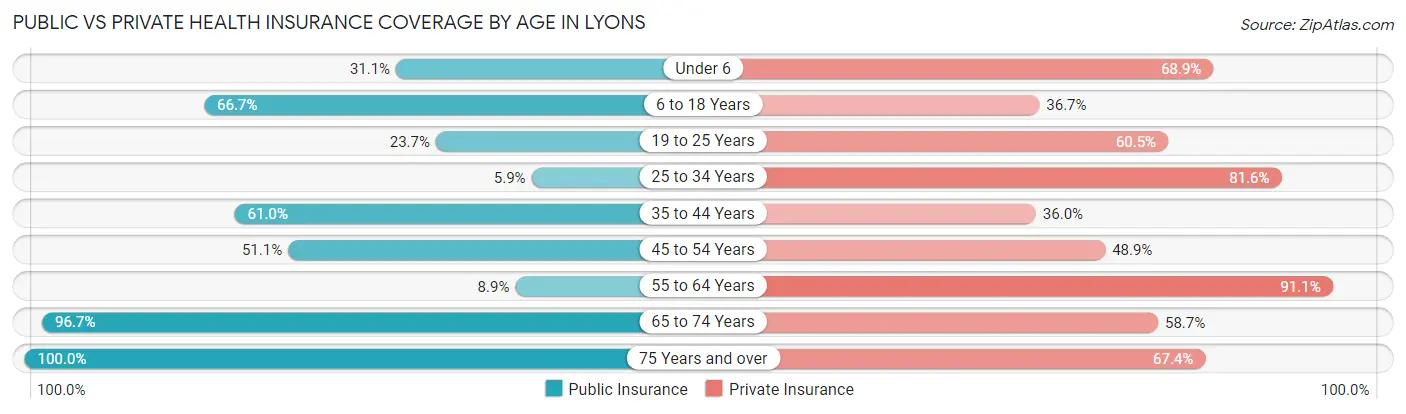
| Age Bracket | Public Insurance | Private Insurance |
| Under 6 | 32 (31.1%) | 71 (68.9%) |
| 6 to 18 Years | 80 (66.7%) | 44 (36.7%) |
| 19 to 25 Years | 9 (23.7%) | 23 (60.5%) |
| 25 to 34 Years | 9 (5.9%) | 124 (81.6%) |
| 35 to 44 Years | 83 (61.0%) | 49 (36.0%) |
| 45 to 54 Years | 23 (51.1%) | 22 (48.9%) |
| 55 to 64 Years | 5 (8.9%) | 51 (91.1%) |
| 65 to 74 Years | 89 (96.7%) | 54 (58.7%) |
| 75 Years and over | 43 (100.0%) | 29 (67.4%) |
| Total | 373 (47.5%) | 467 (59.5%) |
Disability Status by Sex by Age in Lyons
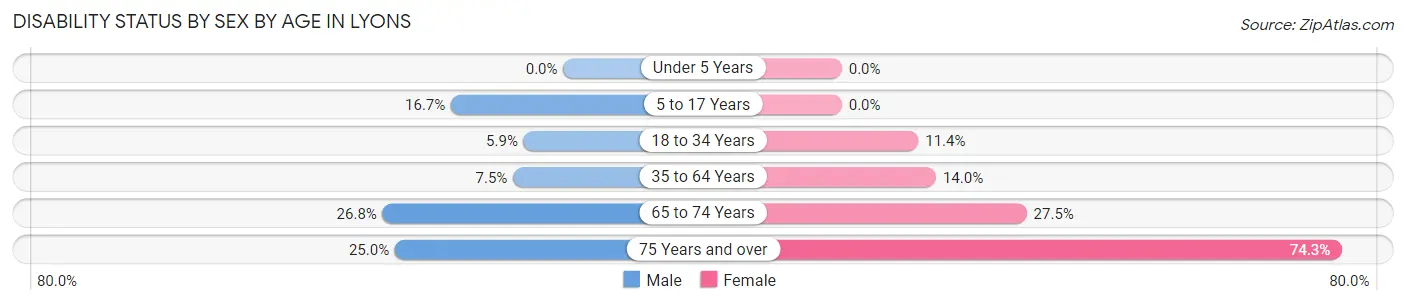
| Age Bracket | Male | Female |
| Under 5 Years | 0 (0.0%) | 0 (0.0%) |
| 5 to 17 Years | 12 (16.7%) | 0 (0.0%) |
| 18 to 34 Years | 6 (5.9%) | 10 (11.4%) |
| 35 to 64 Years | 7 (7.4%) | 20 (14.0%) |
| 65 to 74 Years | 11 (26.8%) | 14 (27.5%) |
| 75 Years and over | 2 (25.0%) | 26 (74.3%) |
Disability Class by Sex by Age in Lyons
Disability Class: Hearing Difficulty
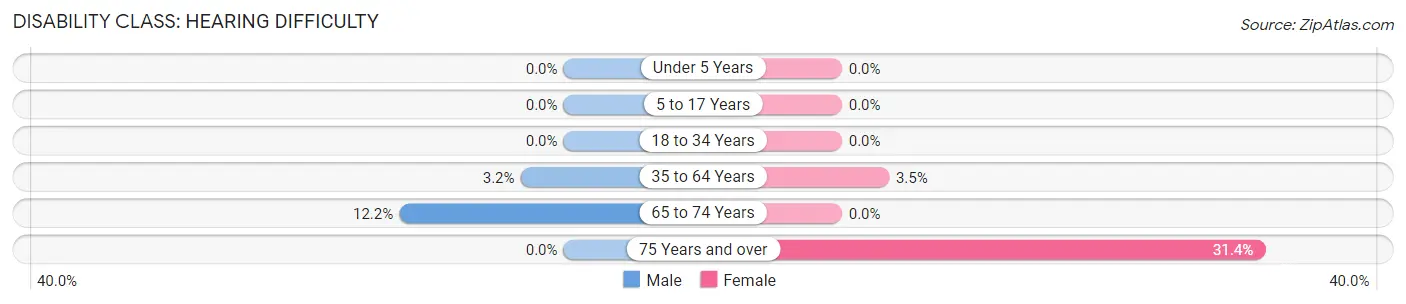
| Age Bracket | Male | Female |
| Under 5 Years | 0 (0.0%) | 0 (0.0%) |
| 5 to 17 Years | 0 (0.0%) | 0 (0.0%) |
| 18 to 34 Years | 0 (0.0%) | 0 (0.0%) |
| 35 to 64 Years | 3 (3.2%) | 5 (3.5%) |
| 65 to 74 Years | 5 (12.2%) | 0 (0.0%) |
| 75 Years and over | 0 (0.0%) | 11 (31.4%) |
Disability Class: Vision Difficulty
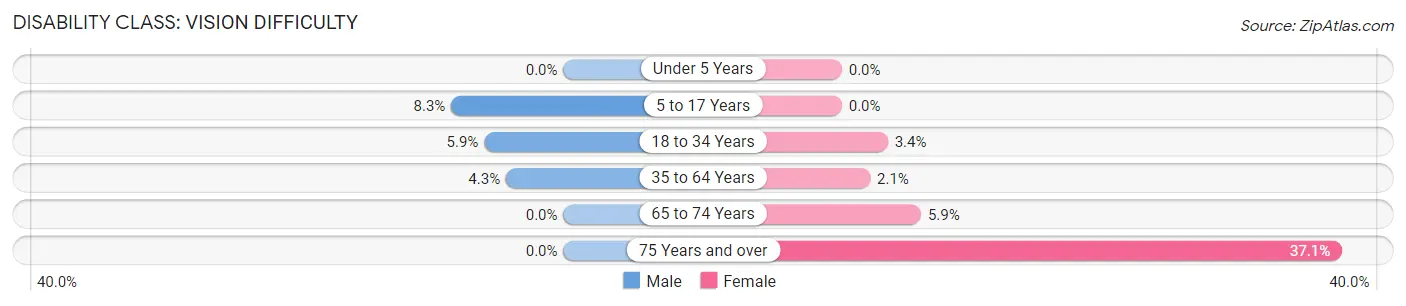
| Age Bracket | Male | Female |
| Under 5 Years | 0 (0.0%) | 0 (0.0%) |
| 5 to 17 Years | 6 (8.3%) | 0 (0.0%) |
| 18 to 34 Years | 6 (5.9%) | 3 (3.4%) |
| 35 to 64 Years | 4 (4.3%) | 3 (2.1%) |
| 65 to 74 Years | 0 (0.0%) | 3 (5.9%) |
| 75 Years and over | 0 (0.0%) | 13 (37.1%) |
Disability Class: Cognitive Difficulty
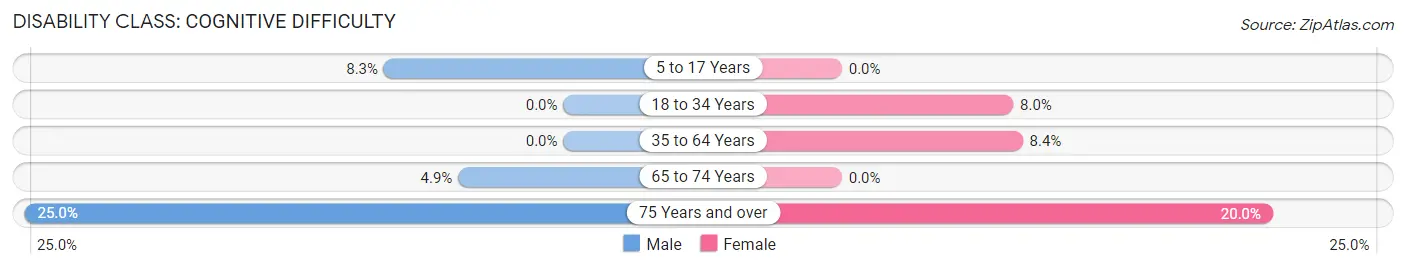
| Age Bracket | Male | Female |
| 5 to 17 Years | 6 (8.3%) | 0 (0.0%) |
| 18 to 34 Years | 0 (0.0%) | 7 (8.0%) |
| 35 to 64 Years | 0 (0.0%) | 12 (8.4%) |
| 65 to 74 Years | 2 (4.9%) | 0 (0.0%) |
| 75 Years and over | 2 (25.0%) | 7 (20.0%) |
Disability Class: Ambulatory Difficulty
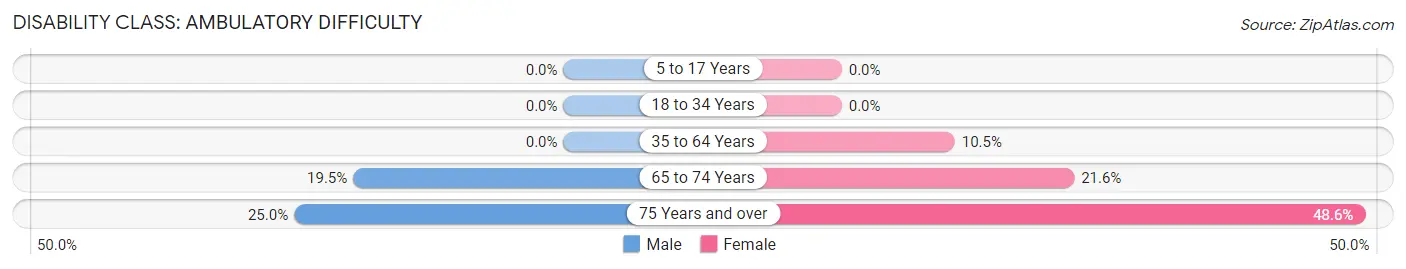
| Age Bracket | Male | Female |
| 5 to 17 Years | 0 (0.0%) | 0 (0.0%) |
| 18 to 34 Years | 0 (0.0%) | 0 (0.0%) |
| 35 to 64 Years | 0 (0.0%) | 15 (10.5%) |
| 65 to 74 Years | 8 (19.5%) | 11 (21.6%) |
| 75 Years and over | 2 (25.0%) | 17 (48.6%) |
Disability Class: Self-Care Difficulty
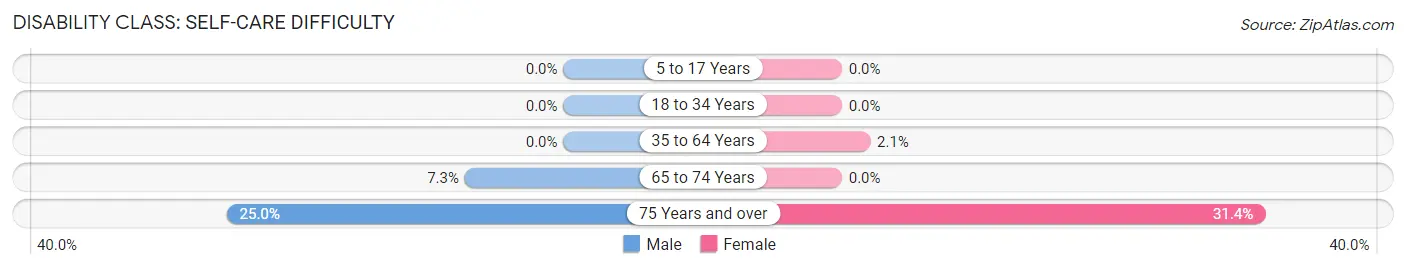
| Age Bracket | Male | Female |
| 5 to 17 Years | 0 (0.0%) | 0 (0.0%) |
| 18 to 34 Years | 0 (0.0%) | 0 (0.0%) |
| 35 to 64 Years | 0 (0.0%) | 3 (2.1%) |
| 65 to 74 Years | 3 (7.3%) | 0 (0.0%) |
| 75 Years and over | 2 (25.0%) | 11 (31.4%) |
Technology Access in Lyons
Computing Device Access in Lyons
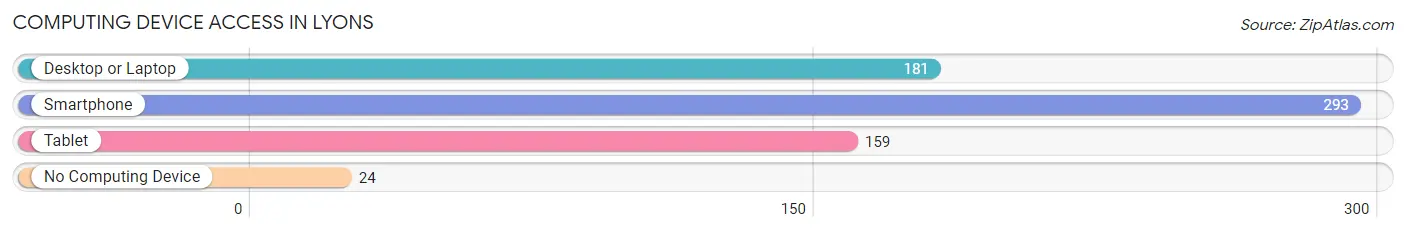
| Device Type | # Households | % Households |
| Desktop or Laptop | 181 | 52.3% |
| Smartphone | 293 | 84.7% |
| Tablet | 159 | 46.0% |
| No Computing Device | 24 | 6.9% |
| Total | 346 | 100.0% |
Internet Access in Lyons
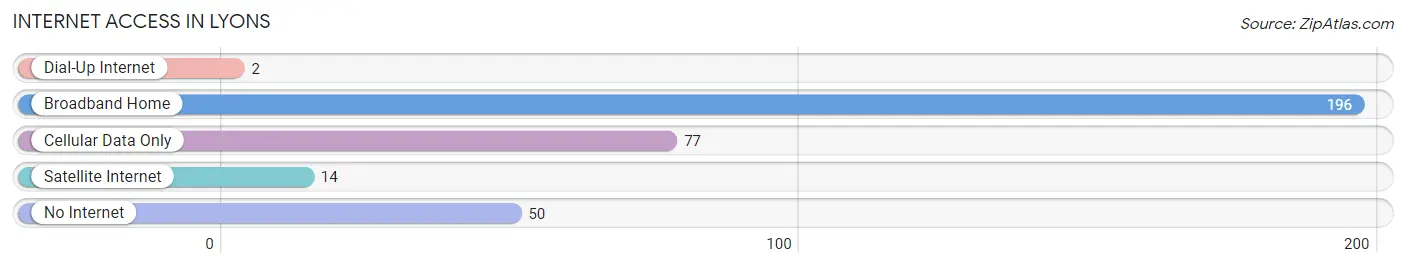
| Internet Type | # Households | % Households |
| Dial-Up Internet | 2 | 0.6% |
| Broadband Home | 196 | 56.7% |
| Cellular Data Only | 77 | 22.3% |
| Satellite Internet | 14 | 4.1% |
| No Internet | 50 | 14.4% |
| Total | 346 | 100.0% |
Lyons Summary
Lyons is a village located in the northwest corner of Ohio, in the county of Fulton. It is situated on the banks of the Maumee River, and is part of the Toledo Metropolitan Area. The village has a population of 1,845 as of the 2010 census, and is the smallest incorporated village in the state of Ohio.
History
The area that is now Lyons was first settled in 1835 by a group of German immigrants. The village was originally known as “New Bavaria”, and was later renamed to Lyons in 1837. The name was chosen in honor of the first settler, John Lyons, who had come from Bavaria.
The village was incorporated in 1854, and the first mayor was elected in 1855. The village was a major stop on the Wabash and Erie Canal, which was built in the early 1800s. The canal was a major transportation route for goods and people, and helped to spur the growth of the village.
In the late 1800s, the village was home to several factories, including a flour mill, a sawmill, and a brickyard. The village also had a railroad station, which was used to transport goods and people.
Geography
Lyons is located in the northwest corner of Ohio, in the county of Fulton. It is situated on the banks of the Maumee River, and is part of the Toledo Metropolitan Area. The village has a total area of 0.9 square miles, all of which is land.
The village is located in a flat, low-lying area, and is surrounded by farmland. The Maumee River runs through the village, and is a popular spot for fishing and boating.
Economy
The economy of Lyons is largely based on agriculture and manufacturing. The village is home to several factories, including a flour mill, a sawmill, and a brickyard. The village also has a railroad station, which is used to transport goods and people.
The village is also home to several small businesses, including restaurants, shops, and other services. The village is also home to a few small farms, which produce a variety of crops, including corn, soybeans, and wheat.
Demographics
As of the 2010 census, the village of Lyons had a population of 1,845. The population is largely white (97.2%), with a small percentage of African Americans (1.2%) and Hispanics (1.6%). The median household income is $41,250, and the median age is 40.
The village is home to several churches, including the First United Methodist Church, the St. John’s Lutheran Church, and the St. Paul’s Catholic Church. The village also has a public library, a post office, and a fire department.
Conclusion
Lyons is a small village located in the northwest corner of Ohio, in the county of Fulton. It is situated on the banks of the Maumee River, and is part of the Toledo Metropolitan Area. The village has a population of 1,845 as of the 2010 census, and is the smallest incorporated village in the state of Ohio. The economy of Lyons is largely based on agriculture and manufacturing, and the village is home to several small businesses, churches, and other services.
Common Questions
What is Per Capita Income in Lyons?
Per Capita income in Lyons is $30,333.
What is the Median Family Income in Lyons?
Median Family Income in Lyons is $63,542.
What is the Median Household income in Lyons?
Median Household Income in Lyons is $62,143.
What is Income or Wage Gap in Lyons?
Income or Wage Gap in Lyons is 52.5%.
Women in Lyons earn 47.5 cents for every dollar earned by a man.
What is Inequality or Gini Index in Lyons?
Inequality or Gini Index in Lyons is 0.41.
What is the Total Population of Lyons?
Total Population of Lyons is 785.
What is the Total Male Population of Lyons?
Total Male Population of Lyons is 355.
What is the Total Female Population of Lyons?
Total Female Population of Lyons is 430.
What is the Ratio of Males per 100 Females in Lyons?
There are 82.56 Males per 100 Females in Lyons.
What is the Ratio of Females per 100 Males in Lyons?
There are 121.13 Females per 100 Males in Lyons.
What is the Median Population Age in Lyons?
Median Population Age in Lyons is 33.0 Years.
What is the Average Family Size in Lyons
Average Family Size in Lyons is 2.8 People.
What is the Average Household Size in Lyons
Average Household Size in Lyons is 2.3 People.
How Large is the Labor Force in Lyons?
There are 400 People in the Labor Forcein in Lyons.
What is the Percentage of People in the Labor Force in Lyons?
69.0% of People are in the Labor Force in Lyons.
What is the Unemployment Rate in Lyons?
Unemployment Rate in Lyons is 2.8%.