Zip Codes with the Highest Percentage of Population Employed in Accommodation & Food Services in Ohio
RELATED REPORTS & OPTIONS
Accommodation & Food Services
Ohio
Compare Zip Codes
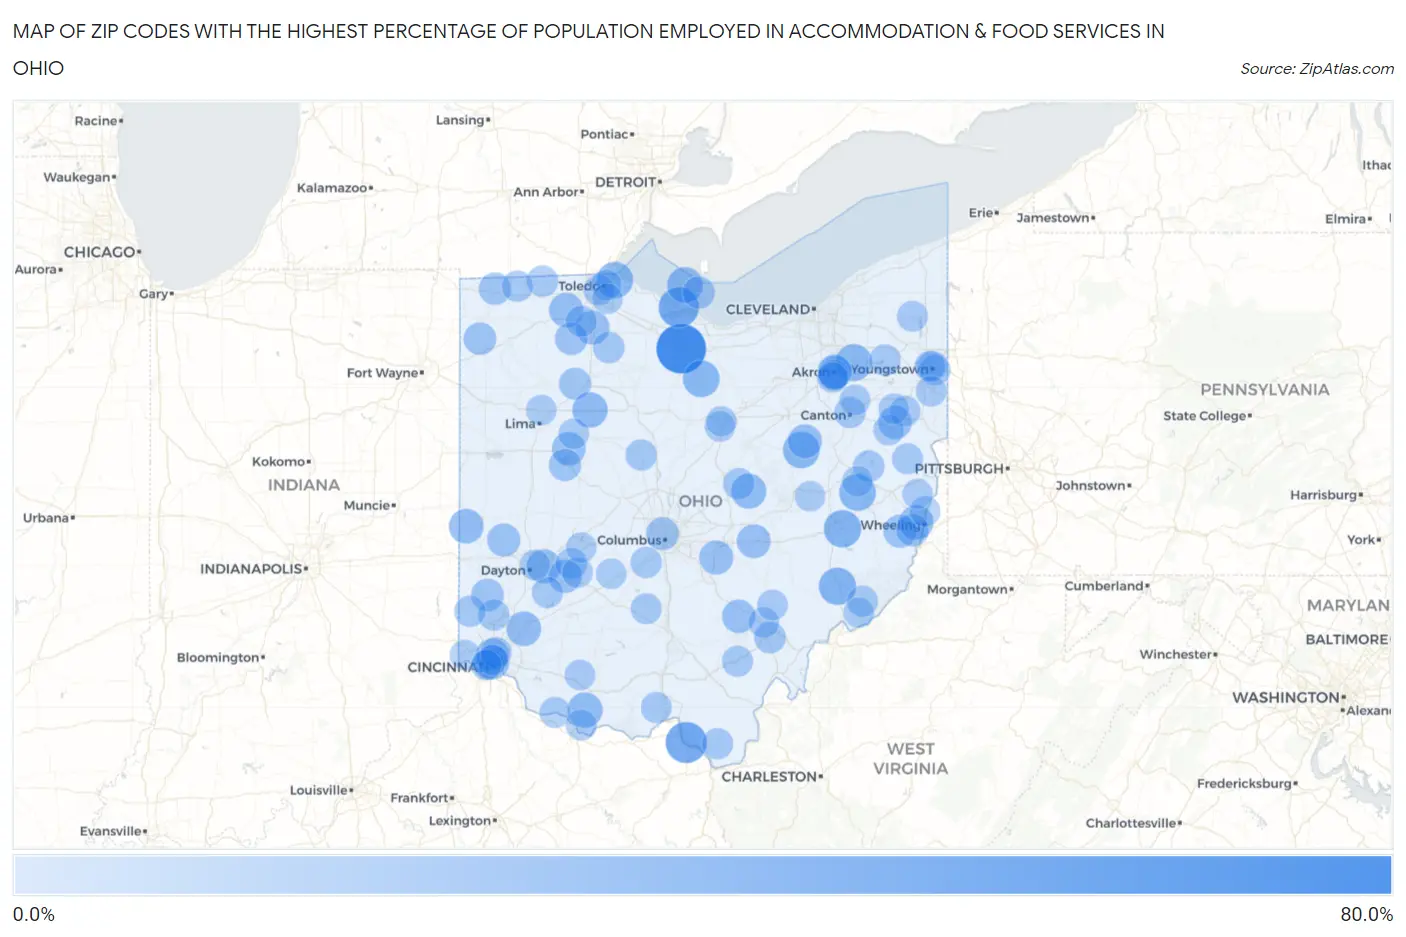
Map of Zip Codes with the Highest Percentage of Population Employed in Accommodation & Food Services in Ohio
0.0%
80.0%
Zip Codes with the Highest Percentage of Population Employed in Accommodation & Food Services in Ohio
| Zip Code | % Employed | vs State | vs National | |
| 1. | 44828 | 79.6% | 7.0%(+72.6)#1 | 6.9%(+72.7)#29 |
| 2. | 45636 | 50.0% | 7.0%(+43.0)#2 | 6.9%(+43.1)#98 |
| 3. | 43433 | 46.5% | 7.0%(+39.5)#3 | 6.9%(+39.6)#117 |
| 4. | 43768 | 36.6% | 7.0%(+29.6)#4 | 6.9%(+29.7)#200 |
| 5. | 45727 | 36.2% | 7.0%(+29.2)#5 | 6.9%(+29.3)#206 |
| 6. | 44243 | 34.4% | 7.0%(+27.4)#6 | 6.9%(+27.5)#236 |
| 7. | 44850 | 34.3% | 7.0%(+27.3)#7 | 6.9%(+27.4)#238 |
| 8. | 44699 | 34.2% | 7.0%(+27.2)#8 | 6.9%(+27.3)#242 |
| 9. | 44610 | 34.1% | 7.0%(+27.1)#9 | 6.9%(+27.2)#245 |
| 10. | 43434 | 32.8% | 7.0%(+25.8)#10 | 6.9%(+25.9)#269 |
| 11. | 43456 | 31.1% | 7.0%(+24.1)#11 | 6.9%(+24.2)#296 |
| 12. | 45897 | 29.4% | 7.0%(+22.4)#12 | 6.9%(+22.5)#347 |
| 13. | 45115 | 28.7% | 7.0%(+21.7)#13 | 6.9%(+21.8)#362 |
| 14. | 43005 | 28.4% | 7.0%(+21.4)#14 | 6.9%(+21.5)#369 |
| 15. | 45034 | 27.1% | 7.0%(+20.1)#15 | 6.9%(+20.2)#417 |
| 16. | 45352 | 27.0% | 7.0%(+20.0)#16 | 6.9%(+20.2)#422 |
| 17. | 43547 | 26.3% | 7.0%(+19.2)#17 | 6.9%(+19.4)#449 |
| 18. | 43934 | 26.2% | 7.0%(+19.2)#18 | 6.9%(+19.3)#455 |
| 19. | 44304 | 25.6% | 7.0%(+18.6)#19 | 6.9%(+18.7)#479 |
| 20. | 45435 | 25.4% | 7.0%(+18.4)#20 | 6.9%(+18.5)#487 |
| 21. | 43403 | 25.1% | 7.0%(+18.1)#21 | 6.9%(+18.2)#499 |
| 22. | 43157 | 25.0% | 7.0%(+18.0)#22 | 6.9%(+18.1)#502 |
| 23. | 44660 | 24.7% | 7.0%(+17.7)#23 | 6.9%(+17.9)#519 |
| 24. | 43740 | 24.4% | 7.0%(+17.4)#24 | 6.9%(+17.5)#534 |
| 25. | 45219 | 23.9% | 7.0%(+16.9)#25 | 6.9%(+17.0)#567 |
| 26. | 43346 | 23.7% | 7.0%(+16.7)#26 | 6.9%(+16.8)#575 |
| 27. | 44325 | 23.3% | 7.0%(+16.3)#27 | 6.9%(+16.5)#594 |
| 28. | 44625 | 23.2% | 7.0%(+16.2)#28 | 6.9%(+16.4)#601 |
| 29. | 43158 | 23.1% | 7.0%(+16.1)#29 | 6.9%(+16.2)#612 |
| 30. | 45384 | 22.9% | 7.0%(+15.8)#30 | 6.9%(+16.0)#624 |
| 31. | 45361 | 22.3% | 7.0%(+15.3)#31 | 6.9%(+15.4)#659 |
| 32. | 43967 | 22.1% | 7.0%(+15.1)#32 | 6.9%(+15.3)#671 |
| 33. | 45232 | 21.2% | 7.0%(+14.2)#33 | 6.9%(+14.3)#734 |
| 34. | 43210 | 21.0% | 7.0%(+14.0)#34 | 6.9%(+14.1)#747 |
| 35. | 45070 | 20.3% | 7.0%(+13.3)#35 | 6.9%(+13.5)#799 |
| 36. | 43541 | 20.3% | 7.0%(+13.3)#36 | 6.9%(+13.4)#804 |
| 37. | 43940 | 20.0% | 7.0%(+13.0)#37 | 6.9%(+13.1)#825 |
| 38. | 43536 | 20.0% | 7.0%(+13.0)#38 | 6.9%(+13.1)#829 |
| 39. | 43531 | 19.5% | 7.0%(+12.5)#39 | 6.9%(+12.7)#879 |
| 40. | 43438 | 19.3% | 7.0%(+12.3)#40 | 6.9%(+12.4)#911 |
| 41. | 43348 | 19.1% | 7.0%(+12.1)#41 | 6.9%(+12.3)#931 |
| 42. | 45816 | 18.2% | 7.0%(+11.2)#42 | 6.9%(+11.3)#1,060 |
| 43. | 45701 | 17.2% | 7.0%(+10.2)#43 | 6.9%(+10.3)#1,234 |
| 44. | 43467 | 16.9% | 7.0%(+9.91)#44 | 6.9%(+10.0)#1,283 |
| 45. | 45316 | 16.5% | 7.0%(+9.50)#45 | 6.9%(+9.62)#1,348 |
| 46. | 43022 | 16.1% | 7.0%(+9.13)#46 | 6.9%(+9.26)#1,419 |
| 47. | 44639 | 16.1% | 7.0%(+9.12)#47 | 6.9%(+9.25)#1,425 |
| 48. | 43322 | 15.9% | 7.0%(+8.85)#48 | 6.9%(+8.98)#1,485 |
| 49. | 44703 | 15.8% | 7.0%(+8.82)#49 | 6.9%(+8.95)#1,489 |
| 50. | 45214 | 15.8% | 7.0%(+8.79)#50 | 6.9%(+8.92)#1,494 |
| 51. | 43533 | 15.8% | 7.0%(+8.79)#51 | 6.9%(+8.92)#1,495 |
| 52. | 44285 | 15.8% | 7.0%(+8.78)#52 | 6.9%(+8.91)#1,500 |
| 53. | 43126 | 15.7% | 7.0%(+8.73)#53 | 6.9%(+8.86)#1,508 |
| 54. | 45055 | 15.7% | 7.0%(+8.72)#54 | 6.9%(+8.85)#1,511 |
| 55. | 43521 | 15.6% | 7.0%(+8.59)#55 | 6.9%(+8.71)#1,537 |
| 56. | 45056 | 15.6% | 7.0%(+8.55)#56 | 6.9%(+8.68)#1,543 |
| 57. | 45645 | 15.2% | 7.0%(+8.21)#57 | 6.9%(+8.34)#1,617 |
| 58. | 43565 | 14.9% | 7.0%(+7.92)#58 | 6.9%(+8.04)#1,688 |
| 59. | 45370 | 14.9% | 7.0%(+7.91)#59 | 6.9%(+8.03)#1,695 |
| 60. | 45652 | 14.9% | 7.0%(+7.86)#60 | 6.9%(+7.99)#1,712 |
| 61. | 45695 | 14.8% | 7.0%(+7.76)#61 | 6.9%(+7.89)#1,737 |
| 62. | 45789 | 14.7% | 7.0%(+7.70)#62 | 6.9%(+7.82)#1,758 |
| 63. | 45131 | 14.7% | 7.0%(+7.65)#63 | 6.9%(+7.77)#1,770 |
| 64. | 43908 | 14.7% | 7.0%(+7.64)#64 | 6.9%(+7.77)#1,771 |
| 65. | 43115 | 14.6% | 7.0%(+7.57)#65 | 6.9%(+7.69)#1,797 |
| 66. | 44506 | 14.5% | 7.0%(+7.51)#66 | 6.9%(+7.64)#1,813 |
| 67. | 45101 | 14.5% | 7.0%(+7.47)#67 | 6.9%(+7.59)#1,819 |
| 68. | 44450 | 14.4% | 7.0%(+7.43)#68 | 6.9%(+7.56)#1,834 |
| 69. | 44493 | 14.3% | 7.0%(+7.28)#69 | 6.9%(+7.40)#1,881 |
| 70. | 45719 | 14.2% | 7.0%(+7.16)#70 | 6.9%(+7.29)#1,911 |
| 71. | 45216 | 14.1% | 7.0%(+7.14)#71 | 6.9%(+7.27)#1,918 |
| 72. | 44311 | 14.0% | 7.0%(+7.02)#72 | 6.9%(+7.15)#1,961 |
| 73. | 44504 | 14.0% | 7.0%(+6.96)#73 | 6.9%(+7.09)#1,981 |
| 74. | 44301 | 13.7% | 7.0%(+6.70)#74 | 6.9%(+6.83)#2,050 |
| 75. | 45220 | 13.6% | 7.0%(+6.61)#75 | 6.9%(+6.73)#2,085 |
| 76. | 45314 | 13.6% | 7.0%(+6.61)#76 | 6.9%(+6.73)#2,087 |
| 77. | 44652 | 13.5% | 7.0%(+6.54)#77 | 6.9%(+6.67)#2,115 |
| 78. | 44607 | 13.5% | 7.0%(+6.50)#78 | 6.9%(+6.63)#2,135 |
| 79. | 45732 | 13.5% | 7.0%(+6.50)#79 | 6.9%(+6.63)#2,139 |
| 80. | 44510 | 13.4% | 7.0%(+6.41)#80 | 6.9%(+6.54)#2,171 |
| 81. | 44452 | 13.4% | 7.0%(+6.39)#81 | 6.9%(+6.52)#2,179 |
| 82. | 43609 | 13.4% | 7.0%(+6.36)#82 | 6.9%(+6.49)#2,191 |
| 83. | 44907 | 13.3% | 7.0%(+6.32)#83 | 6.9%(+6.45)#2,218 |
| 84. | 45155 | 13.3% | 7.0%(+6.29)#84 | 6.9%(+6.42)#2,224 |
| 85. | 43151 | 13.3% | 7.0%(+6.27)#85 | 6.9%(+6.39)#2,235 |
| 86. | 44683 | 13.3% | 7.0%(+6.26)#86 | 6.9%(+6.38)#2,241 |
| 87. | 43605 | 13.2% | 7.0%(+6.15)#87 | 6.9%(+6.28)#2,283 |
| 88. | 44665 | 13.2% | 7.0%(+6.15)#88 | 6.9%(+6.28)#2,285 |
| 89. | 45812 | 13.1% | 7.0%(+6.14)#89 | 6.9%(+6.26)#2,290 |
| 90. | 43845 | 13.1% | 7.0%(+6.09)#90 | 6.9%(+6.22)#2,304 |
| 91. | 45505 | 13.1% | 7.0%(+6.06)#91 | 6.9%(+6.19)#2,317 |
| 92. | 45820 | 13.0% | 7.0%(+5.98)#92 | 6.9%(+6.11)#2,352 |
| 93. | 45404 | 12.9% | 7.0%(+5.93)#93 | 6.9%(+6.06)#2,366 |
| 94. | 43971 | 12.9% | 7.0%(+5.86)#94 | 6.9%(+5.99)#2,401 |
| 95. | 45773 | 12.8% | 7.0%(+5.77)#95 | 6.9%(+5.90)#2,444 |
| 96. | 43465 | 12.7% | 7.0%(+5.69)#96 | 6.9%(+5.82)#2,480 |
| 97. | 45033 | 12.7% | 7.0%(+5.68)#97 | 6.9%(+5.81)#2,482 |
| 98. | 45205 | 12.6% | 7.0%(+5.61)#98 | 6.9%(+5.74)#2,519 |
| 99. | 44902 | 12.6% | 7.0%(+5.55)#99 | 6.9%(+5.68)#2,557 |
| 100. | 43948 | 12.5% | 7.0%(+5.46)#100 | 6.9%(+5.58)#2,610 |
Common Questions
What are the Top 10 Zip Codes with the Highest Percentage of Population Employed in Accommodation & Food Services in Ohio?
Top 10 Zip Codes with the Highest Percentage of Population Employed in Accommodation & Food Services in Ohio are:
What zip code has the Highest Percentage of Population Employed in Accommodation & Food Services in Ohio?
44828 has the Highest Percentage of Population Employed in Accommodation & Food Services in Ohio with 79.6%.
What is the Percentage of Population Employed in Accommodation & Food Services in the State of Ohio?
Percentage of Population Employed in Accommodation & Food Services in Ohio is 7.0%.
What is the Percentage of Population Employed in Accommodation & Food Services in the United States?
Percentage of Population Employed in Accommodation & Food Services in the United States is 6.9%.